Embed Size (px)
Citation preview

GOOD MORNING
*STORE LOYALTY BASED ON PRODUCT QUALITY, SERVICE QUALITY, PRICE PERCEPTION AND SATISFACTIONWith Reference ToPASUPARTHY’S SUPER MARKET, TIRUPATI
Under the guidance of
Mr. K. Bhaskar , MBA.
Assistant Professor
Submitted by S. Mujeebur Rahaman095P1E0064
*Introduction
*Research Methodology
*Tools of Analysis
*Findings
*Conclusions
*Content
*INTRODUCTION OF STORE LOYALTY
* Jacoby and Kyner defined it as a “behavioral response as a function of psychological process”.
*The concept of store Loyalty is originally derived from brand loyalty concept which refers to the tendency to repeat purchase the same brand. At the Store level, it refers to the tendency to repeat purchase at the same store for similar or other products.
*COMPANY PROFILE
since 1930 on words Pasuparhty's is doing business in Tirupathi. Pasuparhty's is one of the leading supermarkets located in Tirupathi, Since 1992 onwards Pasuparthy's is comforting their customers by satisfying their all types of commodity needs at one place, , by dividing their spacious place as different floors. The ground floor is with all types of food items like vegetables, bakery items ,eat out , chocolate corner , plastic items and art jewellery .The first floor is with gents and ladies ready-mades, furnishing items, disposable items, and house cleaning items. And second floor is with all types of gift items,
*Cont..
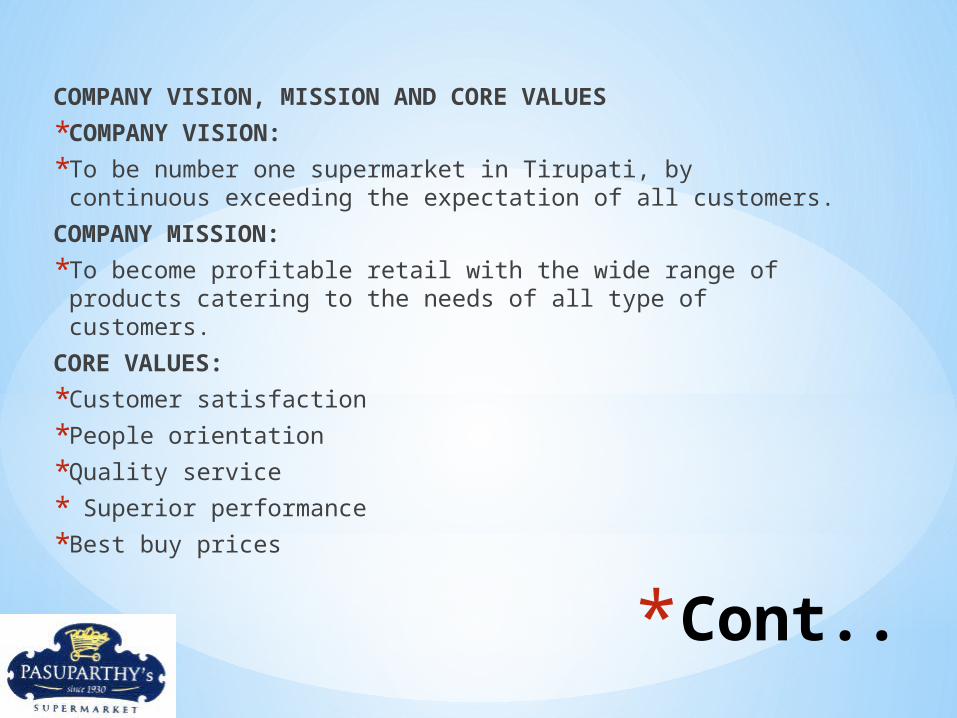
COMPANY VISION, MISSION AND CORE VALUES
*COMPANY VISION:
*To be number one supermarket in Tirupati, by continuous exceeding the expectation of all customers.
COMPANY MISSION:
*To become profitable retail with the wide range of products catering to the needs of all type of customers.
CORE VALUES:
*Customer satisfaction
*People orientation
*Quality service
* Superior performance
*Best buy prices

SWOT ANALYSIS:
STRENGTHS
*Looking good
*Products are available
WEAKNESS
*Lack of customer satisfaction programs
*Billing is slow
OPPORTUNITY
*It can open their stores in more places
*It can place new branded products in the store
THREATS
*More new super markets are opened
*Tuff competition *Cont..
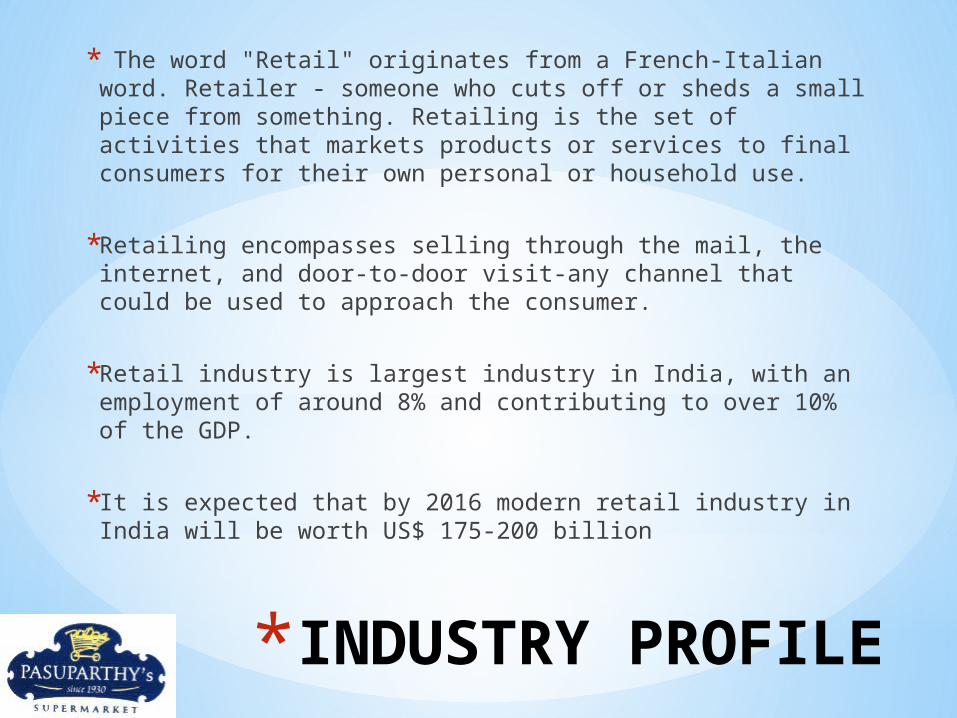
*INDUSTRY PROFILE
* The word "Retail" originates from a French-Italian word. Retailer - someone who cuts off or sheds a small piece from something. Retailing is the set of activities that markets products or services to final consumers for their own personal or household use.
*Retailing encompasses selling through the mail, the internet, and door-to-door visit-any channel that could be used to approach the consumer.
*Retail industry is largest industry in India, with an employment of around 8% and contributing to over 10% of the GDP.
*It is expected that by 2016 modern retail industry in India will be worth US$ 175-200 billion
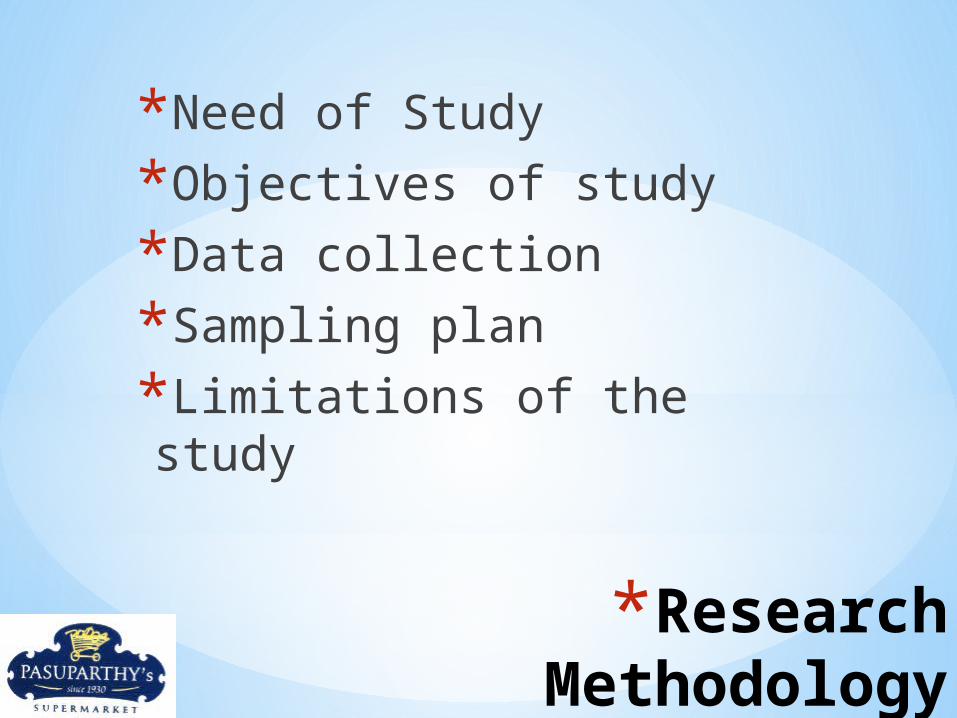
*Research Methodology
*Need of Study
*Objectives of study
*Data collection
*Sampling plan
*Limitations of the study
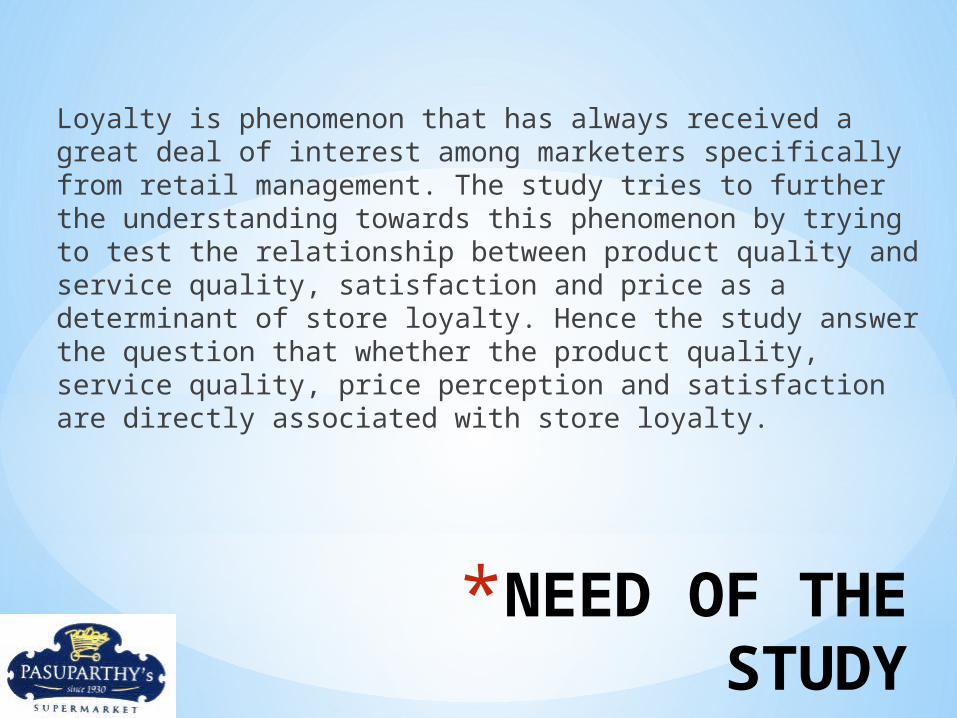
*NEED OF THE STUDY
Loyalty is phenomenon that has always received a great deal of interest among marketers specifically from retail management. The study tries to further the understanding towards this phenomenon by trying to test the relationship between product quality and service quality, satisfaction and price as a determinant of store loyalty. Hence the study answer the question that whether the product quality, service quality, price perception and satisfaction are directly associated with store loyalty.

*OBJECTIVES OF THE STUDY
*To study the correlation between product quality, service quality, price perception and satisfaction on store loyalty.
*To study the impact of product quality, service quality, price perception and satisfaction on store loyalty.
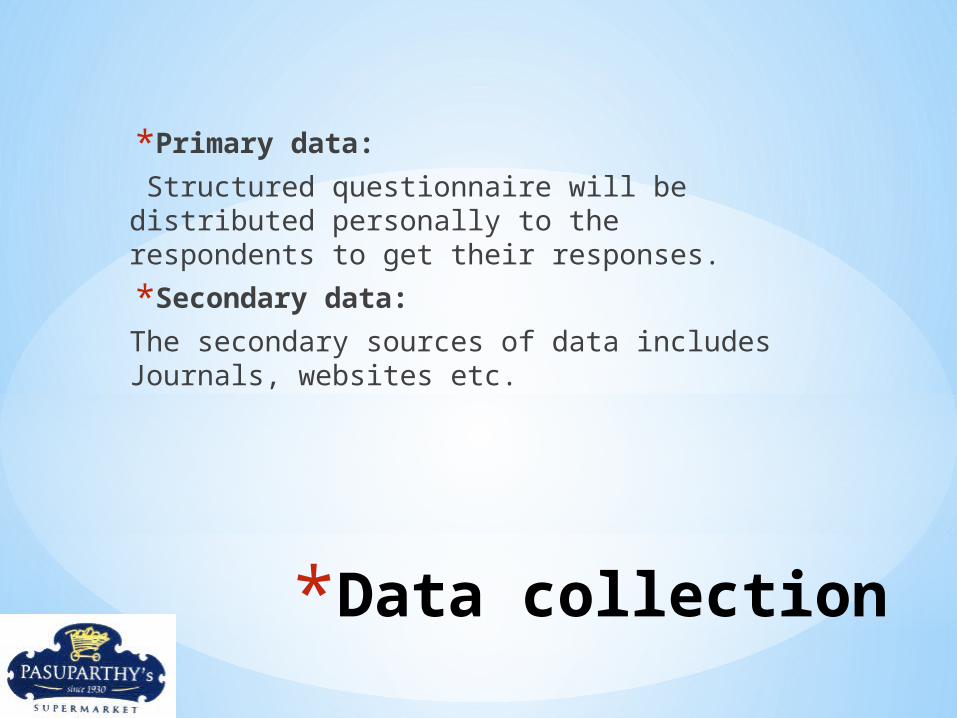
*Data collection
*Primary data:
Structured questionnaire will be distributed personally to the respondents to get their responses.
*Secondary data:
The secondary sources of data includes Journals, websites etc.

*Sampling plan:
*Sample size: Sample size consists of 126 customers.
*Sampling unit: The sampling unit includes all the customers of Pasuparthy’s products present in Tirupati.
*Sampling method: For collecting information from customers, non-probabilistic simple random sampling method is used.
*Limitations of the study
* Time limit.
*The consumer tastes, preferences and expectations change day by day and these generalizations will not be suitable in all the times.
*Respondent may not reveal the accurate information as there are differences in their attitudes, beliefs etc.,
*The sample is small, so the decision taken may not be accurate.

*TOOLS OF ANALYSIS
*Demographics
*Reliability
*Correlation
*Regression
*Demographics
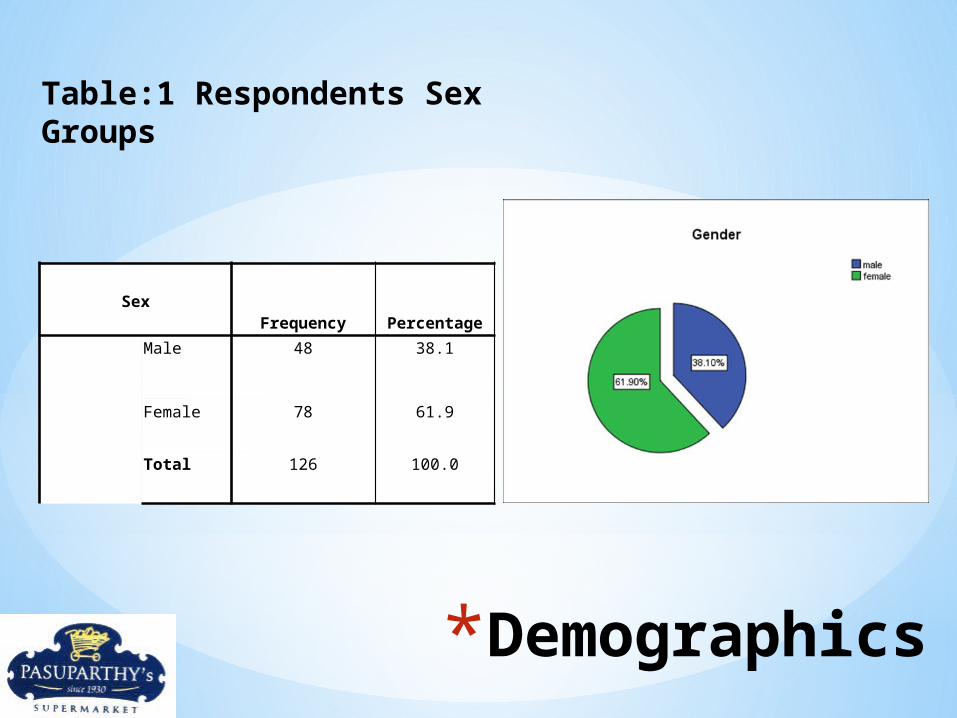
Table:1 Respondents Sex Groups
Sex
Frequency Percentage
Male 48 38.1
Female 78 61.9
Total 126 100.0
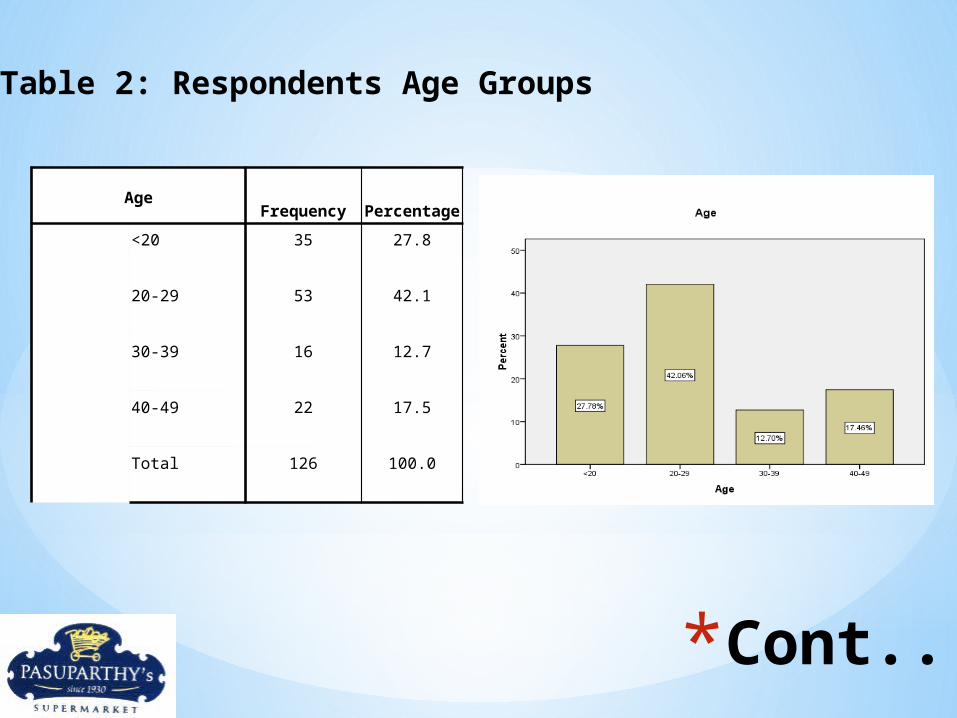
Table 2: Respondents Age Groups
*Cont..
AgeFrequency Percentage
<20 35 27.8
20-29 53 42.1
30-39 16 12.7
40-49 22 17.5
Total 126 100.0
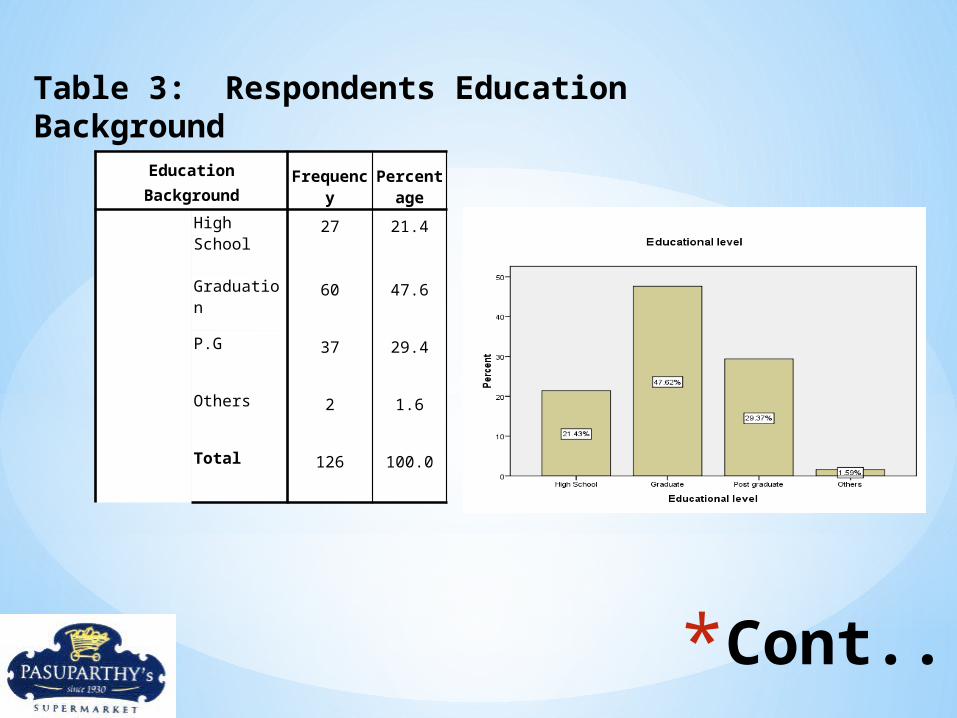
Table 3: Respondents Education Background
*Cont..
Education BackgroundFrequency
Percentage
High School 27 21.4
Graduation 60 47.6
P.G 37 29.4
Others 2 1.6
Total 126 100.0
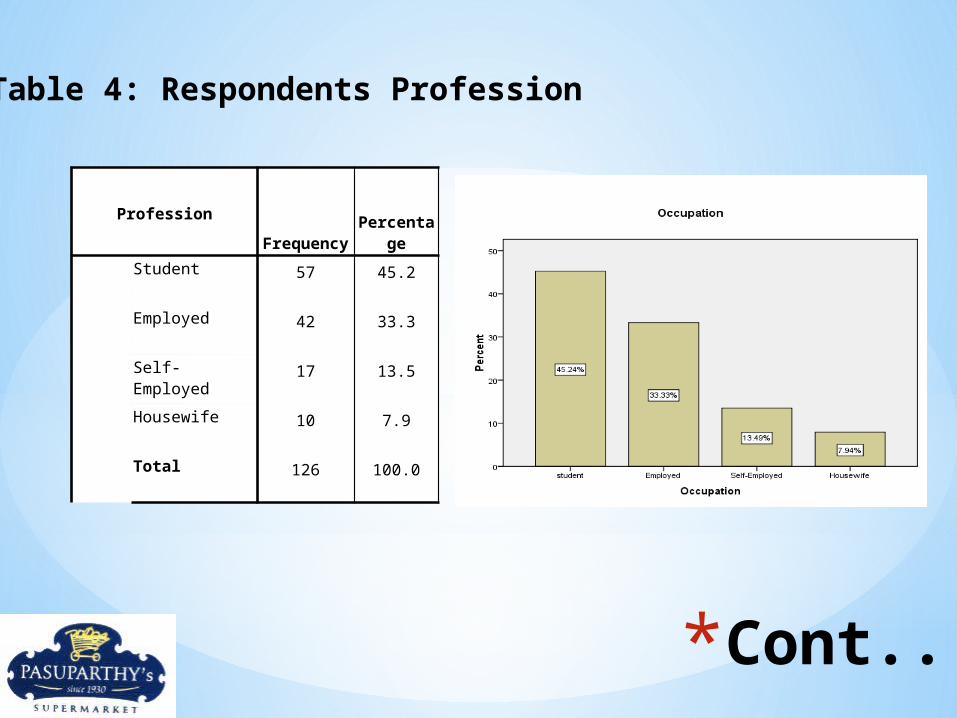
Table 4: Respondents Profession
*Cont..
Profession
Frequency Percentage
Student 57 45.2
Employed 42 33.3
Self-Employed 17 13.5
Housewife 10 7.9
Total 126 100.0
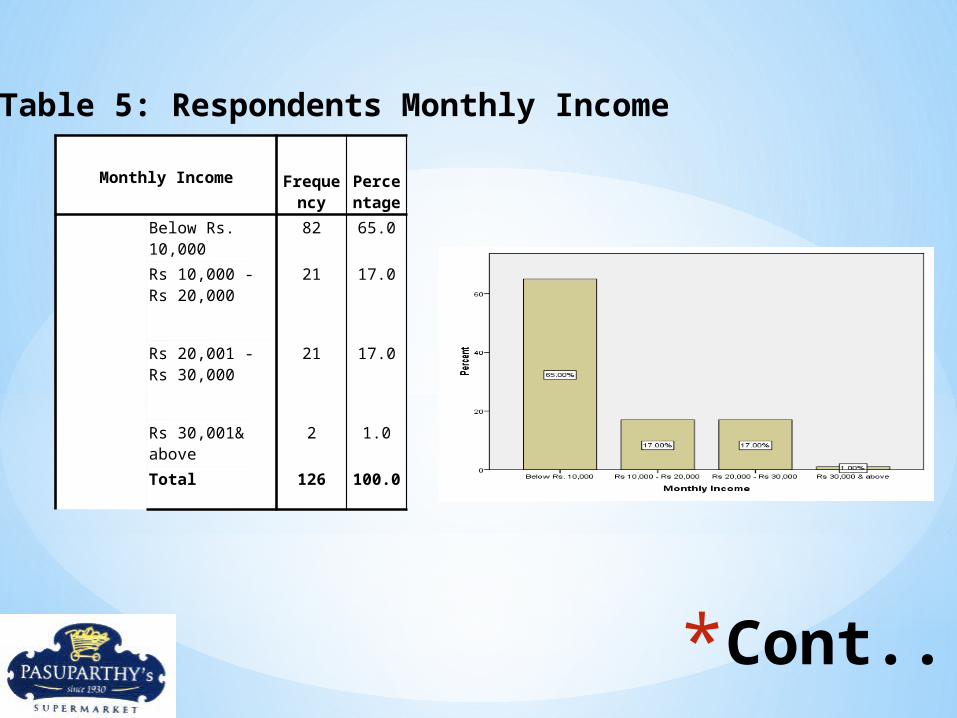
Table 5: Respondents Monthly Income
*Cont..
Monthly Income Frequency
Percentage
Below Rs. 10,000 82 65.0
Rs 10,000 - Rs 20,000
21 17.0
Rs 20,001 - Rs 30,000
21 17.0
Rs 30,001& above 2 1.0
Total 126 100.0
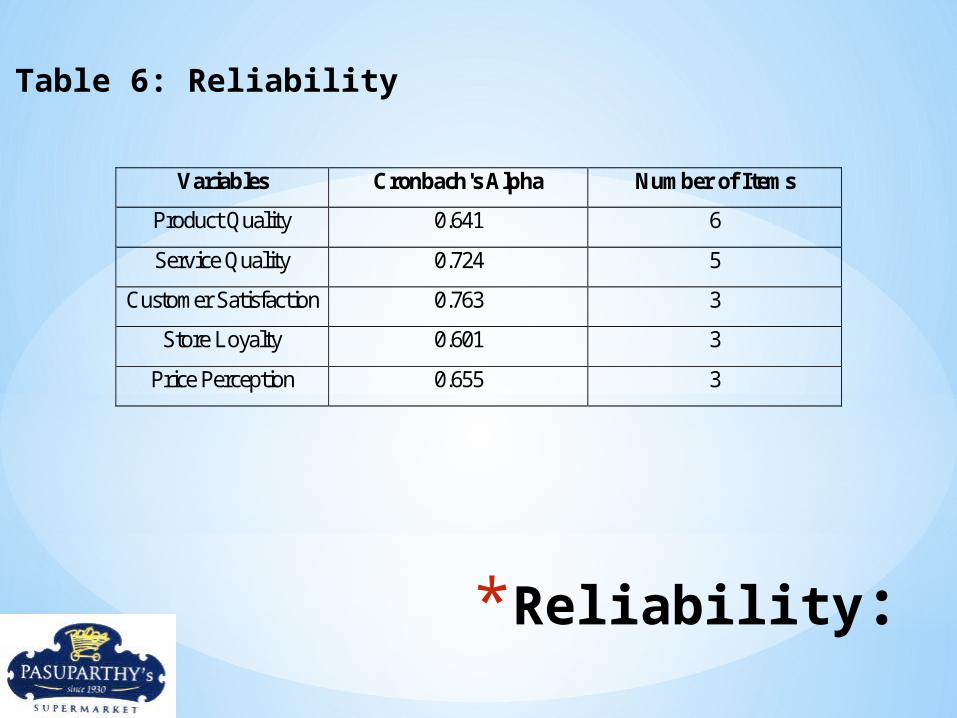
*Reliability:
Table 6: Reliability
Variables Cronbach's Alpha Number of Items
Product Quality 0.641 6
Service Quality 0.724 5
Customer Satisfaction 0.763 3
Store Loyalty 0.601 3
Price Perception 0.655 3
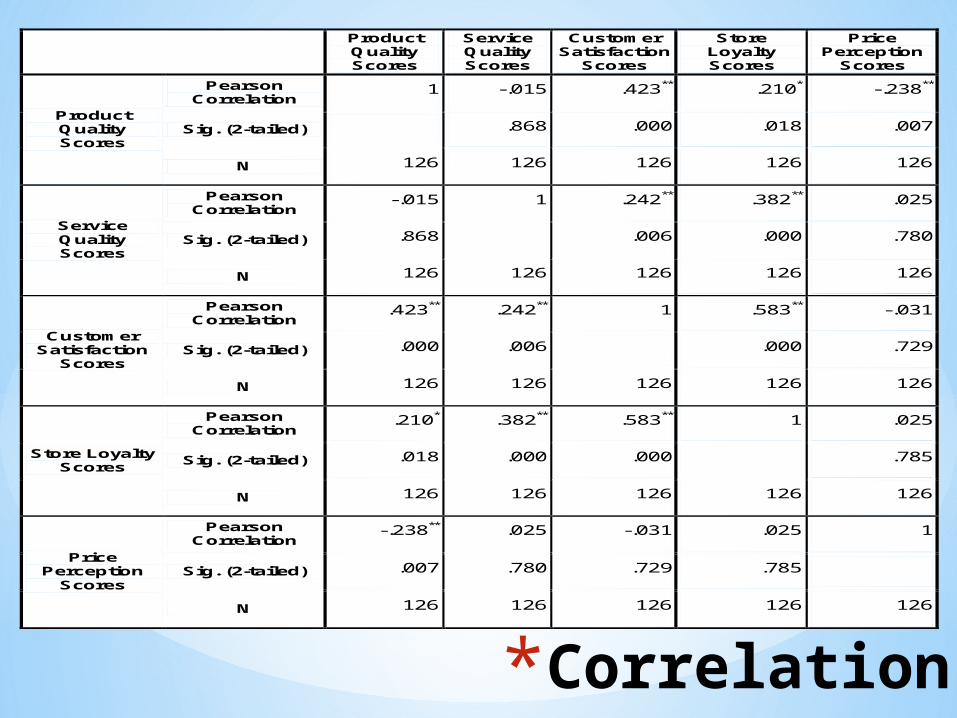
*Correlation
Product Quality Scores
Service Quality Scores
Customer Satisfaction
Scores
Store Loyalty Scores
Price Perception
Scores
Product Quality Scores
Pearson Correlation
1 -.015 .423** .210* -.238**
Sig. (2-tailed) .868 .000 .018 .007
N 126 126 126 126 126
Service Quality Scores
Pearson Correlation
-.015 1 .242** .382** .025
Sig. (2-tailed) .868 .006 .000 .780
N 126 126 126 126 126
Customer Satisfaction
Scores
Pearson Correlation
.423** .242** 1 .583** -.031
Sig. (2-tailed) .000 .006 .000 .729
N 126 126 126 126 126
Store Loyalty Scores
Pearson Correlation
.210* .382** .583** 1 .025
Sig. (2-tailed) .018 .000 .000 .785
N 126 126 126 126 126
Price Perception
Scores
Pearson Correlation
-.238** .025 -.031 .025 1
Sig. (2-tailed) .007 .780 .729 .785
N 126 126 126 126 126
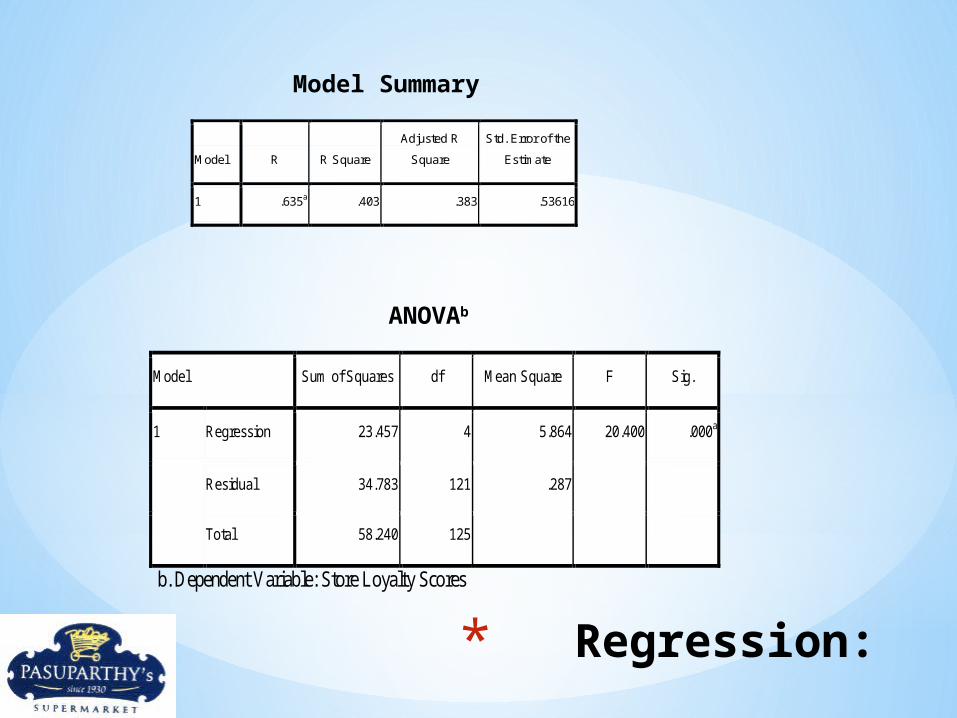
* Regression:
Model R R Square
Adjusted R
Square
Std. Error of the
Estimate
1 .635a .403 .383 .53616
ANOVAb
Model Summary
Model Sum of Squares df Mean Square F Sig.
1 Regression 23.457 4 5.864 20.400 .000a
Residual 34.783 121 .287
Total 58.240 125
b. Dependent Variable: Store Loyalty Scores
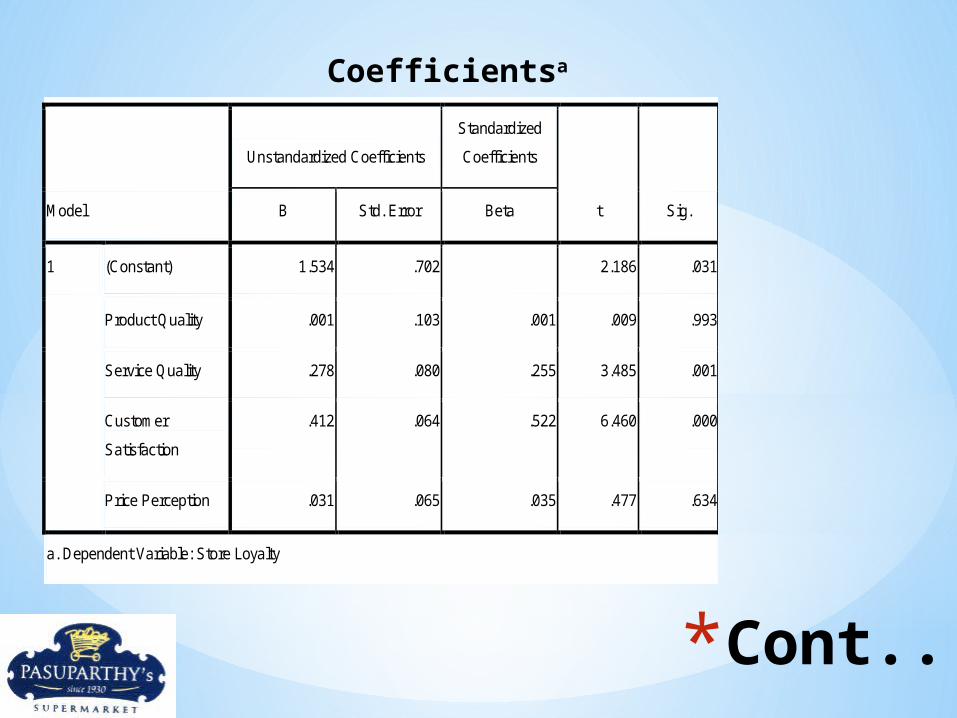
*Cont..
Model
Unstandardized Coefficients
Standardized
Coefficients
t Sig. B Std. Error Beta
1 (Constant) 1.534 .702 2.186 .031
Product Quality .001 .103 .001 .009 .993
Service Quality .278 .080 .255 3.485 .001
Customer
Satisfaction
.412 .064 .522 6.460 .000
Price Perception .031 .065 .035 .477 .634
a. Dependent Variable: Store Loyalty
Coefficientsa
*Findings and Suggestions
*Demographics
*Reliability
*Correlation
*Regression
*Suggestions
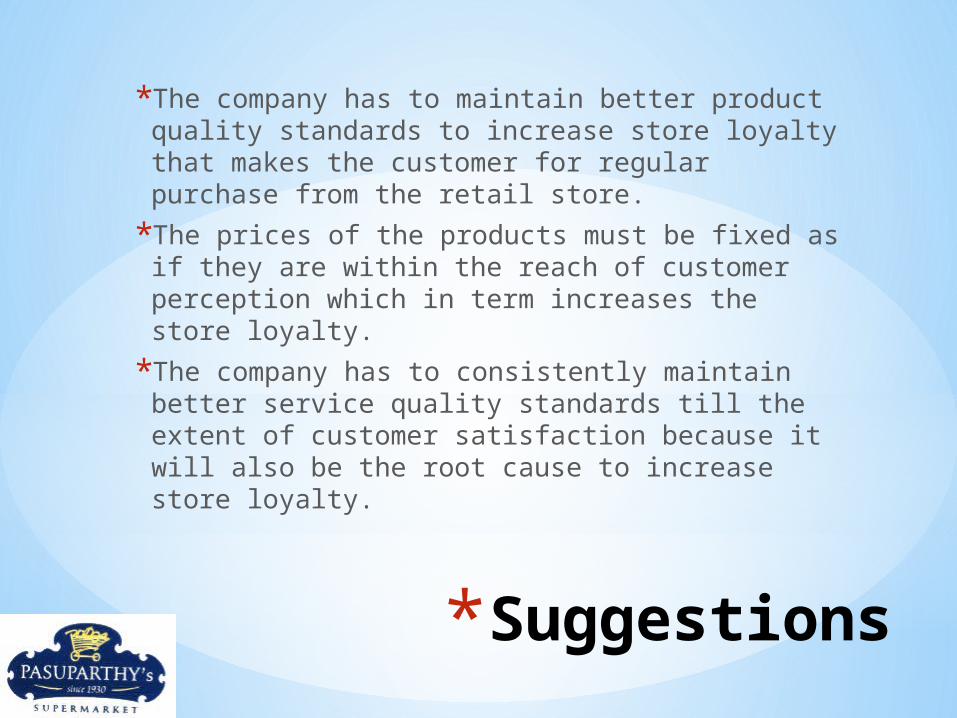
*The company has to maintain better product quality standards to increase store loyalty that makes the customer for regular purchase from the retail store.
*The prices of the products must be fixed as if they are within the reach of customer perception which in term increases the store loyalty.
*The company has to consistently maintain better service quality standards till the extent of customer satisfaction because it will also be the root cause to increase store loyalty.
*Conclusion
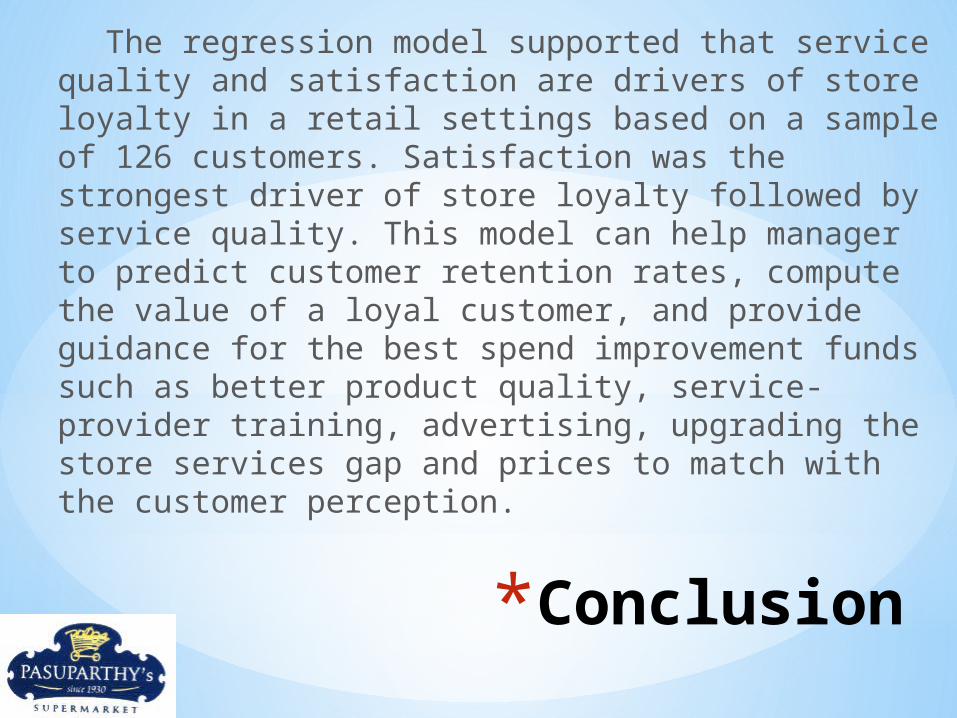
The regression model supported that service quality and satisfaction are drivers of store loyalty in a retail settings based on a sample of 126 customers. Satisfaction was the strongest driver of store loyalty followed by service quality. This model can help manager to predict customer retention rates, compute the value of a loyal customer, and provide guidance for the best spend improvement funds such as better product quality, service-provider training, advertising, upgrading the store services gap and prices to match with the customer perception.
THAN Q
![[XLS] · Web viewSheet1 MCA ALIAH UNIVERSITY SAMIMUR RAHAMAN MONDAL PMS_09-10_017 HAFIZUR RAHAMAN](https://img.pdfslide.us/doc/110x75/5ab5d5227f8b9a156d8d4ae8/xls-viewsheet1-mca-aliah-university-samimur-rahaman-mondal-pms09-10017-hafizur.jpg)