Embed Size (px)
Citation preview
Under pressure? NHS maternity services in England
IFS Briefing Note BN215
Elaine KellyTom Lee

Under pressure? NHS maternity services in England
Elaine Kelly and Tom Lee Copy-edited by Judith Payne
Published by
The Institute for Fiscal Studies
ISBN 978-1-911102-63-2
September 2017
This research was funded by the ESRC Centre for Microeconomic Analysis of Public Policy (CPP) at IFS. Elaine Kelly would like to thank the ESRC for funding through a Future Leaders grant (ES/K009060/1). The authors thank NHS Digital for access to the Hospital Episode Statistics under data sharing agreement CON-205762-B8S7B. They also thank Samantha Burn, Marta Cardoso Lopes, Charles Nourse and Matteo Rava for excellent research assistance, and Rowena Crawford, Carl Emmerson, Paul Johnson and Carol Propper for helpful comments. Correspondence to [email protected].

2 © Institute for Fiscal Studies
Executive summary This briefing note discusses the causes and consequences of pressures on NHS maternity services in England.
Key findings
The number of maternity cases has stabilised since 2010 but the case mix has changed.
The number of women giving birth has remained stable since 2010, after rapid increases in the 2000s. However, the trend towards older mothers with more complex health conditions has continued. This has implications for maternity units, as these mothers are on average more costly to care for.
The changing case mix explains all of the rise in the number of C-sections in England between 2006 and 2014.
The number of C-sections performed by NHS hospitals in England each year increased by 23,000 between 2006 and 2014. We estimate that all of this growth can be explained by the changing case mix of mothers giving birth. There is no evidence of a change in medical practice leading to more C-sections.
Maternity units also face pressure from daily fluctuations in maternity admissions, and may have to close temporarily as a last resort.
Daily maternity admissions to hospital fluctuate but the numbers of beds and on-duty staff are largely fixed. Maternity units may respond by calling in staff, delaying planned admissions or reducing length of stay. As a last resort, units may temporarily close. Such closures take place on fewer than 1 day in 200.
Temporary closures are more common on days with high admissions, but variation in closure rates by day of the week and month suggest that it is difficult or costly to staff certain shifts.
Maternity units are more likely to close when there are a higher number of admissions. However, closures are also more likely between Thursday and Saturday, when admissions are no higher than during the rest of the week. Closures also happen more frequently during holiday periods over the summer and at Christmas, suggesting a role for the availability of staff. How the cost of preventing such closures, in terms of increasing capacity or staffing levels, compares with the benefits to women of doing so is unclear, given the data available.
© Institute for Fiscal Studies 3
Acute Trusts with higher numbers of maternity unit closures also more frequently breach the four-hour waiting-time target in A&E.
There is almost no overlap between maternity and A&E patients, but Acute Trusts where maternity units close more often also breach the four-hour A&E waiting-time target with greater frequency. A&E patients in Acute Trusts that close more than 10 times in a year are 30% more likely to wait more than four hours than patients in Acute Trusts that do not close. This is the equivalent of an additional 2–3 patients in every 100 waiting more than four hours for treatment in A&E.
Acute Trusts with the highest number of maternity unit closures serve larger local populations.
Acute Trusts with maternity units that close more than 10 times per year have the largest average local populations measured according to the number of people for whom that is the nearest Acute Trust.
Maternity unit closures are not associated with poorer-quality care at Acute Trust level.
There is no evidence that Trusts that close, or close more often, have worse overall clinical quality across the Acute Trust. Indeed, the Standardised Hospital Mortality Indicator suggests that more maternity unit closures are associated with lower-than-expected death rates across all departments.
4 © Institute for Fiscal Studies
1. Introduction Admission to hospital to give birth is the single largest cause of admission to NHS hospitals in England. In common with many NHS services, providers of maternity care are reporting pressures from increased demand, staffing shortages and programmes to improve the quality of care.1 How units respond to these challenges carries important implications for the health of mothers and babies, and the finances of NHS Acute Trusts.
The National Maternity Review of 2016, ‘Better Births’,2 set out a five-year vision for improving the quality of maternity care, providing women and their babies with safer and more personalised care. However, the review also noted difficulties faced in recruiting and retaining staff, and in capacity, with many units running at full occupancy much of the time. Understanding the pressures and challenges faced by maternity services is therefore vital if the ‘Better Births’ vision is to be achieved.
In Section 2 of this briefing note, we review the evidence on the long-run pressures faced by maternity units (MUs) from changes in the number of maternity admissions and the case mix. While the number of maternity cases has remained largely constant since 2010, the case mix continues to change, with women giving birth later in life and with more complex health conditions. There are implications for MUs if this evolving case mix of mothers requires more care in terms of staffing or other resources.
In addition to long-run pressures, MUs also face pressure from daily variations in admissions to MUs and (presumably unexpected) peaks in demand. In Section 3, we focus on one potential consequence: whether the MU decides to close temporarily for new admissions to ensure the safety of mothers and babies currently on the unit. Volumes of temporary closures and their distribution across hospitals have been published elsewhere.3 We provide evidence on what may cause these closures, and what action may be needed to avoid the need for closures, as well as addressing wider pressures on MUs.
We show, as expected, that closures are related to the volume of admissions, both on the day of closure and on the day before closure. However, patterns of closure by day of the week and by month highlight that some of the factors that cause closures are predictable and extend beyond the inevitability of occasionally busy days. Closures are more likely on a Thursday, Friday and Saturday, but spikes in admissions are spread evenly across the week. Closures are also more likely to occur in the summer months and in December, the principal holiday periods.
1 See, for example:
NHS England, Better Births – Improving Outcomes of Maternity Services in England: A Five Year Forward View for Maternity Care, 2016, https://www.england.nhs.uk/wp-content/uploads/2016/02/national-maternity-review-report.pdf; Royal College of Obstetricians and Gynaecologists, ‘Each Baby Counts: 2015 summary report’, 2017, https://www.rcog.org.uk/globalassets/documents/guidelines/research--audit/each-baby-counts-2015-summary-report-june-2017.pdf; Royal College of Midwives, The Gathering Storm: England’s Midwifery Workforce Challenges, 2017, https://www.rcm.org.uk/sites/default/files/The%20gathering%20storm%20-%20Englands%20midwifery%20workforce%20challenges%20A5%2020pp_3.pdf.
2 NHS England, Better Births – Improving Outcomes of Maternity Services in England: A Five Year Forward View for Maternity Care, 2016, https://www.england.nhs.uk/wp-content/uploads/2016/02/national-maternity-review-report.pdf.
3 See, for example, https://www.rcm.org.uk/tags/maternity-unit-closures.
© Institute for Fiscal Studies 5
Given that the number of beds is fixed across the week, the most likely explanation for variation in closures by day of the week and by month is the availability of staff. However, using the data available, it is not possible to say whether these patterns are attributable to difficulty in filling planned rosters, as many staff balance other caring commitments, or to ineffective planning and management. It is therefore hard to propose actions that could be taken to eliminate the day-of-the-week or seasonal effects, to estimate how much those actions would cost and to assess whether the cost would be justified given the potential benefits to women.
Finally, we show that hospitals that close more often are also more likely to breach their four-hour waiting-time targets, suggesting that the pressures felt by Acute Trusts extend beyond the maternity unit.
6 © Institute for Fiscal Studies
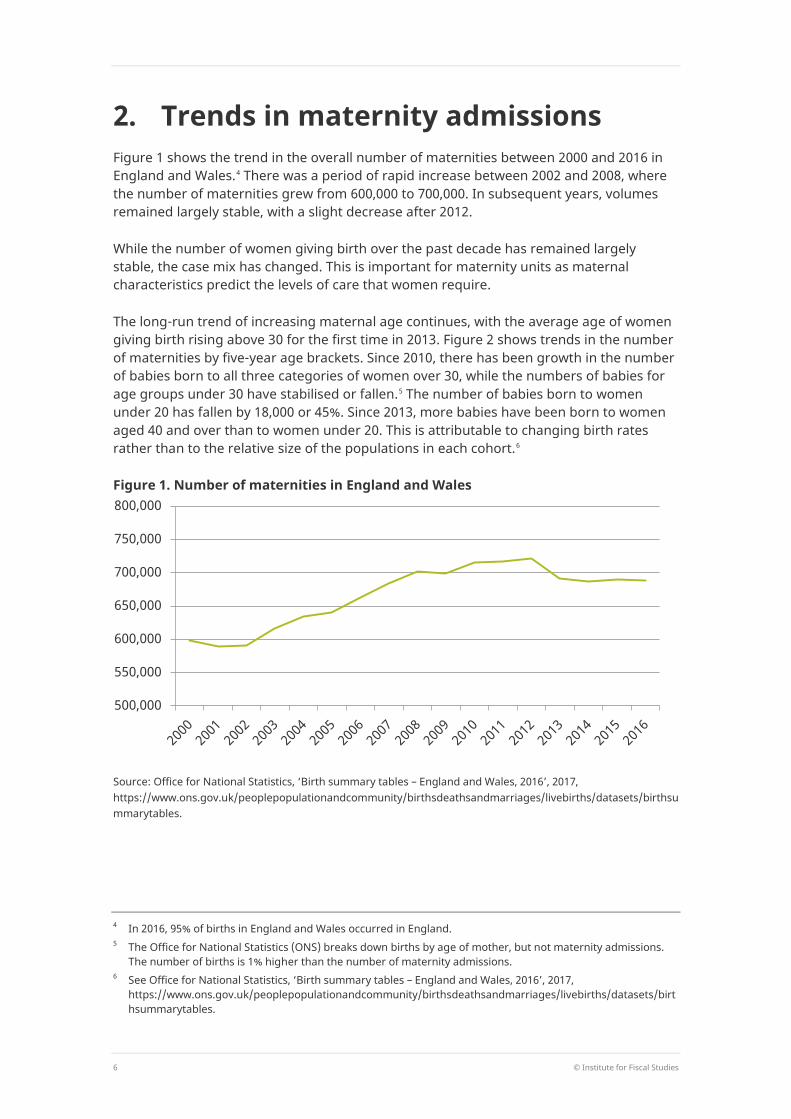
2. Trends in maternity admissions Figure 1 shows the trend in the overall number of maternities between 2000 and 2016 in England and Wales.4 There was a period of rapid increase between 2002 and 2008, where the number of maternities grew from 600,000 to 700,000. In subsequent years, volumes remained largely stable, with a slight decrease after 2012.
While the number of women giving birth over the past decade has remained largely stable, the case mix has changed. This is important for maternity units as maternal characteristics predict the levels of care that women require.
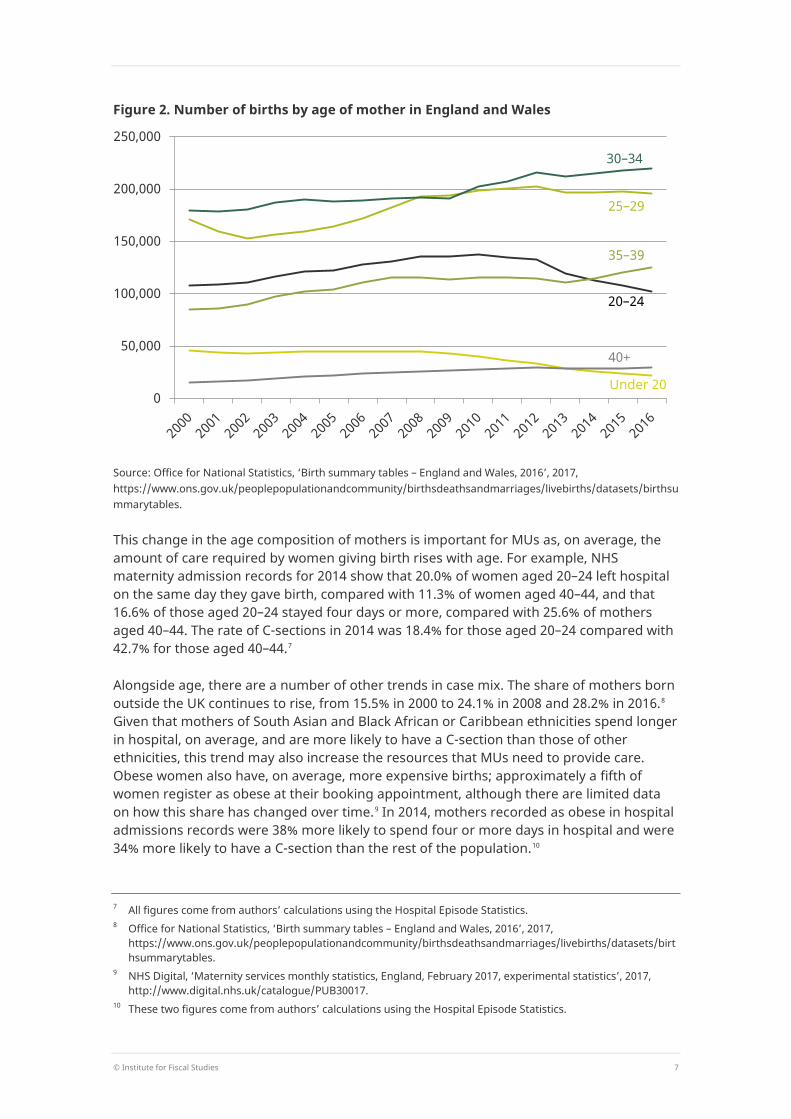
The long-run trend of increasing maternal age continues, with the average age of women giving birth rising above 30 for the first time in 2013. Figure 2 shows trends in the number of maternities by five-year age brackets. Since 2010, there has been growth in the number of babies born to all three categories of women over 30, while the numbers of babies for age groups under 30 have stabilised or fallen.5 The number of babies born to women under 20 has fallen by 18,000 or 45%. Since 2013, more babies have been born to women aged 40 and over than to women under 20. This is attributable to changing birth rates rather than to the relative size of the populations in each cohort.6
Figure 1. Number of maternities in England and Wales
Source: Office for National Statistics, ‘Birth summary tables – England and Wales, 2016’, 2017, https://www.ons.gov.uk/peoplepopulationandcommunity/birthsdeathsandmarriages/livebirths/datasets/birthsummarytables.
4 In 2016, 95% of births in England and Wales occurred in England. 5 The Office for National Statistics (ONS) breaks down births by age of mother, but not maternity admissions.
The number of births is 1% higher than the number of maternity admissions. 6 See Office for National Statistics, ‘Birth summary tables – England and Wales, 2016’, 2017,
https://www.ons.gov.uk/peoplepopulationandcommunity/birthsdeathsandmarriages/livebirths/datasets/birthsummarytables.
500,000
550,000
600,000
650,000
700,000
750,000
800,000
© Institute for Fiscal Studies 7
Figure 2. Number of births by age of mother in England and Wales
Source: Office for National Statistics, ‘Birth summary tables – England and Wales, 2016’, 2017, https://www.ons.gov.uk/peoplepopulationandcommunity/birthsdeathsandmarriages/livebirths/datasets/birthsummarytables.
This change in the age composition of mothers is important for MUs as, on average, the amount of care required by women giving birth rises with age. For example, NHS maternity admission records for 2014 show that 20.0% of women aged 20–24 left hospital on the same day they gave birth, compared with 11.3% of women aged 40–44, and that 16.6% of those aged 20–24 stayed four days or more, compared with 25.6% of mothers aged 40–44. The rate of C-sections in 2014 was 18.4% for those aged 20–24 compared with 42.7% for those aged 40–44.7
Alongside age, there are a number of other trends in case mix. The share of mothers born outside the UK continues to rise, from 15.5% in 2000 to 24.1% in 2008 and 28.2% in 2016.8 Given that mothers of South Asian and Black African or Caribbean ethnicities spend longer in hospital, on average, and are more likely to have a C-section than those of other ethnicities, this trend may also increase the resources that MUs need to provide care. Obese women also have, on average, more expensive births; approximately a fifth of women register as obese at their booking appointment, although there are limited data on how this share has changed over time.9 In 2014, mothers recorded as obese in hospital admissions records were 38% more likely to spend four or more days in hospital and were 34% more likely to have a C-section than the rest of the population.10
7 All figures come from authors’ calculations using the Hospital Episode Statistics. 8 Office for National Statistics, ‘Birth summary tables – England and Wales, 2016’, 2017,
https://www.ons.gov.uk/peoplepopulationandcommunity/birthsdeathsandmarriages/livebirths/datasets/birthsummarytables.
9 NHS Digital, ‘Maternity services monthly statistics, England, February 2017, experimental statistics’, 2017, http://www.digital.nhs.uk/catalogue/PUB30017.
10 These two figures come from authors’ calculations using the Hospital Episode Statistics.
0
50,000
100,000
150,000
200,000
250,000
Under 20
40+
35–39
20–24
30–34
25–29
8 © Institute for Fiscal Studies
How much does the changing case mix explain changes in MU activity?
Understanding how trends in the case mix of mothers affect the services and levels of care that MUs need to provide is vital for long-term capacity and workforce planning. However, assessing the impact of the changing case mix on MUs is not straightforward.
The activity observed in MUs, in terms of C-sections, instrumental deliveries, length of stay and so on, is a function of two factors. The first is the case mix of women who are admitted to hospital to give birth and the second is how MUs treat those women when they are admitted. While the case mix has changed, so have care guidelines, such as through the Royal College of Gynaecologists and Obstetricians (RCOG)’s ‘Each Baby Counts’ initiative.11
To isolate the impact of the changing case mix on MU activity, we fix the care that women would expect to receive based on how mothers with the same characteristic were treated in 2006. To do so, we first estimate the probability of a particular outcome, such as a C-section, in 2006 based on a set of pre-labour characteristics that MUs cannot change during labour.12 These include age, ethnicity, parity (whether it is a first or subsequent birth), multiple pregnancy, pre-term onset of labour, non-cephalic presentation, hypertension, pre-eclampsia, placenta praevia, diabetes, heart conditions, obesity and the timing of the first antenatal (or ‘booking’) appointment.
We next use the estimates from the model to predict how women from 2007 to 2014 would have been treated had they been cared for in the same way as women with the same characteristics in 2006. Where changes in care provided by MUs are entirely attributable to the changing case mix, the predicted levels of outcomes should track the actual rates. Differences between predicted and actual levels of care reflect changes in the care that is provided to women.
Figure 3 shows the actual and predicted number of C-sections between 2006 and 2014. We aggregate elective and emergency C-sections, as elective C-sections are in part a choice taken by the mother and the health-care provider. Over the period, there was an increase of 23,000 in the annual number of C-sections. The increase is closely tracked by the rise in the number of predicted C-sections throughout the period. This suggests that the increase in the number of C-sections is entirely explained by the changing case mix.
Figure 4 shows the actual and predicted number of women who stay in hospital for four days or more.13 Here, the number of women who have longer stays in hospital has fallen slightly since 2006. This contrasts to the predicted number of women expected to stay four days or more, which increased by almost 20,000 per year between 2006 and 2012, before falling thereafter. In 2014, the difference between the predicted and actual number of long stays was 20,000. This suggests that changes in the way women are cared for, which have reduced length of stay, have offset changes in the case mix. Whether this fall in
11 Royal College of Obstetricians and Gynaecologists, ‘Each Baby Counts: 2015 summary report’, 2017,
https://www.rcog.org.uk/globalassets/documents/guidelines/research--audit/each-baby-counts-2015-summary-report-june-2017.pdf.
12 Or in the case of conditions such as pre-eclampsia, the condition can be treated but the onset cannot be prevented by care received during labour.
13 This includes women who stay in hospital when their baby remains in hospital for care, and they are not discharged even though they are not receiving care.

© Institute for Fiscal Studies 9
length of stay is related to constraints on maternity unit resources or changes in clinical practice for other reasons cannot be ascertained from the data.
Overall, the data show that in recent years, the number of maternity admissions has not increased, but there is evidence that the case mix is more complex. This has implications for the care that MUs must provide for women. In some circumstances, and in some
Figure 3. Actual and predicted number of C-sections in England
Note: C-sections include both elective and emergency procedures. The probability of having a C-section is predicted using the probability of having a C-section in 2006 as a function of age, ethnicity, parity (first or subsequent birth), multiple pregnancy, pre-term onset of labour, non-cephalic presentation, hypertension, pre-eclampsia, placenta praevia, diabetes, heart conditions, obesity and the timing of the first antenatal (or ‘booking’) appointment. C-sections are measured using OPCS operation codes R17 and R18.
Source: Authors’ calculations using the Hospital Episode Statistics, 2006–14.
Figure 4. Actual and predicted number of women with a maternity stay of four days or more
Note: Authors’ calculations using the Hospital Episode Statistics, 2006–14. Probability of staying four days or more is predicted using the probability of staying four days or more in 2006 as a function of age, ethnicity, parity (first or subsequent birth), multiple pregnancy, pre-term onset of labour, non-cephalic presentation, hypertension, pre-eclampsia, placenta praevia, diabetes, heart conditions, obesity and the timing of the first antenatal (or ‘booking’) appointment. Length of stay is measured using SPELDUR in HES.
Source: Authors’ calculations using the Hospital Episode Statistics, 2006–14.
140,000
150,000
160,000
170,000
180,000
2006 2007 2008 2009 2010 2011 2012 2013 2014
Predicted Actual
100,000
110,000
120,000
130,000
140,000
150,000
2006 2007 2008 2009 2010 2011 2012 2013 2014
Predicted Actual
10 © Institute for Fiscal Studies
aspects of care, MUs have been able to adjust the care they provide to compensate for increased pressure generated by a more resource-intensive case mix. The extent to which these adjustments represent an increase in efficiency or a reduction in the quality of care received by women cannot be measured accurately using the data available.14 Equally, it is hard to assess whether MUs could continue to make resource-saving adjustments to care if the current trends in case mix persist. The growth in the number of C-sections over the past decade suggests that there may be a limit to adjustments that can be made while ensuring the safety of mothers and babies. For much of the period, the structure of payments received by MUs provided an incentive not to carry out unnecessary C-sections, yet the number of C-sections continued to rise.
At present, we are limited in our ability to understand the changes in MU activity by the quality of the data. Until recently, the only data available were through the Hospital Episode Statistics. These data contain information on the delivery, any underlying health conditions and basic demographics. However, mothers and babies cannot be linked, many fields have significant problems with missing data, and important information about the background of the mother and her care during labour is not collected.15 Many of these data limitations should be addressed by the Maternity Services Data Set (MSDS), which began receiving submissions in June 2015. For example, the MSDS will record information about maternal smoking, employment and BMI in early pregnancy, and the timing of the stages of labour. Information on babies will include newborn screenings and first feed status.16 However, as collection of these data is very recent, it may be a while before it is possible to analyse trends over time.
14 For example, women who are discharged early may require increased care from GPs or health visitors, but
information on hospital admissions over the past decade has not been routinely linked to GP records, and all data on the usage of health visitors are scant.
15 NHS Digital, ‘Hospital maternity activity, 2015–16’, 2016, http://www.digital.nhs.uk/catalogue/PUB22384. 16 For a full data dictionary, see
http://www.datadictionary.nhs.uk/data_dictionary/messages/clinical_data_sets/data_sets/maternity_services_data_set/maternity_services_data_set_fr.asp?shownav=1.

© Institute for Fiscal Studies 11
3. Daily fluctuations in demand and maternity unit closures
In addition to long-run pressure from changes in the birth rate and the case mix of mothers, maternity units also face pressure from daily fluctuations in demand. Most women will give birth between 38 and 41 weeks pregnant, so MUs have fairly accurate information on the number of women who are likely to give birth in a given month. However, the number of women who arrive at the unit on a given day is highly uncertain. This is the nature of maternity care in all health systems. However, it is probable that accommodating these fluctuations would be harder if units were more often close to capacity.
Figure 5 shows the daily number of admissions in one large MU in England over one 180-day period.17 Maternities can be separated into those where the onset of labour is spontaneous and those that are planned; the figure shows all births and spontaneous births separately. Where the onset of labour is spontaneous, the MU has very limited control over the admission date. For planned onsets, through elective C-section and planned induction, MUs have some limited discretion over when mothers are admitted.
When MUs face an unexpected spike in demand, there are a number of options available. More midwives and doctors can be called in (until the point at which the availability of beds becomes a constraint). Planned admissions can be delayed, so that women wait to
Figure 5. Maternity admissions per day in one large maternity unit in England, over a six-month period
Source: Hospital Episode Statistics, daily maternity admissions in one large MU, in a randomly chosen 180-day period. MU will include an obstetric unit and an alongside midwife-led unit on the same site.
17 Dates and hospital are suppressed to prevent the release of potentially disclosive information.
0
5
10
15
20
25
30
35
40
1 21 41 61 81 101 121 141 161
Adm
issi
ons
Day
All admissions Spontaneous admissions
12 © Institute for Fiscal Studies
be induced or to have an elective C-section. Women’s length of stay can be reduced, either by speeding up labour or by reducing the length of the postnatal stay.
Where these measures fail to bring the staff- or bed-to-women ratio up to an acceptable level, or where doing so would compromise women’s safety, a unit may temporarily close. This means that women who arrive in labour are turned away. These closures usually operate for several hours, but can last several days.
Closures are not necessarily bad for women, given the resource constraints that MUs face on the day of closure. It may be safer for the affected women to travel elsewhere or wait at home until the unit reopens. Indeed, not closing when the unit is under pressure may be a worse outcome for women, if they receive poor-quality care from an overstretched MU. However, closures do demonstrate and document instances where MUs were under sufficient pressure to close their doors.
We issued Freedom of Information (FOI) requests on the dates and length of, and reasons for, temporary closures of MUs in April 2016. These requests covered all Acute Trusts offering maternity services in late 2015. The requests covered three types of unit: obstetric units (OUs), or labour wards that have doctor and consultant cover; alongside midwife-led units (AMUs), which operate on the same site as OUs but are run by midwives; and freestanding midwife-led units (FMUs), which are run by midwives but on a different site from OUs and AMUs. We focus on the closure of OUs and AMUs, as FMUs care for a relatively small number of women and admissions are often not well captured in hospital admissions data. We use the term MU to cover the maternity department, or the combination of OUs and AMUs. This is because hospital admissions data do not distinguish between units within the same hospital on the same site.
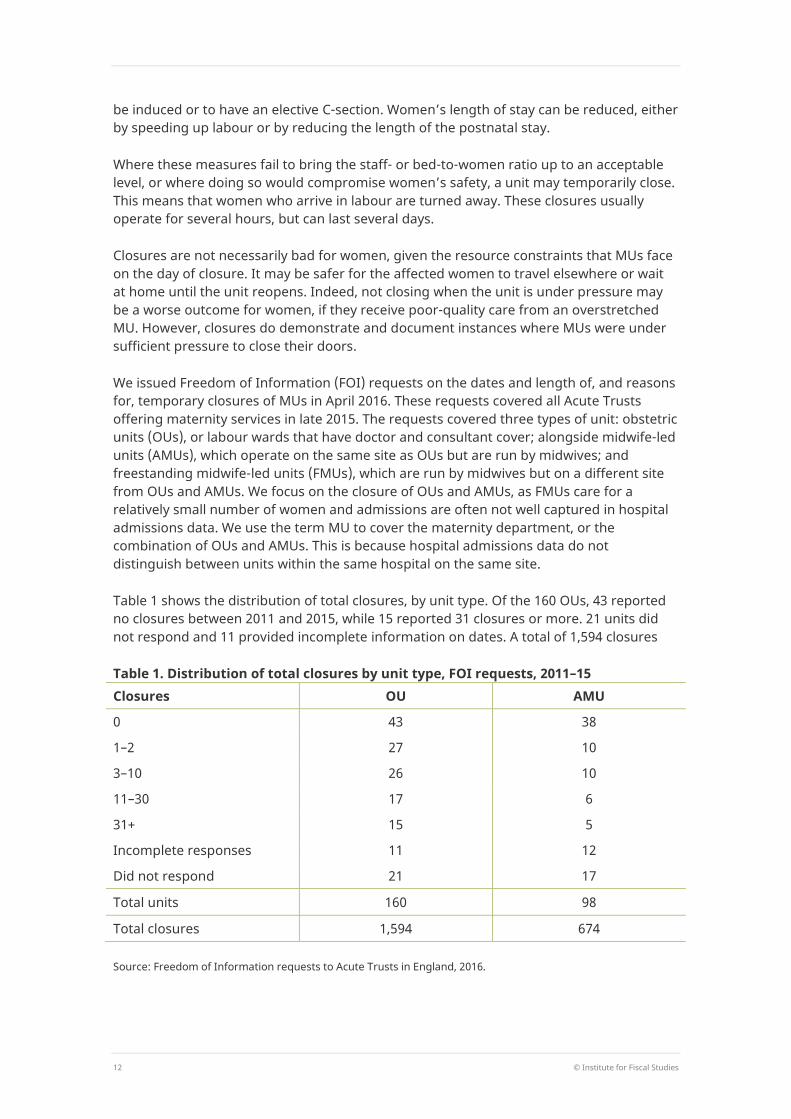
Table 1 shows the distribution of total closures, by unit type. Of the 160 OUs, 43 reported no closures between 2011 and 2015, while 15 reported 31 closures or more. 21 units did not respond and 11 provided incomplete information on dates. A total of 1,594 closures
Table 1. Distribution of total closures by unit type, FOI requests, 2011–15 Closures OU AMU
0 43 38
1–2 27 10
3–10 26 10
11–30 17 6
31+ 15 5
Incomplete responses 11 12
Did not respond 21 17
Total units 160 98
Total closures 1,594 674
Source: Freedom of Information requests to Acute Trusts in England, 2016.
© Institute for Fiscal Studies 13
were reported in all. Of the 98 AMUs, 38 reported no closures, while 5 reported 31 or more. A total of 674 AMU closures were reported, but one-third of those were accounted for by one unit.
In a separate FOI request to NHS England, we obtained information on short-term closures for 2014 and 2015. Our data obtained from Trusts are regarded as more complete, but the NHS England FOI data do provide information on the length of closures. These data have a mean length of 16 hours and a median length of 8 hours.18
Closures and maternity admissions
In our FOI requests to Trusts, the most common reasons that MUs gave for closing were the availability of staff or beds and a more general lack of capacity. Validating and quantifying these reasons is, however, difficult using the data available. In particular, while data on the (annual) number of beds are available (and the number of beds can be assumed to be largely fixed over the year), information on staffing is not available at the day level. Monthly staffing levels are available, but will not capture shortages on particular days, and are recorded as full-time equivalents so do not account for absences through sickness or annual leave. Furthermore, defining a required staff- or bed-to-admissions ratio at any given point in time is problematic, as this will vary with the case mix of women within the MU.
To examine the relationship between the number of admissions in each unit and the likelihood of closures, we order the daily data for each MU within each year by the ratio of spontaneous admissions to beds. We use spontaneous admissions to order days as MUs can adjust the date of planned admissions. A day is given the value 1 if that day has the lowest ratio of spontaneous admissions to beds in that year and that MU. The busiest day will take the value 365 (or, in 2012, 366). We then divide the year into six 61-day categories.
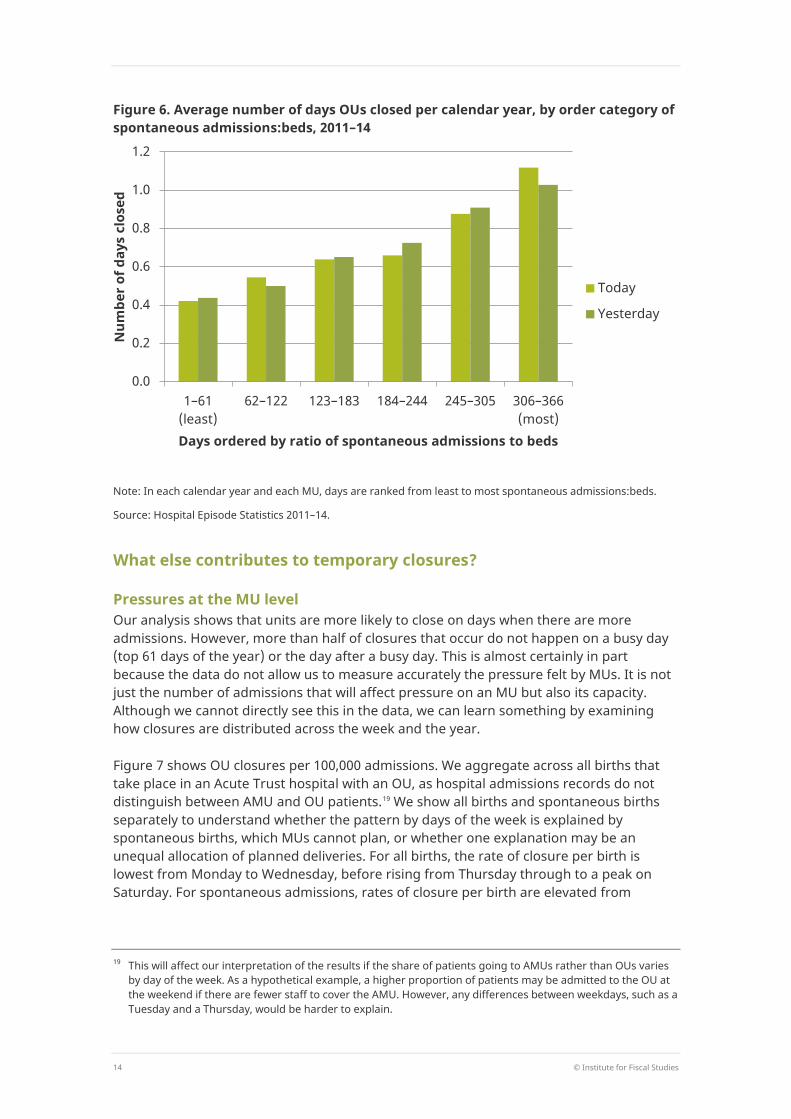
Figure 6 presents the average number of days that OUs close in each year by the six admission categories. We consider the relationship between the admission category on both the day of closure and the day before closure. The figure shows a strong relationship between closures and admissions. There are 2.6 times more closures during the 61 busiest days of the year than during the least busy 61 days. Similarly, there are 2.3 times more closures when the previous day was in the 61 busiest days of the year than when the previous day was in the least busy category. It should, however, be noted that closing will mechanically reduce the number of admissions, so Figure 6 will not reflect the number of women seeking admission on a particular day. It is important to note that some level of closures related to levels of admissions is probably inevitable, given daily fluctuations in demand, unless the NHS is prepared to operate with excess capacity for much of the time.
One surprising feature of Figure 6 is that closures still occur on days when MUs have relatively few admissions. One possibility is that there are few admissions because the unit has been closed. However, it is important to investigate whether closures have other causes that could be addressed. We now consider whether there is evidence that MUs face other pressures, both at the MU and Acute Trust level.
18 In other words, if we were to line all closures up from the shortest to the longest, the closure in the middle
lasted 8 hours. This is half the length of the mean, which is skewed by closures that last several days. The 25th percentile of closure time is 4½ hours and the 75th percentile is 12 hours.
14 © Institute for Fiscal Studies
Figure 6. Average number of days OUs closed per calendar year, by order category of spontaneous admissions:beds, 2011–14
Note: In each calendar year and each MU, days are ranked from least to most spontaneous admissions:beds.
Source: Hospital Episode Statistics 2011–14.
What else contributes to temporary closures?
Pressures at the MU level Our analysis shows that units are more likely to close on days when there are more admissions. However, more than half of closures that occur do not happen on a busy day (top 61 days of the year) or the day after a busy day. This is almost certainly in part because the data do not allow us to measure accurately the pressure felt by MUs. It is not just the number of admissions that will affect pressure on an MU but also its capacity. Although we cannot directly see this in the data, we can learn something by examining how closures are distributed across the week and the year.
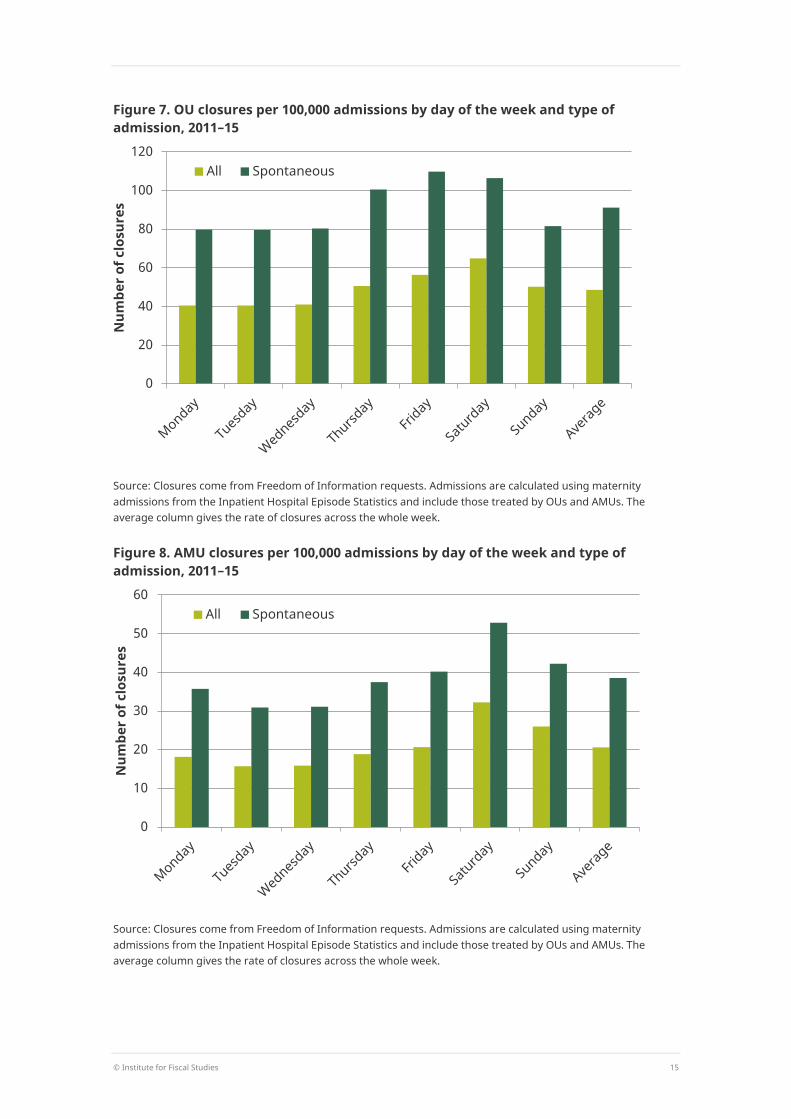
Figure 7 shows OU closures per 100,000 admissions. We aggregate across all births that take place in an Acute Trust hospital with an OU, as hospital admissions records do not distinguish between AMU and OU patients.19 We show all births and spontaneous births separately to understand whether the pattern by days of the week is explained by spontaneous births, which MUs cannot plan, or whether one explanation may be an unequal allocation of planned deliveries. For all births, the rate of closure per birth is lowest from Monday to Wednesday, before rising from Thursday through to a peak on Saturday. For spontaneous admissions, rates of closure per birth are elevated from
19 This will affect our interpretation of the results if the share of patients going to AMUs rather than OUs varies
by day of the week. As a hypothetical example, a higher proportion of patients may be admitted to the OU at the weekend if there are fewer staff to cover the AMU. However, any differences between weekdays, such as a Tuesday and a Thursday, would be harder to explain.
0.0
0.2
0.4
0.6
0.8
1.0
1.2
1–61 (least)
62–122 123–183 184–244 245–305 306–366 (most)
Num
ber o
f day
s cl
osed
Days ordered by ratio of spontaneous admissions to beds
Today
Yesterday
© Institute for Fiscal Studies 15
Figure 7. OU closures per 100,000 admissions by day of the week and type of admission, 2011–15
Source: Closures come from Freedom of Information requests. Admissions are calculated using maternity admissions from the Inpatient Hospital Episode Statistics and include those treated by OUs and AMUs. The average column gives the rate of closures across the whole week.
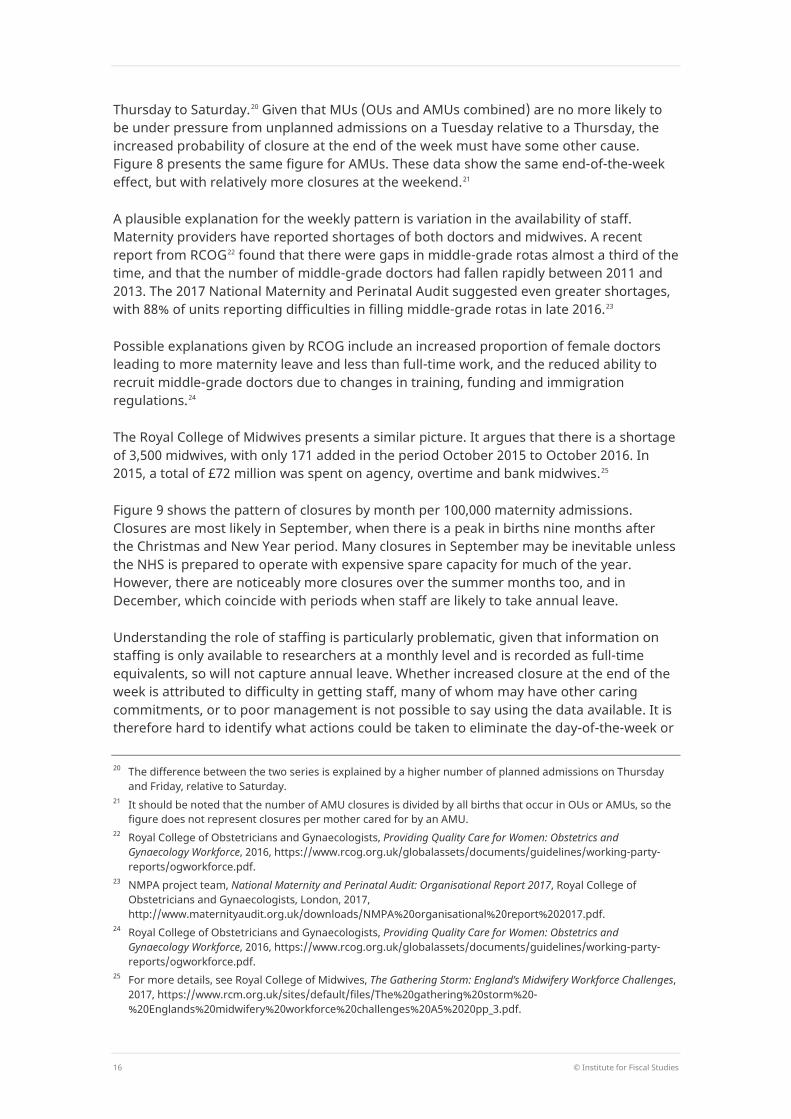
Figure 8. AMU closures per 100,000 admissions by day of the week and type of admission, 2011–15
Source: Closures come from Freedom of Information requests. Admissions are calculated using maternity admissions from the Inpatient Hospital Episode Statistics and include those treated by OUs and AMUs. The average column gives the rate of closures across the whole week.
0
20
40
60
80
100
120
Num
ber o
f clo
sure
s
All Spontaneous
0
10
20
30
40
50
60
Num
ber o
f clo
sure
s
All Spontaneous
16 © Institute for Fiscal Studies
Thursday to Saturday.20 Given that MUs (OUs and AMUs combined) are no more likely to be under pressure from unplanned admissions on a Tuesday relative to a Thursday, the increased probability of closure at the end of the week must have some other cause. Figure 8 presents the same figure for AMUs. These data show the same end-of-the-week effect, but with relatively more closures at the weekend.21
A plausible explanation for the weekly pattern is variation in the availability of staff. Maternity providers have reported shortages of both doctors and midwives. A recent report from RCOG22 found that there were gaps in middle-grade rotas almost a third of the time, and that the number of middle-grade doctors had fallen rapidly between 2011 and 2013. The 2017 National Maternity and Perinatal Audit suggested even greater shortages, with 88% of units reporting difficulties in filling middle-grade rotas in late 2016.23
Possible explanations given by RCOG include an increased proportion of female doctors leading to more maternity leave and less than full-time work, and the reduced ability to recruit middle-grade doctors due to changes in training, funding and immigration regulations.24
The Royal College of Midwives presents a similar picture. It argues that there is a shortage of 3,500 midwives, with only 171 added in the period October 2015 to October 2016. In 2015, a total of £72 million was spent on agency, overtime and bank midwives.25
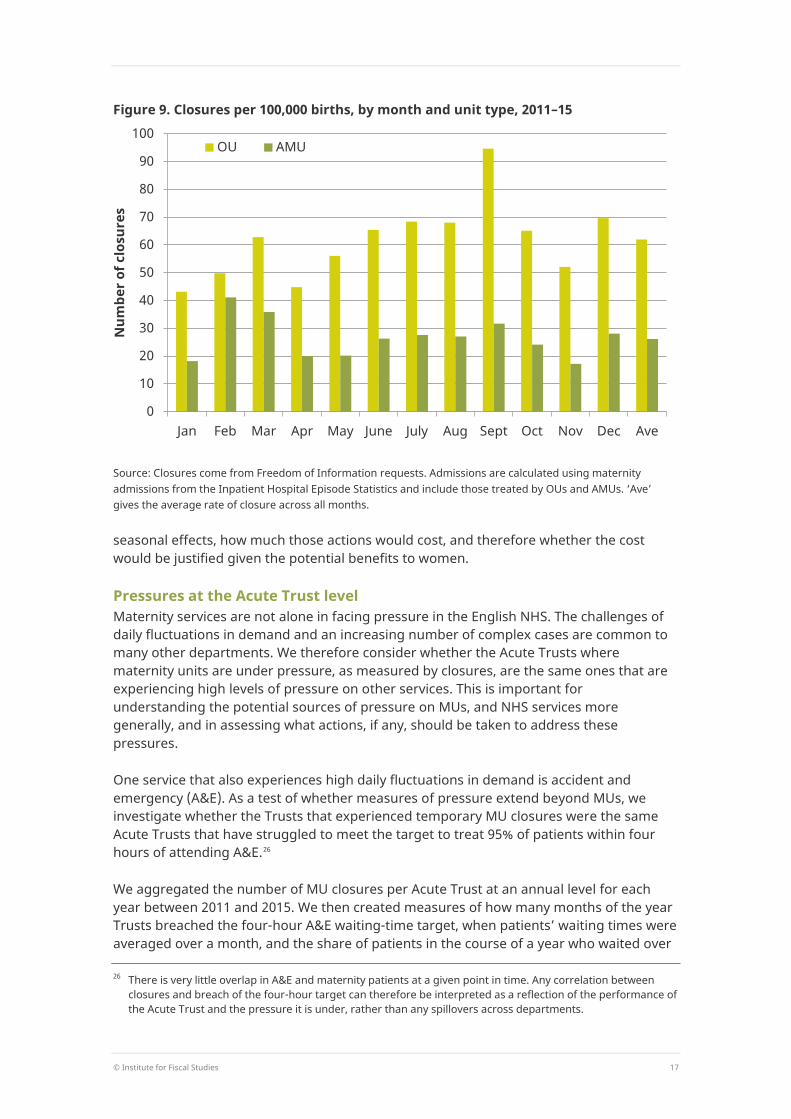
Figure 9 shows the pattern of closures by month per 100,000 maternity admissions. Closures are most likely in September, when there is a peak in births nine months after the Christmas and New Year period. Many closures in September may be inevitable unless the NHS is prepared to operate with expensive spare capacity for much of the year. However, there are noticeably more closures over the summer months too, and in December, which coincide with periods when staff are likely to take annual leave.
Understanding the role of staffing is particularly problematic, given that information on staffing is only available to researchers at a monthly level and is recorded as full-time equivalents, so will not capture annual leave. Whether increased closure at the end of the week is attributed to difficulty in getting staff, many of whom may have other caring commitments, or to poor management is not possible to say using the data available. It is therefore hard to identify what actions could be taken to eliminate the day-of-the-week or
20 The difference between the two series is explained by a higher number of planned admissions on Thursday
and Friday, relative to Saturday. 21 It should be noted that the number of AMU closures is divided by all births that occur in OUs or AMUs, so the
figure does not represent closures per mother cared for by an AMU. 22 Royal College of Obstetricians and Gynaecologists, Providing Quality Care for Women: Obstetrics and
Gynaecology Workforce, 2016, https://www.rcog.org.uk/globalassets/documents/guidelines/working-party-reports/ogworkforce.pdf.
23 NMPA project team, National Maternity and Perinatal Audit: Organisational Report 2017, Royal College of Obstetricians and Gynaecologists, London, 2017, http://www.maternityaudit.org.uk/downloads/NMPA%20organisational%20report%202017.pdf.
24 Royal College of Obstetricians and Gynaecologists, Providing Quality Care for Women: Obstetrics and Gynaecology Workforce, 2016, https://www.rcog.org.uk/globalassets/documents/guidelines/working-party-reports/ogworkforce.pdf.
25 For more details, see Royal College of Midwives, The Gathering Storm: England’s Midwifery Workforce Challenges, 2017, https://www.rcm.org.uk/sites/default/files/The%20gathering%20storm%20-%20Englands%20midwifery%20workforce%20challenges%20A5%2020pp_3.pdf.
© Institute for Fiscal Studies 17
Figure 9. Closures per 100,000 births, by month and unit type, 2011–15
Source: Closures come from Freedom of Information requests. Admissions are calculated using maternity admissions from the Inpatient Hospital Episode Statistics and include those treated by OUs and AMUs. ‘Ave’ gives the average rate of closure across all months.
seasonal effects, how much those actions would cost, and therefore whether the cost would be justified given the potential benefits to women.
Pressures at the Acute Trust level Maternity services are not alone in facing pressure in the English NHS. The challenges of daily fluctuations in demand and an increasing number of complex cases are common to many other departments. We therefore consider whether the Acute Trusts where maternity units are under pressure, as measured by closures, are the same ones that are experiencing high levels of pressure on other services. This is important for understanding the potential sources of pressure on MUs, and NHS services more generally, and in assessing what actions, if any, should be taken to address these pressures.
One service that also experiences high daily fluctuations in demand is accident and emergency (A&E). As a test of whether measures of pressure extend beyond MUs, we investigate whether the Trusts that experienced temporary MU closures were the same Acute Trusts that have struggled to meet the target to treat 95% of patients within four hours of attending A&E.26
We aggregated the number of MU closures per Acute Trust at an annual level for each year between 2011 and 2015. We then created measures of how many months of the year Trusts breached the four-hour A&E waiting-time target, when patients’ waiting times were averaged over a month, and the share of patients in the course of a year who waited over
26 There is very little overlap in A&E and maternity patients at a given point in time. Any correlation between
closures and breach of the four-hour target can therefore be interpreted as a reflection of the performance of the Acute Trust and the pressure it is under, rather than any spillovers across departments.
0
10
20
30
40
50
60
70
80
90
100
Jan Feb Mar Apr May June July Aug Sept Oct Nov Dec Ave
Num
ber o
f clo
sure
s
OU AMU

18 © Institute for Fiscal Studies
Table 2. Maternity unit closures per year, A&E waiting times, hospital quality and local populations, 2011–15 Closures per year (% of Trust-years)
Months missed
A&E target (mean)
Share of A&E patients who waited over four hours
SHMI (2015)
Local Trust population
(mean, 2015)
Local Trust population of women aged 15–44
(mean, 2015)
0 (64.8%) 5.0 8.5% 1.011 415,600 81,100 1–2 (11.7%) 5.6 8.4% 0.997 405,500 82,700 3–9 (8.6%) 8.1 10.2% 0.989 393,000 79,000 10+ (6.6%) 6.8 11.0% 0.984 484,500 98,100 Missing (8.2%) 5.1 6.4% 1.003 444,400 84,600
Note: Observations are at the Acute Trust-year level and include all Acute Trusts with an A&E department and an OU. There are 664 observations in total. Closures were obtained from Freedom of Information Requests to Acute Trusts. The missing category compromises Acute Trusts that did not reply and Acute Trusts that did not give exact dates of closures. A&E data come from the Accident and Emergency Hospital Episode Statistics. An Acute Trust is defined as missing the target in a particular month if less than 95% of patients were seen within four hours. Local populations come from assigning each LSOA to the nearest Acute Trust with an OU and an A&E department, using straight-line distance to the Acute Trust headquarters and mid-year ONS population estimates. The Standardised Hospital Mortality Indicator is provided by NHS Digital.
four hours.27 The first two columns of Table 2 present the results by the grouped number of MU closures per year.28 Trusts that did not close or closed just once or twice missed the target on average in 5 months per year. Acute Trusts that closed more than twice missed the target in at least 6 months of the year.29 For A&E departments of Trusts that closed 0–2 times per year, 8–9% of patients waited over four hours. This compares with 10% for Trusts that closed 3–9 times and 11% for those that closed more than 10 times.
The correlation between MU closures and breaches of the A&E targets shows that Acute Trusts are under pressure across multiple departments. The third column of Table 2 shows the average Standardised Hospital Mortality Indicator (SHMI), to test whether this pressure affects overall hospital quality. The SHMI is the ratio of the actual number of people who died relative to the expected number based on that Trust’s admissions. Here, we find that higher closures are associated with lower mortality, so that Trusts with a greater number of closures achieve slightly better clinical outcomes, at least on this measure. This may seem surprising, but it should be remembered that an MU closure may be the most efficient and safest course of action. Equally, it may on occasion be best for the hospital and the patient if an A&E wait time exceeds four hours. In theory, better-quality hospitals may be more able to manage their staffing levels to avoid the need to close, but they may also be better at judging when the safety of patients makes closure
27 These data are from the Hospital Episode Statistics and do not exactly replicate official A&E waiting-time
figures. 28 As data are at an annual level, Trusts may be in different MU closure categories in different years. 29 The picture is even clearer when we consider the median number of months the target was breached, which
stands at 4 where MUs do not close, 5 when MUs close once or twice, and 9 when units close three times or more.
© Institute for Fiscal Studies 19
necessary. The relationship between hospital quality and closure is therefore ambiguous. At least on the SHMI measure, Trusts that close MUs more often do better.
One potential explanation for the correlation between MU closures and breaching the A&E waiting-time targets is that Trusts are subject to common population pressures. To examine this possibility, we create measures of the local Trust population. To do so, we assign the population of each Lower Super Output Area in England30 to their nearest Acute Trust that has an OU and an A&E using straight-line distance to the Acute Trust headquarters.31 The final two columns of Table 2 show the average total population in 2015 and the average population of women of childbearing age. Here, we see that populations are larger for Acute Trusts that closed 10 times or more. However, it should be noted that Acute Trusts that closed 10 times or more also had slightly more MUs per Acute Trust (a mean of 1.5, as opposed to 1.0–1.1 for all other categories). This suggests that MUs may be more likely to close if they can send mothers to another MU within the Trust.
We also considered the role of population growth rather than levels. There is a positive correlation between population growth and closures, but the relationship is weak. The relationship between population pressure, closures and A&E waiting times therefore appears driven by the level of population rather than the growth rate. The presence of a role for population pressure does not, however, negate the potential for other contributing factors, such as management shortcomings at the Acute Trust level. However, if these factors do operate, they do not translate into overall quality as measured by SHMI.
30 Lower Super Output Areas (LSOAs) are small geographical areas, created to improve statistical reporting.
There are approximately 33,000 LSOAs in England, with an average population of around 1,500. 31 We exclude Liverpool Women’s Hospital and Birmingham Women’s Hospital.
20 © Institute for Fiscal Studies
4. Conclusion Maternity units are facing long-term pressures on services, through changes in the case mix of women giving birth, who on average are in need of more care. These trends, of increasing maternal age and more complex underlying health conditions, are unlikely to abate in the near future. MUs will need to adapt to the new case mix of mothers in order to achieve the vision of the National Maternity Review, ‘Better Births’, and to operate within their financial means. Our evidence showing reductions in long stays suggests that there may be some margins on which MUs are able to adjust. At the same time, the needs of mothers and babies will rightly place a check on MUs’ ability to take actions to reduce costs. We show that the number of C-sections has grown over time, but this increase is entirely attributable to changes in maternal characteristics.
MUs also face pressure from daily fluctuations in demand. This is an inevitable feature of maternity service provision. Occasional closures are probably unavoidable, unless the NHS is prepared to operate with excess capacity for much of the time. However, the patterns we observe in closures by day of the week and month of the year suggest that, in some instances, closures could be foreseen and avoided through improved planning. Whether the costs of that improved planning and additional resources exceed the costs to mothers in labour of units closing is another question.
Maternity services are not alone in facing pressure in the English NHS. The challenges of daily fluctuations in demand and an increasing number of complex cases are common to many other departments. We find that MU closures are correlated with A&E performance on the four-hour waiting-time target, even though patients of the two departments rarely overlap. One potential cause of the correlation is failure or inability to adapt to increased population pressures, although it is impossible to rule out other causes, such as ineffective planning and management.