Embed Size (px)
Citation preview
8/4/2019 Unctad 2011 Wir Overview
http://slidepdf.com/reader/full/unctad-2011-wir-overview 1/41
EMBARGO
The contents of this Report must not be
quoted or summarized in the print,
broadcast or electronic media before
26 July 2011, 17:00 hours GMT
U NI T E D NAT I O NS C O NF E R E NC E O N T R ADE AND DE V E L O P M E NT
WORLDINVESTMENT
REPORT
NON-EQUITY MODES OF INTERNATIONAL PRODUCTION AND DEVELOPMENT
2011OVERVIEW
P r i n t e d
a t U n i t e d
N a t i o n s , G e n e v a – G E . 1 1 - 5 1 1 6 3 – J u l y
2 0 1 1 – 6 , 2 6 6 –
U N C T A D / W I R / 2 0 1 1 ( O v e r v i e w )
8/4/2019 Unctad 2011 Wir Overview
http://slidepdf.com/reader/full/unctad-2011-wir-overview 2/41
I E D A I T E I F E E T A E A D D E E L EE E E L E T
WORLDINVESTMENT
REPORT
NON-EQUITY MODES OF INTERNATIONAL PRODUCTION AND DEVELOPMENT
2011
New York and Geneva, 2011
8/4/2019 Unctad 2011 Wir Overview
http://slidepdf.com/reader/full/unctad-2011-wir-overview 3/41
World Investment Report 2011ii
NOTE
The Division on Investment and Enterprise o UNCTAD is a global centre o excellence, dealing with
issues related to investment and enterprise development in the United Nations System. It builds on
three and a hal decades o experience and international expertise in research and policy analysis,
intergovernmental consensus-building, and provides technical assistance to developing countries.
The terms country/economy as used in this Report also reer, as appropriate, to territories or areas;
the designations employed and the presentation o the material do not imply the expression o any
opinion whatsoever on the part o the Secretariat o the United Nations concerning the legal status
o any country, territory, city or area or o its authorities, or concerning the delimitation o its rontiers
or boundaries. In addition, the designations o country groups are intended solely or statistical or
analytical convenience and do not necessarily express a judgment about the stage o developmentreached by a particular country or area in the development process. The major country groupings
used in this Report ollow the classication o the United Nations Statistical Oce. These are:
Developed countries: the member countries o the OECD (other than Chile, Mexico, the Republic o
Korea and Turkey), plus the new European Union member countries which are not OECD members
(Bulgaria, Cyprus, Latvia, Lithuania, Malta and Romania), plus Andorra, Bermuda, Liechtenstein,
Monaco and San Marino.
Transition economies: South-East Europe and the Commonwealth o Independent States.
Developing economies: in general all economies not specied above. For statistical purposes, thedata or China do not include those or Hong Kong Special Administrative Region (Hong Kong
SAR), Macao Special Administrative Region (Macao SAR) and Taiwan Province o China.
Reerence to companies and their activities should not be construed as an endorsement by
UNCTAD o those companies or their activities.
The boundaries and names shown and designations used on the maps presented in this publication
do not imply ocial endorsement or acceptance by the United Nations.
The ollowing symbols have been used in the tables:
• Two dots (..) indicate that data are not available or are not separately reported. Rows in tableshave been omitted in those cases where no data are available or any o the elements in the row;
• A dash (–) indicates that the item is equal to zero or its value is negligible;
• A blank in a table indicates that the item is not applicable, unless otherwise indicated;
• A slash (/) between dates representing years, e.g., 1994/95, indicates a nancial year;
• Use o a dash (–) between dates representing years, e.g., 1994–1995, signies the ull period
involved, including the beginning and end years;
• Reerence to “dollars” ($) means United States dollars, unless otherwise indicated;
• Annual rates o growth or change, unless otherwise stated, reer to annual compound rates;
Details and percentages in tables do not necessarily add to totals because o rounding. The material contained in this study may be reely quoted with appropriate acknowledgement.
8/4/2019 Unctad 2011 Wir Overview
http://slidepdf.com/reader/full/unctad-2011-wir-overview 4/41
iiiPreace
New York, June 2011 Secretary-General o the United Nations
PREFACE
Global oreign direct investment (FDI) has not yet bounced back to pre-crisis
levels, though some regions show better recovery than others. The reason is not
nancing constraints, but perceived risks and regulatory uncertainty in a ragile
world economy.
The World Investment Report 2011 orecasts that, barring any economic shocks,
FDI fows will recover to pre-crisis levels over the next two years. The challenge or
the development community is to make this anticipated investment have greater
impact on our eorts to achieve the Millennium Development Goals.In 2010 – or the rst time – developing economies absorbed close to hal o global
FDI infows. They also generated record levels o FDI outfows, much o it directed
to other countries in the South. This urther demonstrates the growing importance
o developing economies to the world economy, and o South-South cooperation
and investment or sustainable development.
Increasingly, transnational corporations are engaging with developing and transition
economies through a broadening array o production and investment models,
such as contract manuacturing and arming, service outsourcing, ranchising andlicensing. These relatively new phenomena present opportunities or developing
and transition economies to deepen their integration into the rapidly evolving global
economy, to strengthen the potential o their home-grown productive capacity, and
to improve their international competitiveness.
Unlocking the ull potential o these new developments wiIl depend on wise poli-
cymaking and institution building by governments and international organizations.
Entrepreneurs and businesses in developing and transition economies need rame-
works in which they can benet ully rom integrated international production and
trade. I commend this report, with its wealth o research and analysis, to policy-
makers and businesses pursuing development success in a ast-changing world.
BAN Ki-moon
8/4/2019 Unctad 2011 Wir Overview
http://slidepdf.com/reader/full/unctad-2011-wir-overview 5/41
World Investment Report 2011iv
ACKNOWLEDGEMENTS
The World Investment Report 2011(WIR11) was prepared by a team led by James
Zhan. The team members included Richard Bolwijn, Quentin Dupriez, Masataka
Fujita, Thomas van Gien, Michael Hanni, Kalman Kalotay, Joachim Karl, Ral
Krüger, Guoyong Liang, Anthony Miller, Haz Mirza, Nicole Moussa, Shin Ohinata,
Astrit Sulstarova, Elisabeth Tuerk, Jörg Weber and Kee Hwee Wee. Wolgang
Alschner, Amare Bekele, Federico Di Biasio, Hamed El Kady, Ariel Ivanier, Lizzie
Medrano, Cai Mengqi, Abraham Negash, Sergey Ripinski, Claudia Salgado,
Christoph Spennemann, Katharina Wortmann and Youngjun Yoo also contributed
to the Report.
Peter Buckley served as principal consultant. WIR11 also beneted rom the advice
o Ilan Alon, Mark Casson, Lorraine Eden, Pierre Guislain, Justin Lin, Sarianna
Lundan, Ted Moran, Rajneesh Narula and Pierre Sauvé.
Research and statistical assistance was provided by Bradley Boicourt, Lizanne
Martinez and Tadelle Taye as well as interns Hasso Anwer, Hector Dip, Riham
Ahmed Marii, Eleni Piteli, John Sasuya and Ninel Seniuk.
Production and dissemination o WIR11 was supported by Tserenpuntsag Batbold,
Elisabeth Anodeau-Mareschal, Séverine Excoer, Rosalina Goyena, Natalia
Meramo-Bachayani, Chantal Rakotondrainibe and Katia Vieu.
The manuscript was edited by Christopher Long and typeset by Laurence Duchemin
and Tess Ventura. Sophie Combette designed the cover.
At various stages o preparation, in particular during the our seminars organized
to discuss earlier drats o the Report, the team beneted rom comments and
inputs received rom Rol Adlung, Marie-Claude Allard, Yukiko Arai, Rashmi Banga,Diana Barrowclough, Francis Bartels, Sven Behrendt, Jem Bendell, Nathalie
Bernasconi, Nils Bhinda, Francesco Ciabuschi, Simon Collier, Denise Dunlap-
Hinkler, Kevin Gallagher, Patrick Genin, Simona Gentile-Lüdecke, David Hallam,
Georey Hamilton, Fabrice Hatem, Xiaoming He, Toh Mun Heng, Paul Hohnen,
Anna Joubin-Bret, Christopher Kip, Pascal Liu, Celso Manangan, Arvind Mayaram,
Ronaldo Mota, Jean-François Outreville, Peter Muchlinski, Ram Mudambi, Sam
Muradzikwa, Peter Nunnenkamp, Oah Obale, Joost Pauwelyn, Carlo Pietrobelli,
Jaya Prakash Pradhan, Hassan Qaqaya, Githa Roelans, Ulla Schwager, EmilySims, Brian Smart, Jagjit Singh Srai, Brad Stillwell, Roger Strange, Timothy J.
8/4/2019 Unctad 2011 Wir Overview
http://slidepdf.com/reader/full/unctad-2011-wir-overview 6/41
v Acknowledgements
Sturgeon, Dennis Tachiki, Ana Teresa Tavares-Lehmann, Silke Trumm, Frederico
Araujo Turolla, Peter Utting, Kernaghan Webb, Jacques de Werra, Lulu Zhang and
Zbigniew Zimny.Numerous ocials o central banks, government agencies, international
organizations and non-governmental organizations also contributed to WIR11.
The nancial support o the Governments o Finland and Sweden is grateully
acknowledged.

8/4/2019 Unctad 2011 Wir Overview
http://slidepdf.com/reader/full/unctad-2011-wir-overview 7/41
8/4/2019 Unctad 2011 Wir Overview
http://slidepdf.com/reader/full/unctad-2011-wir-overview 8/41
viiContents
TABLE OF CONTENTS
Page
KEY MESSAGES .................................................................... viii
OVERVIEW
FDI TRENDS AND PROSPECTS ...........................................................1
INVESTMENT POLICY TRENDS ..........................................................11
NON-EQUITY MODES OF INTERNATIONAL
PRODUCTION AND DEVELOPMENT ..................................................15
8/4/2019 Unctad 2011 Wir Overview
http://slidepdf.com/reader/full/unctad-2011-wir-overview 9/41
World Investment Report 2011 viii
KEY MESSAGES
FDI trends and prospects
Global oreign direct investment (FDI) ows rose moderately to $1.24 trillion in
2010, but were still 15 per cent below their pre-crisis average. This is in contrast to
global industrial output and trade, which were back to pre-crisis levels. UNCTAD
estimates that global FDI will recover to its pre-crisis level in 2011, increasing to
$1.4–1.6 trillion, and approach its 2007 peak in 2013. This positive scenario holds,barring any unexpected global economic shocks that may arise rom a number o
risk actors still in play.
For the frst time, developing and transition economies together attracted more
than hal o global FDI ows. Outward FDI rom those economies also reached
record highs, with most o their investment directed towards other countries in the
South. In contrast, FDI infows to developed countries continued to decline.
Some o the poorest regions continued to see declines in FDI ows. Flows to Arica, least developed countries, landlocked developing countries and small
island developing States all ell, as did fows to South Asia. At the same time,
major emerging regions, such as East and South-East Asia and Latin America
experienced strong growth in FDI infows.
International production is expanding, with oreign sales, employment and assets
o transnational corporations (TNCs) all increasing. TNCs’ production worldwide
generated value-added o approximately $16 trillion in 2010, about a quarter o
global GDP. Foreign aliates o TNCs accounted or more than 10 per cent o global GDP and one-third o world exports.
State-owned TNCs are an important emerging source o FDI. There are at least
650 State-owned TNCs, with 8,500 oreign aliates across the globe. While they
represent less than 1 per cent o TNCs, their outward investment accounted or
11 per cent o global FDI in 2010. The ownership and governance o State-owned
TNCs have raised concerns in some host countries regarding, among others,
the level playing eld and national security, with regulatory implications or theinternational expansion o these companies.
8/4/2019 Unctad 2011 Wir Overview
http://slidepdf.com/reader/full/unctad-2011-wir-overview 10/41
ix Key messages
Investment policy trends
Investment liberalization and promotion remained the dominant element o recent investment policies. Nevertheless, the risk o investment protectionism has
increased as restrictive investment measures and administrative procedures have
accumulated over the past years.
The regime o international investment agreements (IIAs) is at the crossroads. With
close to 6,100 treaties, many ongoing negotiations and multiple dispute-settlement
mechanisms, it has come close to a point where it is too big and complex to handle
or governments and investors alike, yet remains inadequate to cover all possible
bilateral investment relationships (which would require a urther 14,100 bilateraltreaties). The policy discourse about the uture orientation o the IIA regime and its
development impact is intensiying.
FDI policies interact increasingly with industrial policies, nationally and internationally.
The challenge is to manage this interaction so that the two policies work together
or development. Striking a balance between building stronger domestic productive
capacity on the one hand and avoiding investment and trade protectionism on the
other is key, as is enhancing international coordination and cooperation.
The investment policy landscape is inuenced more and more by a myriad o
voluntary corporate social responsibility (CSR) standards. Governments can
maximize development benets deriving rom these standards through appropriate
policies, such as harmonizing corporate reporting regulations, providing capacity-
building programmes, and integrating CSR standards into international investment
regimes.
Non-equity modes o international production anddevelopment
In today’s world, policies aimed at improving the integration o developing economies
into global value chains must look beyond FDI and trade. Policymakers need to
consider non-equity modes (NEMs) o international production, such as contract
manuacturing, services outsourcing, contract arming, ranchising, licensing,
management contracts, and other types o contractual relationship through which
TNCs coordinate the activities o host-country rms, without owning a stake inthose rms.
8/4/2019 Unctad 2011 Wir Overview
http://slidepdf.com/reader/full/unctad-2011-wir-overview 11/41
World Investment Report 2011 x
Cross-border NEM activity worldwide is signifcant and particularly important in
developing countries. It is estimated to have generated over $2 trillion o sales in
2009. Contract manuacturing and services outsourcing accounted or $1.1–1.3trillion, ranchising $330–350 billion, licensing $340–360 billion, and management
contracts around $100 billion. In most cases, NEMs are growing more rapidly than
the industries in which they operate.
NEMs can yield signifcant development benefts. They employ an estimated 14–16
million workers in developing countries. Their value added represents up to 15
per cent o GDP in some economies. Their exports account or 70–80 per cent o
global exports in several industries. Overall, NEMs can support long-term industrial
development by building productive capacity, including through technologydissemination and domestic enterprise development, and by helping developing
countries gain access to global value chains.
NEMs also pose risks or developing countries. Employment in contract
manuacturing can be highly cyclical and easily displaced. The value added
contribution o NEMs can appear low i assessed in terms o the value captured
out o the total global value chain. Concerns exist that TNCs may use NEMs to
circumvent social and environmental standards. And to ensure success in long-
term industrial development, developing countries need to mitigate the risk o remaining locked into low-value-added activities and becoming overly dependent
on TNC-owned technologies and TNC-governed global value chains.
Policy matters. Maximizing development benets rom NEMs requires action in our
areas. First, NEM policies need to be embedded in overall national development
strategies, aligned with trade, investment and technology policies and addressing
dependency risks. Second, governments need to support eorts to build domestic
productive capacity to ensure the availability o attractive business partners that
can qualiy as actors in global value chains. Third, promotion and acilitation o NEMs requires a strong enabling legal and institutional ramework, as well as the
involvement o investment promotion agencies in attracting TNC partners. Finally,
policies need to address the negative consequences and risks posed by NEMs
by strengthening the bargaining power o local NEM partners, saeguarding
competition, protecting labour rights and the environment.
8/4/2019 Unctad 2011 Wir Overview
http://slidepdf.com/reader/full/unctad-2011-wir-overview 12/41
OVERVIEW
FDI TRENDS AND PROSPECTS
FDI recovery to gain momentum in 2011
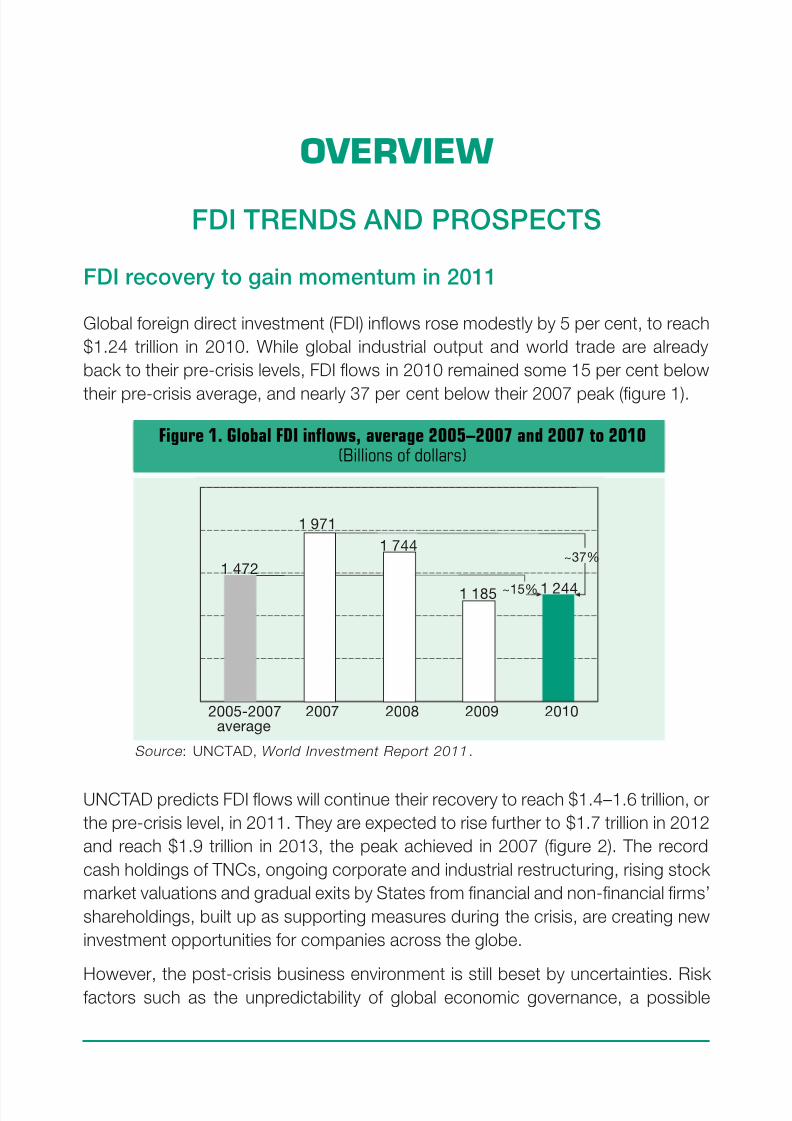
Global oreign direct investment (FDI) infows rose modestly by 5 per cent, to reach
$1.24 trillion in 2010. While global industrial output and world trade are already
back to their pre-crisis levels, FDI fows in 2010 remained some 15 per cent below
their pre-crisis average, and nearly 37 per cent below their 2007 peak (gure 1).
Figure 1. Global FDI inows, average 2005–2007 and 2007 to 2010(Billions of dollars)
Source : UNCTAD, World Investment Report 2011.
1 472
1 971
1 744
1 185 1 244
2005-2007average
2007 2008 2009 2010
~15%
~37%
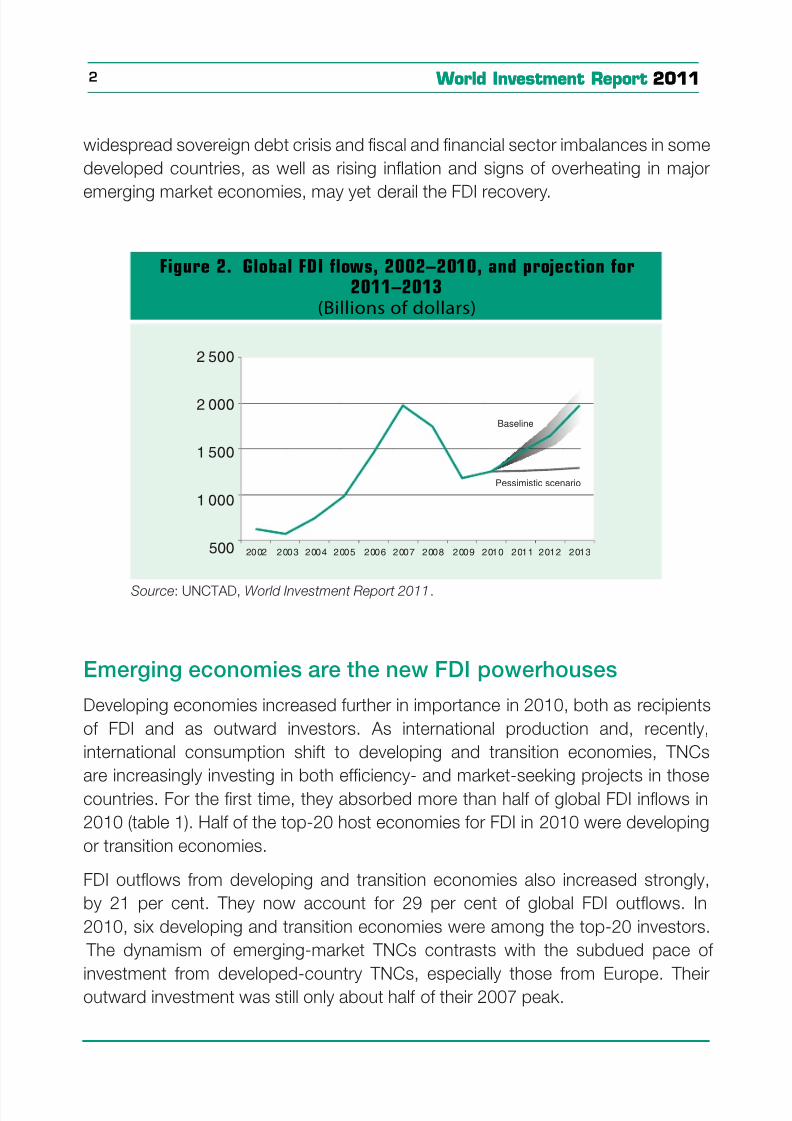
UNCTAD predicts FDI fows will continue their recovery to reach $1.4–1.6 trillion, or
the pre-crisis level, in 2011. They are expected to rise urther to $1.7 trillion in 2012
and reach $1.9 trillion in 2013, the peak achieved in 2007 (gure 2). The record
cash holdings o TNCs, ongoing corporate and industrial restructuring, rising stock
market valuations and gradual exits by States rom nancial and non-nancial rms’
shareholdings, built up as supporting measures during the crisis, are creating new
investment opportunities or companies across the globe.
However, the post-crisis business environment is still beset by uncertainties. Riskactors such as the unpredictability o global economic governance, a possible
8/4/2019 Unctad 2011 Wir Overview
http://slidepdf.com/reader/full/unctad-2011-wir-overview 13/41
World Investment Report 20112 World Investment Report 2011
widespread sovereign debt crisis and scal and nancial sector imbalances in some
developed countries, as well as rising infation and signs o overheating in major
emerging market economies, may yet derail the FDI recovery.
Figure 2. Global FDI flows, 2002–2010, and projection for2011–2013
(Billions of dollars)
Source: UNCTAD, World Investment Report 2011.
500
1 000
1 500
2 000
2 500
20 02 2 00 3 2 00 4 2 00 5 2 00 6 2 00 7 2 00 8 2 00 9 2 01 0 2 01 1 2 01 2 2 01 3
Pessimistic scenario
Baseline
Emerging economies are the new FDI powerhouses
Developing economies increased urther in importance in 2010, both as recipients
o FDI and as outward investors. As international production and, recently,
international consumption shit to developing and transition economies, TNCs
are increasingly investing in both eciency- and market-seeking projects in thosecountries. For the rst time, they absorbed more than hal o global FDI infows in
2010 (table 1). Hal o the top-20 host economies or FDI in 2010 were developing
or transition economies.
FDI outfows rom developing and transition economies also increased strongly,
by 21 per cent. They now account or 29 per cent o global FDI outfows. In
2010, six developing and transition economies were among the top-20 investors.
The dynamism o emerging-market TNCs contrasts with the subdued pace o
investment rom developed-country TNCs, especially those rom Europe. Theiroutward investment was still only about hal o their 2007 peak.
8/4/2019 Unctad 2011 Wir Overview
http://slidepdf.com/reader/full/unctad-2011-wir-overview 14/41
3Overview
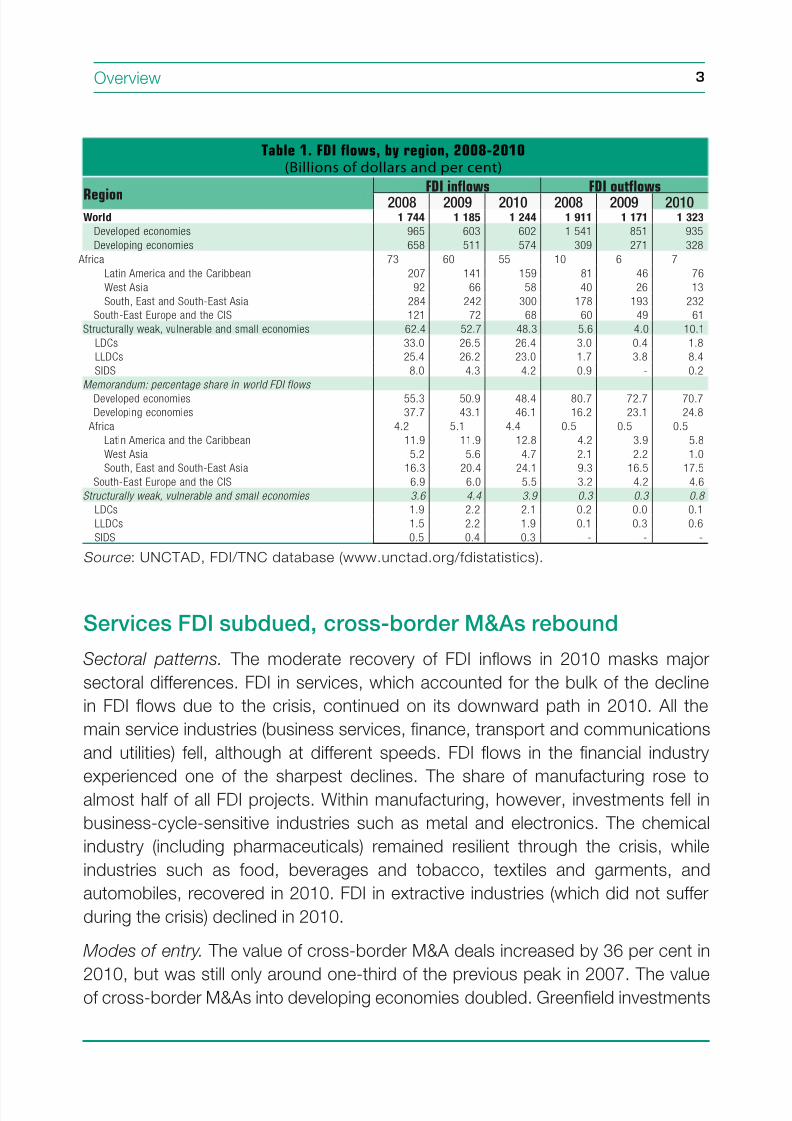
Table 1. FDI flows, by region, 2008-2010(Billions of dollars and per cent)
RegionFDI inows FDI outows
2008 2009 2010 2008 2009 2010World 1 744 1 185 1 244 1 911 1 171 1 323
Developed economies 965 603 602 1 541 851 935
Developing economies 658 511 574 309 271 328
Africa 73 60 55 10 6 7
Latin America and the Caribbean 207 141 159 81 46 76
West Asia 92 66 58 40 26 13
South, East and South-East Asia 284 242 300 178 193 232
South-East Europe and the CIS 121 72 68 60 49 61
Structurally weak, vulnerable and small economies 62.4 52.7 48.3 5.6 4.0 10.1
LDCs 33.0 26.5 26.4 3.0 0.4 1.8
LLDCs 25.4 26.2 23.0 1.7 3.8 8.4
SIDS 8.0 4.3 4.2 0.9 - 0.2
Memorandum: percentage share in world FDI flows
Developed economies 55.3 50.9 48.4 80.7 72.7 70.7
Developing economies 37.7 43.1 46.1 16.2 23.1 24.8
Africa 4.2 5.1 4.4 0.5 0.5 0.5
Latin America and the Caribbean 11.9 11.9 12.8 4.2 3.9 5.8
West Asia 5.2 5.6 4.7 2.1 2.2 1.0
South, East and South-East Asia 16.3 20.4 24.1 9.3 16.5 17.5
South-East Europe and the CIS 6.9 6.0 5.5 3.2 4.2 4.6
Structurally weak, vulnerable and small economies 3.6 4.4 3.9 0.3 0.3 0.8
LDCs 1.9 2.2 2.1 0.2 0.0 0.1
LLDCs 1.5 2.2 1.9 0.1 0.3 0.6
SIDS 0.5 0.4 0.3 - - -
Source : UNCTAD, FDI/TNC database (www.unctad.org/fdistatistics).
Services FDI subdued, cross-border M&As rebound
Sectoral patterns. The moderate recovery o FDI infows in 2010 masks major
sectoral dierences. FDI in services, which accounted or the bulk o the decline
in FDI fows due to the crisis, continued on its downward path in 2010. All the
main service industries (business services, nance, transport and communications
and utilities) ell, although at dierent speeds. FDI fows in the nancial industry
experienced one o the sharpest declines. The share o manuacturing rose toalmost hal o all FDI projects. Within manuacturing, however, investments ell in
business-cycle-sensitive industries such as metal and electronics. The chemical
industry (including pharmaceuticals) remained resilient through the crisis, while
industries such as ood, beverages and tobacco, textiles and garments, and
automobiles, recovered in 2010. FDI in extractive industries (which did not suer
during the crisis) declined in 2010.
Modes o entry. The value o cross-border M&A deals increased by 36 per cent in
2010, but was still only around one-third o the previous peak in 2007. The valueo cross-border M&As into developing economies doubled. Greeneld investments
8/4/2019 Unctad 2011 Wir Overview
http://slidepdf.com/reader/full/unctad-2011-wir-overview 15/41
World Investment Report 20114
declined in 2010, but registered a signicant rise in both value and number during
the rst ve months o 2011.
Components o FDI. Improved economic perormance in many parts o the worldand increased prots o oreign aliates lited reinvested earnings to nearly double
their 2009 level. The other two FDI components – equity investment fows and
intra-company loans – ell in 2010.
Special unds. Private equity-sponsored FDI started to recover in 2010 and was
directed increasingly towards developing and transition economies. However, it
was still more than 70 per cent below the peak year o 2007. FDI by sovereign
wealth unds (SWFs) dropped to $10 billion in 2010, down rom $26.5 billion in
2009. A more benign global economic environment may lead to increased FDI rom
these special unds in 2011.
International production picks up
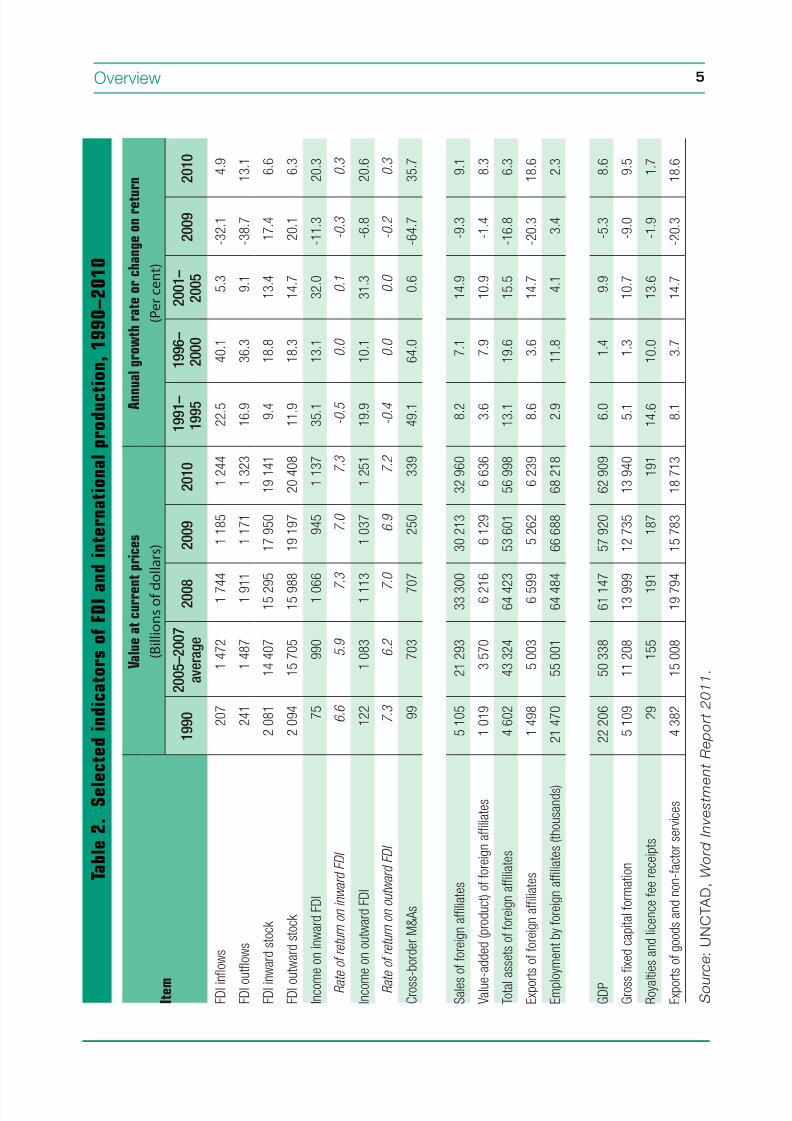
Indicators o international production, including oreign sales, employment and
assets o TNCs, showed gains in 2010 as economic conditions improved (table
2). UNCTAD estimates that sales and value added o oreign aliates in the world
reached $33 trillion and $7 trillion, respectively. They also exported more than $6trillion, about one-third o global exports. TNCs worldwide, in their operations both
at home and abroad, generated value added o approximately $16 trillion in 2010 –
about a quarter o total world GDP.
State-owned TNCs in the spotlight
State-owned TNCs are causing concerns in a number o host countries regarding
national security, the level playing eld or competing rms, and governance
and transparency. From the perspective o home countries, there are concerns
regarding the openness to investment rom their State-owned TNCs. Discussions
are underway in some international orums with a view to addressing these issues.
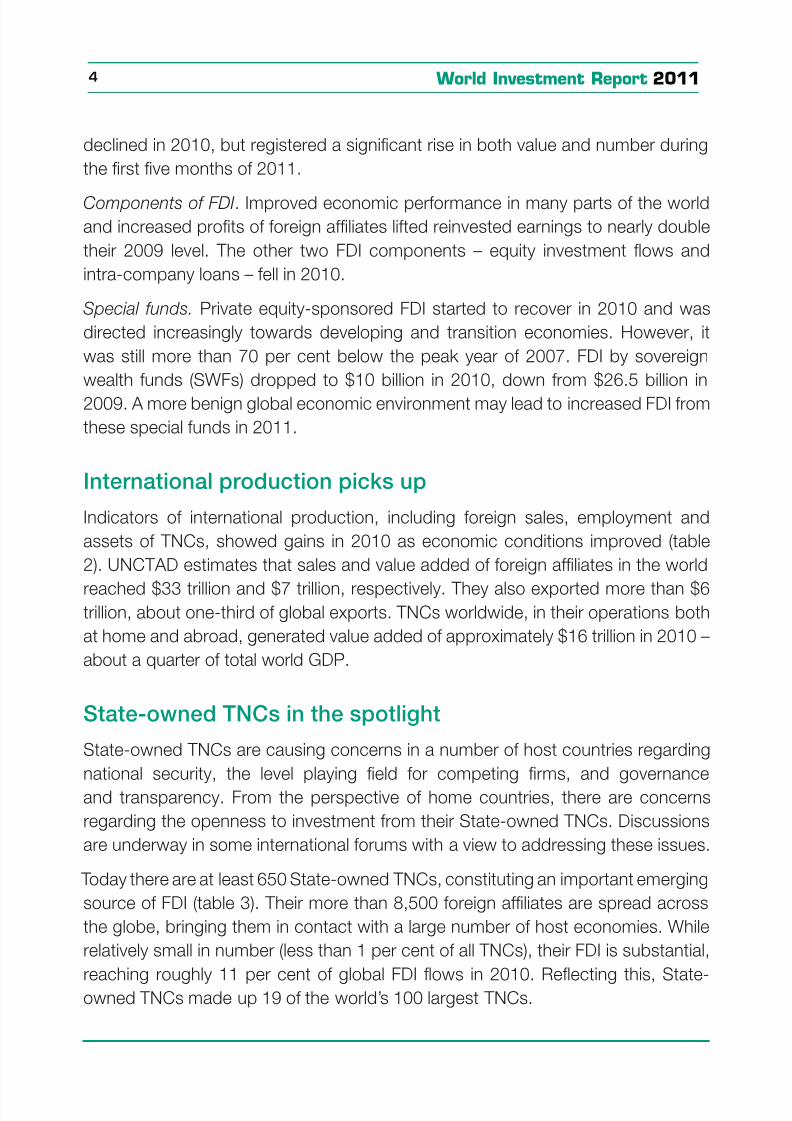
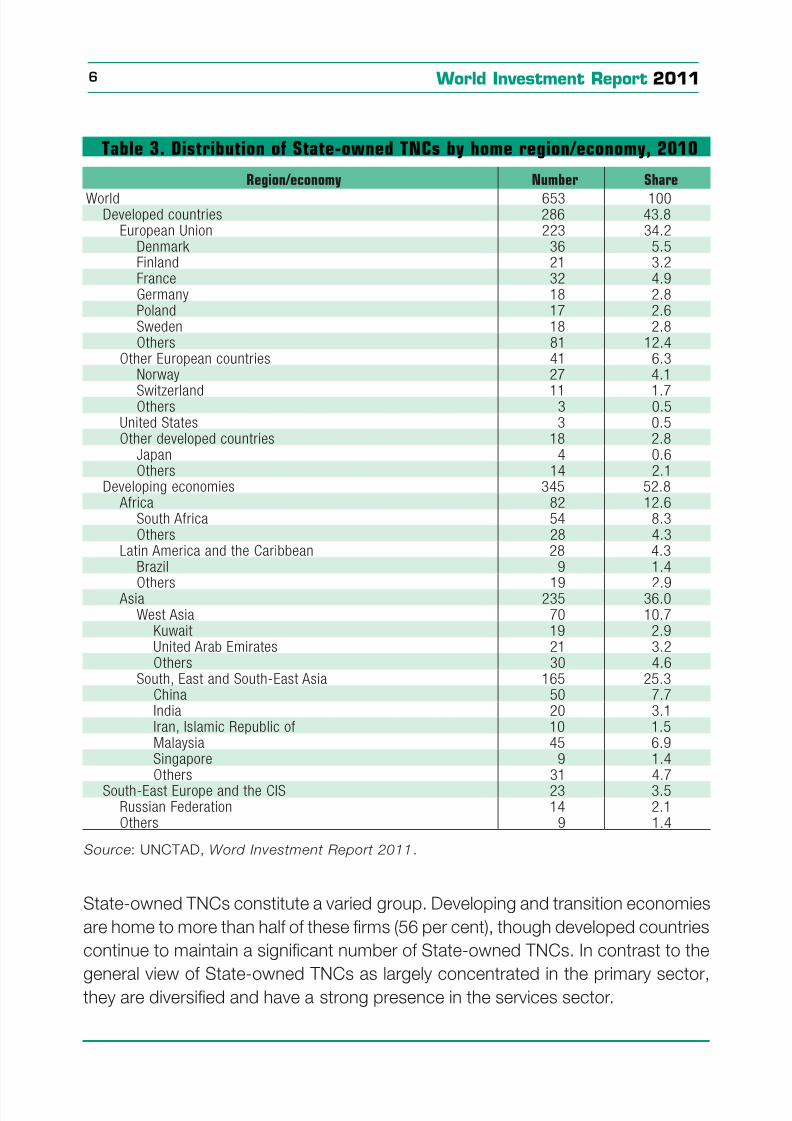
Today there are at least 650 State-owned TNCs, constituting an important emerging
source o FDI (table 3). Their more than 8,500 oreign aliates are spread across
the globe, bringing them in contact with a large number o host economies. While
relatively small in number (less than 1 per cent o all TNCs), their FDI is substantial,
reaching roughly 11 per cent o global FDI fows in 2010. Refecting this, State-owned TNCs made up 19 o the world’s 100 largest TNCs.
8/4/2019 Unctad 2011 Wir Overview
http://slidepdf.com/reader/full/unctad-2011-wir-overview 16/41
5Overview
T a b l e 2 .
S e l e c t e d i n d i c a t o r s o f F D I a
n d i n t e r n a t i o n a l p r o d u c t
i o n ,
1 9 9 0 – 2 0 1 0
I t e m
V a l u e a t c u r r e n t p r i c e s
A n n
u a l g r o w t h r a t e o r c h a n g e o n r e t u
r n
( B i l l i o n s o f d
o l l a r s )
( P e r c e n t )
1 9 9 0
2 0 0 5 – 2 0 0 7
a v e r a g e
2 0 0
8
2 0 0 9
2 0 1 0
1 9 9 1 –
1 9 9 5
1 9 9 6 –
2 0 0 0
2 0 0 1 –
2 0 0 5
2 0 0 9
2 0 1 0
F D I i n
o w s
2 0 7
1 4 7 2
1 7
4 4
1 1 8 5
1 2 4 4
2 2 . 5
4 0 . 1
5 . 3
- 3 2 . 1
4 . 9
F D I o
u t o w s
2 4 1
1 4 8 7
1 9
1 1
1 1 7 1
1 3 2 3
1 6 . 9
3 6 . 3
9 . 1
- 3 8 . 7
1 3 . 1
F D I i n
w a r d s t o c k
2 0 8 1
1 4 4 0 7
1 5 2
9 5
1 7 9 5 0
1 9 1 4 1
9 . 4
1 8 . 8
1 3 . 4
1 7 . 4
6 . 6
F D I o
u t w a r d s t o c k
2 0 9 4
1 5 7 0 5
1 5 9
8 8
1 9 1 9 7
2 0 4 0 8
1 1 . 9
1 8 . 3
1 4 . 7
2 0 . 1
6 . 3
I n c o m
e o n i n w a r d F D I
7 5
9 9 0
1 0 6 6
9 4 5
1 1 3 7
3 5 . 1
1 3 . 1
3 2 . 0
- 1 1 . 3
2 0 . 3
R a t e o f r e t u r n o n i n w a r d F D I
6 . 6
5 . 9
7
. 3
7 . 0
7 . 3
- 0 . 5
0 . 0
0 . 1
- 0 . 3
0 . 3
I n c o m
e o n o u t w a r d F D I
1 2 2
1 0 8 3
1 1 1 3
1 0 3 7
1 2 5 1
1 9 . 9
1 0 . 1
3 1 . 3
- 6 . 8
2 0 . 6
R a t e o f r e t u r n o n o u t w a r d F D I
7 . 3
6 . 2
7
. 0
6 . 9
7 . 2
- 0 . 4
0 . 0
0 . 0
- 0 . 2
0 . 3
C r o s s
- b o r d e r M & A s
9 9
7 0 3
7 0 7
2 5 0
3 3 9
4 9 . 1
6 4 . 0
0 . 6
- 6 4 . 7
3 5 . 7
S a l e s
o o r e i g n a f l i a t e s
5 1 0 5
2 1 2 9 3
3 3 3 0 0
3 0 2 1 3
3 2 9 6 0
8 . 2
7 . 1
1 4 . 9
- 9 . 3
9 . 1
V a l u e
- a d d e d ( p r o d u c t ) o o r e i g n a f l i a t e s
1 0 1 9
3 5 7 0
6 2 1 6
6 1 2 9
6 6 3 6
3 . 6
7 . 9
1 0 . 9
- 1 . 4
8 . 3
T o t a l
a s s e t s o o r e i g n a f l i a t e s
4 6 0 2
4 3 3 2 4
6 4 4 2 3
5 3 6 0 1
5 6 9 9 8
1 3 . 1
1 9 . 6
1 5 . 5
- 1 6 . 8
6 . 3
E x p o r t s o o r e i g n a f l i a t e s
1 4 9 8
5 0 0 3
6 5 9 9
5 2 6 2
6 2 3 9
8 . 6
3 . 6
1 4 . 7
- 2 0 . 3
1 8 . 6
E m p l o y m e n t b y o r e i g n a f l i a t e s ( t h o u s a n d s )
2 1 4 7 0
5 5 0 0 1
6 4 4 8 4
6 6 6 8 8
6 8 2 1 8
2 . 9
1 1 . 8
4 . 1
3 . 4
2 . 3
G D P
2 2 2 0 6
5 0 3 3 8
6 1 1 4 7
5 7 9 2 0
6 2 9 0 9
6 . 0
1 . 4
9 . 9
- 5 . 3
8 . 6
G r o s s
f x e d c a p i t a l o r m a t i o n
5 1 0 9
1 1 2 0 8
1 3 9 9 9
1 2 7 3 5
1 3 9 4 0
5 . 1
1 . 3
1 0 . 7
- 9 . 0
9 . 5
R o y a l t i e s a n d l i c e n c e e e r e c e i p t s
2 9
1 5 5
1 9 1
1 8 7
1 9 1
1 4 . 6
1 0 . 0
1 3 . 6
- 1 . 9
1 . 7
E x p o r t s o g o o d s a n d n o n -
a c t o r s e r v i c e s
4 3 8 2
1 5 0 0 8
1 9 7 9 4
1 5 7 8 3
1 8 7 1 3
8 . 1
3 . 7
1 4 . 7
- 2 0 . 3
1 8 . 6
S o u
r c e : U N C T A D ,
W o r d I n v e s t m e
n t R e p o r t 2 0 1 1 .
8/4/2019 Unctad 2011 Wir Overview
http://slidepdf.com/reader/full/unctad-2011-wir-overview 17/41
World Investment Report 20116
Table 3. Distribution of State-owned TNCs by home region/economy, 2010
Region/economy Number Share
World 653 100Developed countries 286 43.8
European Union 223 34.2Denmark 36 5.5Finland 21 3.2France 32 4.9Germany 18 2.8Poland 17 2.6Sweden 18 2.8Others 81 12.4
Other European countries 41 6.3Norway 27 4.1
Switzerland 11 1.7Others 3 0.5
United States 3 0.5Other developed countries 18 2.8
Japan 4 0.6Others 14 2.1
Developing economies 345 52.8 Africa 82 12.6
South Africa 54 8.3Others 28 4.3
Latin America and the Caribbean 28 4.3Brazil 9 1.4
Others 19 2.9 Asia 235 36.0West Asia 70 10.7
Kuwait 19 2.9United Arab Emirates 21 3.2Others 30 4.6
South, East and South-East Asia 165 25.3China 50 7.7India 20 3.1Iran, Islamic Republic of 10 1.5Malaysia 45 6.9Singapore 9 1.4Others 31 4.7
South-East Europe and the CIS 23 3.5Russian Federation 14 2.1Others 9 1.4
Source : UNCTAD, Word Investment Report 2011.
State-owned TNCs constitute a varied group. Developing and transition economies
are home to more than hal o these rms (56 per cent), though developed countries
continue to maintain a signicant number o State-owned TNCs. In contrast to the
general view o State-owned TNCs as largely concentrated in the primary sector,they are diversied and have a strong presence in the services sector.
8/4/2019 Unctad 2011 Wir Overview
http://slidepdf.com/reader/full/unctad-2011-wir-overview 18/41
7Overview
Uneven perormance across regions
The rise o FDI to developing countries masks signicant regional dierences. Some
o the poorest regions continued to see declines in FDI fows. Flows to Arica, least
developed countries (LDCs), landlocked developing countries (LLDCs) and small
island developing States (SIDS) continued to all, as did those to South Asia. At the
same time, major emerging regions, such as East and South-East Asia and Latin
America, experienced strong growth in FDI infows (table 1).
FDI fows to Arica ell by 9 per cent in 2010. At $55 billon, the share o Arica
in total global FDI infows was 4.4 per cent in 2010, down rom 5.1 per cent in
2009 (table 1). FDI to the primary sector, especially in the oil industry, continued todominate FDI fows to the continent. It accounted or the rise o Ghana as a major
host country, as well as or the declines o infows to Angola and Nigeria. Although
the continuing pursuit o natural resources, in particular by Asian TNCs, is likely to
sustain FDI fows to sub-Saharan Arica, political uncertainty in North Arica is likely
to make 2011 another challenging year or the continent as a whole.
Although there is some evidence that intraregional FDI is beginning to emerge in
non-natural resource related industries, intraregional FDI fows in Arica are still
limited in terms o volume and industry diversity. Harmonization o Arica’s regionaltrade agreements and inclusion o FDI regimes could help Arica achieve more o
its intraregional FDI potential.
Infows to East Asia, South-East Asia and South Asia as a whole rose by 24 per
cent in 2010, reaching $300 billion. However, the three subregions experienced
very dierent trends: infows to ASEAN more than doubled; those to East Asia saw
a 17 per cent rise; FDI to South Asia declined by one-ourth.
Infows to China, the largest recipient o FDI in the developing world, climbed
by 11 per cent, to $106 billion. With continuously rising wages and production
costs, however, oshoring o labour-intensive manuacturing to the country has
slowed down, and FDI infows continue to shit towards high-tech industries and
services. In contrast, some ASEAN member States, such as Indonesia and Viet
Nam, have gained ground as low-cost production locations, especially or low-end
manuacturing.
The decline o FDI to South Asia refects a 31 per cent slide in infows to India
and a 14 per cent drop in Pakistan. In India, the setback in attracting FDI waspartly due to macroeconomic concerns. At the same time, infows to Bangladesh,
8/4/2019 Unctad 2011 Wir Overview
http://slidepdf.com/reader/full/unctad-2011-wir-overview 19/41
World Investment Report 20118
an increasingly important low-cost production location in South Asia, jumped by
30 per cent to $913 million.
FDI outfows rom South, East and South-East Asia grew by 20 per cent to about$232 billion in 2010. In recent years, rising FDI outfows rom developing Asia
demonstrate new and diversied industrial patterns. In extractive industries, new
investors have emerged, including conglomerates such as CITIC (China) and
Reliance Group (India), and sovereign wealth unds, such as China Investment
Corporation and Temasek Holdings (Singapore). Metal companies in the region
have been particularly active in ensuring access to overseas mineral assets, such
as iron ore and copper. In manuacturing, Asian companies have been actively
taking over large companies in the developed world, but ace increasing politicalobstacles. FDI outfows in the services sector have declined, but M&As in such
industries as telecommunications have been increasing.
FDI fows to West Asia in 2010 continued to be aected by the global economic
crisis, alling by 12 per cent, but they are expected to bottom out in 2011. However,
concerns about political instability in the region are likely to dampen the recovery.
FDI outfows rom West Asia dropped by 51 per cent in 2010. Outward investment
rom West Asia is mainly driven by government-controlled entities, which have been
redirecting some o their national oil surpluses to support their home economies.
The economic diversication policies o these countries has been pursued through
a dual strategy: investing in other Arab countries to bolster their small domestic
economies; and also investing in developed countries to seek strategic assets or
the development and diversication o the industrial capabilities back at home.
Increasingly this policy has been pursued with a view to creating productive
capabilities that are missing at home, such as motor vehicles, alternative energies,
electronics and aerospace. This approach diers rom that o other countries,
which have generally sought to develop a certain level o capacity at home, beoreengaging in outward direct investment.
FDI fows to Latin America and the Caribbean increased by 13 per cent in 2010.
The strongest increase was registered in South America, where the growth rate
was 56 per cent, with Brazil particularly buoyant. FDI outfows rom Latin America
and the Caribbean increased by 67 per cent in 2010, mostly due to large cross-
border M&A purchases by Brazilian and Mexican TNCs.
Latin America and the Caribbean also witnessed a surge o investments bydeveloping Asian TNCs particularly in resource-seeking projects. In 2010,
8/4/2019 Unctad 2011 Wir Overview
http://slidepdf.com/reader/full/unctad-2011-wir-overview 20/41
9Overview
acquisitions by Asian TNCs jumped to $20 billion, accounting or more than 60 per
cent o total FDI to the region. This has raised concerns in some countries in the
region about the trade patterns, with South America exporting mostly commoditiesand importing manuactured goods.
FDI fows to transition economies declined slightly in 2010. Flows to the
Commonwealth o Independent States (CIS) rose marginally by 0.4 per cent.
Foreign investors continue to be attracted to the ast-growing local consumer
market, especially in the Russian Federation where fows rose by 13 per cent to
$41 billion. In contrast, FDI fows to South-East Europe dropped sharply or the
third consecutive year, due partly to sluggish investment rom EU countries.
South–East interregional FDI is growing rapidly. TNCs based in transition econo-
mies and in developing economies have increasingly ventured into each other’s
markets. For example, the share o developing host countries in greeneld invest-
ment projects by TNCs rom transition economies rose to 60 per cent in 2010 (up
rom only 28 per cent in 2004), while developing-country outward FDI in transition
economies increased more than ve times over the past decade. Kazakhstan and
the Russian Federation are the most important targets o developing-country inves-
tors, whereas China and Turkey are the most popular destinations or FDI rom tran-
sition economies. Such South–East interregional FDI has beneted rom outwardFDI support rom governments through, among others, regional cooperation (e.g.
the Shanghai Cooperation Organization) and bilateral partnerships.
FDI ows to the poorest regions continue to all
In contrast to the FDI boom in developing countries as a whole, FDI infows to the 48
LDCs declined overall by a urther 0.6 per cent in 2010 – a matter o grave concern.
The distribution o FDI fows among LDCs also remains highly uneven, with over 80
per cent o LDC FDI fows going to resource-rich economies in Arica. However, this
picture is distorted by the highly capital-intensive nature o resource projects. Some
40 per cent o investments, by number, were in the orm o greeneld projects in the
manuacturing sector and 16 per cent in services.
On the occasion o the 2011 Fourth United Nations Conerence on the Least
Developed Countries, UNCTAD proposed a plan o action or investment in
LDCs. The emphasis is on an integrated policy approach to investment, technical
capacity-building and enterprise development, with ve areas o action: public-private inrastructure development; aid or productive capacity; building on LDC
8/4/2019 Unctad 2011 Wir Overview
http://slidepdf.com/reader/full/unctad-2011-wir-overview 21/41
World Investment Report 201110
investment opportunities; local business development and access to nance; and
regulatory and institutional reorm.
Landlocked developing countries (LLDCs) saw their FDI infows all by 12 per cent
to $23 billion in 2010. These countries are traditionally marginal FDI destinations,
and they accounted or only 4 per cent o total FDI fows to the developing world.
With intensied South–South economic cooperation and increasing capital fows
rom emerging markets, prospects or FDI fows to the group may improve.
FDI infows to small island developing States (SIDS) as a whole declined slightly by
1 per cent in 2010, to $4.2 billion. As these countries are particularly vulnerable to
the eects o climate change, SIDS are looking to attract investment rom TNCsthat can make a contribution to climate change adaptation, by mobilizing nancial
and technological resources, implementing adaptation initiatives, and enhancing
local adaptive capacities.
FDI to developed countries remains well below pre-crisislevels
In 2010, FDI infows in developed countries declined marginally. The pattern o FDI infows was uneven among subregions. Europe suered a sharp all. Declining
FDI fows were also registered in Japan. A gloomier economic outlook, austerity
measures and possible sovereign debt crisis, as well as regulatory concerns, were
among the actors hampering the recovery o FDI fows. Infows to the United States,
however, showed a strong turnaround, with an increase o more than 40 per cent.
In developed countries, the restructuring o the banking industry, driven by
regulatory authorities, has resulted in a series o signicant divestments o oreignassets. At the same time, it has also generated new FDI as assets changed hands
among major players. The global eorts towards the reorm o the nancial system
and the exit strategy o governments are likely to have a large bearing on FDI fows
in the nancial industry in coming years.
The downward trend in outward FDI rom developed countries reversed, with a 10
per cent increase over 2009. However, this took it to only hal the level o its 2007
peak. The reversal was largely due to higher M&A values, acilitated by strongerbalance sheets o TNCs and historic low rates o debt nancing.
8/4/2019 Unctad 2011 Wir Overview
http://slidepdf.com/reader/full/unctad-2011-wir-overview 22/41
11Overview
INVESTMENT POLICY TRENDS
National policies: mixed messages
More than two-thirds o reported investment policy measures in 2010 were in the
area o FDI liberalization and promotion. This was the case or Asia in particular,
where a relatively high number o measures eased entry and establishment
conditions or oreign investment. Most promotion and acilitation measures
were adopted by governments in Arica and Asia. These measures included the
streamlining o admission procedures and the opening o new, or the expansion o
existing, special economic zones.
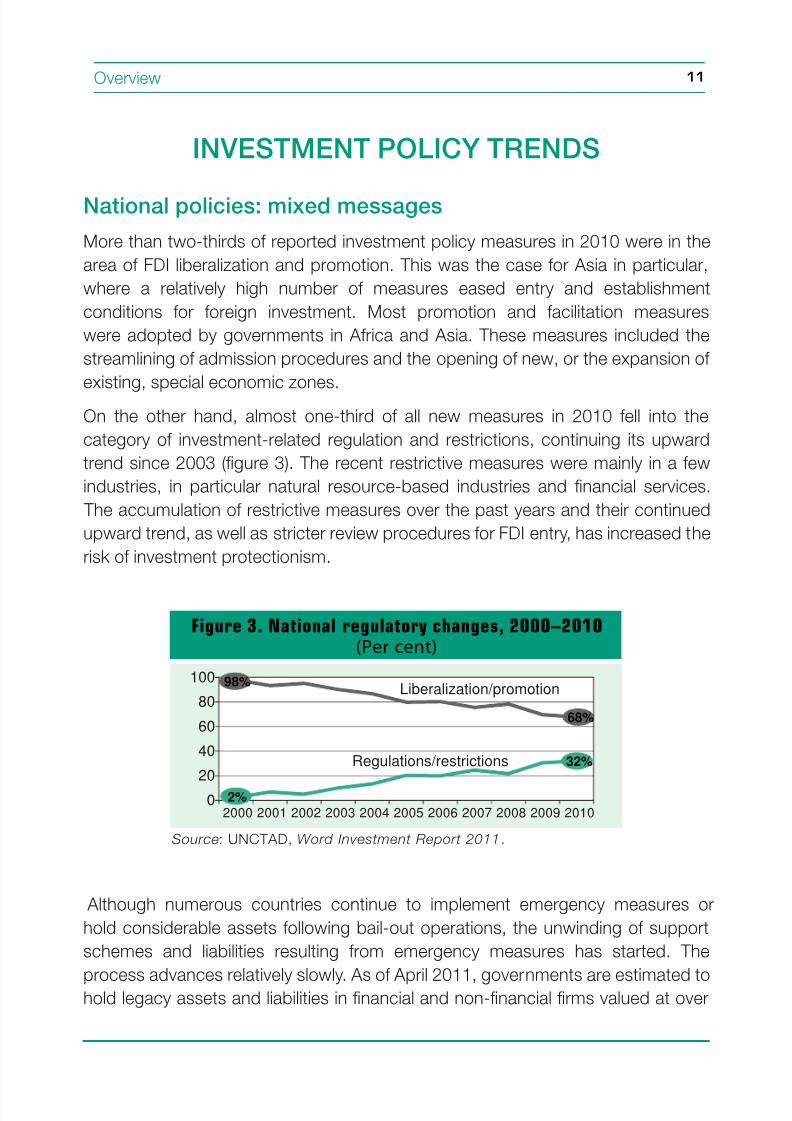
On the other hand, almost one-third o all new measures in 2010 ell into the
category o investment-related regulation and restrictions, continuing its upward
trend since 2003 (gure 3). The recent restrictive measures were mainly in a ew
industries, in particular natural resource-based industries and nancial services.
The accumulation o restrictive measures over the past years and their continued
upward trend, as well as stricter review procedures or FDI entry, has increased the
risk o investment protectionism.
Figure 3. National regulatory changes, 2000–2010(Per cent)
0
20
40
60
80
100
2000 2001 2002 2003 2004 2005 2006 2007 2008 2009 2010
Liberalization/promotion
Regulations/restrictions
98%
2%
68%
32%
Source : UNCTAD, Word Investment Report 2011.
Although numerous countries continue to implement emergency measures or
hold considerable assets ollowing bail-out operations, the unwinding o support
schemes and liabilities resulting rom emergency measures has started. The
process advances relatively slowly. As o April 2011, governments are estimated tohold legacy assets and liabilities in nancial and non-nancial rms valued at over
8/4/2019 Unctad 2011 Wir Overview
http://slidepdf.com/reader/full/unctad-2011-wir-overview 23/41
World Investment Report 201112
$2 trillion. By ar the largest share relates to several hundred rms in the nancial
sector. All this indicates a potential wave o privatizations in the years to come.
The international investment regime: too much and too little
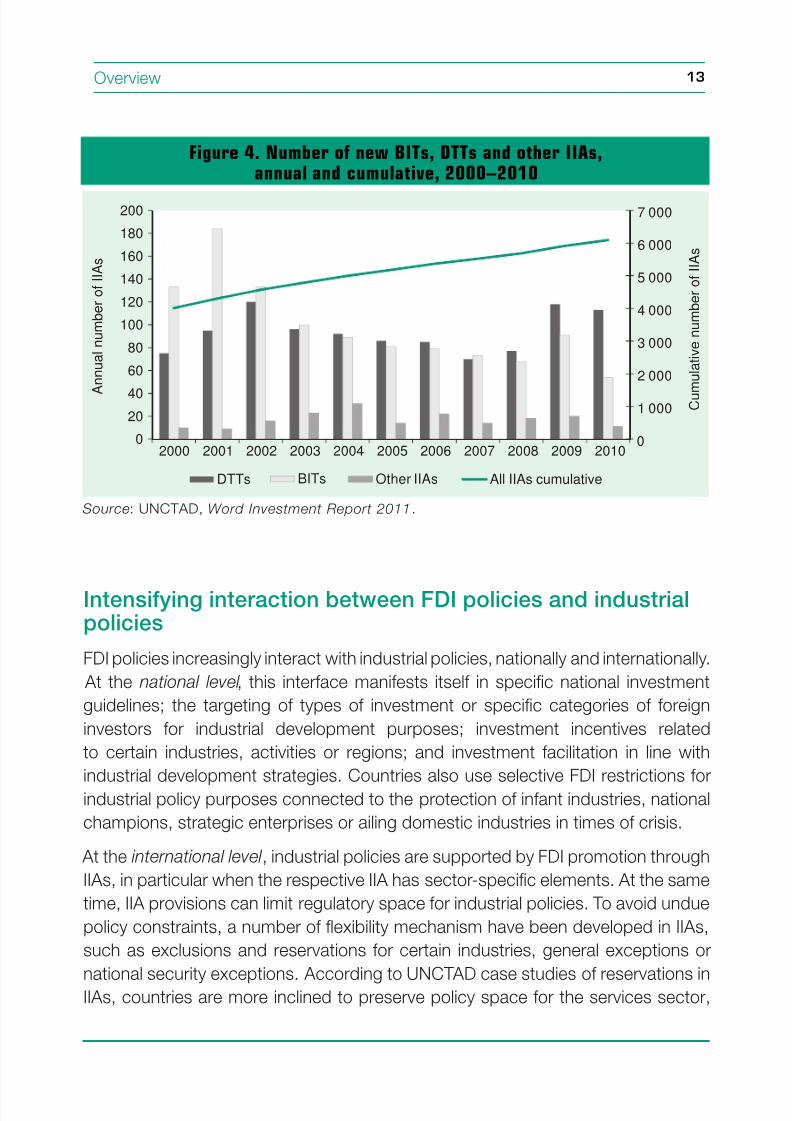
With a total o 178 new IIAs in 2010 – more than three new treaties per week –
the IIA universe reached 6,092 agreements at the end o the year (gure 4). This
trend o treaty expansion is expected to continue in 2011, the rst ve months
o which saw 48 new IIAs, with more than 100 IIAs currently under negotiation.
How the FDI-related competence shit rom EU member States to the European
level will aect the overall IIA regime is still unclear (EU member States currently
have more than 1,300 BITs with non-EU countries). At least 25 new treaty-based
investor–State dispute settlement cases were initiated in 2010 and 47 decisions
rendered, bringing the total o known cases to 390, and those closed to 197. The
overwhelming majority o these cases were initiated by investors rom developed
countries, with developing countries most oten on the receiving end. The 2010
awards urther tilted the overall balance in avour o the State, with 78 cases won
against 59 lost.
As countries continue concluding IIAs, sometimes with novel provisions aimedat rebalancing the rights and obligations between States and rms, and ensuring
coherence between IIAs and other public policies, the policy discourse about
the uture orientation o the IIA regime and how to make IIAs better contribute to
sustainable development is intensiying. Nationally, this maniests itsel in a growing
dialogue among a broad set o investment stakeholders, including civil society,
business and parliamentarians. Internationally, inter-governmental debates in
UNCTAD’s 2010 World Investment Forum, UNCTAD’s Investment Commission and
the joint OECD-UNCTAD investment meetings serve as examples.
With thousands o treaties, many ongoing negotiations and multiple dispute-
settlement mechanisms, today’s IIA regime has come close to a point where it is
too big and complex to handle or governments and investors alike. Yet it oers
protection to only two-thirds o global FDI stock and covers only one-th o possible
bilateral investment relationships. To provide ull coverage a urther 14,100 bilateral
treaties would be required. This raises questions not only about the eorts needed
to complete the global IIA network, but also about the impact o the IIA regime and
its eectiveness or promoting and protecting investment, and about how to ensurethat IIAs deliver on their development potential.
8/4/2019 Unctad 2011 Wir Overview
http://slidepdf.com/reader/full/unctad-2011-wir-overview 24/41
13Overview
Intensiying interaction between FDI policies and industrialpolicies
FDI policies increasingly interact with industrial policies, nationally and internationally.
At the national level , this interace maniests itsel in specic national investment
guidelines; the targeting o types o investment or specic categories o oreign
investors or industrial development purposes; investment incentives related
to certain industries, activities or regions; and investment acilitation in line with
industrial development strategies. Countries also use selective FDI restrictions orindustrial policy purposes connected to the protection o inant industries, national
champions, strategic enterprises or ailing domestic industries in times o crisis.
At the international level , industrial policies are supported by FDI promotion through
IIAs, in particular when the respective IIA has sector-specic elements. At the same
time, IIA provisions can limit regulatory space or industrial policies. To avoid undue
policy constraints, a number o fexibility mechanism have been developed in IIAs,
such as exclusions and reservations or certain industries, general exceptions or
national security exceptions. According to UNCTAD case studies o reservations inIIAs, countries are more inclined to preserve policy space or the services sector,
Figure 4. Number of new BITs, DTTs and other IIAs,annual and cumulative, 2000–2010
0
1 000
2 000
3 000
4 000
5 000
6 000
7 000
0
20
40
60
80
100
120
140
160
180
200
2000 2001 2002 2003 2004 2005 2006 2007 2008 2009 2010
DTTs BITs Other IIAs All IIAs cumulative
A
n n u a
l n
u m
b e r
o f
I I A s
C u m
u l a t i v e n u m
b e r
o f
I I A s
Source : UNCTAD, Word Investment Report 2011.
8/4/2019 Unctad 2011 Wir Overview
http://slidepdf.com/reader/full/unctad-2011-wir-overview 25/41
World Investment Report 201114
compared to the primary and manuacturing sectors. Within the services sector,
most reservations exist in transportation, nance and communication.
The overall challenge is to manage the interaction between FDI policies andindustrial policies, so as to make the two policies work or development. There is a
need to strike a balance between building stronger domestic productive capacity
on the one hand and preventing investment and trade protectionism on the other.
Better international coordination can contribute to avoiding “beggar thy neighbour”
policies and creating synergies or global cooperation.
CSR standards increasingly inuence investment policies
Over the past years, corporate social responsibility (CSR) standards have emerged
as a unique dimension o “sot law”. These CSR standards typically ocus on the
operations o TNCs and, as such, are increasingly signicant or international
investment as eorts to rebalance the rights and obligations o the State and the
investor intensiy. TNCs in turn, through their oreign investments and global value
chains, can infuence the social and environmental practices o business worldwide.
The current landscape o CSR standards is multilayered, multiaceted, and
interconnected. The standards o the United Nations, the ILO and the OECD serve
to dene and provide guidance on undamental CSR. In addition there are dozens
o international multi-stakeholder initiatives (MSIs), hundreds o industry association
initiatives and thousands o individual company codes providing standards or the
social and environmental practices o rms at home and abroad.
CSR standards pose a number o systemic challenges. A undamental challenge
aecting most CSR standards is ensuring that companies actually comply with
their content. Moreover, there are gaps, overlaps and inconsistencies between
standards in terms o global reach, subjects covered, industry ocus and uptake
among companies. Voluntary CSR standards can complement government
regulatory eorts, but they can also undermine, substitute or distract rom these.
Finally, corporate reporting on perormance relative to CSR standards continues to
lack standardization and comparability.
Governments can play an important role in creating a coherent policy and institutional
ramework to address the challenges and opportunities presented by the universe
o CSR standards. Policy options or promoting CSR standards include supporting
the development o new CSR standards; applying CSR standards to governmentprocurement; building capacity in developing countries to adopt CSR standards;
8/4/2019 Unctad 2011 Wir Overview
http://slidepdf.com/reader/full/unctad-2011-wir-overview 26/41
15Overview
promoting the uptake o CSR reporting and responsible investment; adopting CSR
standards as part o regulatory initiatives; strengthening the compliance promotion
mechanisms o existing international standards; and actoring CSR standards intoIIAs. The various approaches already underway increasingly mix regulatory and
voluntary instruments to promote responsible business practices.
While CSR standards generally aim to promote sustainable development goals,
in the context o international production care needs to be taken to avoid them
becoming barriers to trade and investment. The objective o promoting investment
can be rhymed with CSR standards. Discussions on responsible investment
are ongoing in the international community. For example, in 2010, G-20 leaders
encouraged countries and companies to uphold the Principles or Responsible Agricultural Investment (PRAI) that were developed by UNCTAD, the World Bank,
IFAD and FAO, requesting these organizations to develop options or promoting
responsible investment in agriculture.
NON-EQUITY MODES OF INTERNATIONALPRODUCTION AND DEVELOPMENT
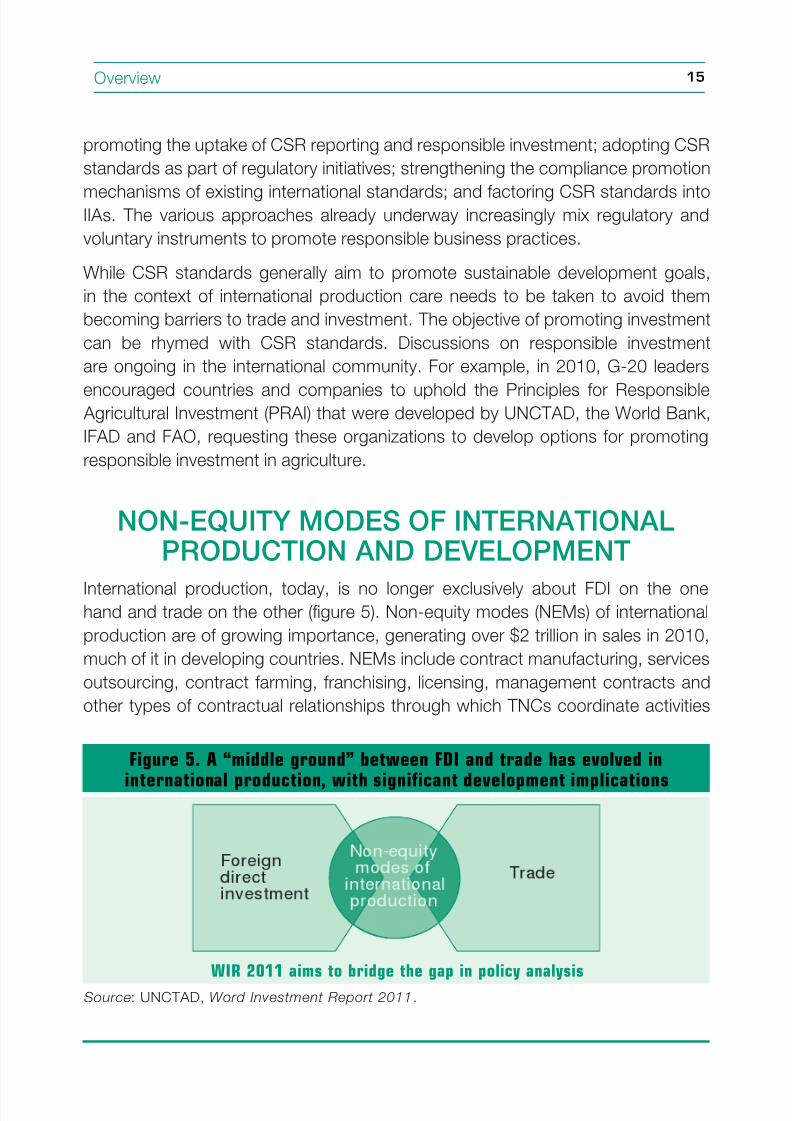
International production, today, is no longer exclusively about FDI on the onehand and trade on the other (gure 5). Non-equity modes (NEMs) o international
production are o growing importance, generating over $2 trillion in sales in 2010,
much o it in developing countries. NEMs include contract manuacturing, services
outsourcing, contract arming, ranchising, licensing, management contracts and
other types o contractual relationships through which TNCs coordinate activities
Figure 5. A “middle ground” between FDI and trade has evolved in
international production, with significant development implications
Source : UNCTAD, Word Investment Report 2011.
WIR 2011 aims to bridge the gap in policy analysis
8/4/2019 Unctad 2011 Wir Overview
http://slidepdf.com/reader/full/unctad-2011-wir-overview 27/41
World Investment Report 201116
in their global value chains (GVCs) and infuence the management o host-country
rms without owning an equity stake in those rms.
From a development perspective, both NEM partnerships and oreign aliates(i.e. FDI) can enable host countries to integrate into GVCs. A key advantage o
NEMs is that they are fexible arrangements with local rms, with a built-in motive or
TNCs to invest in the viability o their partners through dissemination o knowledge,
technology and skills. This oers host economies considerable potential or long-
term industrial capacity building through a number o key channels o development
impact such as employment, value added, export generation and technology
acquisition (table 4). On the other hand, by establishing a local aliate through FDI,
a TNC signals its long-term commitment to a host economy. Attracting FDI is alsothe better option or economies with limited existing productive capacity.
NEMs may be more appropriate than FDI in sensitive situations. In agriculture, or
example, contract arming is more likely to address responsible investment issues
– respect or local rights, livelihoods o armers and sustainable use o resources –
than large-scale land acquisition.
For developing country policymakers, the rise o NEMs not only creates new
opportunities or productive capacity building and integration into GVCs, there are
also new challenges, as each NEM mode comes with its own set o development
impacts and policy implications.
The TNC “make or buy” decision and NEMs as the “middle-ground” option
Foremost among the core competencies o a TNC is its ability to coordinate
activities within a global value chain. TNCs can decide to conduct such activities
in-house (internalization) or they can entrust them to other rms (externalization)– a choice analogous to a “make or buy” decision. Internalization, where it has a
cross-border dimension, results in FDI, whereby the international fows o goods,
services, inormation and other assets are intra-rm and under ull control o the
TNC. Externalization results in either arm’s-length trade, where the TNC exercises
no control over other rms or, as an intermediate “middle-ground” option, in
non-equity inter-rm arrangements in which contractual agreements and relative
bargaining power condition the operations and behaviour o host-country rms.
Such “conditioning” can have a material impact on the conduct o the business,requiring the host-country rm to, or example, invest in equipment, change
8/4/2019 Unctad 2011 Wir Overview
http://slidepdf.com/reader/full/unctad-2011-wir-overview 28/41
17Overview
processes, adopt new procedures, improve working conditions, or use specied
suppliers.
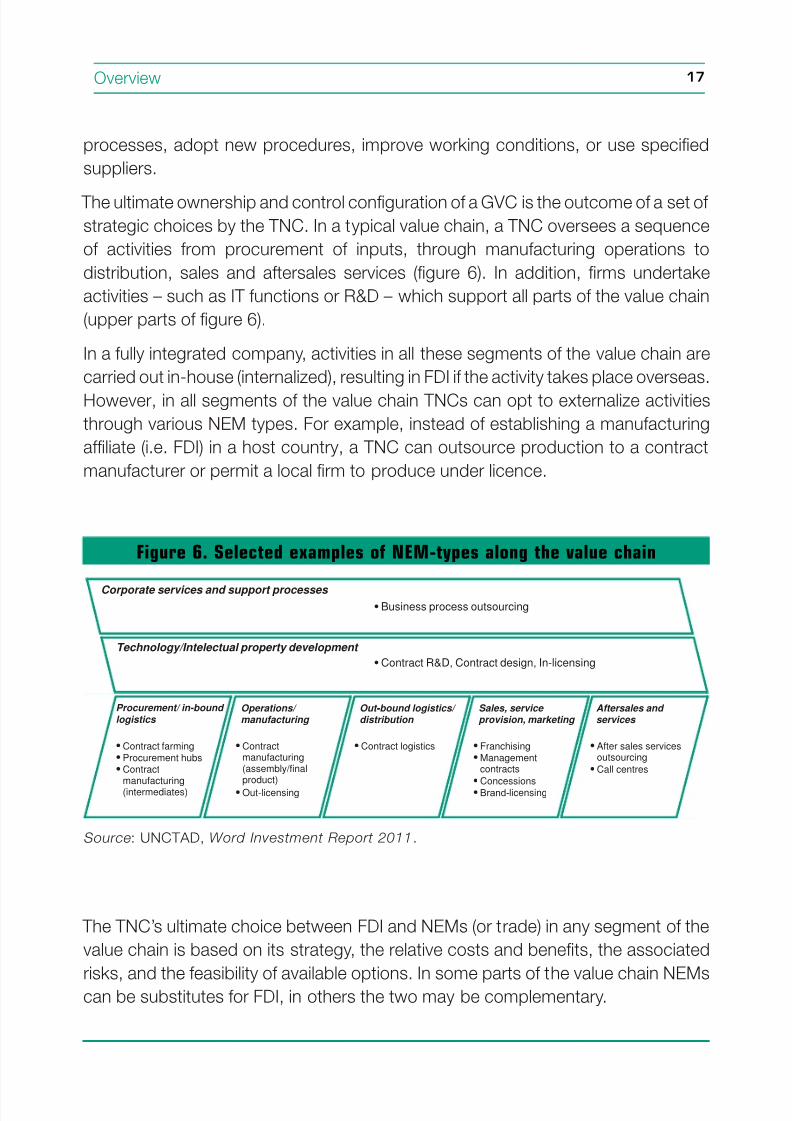
The ultimate ownership and control conguration o a GVC is the outcome o a set o strategic choices by the TNC. In a typical value chain, a TNC oversees a sequence
o activities rom procurement o inputs, through manuacturing operations to
distribution, sales and atersales services (gure 6). In addition, rms undertake
activities – such as IT unctions or R&D – which support all parts o the value chain
(upper parts o gure 6).
In a ully integrated company, activities in all these segments o the value chain are
carried out in-house (internalized), resulting in FDI i the activity takes place overseas.
However, in all segments o the value chain TNCs can opt to externalize activities
through various NEM types. For example, instead o establishing a manuacturing
aliate (i.e. FDI) in a host country, a TNC can outsource production to a contract
manuacturer or permit a local rm to produce under licence.
Figure 6. Selected examples of NEM-types along the value chain
Source : UNCTAD, Word Investment Report 2011.
• Contractmanufacturing(assembly/final
product)• Out-licensing
• Contract logistics • Franchising• Management
contracts
•
Concessions• Brand-licensing
• After sales servicesoutsourcing
• Call centres
• Business process outsourcingCorporate services and support processes
Technology/Intelectual property development
• Contract R&D, Contract design, In-licensing
Operations/ manufacturing
Out-bound logistics/ distribution
- Sales, service provision, marketing
Aftersales and services
• Contract farming• Procurement hubs• Contract
manufacturing(intermediates)
Procurement/ in-bound logistics
The TNC’s ultimate choice between FDI and NEMs (or trade) in any segment o the
value chain is based on its strategy, the relative costs and benets, the associated
risks, and the easibility o available options. In some parts o the value chain NEMscan be substitutes or FDI, in others the two may be complementary.
8/4/2019 Unctad 2011 Wir Overview
http://slidepdf.com/reader/full/unctad-2011-wir-overview 29/41
World Investment Report 201118
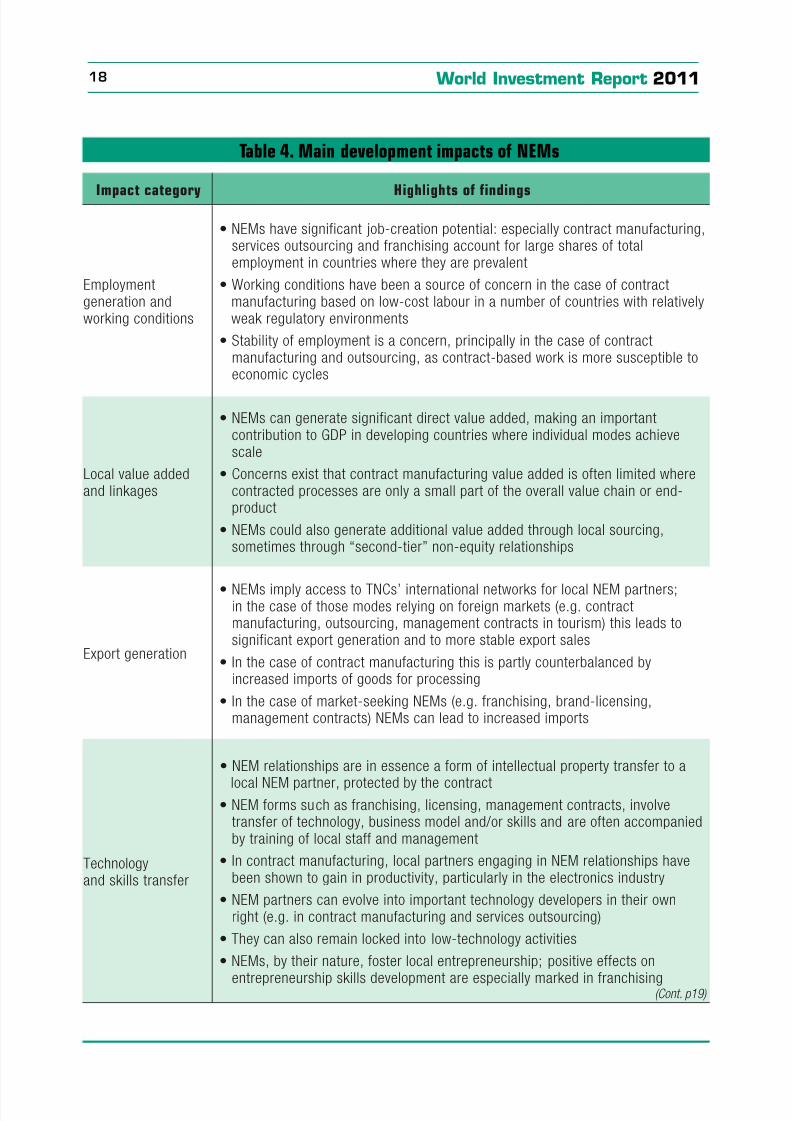
Table 4. Main development impacts o NEMs
Impact category Highlights of findings
Employmentgeneration andworking conditions
• NEMs have significant job-creation potential: especially contract manufacturing,services outsourcing and franchising account for large shares of totalemployment in countries where they are prevalent
• Working conditions have been a source of concern in the case of contractmanufacturing based on low-cost labour in a number of countries with relativelyweak regulatory environments
• Stability of employment is a concern, principally in the case of contractmanufacturing and outsourcing, as contract-based work is more susceptible toeconomic cycles
Local value addedand linkages
• NEMs can generate significant direct value added, making an importantcontribution to GDP in developing countries where individual modes achievescale
• Concerns exist that contract manufacturing value added is often limited wherecontracted processes are only a small part of the overall value chain or end-product
• NEMs could also generate additional value added through local sourcing,sometimes through “second-tier” non-equity relationships
Export generation
• NEMs imply access to TNCs’ international networks for local NEM partners;in the case of those modes relying on foreign markets (e.g. contractmanufacturing, outsourcing, management contracts in tourism) this leads tosignificant export generation and to more stable export sales
• In the case of contract manufacturing this is partly counterbalanced byincreased imports of goods for processing
• In the case of market-seeking NEMs (e.g. franchising, brand-licensing,management contracts) NEMs can lead to increased imports
Technologyand skills transfer
• NEM relationships are in essence a form of intellectual property transfer to a
local NEM partner, protected by the contract• NEM forms such as franchising, licensing, management contracts, involve
transfer of technology, business model and/or skills and are often accompaniedby training of local staff and management
• In contract manufacturing, local partners engaging in NEM relationships havebeen shown to gain in productivity, particularly in the electronics industry
• NEM partners can evolve into important technology developers in their ownright (e.g. in contract manufacturing and services outsourcing)
• They can also remain locked into low-technology activities
• NEMs, by their nature, foster local entrepreneurship; positive effects on
entrepreneurship skills development are especially marked in franchising(Cont. p19)
8/4/2019 Unctad 2011 Wir Overview
http://slidepdf.com/reader/full/unctad-2011-wir-overview 30/41
19Overview
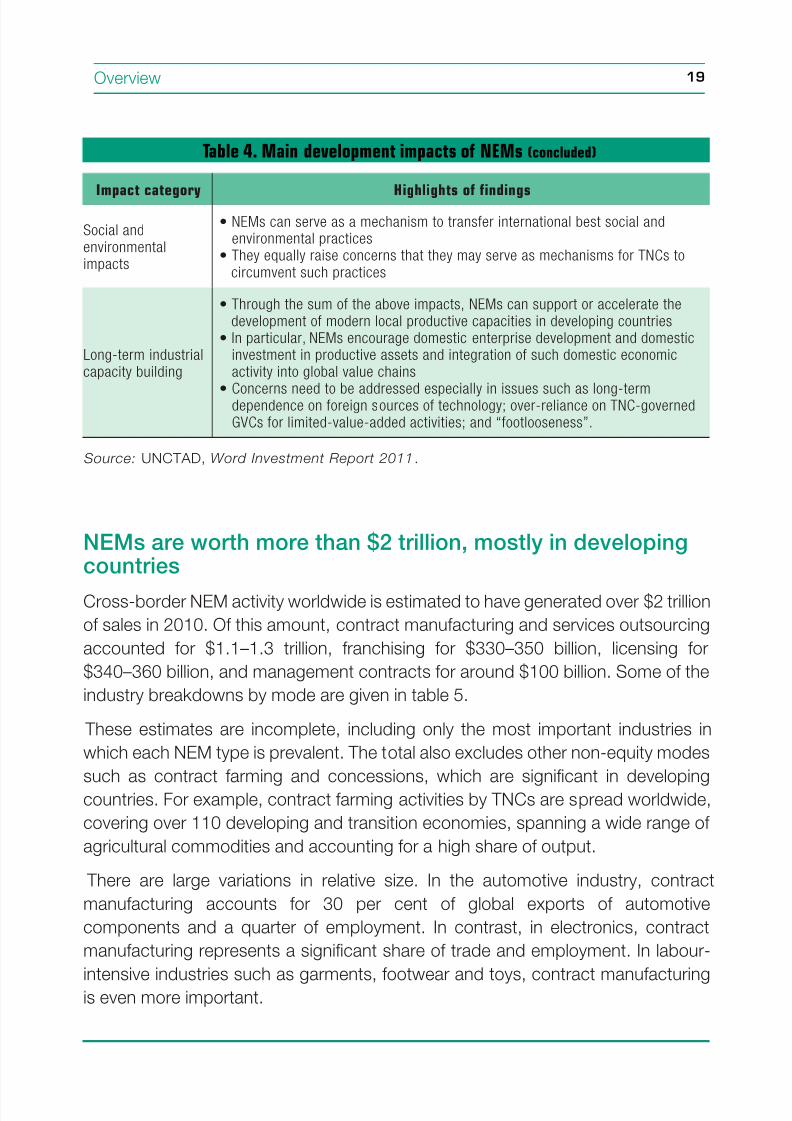
Table 4. Main development impacts o NEMs (concluded)
Impact category Highlights of findings
Social andenvironmentalimpacts
• NEMs can serve as a mechanism to transfer international best social andenvironmental practices
• They equally raise concerns that they may serve as mechanisms for TNCs tocircumvent such practices
Long-term industrialcapacity building
• Through the sum of the above impacts, NEMs can support or accelerate thedevelopment of modern local productive capacities in developing countries
• In particular, NEMs encourage domestic enterprise development and domesticinvestment in productive assets and integration of such domestic economicactivity into global value chains
• Concerns need to be addressed especially in issues such as long-termdependence on foreign sources of technology; over-reliance on TNC-governedGVCs for limited-value-added activities; and “footlooseness”.
Source: UNCTAD, Word Investment Report 2011.
NEMs are worth more than $2 trillion, mostly in developingcountries
Cross-border NEM activity worldwide is estimated to have generated over $2 trillion
o sales in 2010. O this amount, contract manuacturing and services outsourcing
accounted or $1.1–1.3 trillion, ranchising or $330–350 billion, licensing or
$340–360 billion, and management contracts or around $100 billion. Some o the
industry breakdowns by mode are given in table 5.
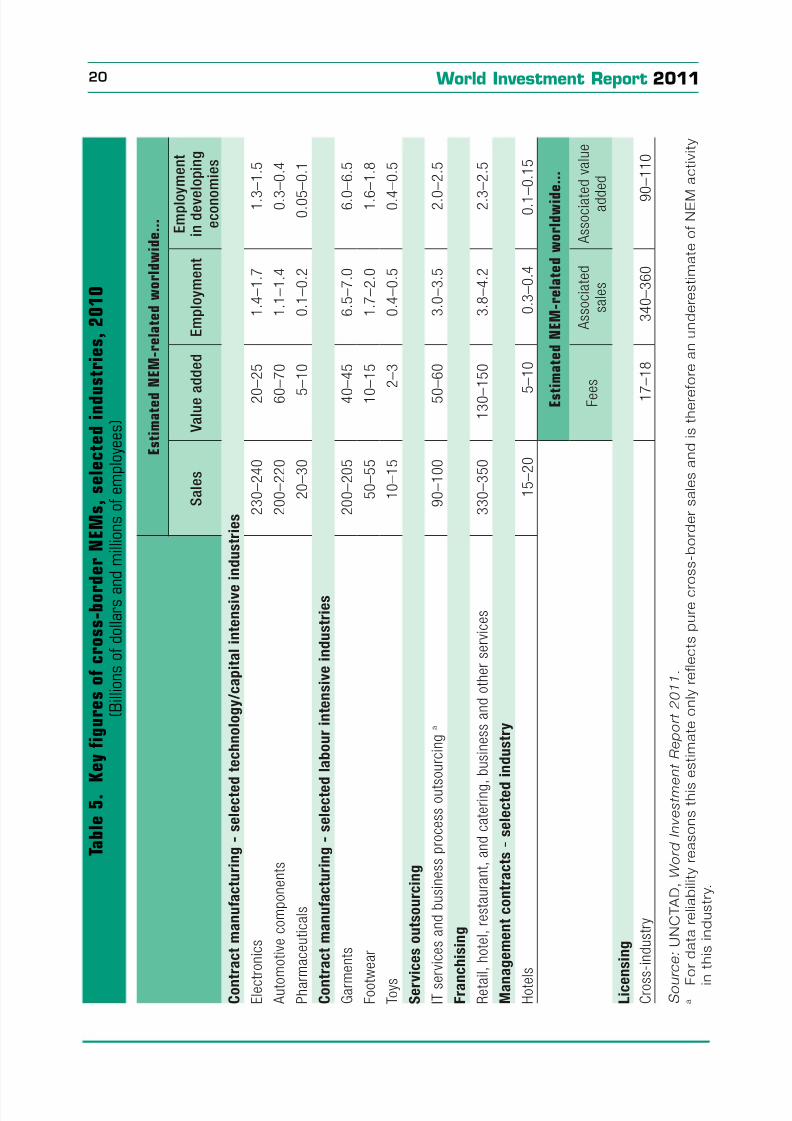
These estimates are incomplete, including only the most important industries in
which each NEM type is prevalent. The total also excludes other non-equity modes
such as contract arming and concessions, which are signicant in developingcountries. For example, contract arming activities by TNCs are spread worldwide,
covering over 110 developing and transition economies, spanning a wide range o
agricultural commodities and accounting or a high share o output.
There are large variations in relative size. In the automotive industry, contract
manuacturing accounts or 30 per cent o global exports o automotive
components and a quarter o employment. In contrast, in electronics, contract
manuacturing represents a signicant share o trade and employment. In labour-
intensive industries such as garments, ootwear and toys, contract manuacturingis even more important.
8/4/2019 Unctad 2011 Wir Overview
http://slidepdf.com/reader/full/unctad-2011-wir-overview 31/41
World Investment Report 201120
T a b l e 5 .
K e y f i g u r e s o f c r o s s - b o r
d e r N E M s ,
s e l e c t e d i n d u
s t r i e s ,
2 0 1 0
( B i l l i o n s o f d o l l a r s a n d m i l l i o n s o f e m p l o y e e s )
E s t i m a t e d
N E M - r e l a t e d w o r l d w i d e . . .
S a l e s
V a l u e a
d d e d
E m p l o y m e n t
E m p l o y m e n t
i n d e v e
l o p i n g
e c o n o
m i e s
C o n t r a c t m a n u f a c t u r i n g - s e l e c t e d t e c h n o l o g y / c a p i t a l i n t e n s i v e
i n d u s t r i e s
E l e c t r o n i c s
2 3 0 –
2 4 0
2 0
– 2 5
1 . 4
– 1
. 7
1 . 3
– 1
. 5
A u t o
m o t i v e c o m p o n e n t s
2 0 0 –
2 2 0
6 0
– 7 0
1 . 1
– 1
. 4
0 . 3
– 0
. 4
P h a r
m a c e u t i c a l s
2 0 –
3 0
5
– 1 0
0 . 1
– 0
. 2
0 . 0 5
– 0
. 1
C o n t r a c t m a n u f a c t u r i n g - s e l e c t e d l a b o u r i n t e n s i v e i n d u s t r i e s
G a r m
e n t s
2 0 0 –
2 0 5
4 0
– 4 5
6 . 5
– 7
. 0
6 . 0
– 6
. 5
F o o t w e a r
5 0 –
5 5
1 0
– 1 5
1 . 7
– 2
. 0
1 . 6
– 1
. 8
T o y s
1 0 –
1 5
2 –
3
0 . 4
– 0
. 5
0 . 4
– 0
. 5
S e r v
i c e s o u t s o u r c i n g
I T s e
r v i c e s a n d b u s i n e s s p r o c e s s o u t s o u r c i n g a
9 0 –
1 0 0
5 0
– 6 0
3 . 0
– 3
. 5
2 . 0
– 2
. 5
F r a n
c h i s i n g
R e t a
i l , h o t e l , r e s t a u r a n t , a n d c a t e r i n g
, b u s i n e s s a n d o t h e r s e r v i c e s
3 3 0 –
3 5 0
1 3 0 –
1 5 0
3 . 8
– 4
. 2
2 . 3
– 2
. 5
M a n
a g e m e n t c o n t r a c t s - s e l e c t e d
i n d u s t r y
H o t e
l s
1 5 –
2 0
5
– 1 0
0 . 3
– 0
. 4
0 . 1
– 0
. 1 5
E s t
i m a t e d N E M - r e l a t e d w o r l d w i d
e . . .
F e e
s
A s s o c i a t e d
s a l e s
A s s o c i a t e d v a l u e
a d d
e d
L i c e
n s i n g
C r o s
s -
i n d u s t r y
1 7
– 1 8
3 4 0 –
3 6 0
9 0 –
1 1 0
S o u
r c e : U N C T A D ,
W o r d I n v e s t m e
n t R e p o r t 2 0 1 1 .
a
F
o r d a t a r e l i a b i l i t y r e a s o n s t h i s
e s t i m a t e o n l y r e f l e c t s p u r e c r
o s s - b o r d e r s a l e s a n d i s t h e r e
f o r e a n u n d e r e s t i m a t e o f N E M
a c t i v i t y
i n
t h i s i n d u s t r y .
8/4/2019 Unctad 2011 Wir Overview
http://slidepdf.com/reader/full/unctad-2011-wir-overview 32/41
21Overview
Putting dierent modes o international production in perspective, cross-border
activity related to selected NEMs o $2 trillion compares with exports o oreign
aliates o TNCs o some $6 trillion in 2010. However, NEMs are particularlyimportant in developing countries. In many industries, developing countries account
or almost all NEM-related employment and exports, compared with their share in
global FDI stocks o 30 per cent and in world trade o less than 40 per cent.
NEMs are also growing rapidly. In most cases, the growth o NEMs outpaces that
o the industries in which they operate. This growth is driven by a number o key
advantages o NEMs or TNCs: (1) the relatively low upront capital expenditures
required and the limited working capital needed or operation; (2) reduced risk
exposure; (3) fexibility in adapting to changes in the business cycle and in demand;and (4) as a basis or externalizing non-core activities that can oten be carried out
at lower cost by other operators.
NEMs generate signifcant ormal employment in developingcountries
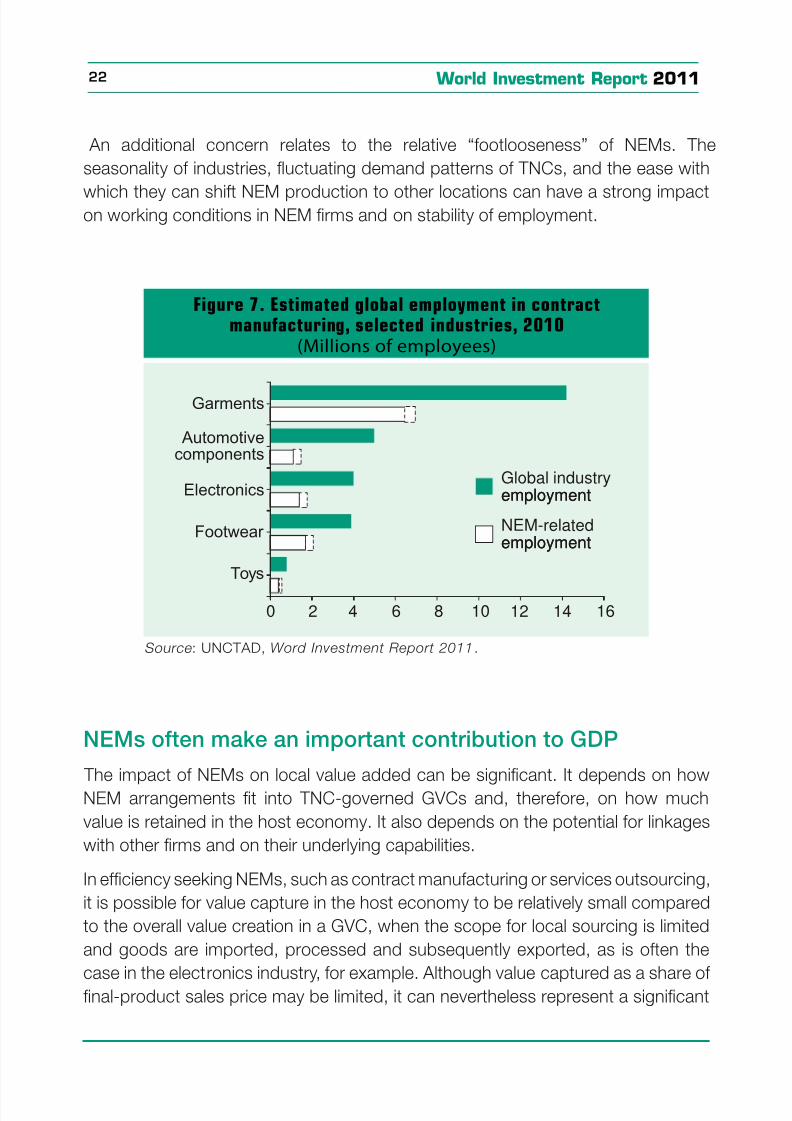
UNCTAD estimates that worldwide some 18–21 million workers are directly em-
ployed in rms operating under NEM arrangements, most o whom are in contractmanuacturing, services outsourcing and ranchising activities (gure 7). Around 80
per cent o NEM-generated employment is in developing and transition economies.
Employment in contract manuacturing and, to a lesser extent, services outsourcing,
is predominantly based in developing countries. The same applies in other NEMs,
although global gures are not available; in Mozambique, or instance, contract
arming has led to some 400,000 smallholders participating in global value chains.
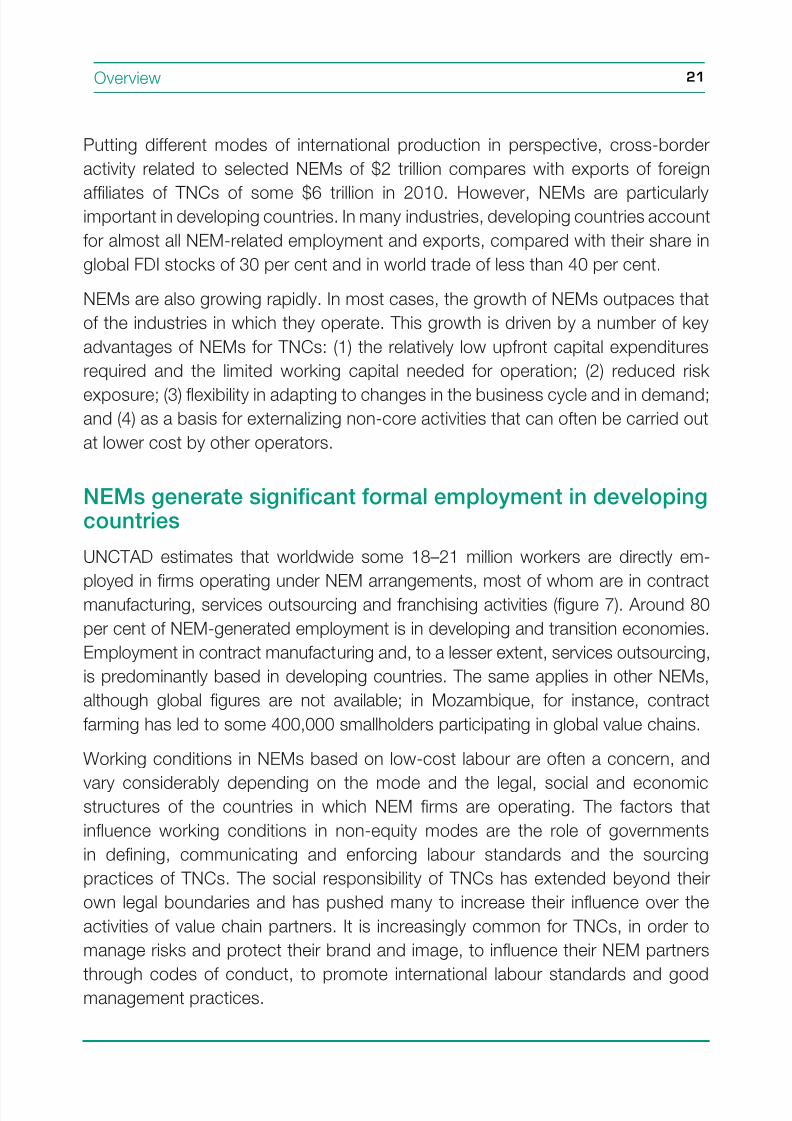
Working conditions in NEMs based on low-cost labour are oten a concern, and
vary considerably depending on the mode and the legal, social and economicstructures o the countries in which NEM rms are operating. The actors that
infuence working conditions in non-equity modes are the role o governments
in dening, communicating and enorcing labour standards and the sourcing
practices o TNCs. The social responsibility o TNCs has extended beyond their
own legal boundaries and has pushed many to increase their infuence over the
activities o value chain partners. It is increasingly common or TNCs, in order to
manage risks and protect their brand and image, to infuence their NEM partners
through codes o conduct, to promote international labour standards and goodmanagement practices.
8/4/2019 Unctad 2011 Wir Overview
http://slidepdf.com/reader/full/unctad-2011-wir-overview 33/41
World Investment Report 201122
An additional concern relates to the relative “ootlooseness” o NEMs. The
seasonality o industries, fuctuating demand patterns o TNCs, and the ease with
which they can shit NEM production to other locations can have a strong impacton working conditions in NEM rms and on stability o employment.
Figure 7. Estimated global employment in contractmanufacturing, selected industries, 2010
(Millions of employees)
Source : UNCTAD, Word Investment Report 2011.
0 2 4 6 8 10 12 14 16
Garments
Automotivecomponents
Electronics
Footwear
Toys
NEM-relatedemploymentemployment
Global industryemploymentemployment
NEMs oten make an important contribution to GDP
The impact o NEMs on local value added can be signicant. It depends on how
NEM arrangements t into TNC-governed GVCs and, thereore, on how much
value is retained in the host economy. It also depends on the potential or linkages
with other rms and on their underlying capabilities.
In eciency seeking NEMs, such as contract manuacturing or services outsourcing,
it is possible or value capture in the host economy to be relatively small compared
to the overall value creation in a GVC, when the scope or local sourcing is limited
and goods are imported, processed and subsequently exported, as is oten the
case in the electronics industry, or example. Although value captured as a share o nal-product sales price may be limited, it can nevertheless represent a signicant
8/4/2019 Unctad 2011 Wir Overview
http://slidepdf.com/reader/full/unctad-2011-wir-overview 34/41
23Overview
Figure 8. World and NEM-related exports,selected industries, 2010
(Billions of dollars)
Source : UNCTAD, Word Investment Report 2011.0 50 100 150 200 250 300 350 400 450
Electronics
Garments
Automotivecomponents
Footwear
Toys
World exports
NEM exports
contribution to the local economy, adding up to 10–15 per cent o GDP in some
countries.
Local sourcing and the overall impact on host-country value added increases i the emergence o contract manuacturing leads to a concentration o production
and export activities (e.g. in clusters or industrial parks). The greater the number
o plants and the more numerous the linkages with TNCs, the greater will be the
spillover eects and local value added. In addition, clustering can reduce the risk o
TNCs shiting production to other locations by increasing switching costs.
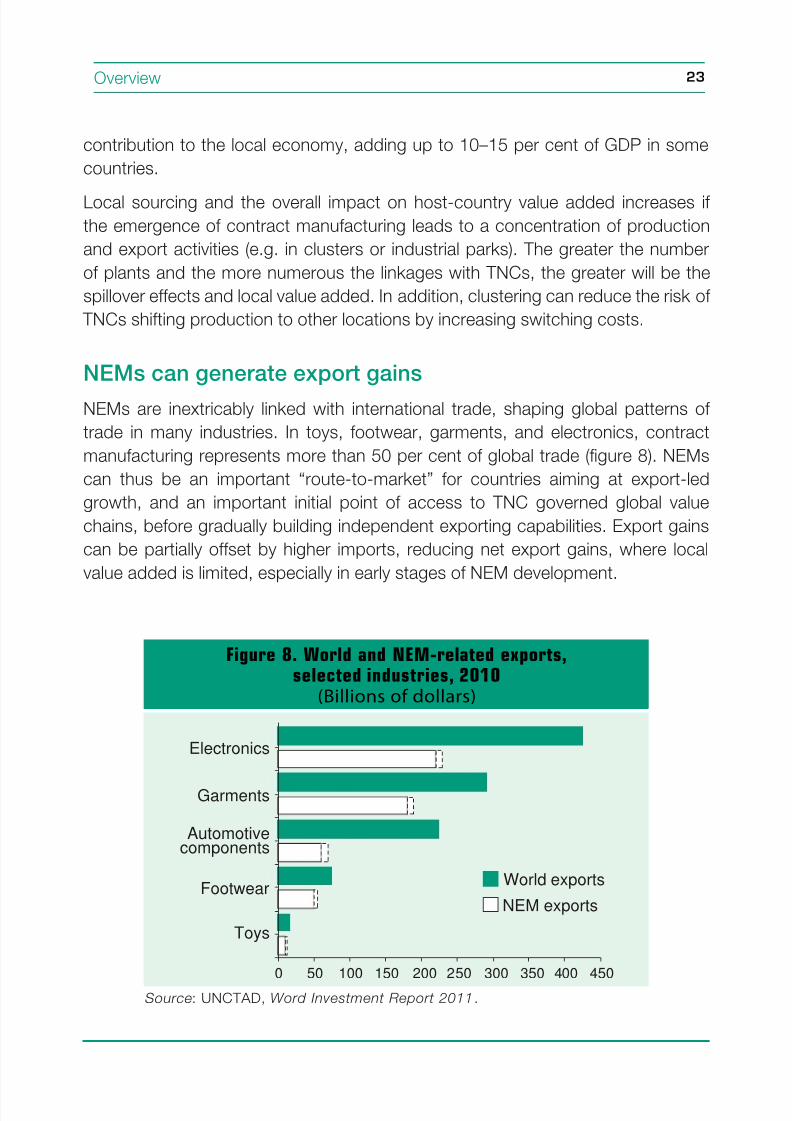
NEMs can generate export gains
NEMs are inextricably linked with international trade, shaping global patterns o
trade in many industries. In toys, ootwear, garments, and electronics, contract
manuacturing represents more than 50 per cent o global trade (gure 8). NEMs
can thus be an important “route-to-market” or countries aiming at export-led
growth, and an important initial point o access to TNC governed global value
chains, beore gradually building independent exporting capabilities. Export gains
can be partially oset by higher imports, reducing net export gains, where local
value added is limited, especially in early stages o NEM development.
8/4/2019 Unctad 2011 Wir Overview
http://slidepdf.com/reader/full/unctad-2011-wir-overview 35/41
World Investment Report 201124
NEMs are an important avenue or technology and skillsbuilding
NEMs are in essence a transer o intellectual property to a host-country rm under
the protection o a contract. Licensing involves a TNC granting an NEM partner
access to intellectual property, usually with contractual conditions attached, but
oten with some training or skills transer. International ranchising transers a
business model, and extensive training and support are normally oered to local
partners in order to properly set up the new ranchise with wide-ranging implications
or technology dissemination.
In some East and South-East Asian economies in particular, but also in Eastern
Europe, Latin America and South Asia, technology and skills acquisition and
assimilation by NEM companies in electronics, garments, pharmaceuticals, IT-
services and business process outsourcing (BPO) have led to their transormation
into TNCs and technology leaders in their own right.
Although technology acquisition and assimilation through NEMs is a widespread
phenomenon, this is not a oregone conclusion, especially at the level o second
and third tier suppliers, where linkages may be insucient or o low quality. A key
actor is the absorptive capacity o local NEM partners, in the orm o their existingskills base, the availability o workers that can be trained to learn new skills, and the
basic prerequisites to turn acquired skills into new business ventures, including the
regulatory ramework, the business environment and access to nance. Another
important actor is the relative bargaining power o TNCs and local NEM partners.
Both actors can be infuenced by appropriate policies.
Social and environmental pros and cons o NEMs
Concerns exist that cross-border NEMs in some industries may be a mechanismor TNCs to circumvent high social and environmental standards in their production
network. Pressure rom the international community has pushed TNCs to take
greater responsibility or such standards throughout their global value chains. There
is now a signicant body o evidence to suggest that TNCs are likely to use more
environmentally riendly practices than domestic companies in equivalent activities.
The extent to which TNCs guide NEM operations on social and environmental
practices depends, rst, on their perception o and exposure to legal liability risks
(e.g. reparations in the case o environmental damages) and business risks (e.gdamage to their brand and lower sales); and, secondly, on the extent to which
8/4/2019 Unctad 2011 Wir Overview
http://slidepdf.com/reader/full/unctad-2011-wir-overview 36/41
25Overview
they can control NEMs. TNCs employ a number o mechanisms to infuence NEM
partners, including codes o conduct, actory inspections and audits, and third-
party certication schemes.
NEMs can help countries integrate in GVCs and buildproductive capacity
The immediate contributions to employment, to GDP, to exports and to the local
technology base that NEMs can bring help to provide the resources, skills and
access to global value chains that are prerequisites or long-term industrial capacity
building.
A major part o the contribution o NEMs to the build-up o local productive
capacity and long-term prospects or industrial development is through the impact
on enterprise development, as NEMs require local entrepreneurs and domestic
investment. Such domestic investment, and access to local or international
nancing, is oten acilitated by NEMs, either through explicit measures by TNCs
providing support to local NEM partners, or through the implicit guarantees
stemming rom the partnership with a major TNC itsel.
While the potential contributions o NEMs to long-term development are clear,concerns are oten raised (especially with regard to contract manuacturing and
licensing), that countries relying to a signicant extent on NEMs or industrial
development risk remaining locked-in to low-value-added segments o TNC-
governed global value chains and remaining technology dependent. In such cases,
developing economies would run a urther risk o becoming vulnerable to TNCs
shiting productive activity to other locations, as NEMs are more “ootloose” than
equivalent FDI operations. The related risks o “dependency” and “ootlooseness”
must be addressed by embedding NEMs in the overall development strategies o countries.
The right policies can help maximize NEM developmentbenefts
Policies are instrumental or countries to maximize development benets and
minimize the risks associated with the integration o domestic rms into NEM
networks o TNCs (table 6). There are our key challenges or policymakers: rst,how to integrate NEM policies into the overall context o national development
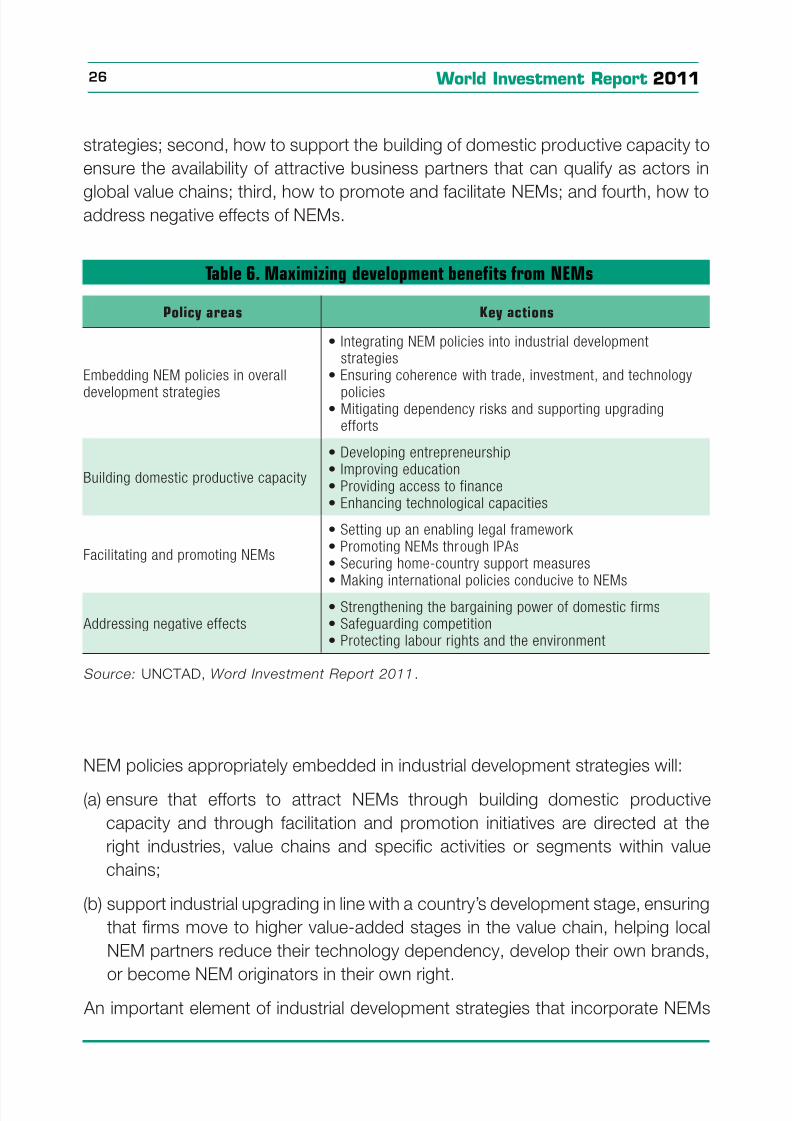
8/4/2019 Unctad 2011 Wir Overview
http://slidepdf.com/reader/full/unctad-2011-wir-overview 37/41
World Investment Report 201126
strategies; second, how to support the building o domestic productive capacity to
ensure the availability o attractive business partners that can qualiy as actors in
global value chains; third, how to promote and acilitate NEMs; and ourth, how toaddress negative eects o NEMs.
Table 6. Maximizing development benefts rom NEMs
Policy areas Key actions
Embedding NEM policies in overall
development strategies
• Integrating NEM policies into industrial developmentstrategies
• Ensuring coherence with trade, investment, and technology
policies• Mitigating dependency risks and supporting upgrading
efforts
Building domestic productive capacity
• Developing entrepreneurship• Improving education• Providing access to finance• Enhancing technological capacities
Facilitating and promoting NEMs
• Setting up an enabling legal framework • Promoting NEMs through IPAs• Securing home-country support measures• Making international policies conducive to NEMs
Addressing negative effects• Strengthening the bargaining power of domestic firms• Safeguarding competition• Protecting labour rights and the environment
Source: UNCTAD, Word Investment Report 2011.
NEM policies appropriately embedded in industrial development strategies will:
(a) ensure that eorts to attract NEMs through building domestic productive
capacity and through acilitation and promotion initiatives are directed at the
right industries, value chains and specic activities or segments within value
chains;
(b) support industrial upgrading in line with a country’s development stage, ensuring
that rms move to higher value-added stages in the value chain, helping local
NEM partners reduce their technology dependency, develop their own brands,
or become NEM originators in their own right. An important element o industrial development strategies that incorporate NEMs
8/4/2019 Unctad 2011 Wir Overview
http://slidepdf.com/reader/full/unctad-2011-wir-overview 38/41
27Overview
are measures to prevent and mitigate impacts deriving rom the “ootlooseness”
o some NEM types, by balancing diversication and specialization. Diversication
ensures that domestic companies are engaged in multiple NEM activities, bothwithin and across dierent value chains, and are connected to a broad range o
NEM partners. Specialization in particular value chains improves the competitive
edge o local NEM partners within those chains and can acilitate, in the longer
term, upgrading to segments with greater value capture. In general, measures
should aim at maintaining and increasing the attractiveness o the host country or
TNCs and improve the “stickiness” o NEMs by building up local mass, clusters o
suppliers, and the local technology base. Continuous learning and skills upgrading
o domestic entrepreneurs and employees are also important to ensure domestic
rms can move to higher value-added activities should oreign companies move
“low end” production processes to cheaper locations.
Improving the capacity o locals to engage in NEMs has several policy aspects. Pro-
active entrepreneurship policies can strengthen the competitiveness o domestic
NEM partners and range rom ostering start-ups to promoting business networks.
Embedding entrepreneurship knowledge into ormal education systems, combined
with vocational training and the development o specialized NEM-related skills is
also important. A mix o national technology policies can improve local absorptive
capacity and create technology clusters and partnerships. Access to nance or
domestic NEM partners can be improved through policies reducing borrowing
costs and the risks associated with lending to SMEs, or by oering alternatives
to traditional bank credits. Facilitation eorts can also include initiatives to support
respect or core labour standards and CSR.
Promoting and acilitating NEM arrangements depends, rst, on clear and stable
rules governing the contractual relationships between NEM partners, including
transparency and coherence. This is important, as NEM arrangements are oten
governed by multiple laws and regulations. Conducive NEM-specic laws (e.g.
ranchising laws, rules on contract arming) and appropriate intellectual property (IP)
protection (particularly relevant or IP-intensive NEMs such as licensing, ranchising
and oten contract manuacturing) can also help. While the current involvement
o investment promotion agencies in NEM-specic promotion is still limited, they
could expand their remit beyond FDI to promote awareness o NEM opportunities,
engage in matchmaking services, and provide incentives to start-ups.
To address any negative impacts o NEMs, it is important to strengthen thebargaining power o local NEM partners vis-à-vis TNCs to ensure that contracts are
8/4/2019 Unctad 2011 Wir Overview
http://slidepdf.com/reader/full/unctad-2011-wir-overview 39/41
World Investment Report 201128
based on a air sharing o risks and benets. The development o industry-specic
NEM model contracts or negotiation guidelines can contribute to achieving this
objective. I TNCs engaged in NEMs acquire dominant positions, they may be ableto abuse their market power to the detriment o their competitors (domestic and
oreign) and their own trading partners. Thereore, policies to promote NEMs need
to go hand in hand with policies to saeguard competition. Other public interest
criteria may require attention as well. Protection o indigenous capacities and
traditional activities, that may be crowded out by a rapid increase in market shares
o successul NEMs, is essential.
In the case o contract arming or instance, policies such as these would result in
model contracts or guidelines supporting smallholders in negotiations with TNCs;training on sustainable arming methods; provision o appropriate technologies
and government-led extension services to improve capacities o contract armers;
and inrastructure development or improving business opportunities or contract
armers in remote areas. I contract arming was given more pride o place in
government policies, direct investment in large-scale land acquisitions by TNCs
would be less o an issue.
Finally, home-country initiatives and the international community can also play a
positive role. Home-country policies that specically promote overseas NEMs include
the expansion o national export insurance schemes and political risk insurance to
also cover some types o NEMs. Internationally, while there is no comprehensive
legal and policy ramework or ostering NEMs and their development contribution,
supportive international policies range rom relevant WTO agreements and – to
a limited extent – IIAs, to sot-law initiatives contributing to harmonizing the rules
governing the relationship between private NEM parties or guiding them in the
crating o NEM contracts.
* * *
Foreign direct investment is a key component o the world’s growth engine. However,
the post-crisis recovery in FDI has been slow to take o and is unevenly spread,
with especially the poorest countries still in “FDI recession”. Many uncertainties
still haunt investors in the global economy. National and international policydevelopments are sending mixed messages to the investment community. And
8/4/2019 Unctad 2011 Wir Overview
http://slidepdf.com/reader/full/unctad-2011-wir-overview 40/41
29Overview
investment policymaking is becoming more complex, with international production
evolving and with blurring boundaries between FDI, non-equity modes and trade.
The growth o NEMs poses new challenges but also creates new opportunities orthe urther integration o developing economies into the global economy. The World
Investment Report 2011 aims to help developing-country policymakers and the
international development community navigate those challenges and capitalize on
the opportunities or their development gains.
Geneva, June 2011 Supachai PanitchpakdiSecretary-General o the UNCTAD
8/4/2019 Unctad 2011 Wir Overview
http://slidepdf.com/reader/full/unctad-2011-wir-overview 41/41
World Investment Report 201130
World Investment Report Past Issues
World Investment Report 2010: Investing in a Low-carbon Economy.World Investment Report 2009: Transnational Corporations, Agricultural Production and Development.
World Investment Report 2008: Transnational Corporations and the Infrastructure Challenge.
World Investment Report 2007: Transnational Corporations, Extractive Industries and Development.
World Investment Report 2006: FDI from Developing and Transition Economies: Implications for Development.
World Investment Report 2005: Transnational Corporations and the Internationalization of R&D.
World Investment Report 2004: The Shift Towards Services
World Investment Report 2003: FDI Policies for Development: National and International
Perspectives World Investment Report 2002: Transnational Corporations and Export Competitiveness
World Investment Report 2001: Promoting Linkages
World Investment Report 2000: Cross-border Mergers and Acquisitions and Development
World Investment Report 1999: Foreign Direct Investment and the Challenge of Development
World Investment Report 1998: Trends and Determinants
World Investment Report 1997: Transnational Corporations, Market Structure and Competition Policy
World Investment Report 1996: Investment, Trade and International Policy Arrangements
World Investment Report 1995: Transnational Corporations and Competitiveness
World Investment Report 1994: Transnational Corporations, Employment and the Workplace World Investment Report 1993: Transnational Corporations and Integrated International Production
World Investment Report 1992: Transnational Corporations as Engines of Growth
World Investment Report 1991: The Triad in Foreign Direct Investment
All downloadable at www.unctad.org/wir
The sales publications may be purchased fromdistributors of United Nations publications throughout the
world. They may also be obtained by contacting:
United Nations Publications Customer Servicec/o National Book Network
15200 NBN WayPO Box 190
Blue Ridge Summit, PA 17214email: [email protected]
For further information on the work on foreign directinvestment and transnational corporations, please
address inquiries to:
Division on Investment and EnterpriseUnited Nations Conference on Trade and Development
Palais des Nations, Room E-10052CH-1211 Geneva 10 Switzerland
Telephone: +41 22 917 4533
HOW TO OBTAIN THE PUBLICATIONS