Embed Size (px)
Citation preview
UNCOVERING REGIONAl WEAlTH An Analysis of Budget Policies for Land and Forest Governance in Three Provinces and Six Districts in Indonesia
Supported by:
The Asia Foundation
Funded by:
~~~ ~~
UK aid irom .... BrW1 poopll

UNCOVERING REGIONAL WEALTH: An Analysis of Budget Policies for Land and Forest Governance in Three Provinces and Six Districts in Indonesia
Writing Team
Hadi Prayitno
Ahmad Taufik
Rizki Fitriyani R. Alam Surya Putra
Editor
R. Alam Surya Putra
Photo
Ownership of R. Alam Surya Putra
Mining in the Makroman district, Samarinda, East Kalimantan
Printed on recycled content paper
This report was produced with support from the UK Climate Change Unit (UKCCU). The opinions, findings, interpretations and summary expressed in this report are those of the civil society groups involved and do not reflect those of the Asia Foundation and UKCCU.
Uncovering Regional Wealthiv
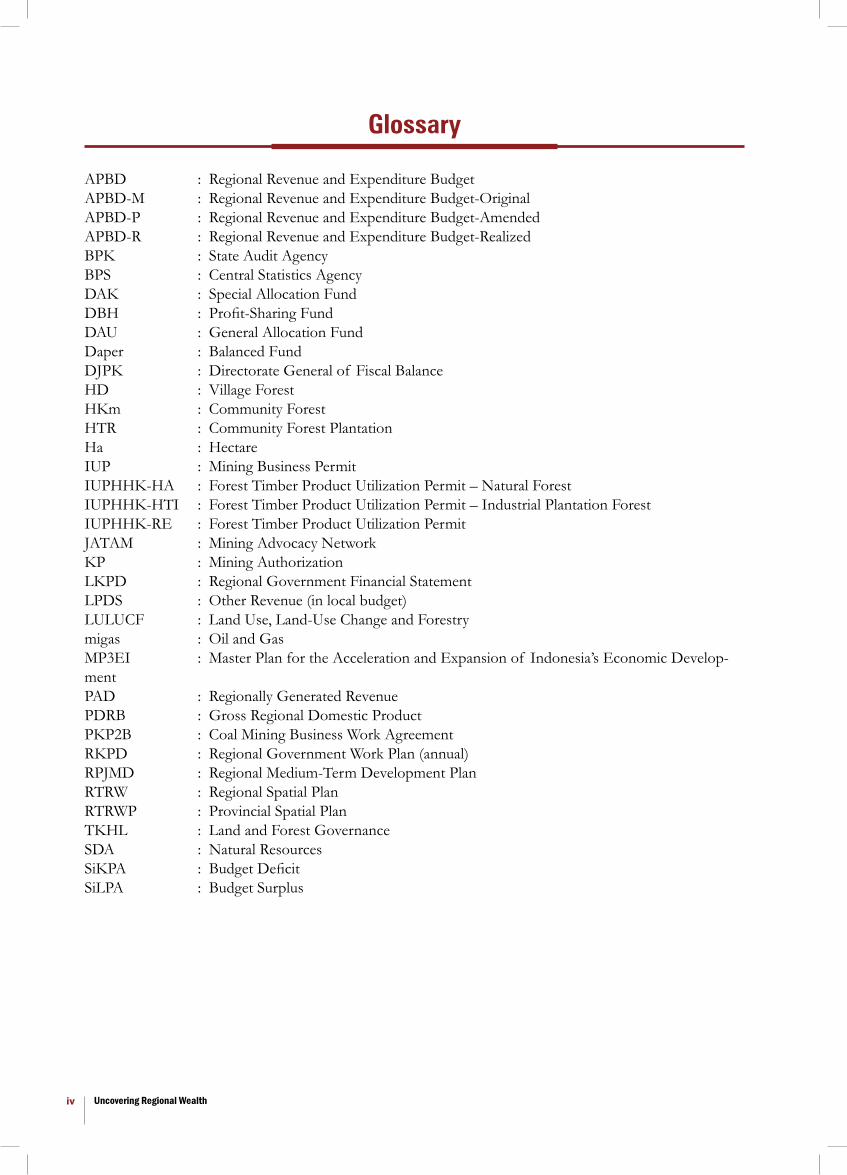
APBD : Regional Revenue and Expenditure BudgetAPBD-M : Regional Revenue and Expenditure Budget-OriginalAPBD-P : Regional Revenue and Expenditure Budget-AmendedAPBD-R : Regional Revenue and Expenditure Budget-RealizedBPK : State Audit AgencyBPS : Central Statistics AgencyDAK : Special Allocation FundDBH : Profit-Sharing FundDAU : General Allocation FundDaper : Balanced Fund DJPK : Directorate General of Fiscal BalanceHD : Village Forest HKm : Community Forest HTR : Community Forest PlantationHa : HectareIUP : Mining Business PermitIUPHHK-HA : Forest Timber Product Utilization Permit – Natural ForestIUPHHK-HTI : Forest Timber Product Utilization Permit – Industrial Plantation ForestIUPHHK-RE : Forest Timber Product Utilization PermitJATAM : Mining Advocacy NetworkKP : Mining AuthorizationLKPD : Regional Government Financial StatementLPDS : Other Revenue (in local budget)LULUCF : Land Use, Land-Use Change and Forestry migas : Oil and Gas MP3EI : Master Plan for the Acceleration and Expansion of Indonesia’s Economic Develop-mentPAD : Regionally Generated RevenuePDRB : Gross Regional Domestic ProductPKP2B : Coal Mining Business Work AgreementRKPD : Regional Government Work Plan (annual)RPJMD : Regional Medium-Term Development PlanRTRW : Regional Spatial PlanRTRWP : Provincial Spatial PlanTKHL : Land and Forest GovernanceSDA : Natural ResourcesSiKPA : Budget DeficitSiLPA : Budget Surplus
Glossary
Uncovering Regional Wealth v
GLOSSARY ivPREFACE viiiACKNOWLEDGMENTS ixEXECUTIVE SUMMARY x
PART IBUILDING AN ANALYTICAL FRAMEWORK FOR REGIONAL BUDGET POLICIES ON LAND AND FOREST GOVERNANCE IN INDONESIA .............................................................. 11.1 Introduction ................................................................................................................................................... 11.2 Research Framework ..................................................................................................................................... 21.3 Research Methodology .................................................................................................................................. 4
PART IIEXAMINING REGIONAL PLANNING POLICIES ON LAND AND FORESTGOVERNANCE IN INDONESIA ........................................................................................................... 72.1 Regional Authority Over Land and Forest Governance ........................................................................ 72.2 Natural Resource-Based Regional Economic Structure .......................................................................... 92.3 Exploitative Planning Policies in the Absence of an Adequate Recovery Program ............................ 15
PART IIIREVIEWING REGIONAL BUDGETS: MEASURING REGIONAL GOVERNMENTCOMMITMENT AND PARTIALITY TOWARD LAND AND FOREST GOVERNANCE 183.1 Overview of Regional Revenue .................................................................................................................. 183.2 Markdown Symptoms and Revenue Politicization ................................................................................... 233.3 Overview of Regional Spending .................................................................................................................. 273.4 Low Budget Commitment for Land and Forest Governance ................................................................. 313.5 Regional Financing and Fiscal Space .......................................................................................................... 39
PART IVCONCLUSION AND RECOMMENDATIONS ................................................................................. 444.1 Conclusion ...................................................................................................................................................... 444.2 Recommendations ......................................................................................................................................... 45Bibliography .......................................................................................................................................................... 48Appendix 1 ............................................................................................................................................................. 50Appendix 2 ............................................................................................................................................................ 52
Table of Contents
Uncovering Regional Wealthvi
List of Tables Table 1.1 - General Statistical Data Profile of Research Areas .................................................................. 5Table 1.2 - Data Used and Source of Data ................................................................................................... 6Table 2.1 - Regional Planning Policies in Natural Resource Utilization as a Basis for Regional Economic Growth ....................................................................................................... 9Table 2.3 - Development of Forest Land Use Permits for Mining Production/ Exploitation Operational Activities ................................................................................................................... 13Table 2.4 - Development of Mining Business Permits in East Kalimantan Province ............................ 13Table 2.5 - Area of Oil Palm Regions by Province, 2008-2012 (Ha) ......................................................... 14Table 2.6 - Area of Oil Palm Plantation Regions ......................................................................................... 15Table 2.7 - Plantation Development Plan in West Kalimantan Province ................................................ 15Table 2.8 - Conflicts and Conflicting Companies in 2012 ........................................................................... 16Table 2.9 - Critical Land Area Growth in Three Provinces, 2007-2011 .................................................... 16Table 2.10 - Area of Production Forest Land Utilized .................................................................................. 17Table 3.1 - Comparison of Original, Amended and Realized Revenues of Provinces and Districts, 2009-2012, Based on Constant Price 2012 (in billion Rp) ....................................................... 28Table 3.2 - Comparison of Original, Amended, and Realized Expenditure of Provinces and Districts,
2009-2012, Based on Constant Price 2012 (in billion Rp) ...................................................... 31Table 3.3 - Forestry and Land Function Expenditure per Hectare ............................................................ 39Table 3.4 - SiLPA of Current Budget Year and Its Ratio to Regional Spending, East Kalimantan Province 2011 .................................................................................................................................. 46Table of Appendix 1.1 – Management of Land and Forest Governance Functions in the Research Areas ........................................................................................................................ 57Table of Appendix 1.2 Division of Authority Between Government Levels in the Governance of Forestry, Mining and Plantation Affairs ........................................................ 59 List of Graphics Graphic 2.1 - Growth in the Production of Petroleum, Natural Gas and Coal in South Sumatra and East Kalimantan Provinces, 2009- 2012 ........................................................................ 12Graphic 3.1 - District Revenue Composition, 2009-2012 ........................................................................... 21Graphic 3.2 - Provincial Revenue Composition, 2009-2012 ....................................................................... 21Graphic 3.3 - Provincial Balanced Fund Composition, 2009-2012 ........................................................... 22Graphic 3.4 - District Balanced Fund Composition, 2009-2012 ............................................................... 22Graphic 3.5 - Provincial DBH-SDA Composition, 2009-2011 .................................................................. 24Graphic 3.6 - District-Level Natural Resources Profit-Sharing Fund Composition, 2009-2012 .......... 24Graphic 3.7 - Budget Transfer and Realization of Forestry Natural Resources, 2009-2011 ................. 25Graphic 3.8 - Provincial Revenue and Growth, 2009 -2012 ....................................................................... 26Graphic 3.9 - District-Level Revenue and Growth, 2009 2012 .................................................................. 27Graphic 3.10 - Per Capita Regional Revenue, 2010 ....................................................................................... 28Graphic 3.11 - DBH Per Capita and Its Ratio to Regional Revenue, 2009-2012 ....................................... 29Graphic 3.12 - Profit-Sharing Fund Trend Per Capita and Its Ratio to Revenue, 2009-2011 ................. 29Graphic 3.13 - DBH SDA Revenue and Poverty Rate, 2010 ........................................................................ 30Graphic 3.14 - Provincial Expenditure and Growth, 2009 -2012 ................................................................ 31Graphic 3.15 - District-Level Revenue and Growth, 2009 -2012 ................................................................ 32Graphic 3.16 - District-Level Expenditure Composition, 2009-2012 ........................................................ 33Graphic 3.17 - Provincial Expenditure Composition, 2009-2012 ................................................................ 35
List of Graphics, Boxes and Tables
Graphic 3.18- District-Level Expenditure on Land and Forest Sector Functions, 2009-2012 .............. 36 Graphic 3.19- Provincial Expenditure on Land and Forest Sector Functions, 2009-2012 ..................... 36 Graphic 3.20 - Proportion of District-Level Forestry Functions to Regional Expenditure,
2009-2012 .................................................................................................................................. 37 Graphic 3.21 - Proportion of Provincial Forestry Functions to Regional Expenditure, 2009-2012 ..... 38 Graphic 3.22 - Ratio of Expenditure on Forestry Functions to Forestry Balanced Fund, 2009-2012... 40 Graphic 3.23- DBH SDA Contribution to Personnel Spending, 2011 ...................................................... 40 Graphic 3.24- Expenditure on Spatial Zoning Functions, 2009 -2012 ...................................................... 41 Graphic 3.26 - Expenditure on Agricultural Functions, 2009 -2011............................................................ 43 Graphic 3.27 - Provincial Deficit/ Surplus, 2009-2012 ................................................................................... 45 Graphic 3.28 - Ratio of SiLPA to Provincial Spending, 2009-2011............................................................. 45 Graphic 3.29- Provincial Real Fiscal Space Per Capita and Its Ratio to Revenue, 2009-2012 ............... 48 Graphic 3.30 - District Real Fiscal Space Per Capita and Its Ratio to Revenue, 2009-2012 .................... 49
List of Diagrams Diagram 1.1 Framework of Research on Budget Policies in Land and Forest Governance ............... 4 Diagram 1.2 Analysis Scheme of Land and Forest Governance Budget................................................ 7
List of Boxes Box 2.1 Formation of Reclamation and Post-Mining Supervising Committee in East Kalimantan... 10 Box 3.1 Balanced Funds for Reducing Fiscal Gap....................................................................................... 23 Box 3.2 Budget Politics during APBD Amendment Period ...................................................................... 32 Box 3.3 Composition of Spending................................................................................................................. 33 Box 3.4 Companies Failing to Deposit Reclamation Guarantee Funds .. .. .. .. .. .. .. .. .. .. .. .. .. .. .. .................... 42 Box 3.5 Food Estate Program in West Kalimantan Province.................................................................... 44 Box 3.6 Methods of Corruption Using SiLPA ............................................................................................ 46
Uncovering Regional Wealth I vii
Uncovering Regional Wealthviii
Salute to Transparency,
The SETAPAK program, which is funded by the United Kingdom Climate Change Unit (UKCCU), aims to improve land and forest governance in Indonesia to support the reduction of Indonesia’s greenhouse gas emissions. This study is part of that effort, as a monitoring instrument developed by civil society to assess and evaluate the process of land and forest governance from a budget perspective.A budget can be used as an indicator to measure a regional government’s commitment and efforts to improve land and forest governance. Most regional revenue is derived from the Natural Resources Profit-Sharing Fund (DBH – SDA), however, policy redistribution through regional spending is mostly allocated for those programs beyond the coverage of environmental sustainability issues.
Regional revenue policies that rely on natural resources as their greatest source of revenue will result in an increase in land and forest-based industrial activities. In addition, in the era of decentralization, there is the phenomenon of so-called “rich regions”, with a connotation of those regions successfully managing, utiliz-ing and exploiting their petroleum, coal and forest reserves, thus providing them with a great amount of Profit-Sharing Funds each year.
In the last four years (2009-2012), the government sectors of forestry, spatial zoning and the environment at the provincial and district levels each received an allocation of only 1 percent on average of the total regional expenditure. This allocation is far smaller than the expenditure on social assistance and grants, with these figures reaching more than 10 percent.
Improving budget policy will play a very strategic role in improving the quality of land and forest govern-ance in Indonesia. A responsive revenue policy will contribute to the prevention of excessive exploitation of natural resources. An efficient, effective and appropriately targeted expenditure policy will support attempts to prevent deforestation, promote forest land rehabilitation, and prevent exploitation and optimization of plantation production, thereby avoiding any possible new land openings within forest areas.
In drafting this report, we want to express our gratitude and highest appreciation to UKCCU for its support of the SETAPAK program, including this particular study. We would also like to thank the national and lo-cal level researchers for their hard work in obtaining and analyzing the data. We hope that this study can be useful in improving land and forest governance in Indonesia.
Jakarta, December 2013
Yenny Sucipto Blair Palmer Secretary General Program Director Seknas FITRA Environmental Governance Environmental Law (ICEL) The Asia Foundation, Indonesia
Preface
Uncovering Regional Wealth ix
This report is the result of cooperation between Seknas FITRA and The Asia Foundation. The Seknas FITRA team is coordinated by Hadi Prayitno and its members include Ahmad Taufik and Rizka Fitriyani. The Asia Foundation team is coordinated by Blair Palmer with members including R. Alam Surya Putra and Ade Cahyat.
This report was prepared based on the results of field research conducted by local researchers from about 10 civil society organizations, comprising:
• South Sumatra : Nunik Handayani, Eli Mailiana, Sumarni (FITRA South Sumatra), Basyir, Anton (Wa-hana Bumi Hijau), Ade Ramayeni, Yogi (Pilar Nusantara);
• West Kalimantan : Liem Keng Sia, Didik Supriyatno, Ngusmanto (Fakta), Yongky Yob Yosafat, Fredy Dulhadi (Jari Borneo Barat), Endang Kusmiyati, Dea Ishadi (Titian);
• East Kalimantan : Ramlianur, Buyung Marajo, Burhanuddin (Pokja 30). The analysis and report drafting processes were performed jointly by Hadi Prayitno, Ahmad Taufik and Rizka Fitriyani (Seknas FITRA), and R. Alam Surya Putra (The Asia Foundation). Finally, it was edited by R. Alam Surya Putra.
We would also like to thank Blair Palmer, Erman Rahman, Frans Siahaan, Prayekti Murharjanti, Ridwan and Chitra Hariyadi who gave their reviews, feedback and criticism on this report. Dorta Pardede and Kiki Tob-ing also contributed much to the printing and publishing of this report.
This activity was conducted with the support of the United Kingdom Climate Change Unit (UKCCU). However, the opinions, findings, interpretations and conclusions in this report are the views of civil groups and not the views of The Asia Foundation or UKCCU.
Acknowledgments
Uncovering Regional Wealthx
Indonesia is facing serious problems related to unsustainable land and forest governance, resulting in large scale deforestation and forest degradation. Budgets and budget policies are important elements of land and forest governance, critical to ensuring the implementation of development plans and addressing deforesta-tion and degradation problems. In order to have a significant influence over forest and land governance, budget policies should have the following in place: (a) revenue policy that is directed toward developing in-centives in an effort to reduce deforestation and degradation; (b) expenditure policy that is oriented toward ensuring proper allocation of funding for programs and activities which are the main priorities in reducing deforestation and forest degradation; and (c) finance policy that is aimed toward investing government funds in green growth and sustainable development. The Indonesian Forum for Budget Transparency (Seknas FITRA) conducted a study analyzing budget and planning policies on land and forest governance at the pro-vincial and district level in Indonesia. Using this instrument, analysis was carried out in three provinces and six districts to assess the extent to which local governments manage public money in a way that contributes to the goals of reducing deforestation and forest degradation.
The study found that existing authority over land and forest governance poses challenges to the sustainabil-ity of the natural environment. Local government policy planning tends to be exploitative without providing optimal recovery planning, demonstrating that governments take little responsibility for improving land and forest governance. Natural resources are the greatest source of local government revenue, yet local govern-ment expenditure on land and forest governance is minimal. The heavy reliance of the regions on natural resources does not correspond to improvements in poverty. Annual budget targets for local government expenditure are often lower than actual spending, which is causing a loss to local government funds. The high amount of fiscal space and unused budget surplus (SILPA) in the regions is in fact an opportunity to increase allocation of spending on land and forest governance. Mining reclamation funds are not controlled or managed transparently, and many companies do not comply with the regulations for these funds.
This study provides recommendations for central government, including: develop and improve incentive schemes for regions to improve land and forest governance by improving policies on reforestation fund management and giving authority to regions; develop other incentive schemes to reduce massive environ-mental destruction; and maximise the role of oversight on local government budget and planning policies. Recommendations relevant for district government include to: increase the spending allocation for land and forest governance; improve public finance by making it more transparent and accountable; and strengthen the monitoring of local governments to reduce the rate of deforestation and forest degradation. The results of this study can be used as an instrument for civil society to improve budget and planning policy in the regions to support improvements in land and forest governance. Civil society groups that work on issues of budget policy should support a stronger civil society movement on land and forest govenance, and advocate for civil society to be involved in the process of preparing and monitoring budgets.
Executive Summary
1Uncovering Regional Wealth
1.1 INTRODUCTION
Decentralization has created new challenges for the management of natural resources and the en-vironment in the regions. Decentralization depends on the varied capacities of regional leaders with all kinds of interests in managing natural resources and human activity. The World Bank holds the view that the varied capacities and institutional visions of the regions are some of the main challenges faced in the decentralization era, as well as the appropriate use of incentives, and a minimum of standards, en-forcement and assistance from the central govern-ment.
Corruption is another important challenge faced by Indonesia under decentralization. The numerous corruption cases involving officials at the regional level indicate that the center of corrupt practices has moved along with the greater authority given to regional governments. The Center for International Forestry Research (CIFOR) suggests that the prob-lem of corruption in the natural resources sector (particularly in the misuse of reforestation funds) has become more decentralized during the post-Su-harto period since provincial and district-level gov-ernments in Indonesia have received an increased level of authority to manage their forestry revenue. The natural resources sector is considered a part of this era’s failure to manage and allocate said re-sources in an optimal manner for the public good. In this context, land and forests serve as a source of both formal and informal revenue for the govern-ment as well as for other parties whose interests lie beyond the government’s. In addition to the misuse of reforestation funds, corruption related to natural
Building an Analytical Framework for Regional Budget Policies on Land and Forest Governance in Indonesia
Part I
resources occurs through the release of land, the is-suance of business permits to the private sector, and the conversion of forests.
Deforestation and degradation problems that the Indonesian government must confront. This is not just because the Indonesian government has made a commitment to the international community to reduce its rate of emissions, but also because defor-estation in many cases reduces public income. Many studies even suggest that the challenges the Indo-nesian government faces have become increasingly difficult, since most deforestation is related to cor-rupt political and economic systems that consider natural resources, and land and forests in particular, as a source of revenue to be exploited for both po-litical and personal gain.
As a part of the political and economic systems, land and forest governance must be continuous-ly monitored by several parties. Similar research should be conducted constantly in order to generate recommendations and feed massive public debate to promote improvement to governance as soon as possible. In addition to looking at what policy packages, programs and activities the government makes available, another approach to examining the government’s commitment is to use a budget instru-ment, that is, to examine to what extent government revenue and expenditure are utilized to reduce the rate of deforestation. This approach deals with the question of whether the budget policy the govern-ment develops actually decreases or increases the rate of deforestation in Indonesia. In other words, analysis of budget management is an instrument that can provide feedback on land and forest gov-
1 World Bank, Country Environmental Assessment, Investing in a More Sustainable Indonesia, 2009.2 CIFOR, Financial Governance and Reforestation Funding in the Suharto period and the post-Suharto period 1998 – 2009,
2011.3 Setengah Hati Berantas Kejahatan Kehutanan (Half-hearted Forest Crime Elimination), Indonesia Corruption Watch, 20124 CIFOR, 2011 and World Bank, 2009, ibid.
2 Uncovering Regional Wealth
ernance in Indonesia. This study is an attempt to answer that question.
This study aimed to analyze budgeting policies at the regional level regarding land and forest govern-ance in Indonesia. Three (3) provinces and six (6) regencies were reviewed in this study, considering to what extent planning and budgeting policies at the regional level provide useful contributions toward improving land and forest governance. In particu-lar, the study aimed to analyze two issues: firstly, it reviewed the potential and realized regional revenue from land and forest governance, and secondly, it ex-amined the orientation of regional expenditure poli-cies in accelerating improvements to land and forest governance. Unlike the budget study conducted at the national level, which reviewed the consistency of existing planning policies and their relevance to budget policies, this study only reviewed how the budget policies were managed in order to support the objective of mitigating deforestation and forest degradation, which contributes directly to emission mitigation.
As part of a monitoring instrument, this study was developed by civil society groups to review and evaluate the land and forest governance process in Indonesia within the framework of budget policy. This study was developed by a civil society network experienced in reviewing the policies of budget management in various government sectors. Seknas FITRA coordinated this study with the support of ten (10) civil group networks in the regions. Within the last five years, Seknas FITRA has intensively re-viewed APBD budgets in 72 districts/municipalities and seven provinces, though the sectors or func-tions under review until now have mostly been edu-cation, healthcare and infrastructure.
This study is expected to be able to provide feedback to the government and other parties. It is hoped that this study will be of use to local governments in formulating better budget policies for society and, particularly, in optimally mitigating deforestation and forest degradation as well as emission mitiga-
tion. For provincial and central governments, the research is expected to be employed as a monitoring device of district-level government performance, in addition to serving as a reference for develop-ing budget policies and technical assistance that can be provided to regional governments. This report is also expected to promote improvements to budget management policies, by both the central and re-gional governments. Additionally, for provincial and central governments in particular, this research is expected to provide useful feedback for strengthen-ing government roles in evaluating, supervising and providing technical assistance to district-level gov-ernments. For other parties, the study is expected to serve as feedback for a broader dialogue on policy and to generate better public debate in order to im-prove policy.
1.2 RESEARCH FRAMEWORK
The research framework used in this study is similar to that for analyzing national budget policy on land and forest governance. In previous studies it has already been mentioned that budgets can be used as analytic instruments to examine a government’s performance in land and forest governance. The budget as an instrument can also be used to assess the government’s level of commitment or concern for managing its natural resources in a wise and fair manner. However, what makes this study different is that it gives less consideration to planning policy as a comparative instrument in budget policy analy-sis. The national budget study only evaluates one government entity, that is, the central government, hence making it possible to evaluate the suitability of planning policies and budget policies. Meanwhile, the study of regional budgets looks at the tendencies of regional governments, as represented by three (3) provinces and six (6) regencies in research areas, in managing their general budget policy for land and forest governance. Therefore, it is not possible to correlate the findings with policy planning analysis.
5 See Measuring Commitment: An Analysis of the National Budget and Planning Policies on Land and Forest Governance in Indonesia, 2013, Seknas FITRA – The Asia Foundation, Jakarta.
Several issues below serve as the basic assumptions used as a frame of thought and analysis in the study of budget policy at both the national and regional levels:
• The budget (either the APBN or APBD) is an important instrument for the government to implement its programs. The adequacy of the government budget in financing its programs is mostly affected by the way the budget is managed.
• The government's budget is a reflection of political decisions between the executive and legislative branches that indicates what the government does each year. This political decision has widespread impacts, not only on the quality of life for citizens, but also on the way the government allocates existing resources to fulfill its programming requirements. Therefore, this political decision reflects the extent of the government's concern for its people and the environment.
•
•
Budget policies are closely related to land and forest governance. In addition to serving as an instrument of regional revenue, land and forest governance is also an instrument of regional spending and financing.
As a revenue instrument, land and forest governance is seen as an incentive policy through taxes and royalties the government withdraws
for activities related to the land and forest sector. However, incentive policies through taxes and royalties might lead to an increase in deforestation and forest degradation and/ or, conversely, a decrease in deforestation and forest degradation. The political decision to determine the sources of state revenue reflects the extent to which the government is committed to increasing or decreasing deforestation and forest degradation.
• In terms of regional spending, this deals with the extent to which government money will be spent on those programs and activities supporting development goals. In particular, it ensures that there is an adequate budget available to finance programs and activities supporting the mitigation of deforestation and forest degradation. Additionally, it ensures that an allotted amount of money is spent in an optimal manner to achieve the objective of mitigating deforestation and forest degradation.
• Financing is oriented toward the extent to which government money is invested in green-growth development or in non-green-growth development. Ensuring that the money that is available supports green-growth development through optimization of the budget is critical to the fulfillment of the state funding scheme.
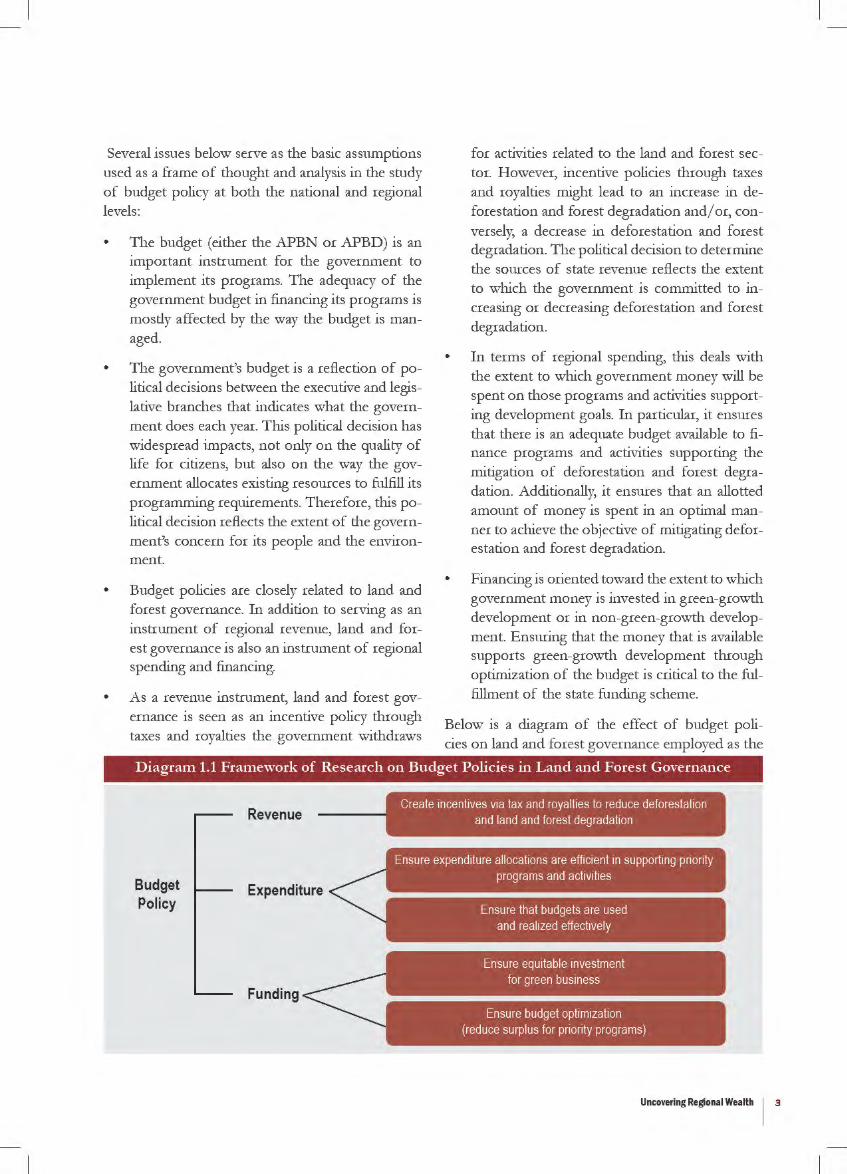
Below is a diagram of the effect of budget policies on land and forest governance employed as the
Diagram 1.1 Framework of Research on Budget Policies in Land and Forest Gm·ernance
Budget Policy
Revenue
Expenditure
Funding
Ensure expenditure allocations are efficient in supporting priority programs and activities
Ensure that budgets are used and real1zed effectively
Ensure equitable investment for green business
Ensure budget optimization (reduce surplus fo r priority programs)
Uncovering Regional Wealth I 3
1.3 RESEARCH METHODOLOGY
a. Scope of Analysis
This study focused on general analysis budget man
agement and specific analysis of budgets for the land and forest sector. The general analysis includes the profile and tendencies of budget revenue, expenditure and financing. The sectoral analysis, in essence, focuses on spending on programs that are expected to contribute to efforts toward reducing the rates of deforestation and forest degradation. This sectoral analysis focuses on forestry, agriculture, spatial zoning and the environment (LH), as well as energy and mineral resources (ESDM).
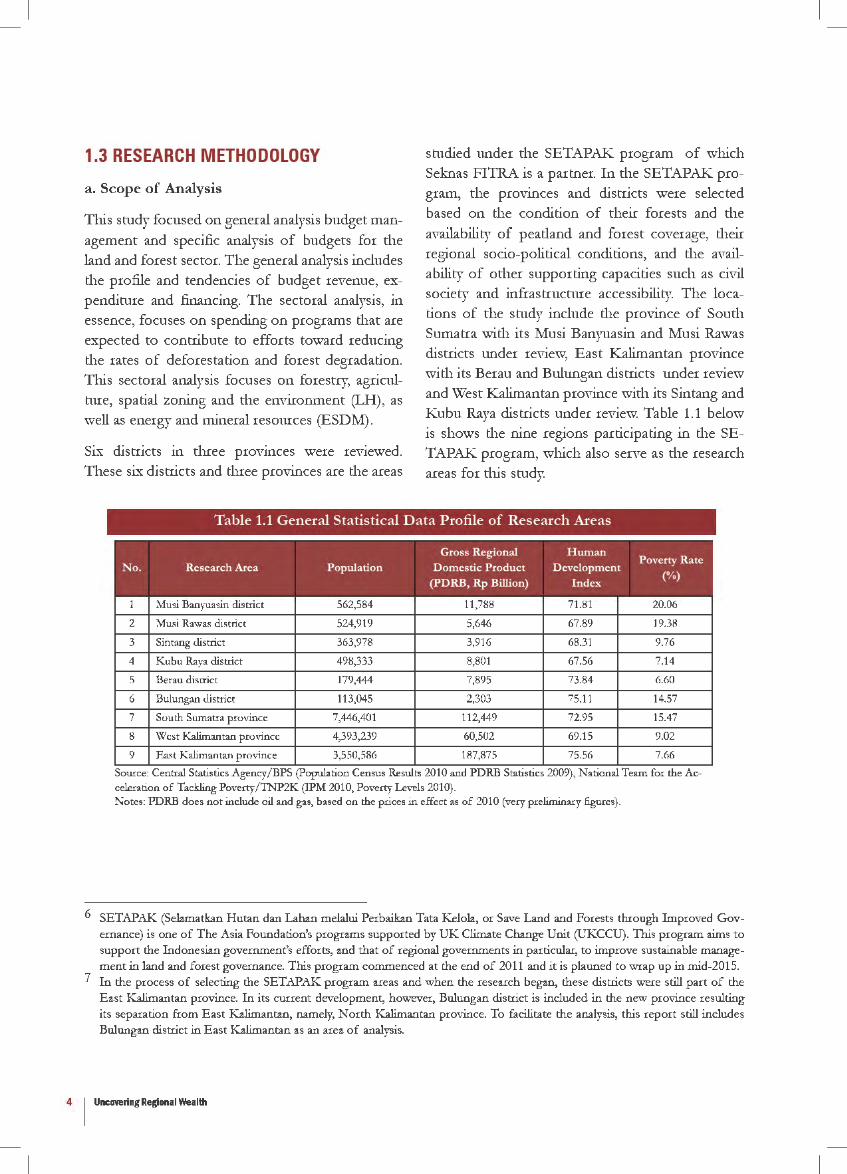
Six districts in three provinces were reviewed. These six districts and three provinces are the areas
studied under the SETAPAK program of which Seknas FITRA is a partner. In the SETAPAK program, the provinces and districts were selected based on the condition of their forests and the
availability of peatland and forest coverage, their regional socio-political conditions, and the availability of other supporting capacities such as civil
society and infrastructure accessibility. The locations of the study include the province of South Sumatra with its Musi Banyuasin and Musi Rawas districts under review, East Kalimantan province with its Berau and Bulungan districts under review and West Kalimantan province with its Sintang and Kubu Raya districts under review: Table 1.1 below is shows the nine regions participating in the SETAPAK program, which also serve as the research areas for this study.
Table 1.1 General Statistical Data Profile of Research Areas
Source: Central Statistics Agency/ BPS (Population Census Results 2010 and PDRB Statistics 2009), National Team for the Acceleration of Tackling Poverty/ TNP2K (IPM 2010, Poverty Levels 2010). Notes: PDRB does not include oil and gas, based on the prices in effect as of 2010 (very preliminary figures).
6 SETAPAK (Selamatkan Hutan dan Lahan melalui Perbaikan Tata Kelola, or Save Land and Forests through Improved Gov
ernance) is one of The Asia Foundation's programs supported by UK Climate Change Unit (UKCCU). This program aims to support the Indonesian government's efforts, and that of regional governments in particular, to improve sustainable management in land and forest governance. This program commenced at the end of 2011 and it is planned to wrap up in rnid-2015.
7 In the process of selecting the SETAPAK program areas and when the research began, these districts were still part of the East Kalimantan province. In its current development, however, Bulungan district is included in the new province resulting its separation from East Kalimantan, namely, North Kalimantan province. To facilitate the analysis, this report still includes Bulungan district in East Kalimantan as an area of analysis.
4 I Uncovering Regional Wealth
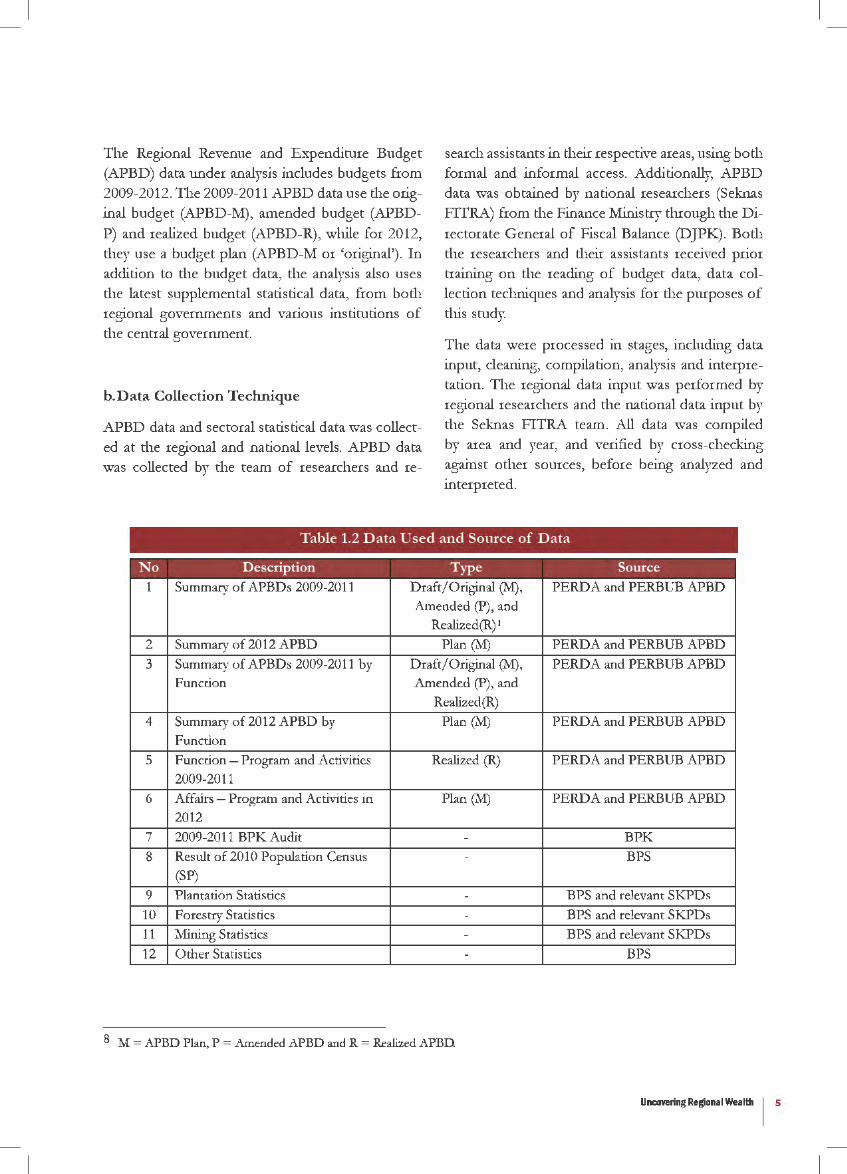
The Regional Revenue and Expenditure Budget (APBD) data under analysis includes budgets from 2009-2012. The 2009-2011 APBD data use the original budget (APBD-l\.1), amended budget (APBD
P) and realized budget (APBD-R), while for 2012, they use a budget plan (APBD-M or 'original'). In addition to the budget data, the analysis also uses the latest supplemental statistical data, from both regional governments and various institutions of the central government.
b.Data Collection Technique
APBD data and sectoral statistical data was collect
ed at the regional and national levels. APBD data was collected by the team of researchers and re-
search assistants in their respective areas, using both formal and informal access. Additionally, APBD data was obtained by national researchers (Seknas FITRA) from the Finance Ministry through the Di
rectorate General of Fiscal Balance (DJPK). Both the researchers and their assistants received prior training on the reading of budget data, data collection techniques and analysis for the purposes of this study.
The data were processed in stages, including data input, cleaning, compilation, analysis and intelpretation. The regional data input was performed by regional researchers and the national data input by the Seknas FITRA team. All data was compiled by area and year, and verified by cross-checking against other sources, before being analyzed and interpreted.
Table 1.2 Data Used and Source of Data
No Description Type Source
1 Summary of APBDs 2009-2011 Draft/Original (M), PERDA and PERBUB APBD Amended (P), and
Realized(R) '
2 Summary of 2012 APBD Plan (M) PERDA and PERBUB APBD
3 Summary of APBDs 2009-2011 by Draft/Original (M), PERDA and PERBUB APBD Function Amended (P), and
Realized(R)
4 Summary of 2012 APBD by Plan (M) PERDA and PERBUB APBD Function
5 Function - Program and Activities Realized (R) PERDA and PERBUB APBD 2009-2011
6 Affairs - Program and Activities in Plan (M) PERDA and PERBUB APBD 2012
7 2009-2011 BPK Audit - BPK
8 Result of 2010 Population Census - BPS
(SP)
9 Plantation Statistics - BPS and relevant SKPDs
10 Forestry Statistics - BPS and relevant SKPDs
11 Mining Statistics - BPS and relevant SKPDs
12 Other Statistics - BPS
8 M = APBD Plan, P = Amended APBD and R = Realized APBD.
Uncovering Regional Wealth I S
The data were processed in stages, including data input, cleaning, compilation, analysis and interpretation. The regional data input was performed by regional researchers and the national data input by
the Seknas FITRA team. All data was compiled by area and year, and verified by cross-checking against other sources, before being analyzed and interpreted.
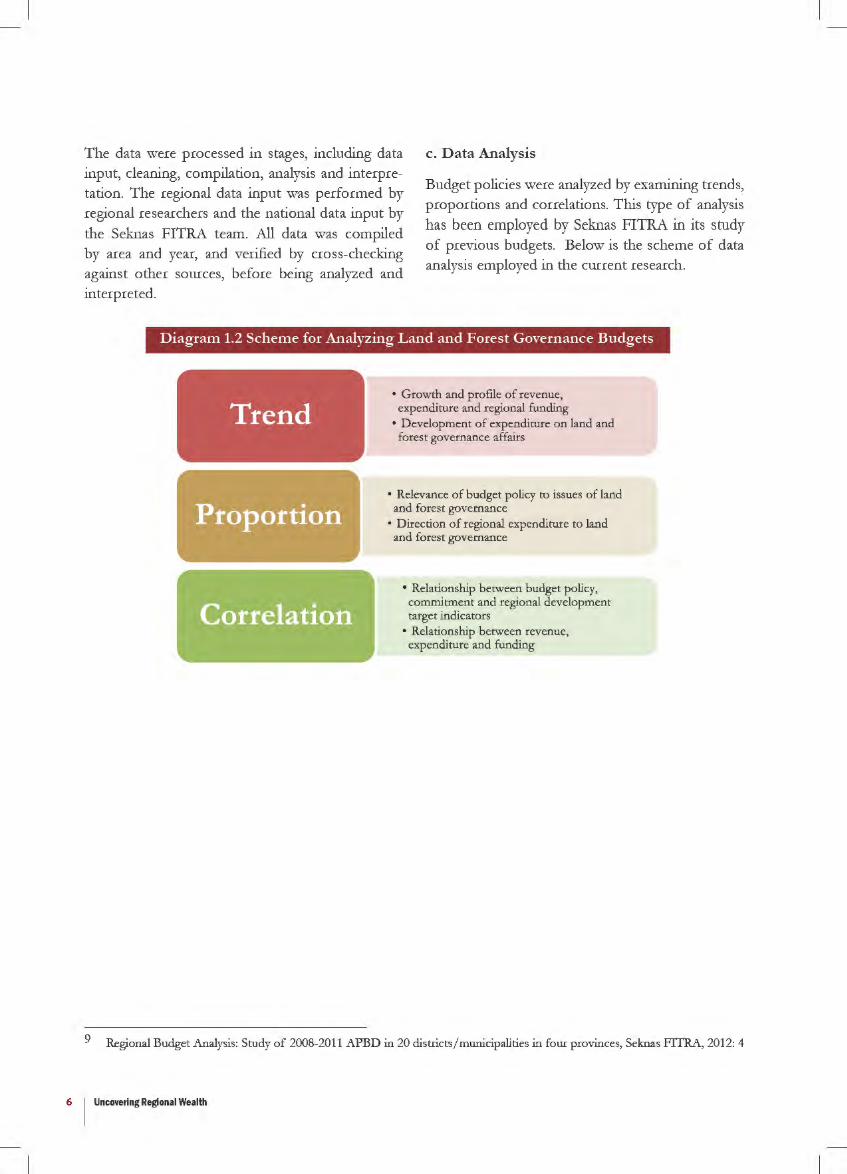
c . D a ta Analysis
Budget policies were analyzed by examining trends, proportions and correlations. This type of analysis has been employed by Seknas FITRA in its study of previous budgets. Below is the scheme of data analysis employed in the current research.
9
Diagram 1.2 Scheme for Analyzing Land and Forest Go\'ernance Budgets
• Growth and profile of revenue, expenditure and regional funding
• Development of expenditure on land and forest governance affairs
• Relevance of budget policy to issues of land and forest governance
• Direction of regional expenditure to land and forest governance
• Relationship between budget policy, commitment and regional development target indicators
• Relationship between revenue, expenditure and funding
Regional Budget Analysis: Study of 2008-2011 APBD in 20 districts/municipalities in four provinces, Seknas FITRA, 2012: 4
6 I Uncovering Regional Wealth
7Uncovering Regional Wealth
2.1 REGIONAL AUTHORITY OVER LAND AND FOREST GOVERNANCE
Decentralization has brought changes to the way natural resources are managed in Indonesia. Cur-rently, regional governments assign different values to regional revenue depending on the types and quantities of natural resources found in the area. The amount of regional revenue is obtained from a Profit-Sharing Fund (DBH) as jointly managed by the central government. This state of affairs has given rise to a dichotomy in regional wealth in the decentralization era. So-called “rich” regions tend to be associated with the natural resources they have in their possession, while regions with mini-mum natural resources and less fertile lands are fre-quently referred to as “poor” regions. Therefore, during the decentralization era natural resources have been an important factor in the sustainability of a region’s governance.
Decentralization has also led to important changes in the authority over managing natural resources. Regional governments have a good deal of author-ity in utilizing their natural resources, including to ensure that there have been efforts made to recover damaged natural resources. Although the author-ity over forestry function currently lies with the central government, regional governments are still involved in monitoring. The redistribution of au-thority over natural resource management presents regional governments with new challenges. In other words, the survival of natural resources relies on lo-cal leadership, along with its capabilities and capaci-ties. Whether natural resources are being managed well or not is reflected in the regional vision and mission.
10 World Bank, 2009, Investing in a More Sustainable Indonesia, Jakarta.
Examining Regional Planning Policies on Land and Forest Governance in Indonesia
Part II
Planning policies in the research areas tended to be exploitative of natural resources, while promis-ing the concept of sustainable development. The planning documents of the three provinces clearly describe natural resources as something that must be utilized optimally for development purposes, using the jargon of social welfare. The develop-ment plans of West Kalimantan province explic-itly promote the increase of regional revenue from the land and forest sectors. The provinces of East Kalimantan and South Sumatra are the same. Their development plans are oriented toward the utiliza-tion of natural resources to their maximum poten-tial. The development of one million hectares of oil palm land in East Kalimantan, and development of South Sumatra into a supplier of energy through the utilization of land show how local leaders tend to manage their natural resources.
These regional planning policies pose a serious threat to deforestation and land and forest degrada-tion. Even the World Bank (2009) has mentioned that natural resources in Indonesia are rapidly dwindling without being offset by a proportionate amount of investments in production or human re-sources, which has led to large-scale economic loss; as a result the cost of environmental damage will tend to rise in the future. Currently, the cost of en-vironmental damage is equal to the the average an-nual growth rate of environmental damage.
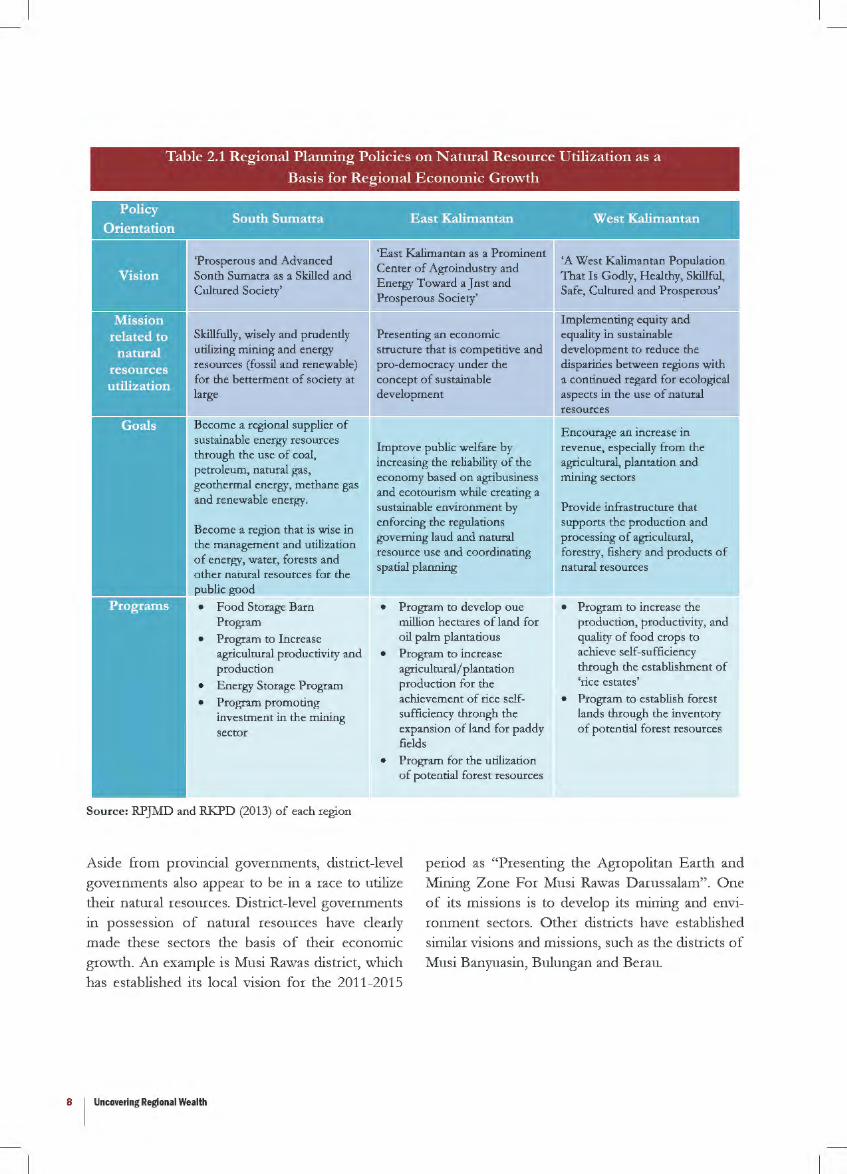
Table 2.1 Regional Planning Policies on Natural Resource Utilization as a
Basis for Regional Economic Growth
Policy . 0
. . South Sumatra East Kabmantan West Kalimantan rtentauon
Vision 'Prosperous and Advanced South Sumatra as a Skilled and Cultured Society'
Skillfully, wisely and prudendy utilizing mining and energy resources (fossil and renewable) for the betterment of society at large
Become a regional supplier of sustainable energy resources through the use of coal, petroleum, natural gas, geothermal energy, methane gas and renewable energy.
Become a region that is wise in the management and utilization of energy, water, forests and other natural resources for the f2Ub!ic good
• Food Storage Barn Program
• Program to Increase agricultural productivity and production
• Energy Storage Program
• Program promoting investment in the mining sector
Source: RPJMD and RKPD (2013) of each region
'East Kalimantan as a Prominent Center of Agroindustry and Energy Toward a Just and Prosperous Society'
Presenting an economic structure that is competitive and pro-democracy under the concept of sustainable development
Improve public welfare by increasing the reliability of the economy based on agribusiness and ecotourism while creating a sustainable environment by enforcing the regulations governing land and natural resource use and coordinating spatial planning
• Program to develop one million hectares of land for oil palm plantations
• Program to increase agricultural/ plantation production for the achievement of rice selfsufficiency through the expansion of land for paddy fields
• Program for the utilization of potential forest resources
'A West Kalimantan Population That Is Godly, Healthy, Skillful, Safe, Cultured and Prosperous'
Implementing equity and equality in sustainable development to reduce the disparities between regions with a continued regard for ecological aspects in the use of natural resources
Encourage an increase in revenue, especially from the agricultural, plantation and mining sectors
Provide infrastructure that supports the production and processing of agricultural, forestry, fishery and products of natural resources
• Program to increase the production, productivity, and quality of food crops to achieve self-sufficiency through the establishment of 'rice estates'
• Program to establish forest lands through the inventory of potential forest resources
Aside from provincial governments, district-level
governments also appear to be in a race to utilize
their natural resources. District-level governments
in possession of natural resources have clearly
made these sectors the basis of their economic
growth. An example is Musi Rawas district, which has established its local vision for the 2011-2015
period as "Presenting the Agropolitan Earth and
Mining Zone For Musi Rawas Darussalam" . One
of its missions is to develop its mining and environment sectors. Other districts have established
similar visions and missions, such as the districts of
Musi Banyuasin, Bulungan and Berau.
8 I Uncovering Regional Wealth
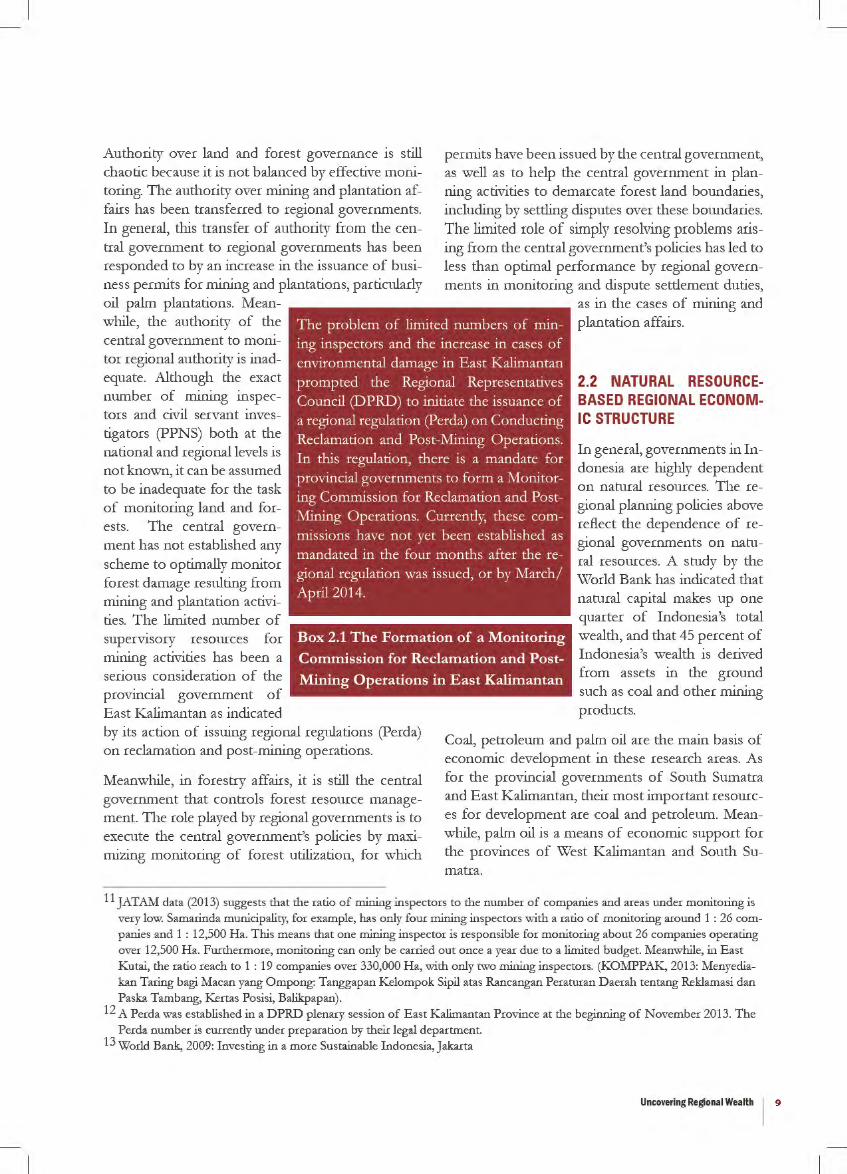
Authority over land and forest governance is still chaotic because it is not balanced by effective monitoring. The authority over mining and plantation affairs has been transferred to regional governments. In general, this transfer of authority from the central government to regional governments has been responded to by an increase in the issuance of business permits for mining and plantations, particularly
permits have been issued by the central government, as well as to help the central government in planning activities to demarcate forest land boundaries, including by settling disputes over these boundaries. The limited role of simply resolving problems arising from the central government's policies has led to less than optimal performance by regional governments in monitoring and dispute settlement duties,
oil palm plantations. Meanwhile, the authority of the central government to monitor regional authority is inadequate. Although the exact number of mining inspectors and civil servant investigators (PPNS) both at the national and regional levels is not known, it can be assumed to be inadequate for the task of monitoring land and forests. The central government has not established any scheme to optimally monitor forest damage resulting from mining and plantation activities. T he limited number of supen11sory resources for mining activities has been a serious consideration of the provincial government of East Kalimantan as indicated
The problem of limited numbers of mining inspectors and the increase in cases of environmental damage in East Kalimantan prompted the Regional Representatives Council (DPRD) to initiate the issuance of a regional regulation (Perda) on Conducting Reclamation and Post-i\Iining Operations. In this regulation, there is a mandate for provincial governments to form a .Monitoring Commission for Reclamation and PostMining Operations. Currently, these commissions have not yet been established as mandated in the four months after the regional regulation was issued, or by .March/ April2014.
Box 2.1 The Formation of a Monitoring
Commission for Reclamation and Post
Mining Operations in East Kalimantan
as in the cases of mining and plantation affairs.
2.2 NATURAL RESOURCEBASED REGIONAL ECONOMIC STRUCTURE
In general, governments in Indonesia are highly dependent on natural resources. The regional planning policies above reflect the dependence of regional governments on natural resources. A study by the World Bank has indicated that natural capital makes up one quarter of Indonesia's total wealth, and that 45 percent of Indonesia's wealth is derived from assets in the ground such as coal and other mining products.
by its action of issuing regional regulations (Perda) on reclamation and post-mining operations.
Meanwhile, in forestry affairs, it is still the central government that controls forest resource management. The role played by regional governments is to execute the central government's policies by maximizing monitoring of forest utilization, for which
Coal, petroleum and palm oil are the main basis of economic development in these research areas. As for the provincial governments of South Sumatra and East Kalimantan, their most important resources for development are coal and petroleum. Meanwhile, palm oil is a means of economic support for the provinces of West Kalimantan and South Sumatra.
11 JATAM data (2013) suggests that the ratio of mining inspectors to the number of companies and areas under monitoring is very low. Samarinda municipality, for example, has only four mining inspectors with a ratio of monitoring around 1 : 26 companies and 1 : 12,500 Ha. This means that one mining inspector is responsible for monitoring about 26 companies operating over 12,500 Ha. Furthermore, monitoring can only be carried out once a year due to a limited budget. Meanwhile, in East Kutai, the ratio reach to 1 : 19 companies over 330,000 Ha, with only two mining inspectors. (KOMPPAK, 2013: Menyediakan Taring bagi Macan yang Ompong: Tanggapan Kelompok Sipil atas R.ancangan Peraturan Daerah tentang Reklamasi dan Paska Tambang, Kertas Posisi, Balikpapan) .
12 A Perda was established in a DPRD plenary session of East Kalimantan Province at the beginning of November 2013. The
Perda number is currently under preparation by their legal department. 13 World Bank, 2009: Investing in a more Sustainable Indonesia, Jakarta
Uncovering Regional Wealth I 9
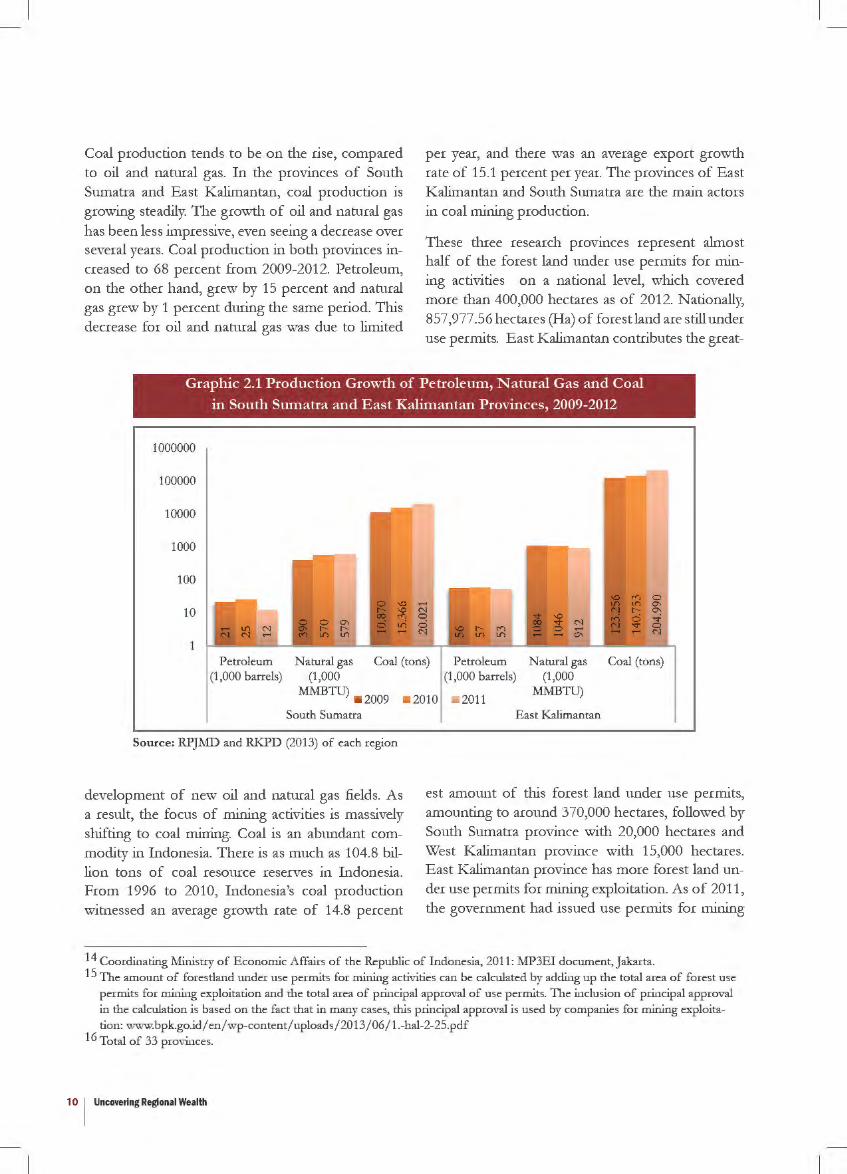
Coal production tends to be on the rise, compared to oil and natural gas. In the provinces of South Sumatra and East Kalimantan, coal production is growing steadily. The growth of oil and natural gas has been less impressive, even seeing a decrease over several years. Coal production in both provinces increased to 68 percent from 2009-2012. Petroleum, on the other hand, grew by 15 percent and natural gas grew by 1 percent during the same period. This decrease for oil and natural gas was due to limited
per year, and there was an average export growth rate of 15.1 percent per year. The provinces of East Kalimantan and South Sumatra are the main actors in coal mining production.
These three research provinces represent almost half of the forest land under use permits for mining actlVItles on a national level, which covered more than 400,000 hectares as of 2012. Nationally, 857,977.56 hectares (Ha) of forestland are still under use permits. East Kalimantan contributes the great-
Graphic 2.1 Production Growth of Petroleum, Natural Gas and Coal
in South Sumatra and East Kalimantan Provinces, 2009-2012
1000000
100000
10000
1000
100
10
1 Petroleum
(1,000 barrels) Natural gas Coal (tons) Petroleum
(1,000 barrels) Natural gas
(1,000 MMBTU)
Coal (tons) (1,000
MMBTU) • 2009 • 2010 • 2011 South Sumatra
Source: RPJMD and RKPD (2013) of each region
development of new oil and natural gas fields. As a result, the focus of mining activities is massively shifting to coal mining. Coal is an abundant commodity in Indonesia. There is as much as 104.8 billion tons of coal resource reserves in Indonesia. From 1996 to 2010, Indonesia's coal production witnessed an average growth rate of 14.8 percent
East Kalimantan
est amount of this forest land under use permits, amounting to around 370,000 hectares, followed by South Sumatra province with 20,000 hectares and West Kalimantan province with 15,000 hectares. East Kalimantan province has more forest land under use permits for mining exploitation. As of 2011, the government had issued use permits for mining
14 Coordinating Ministry of Economic Affairs of the Republic of Indonesia, 2011: MP3EI document, Jakarta. 15 The amount of forestland under use permits for mining activities can be calculated by adding up the total area of forest use
permits for mining exploitation and the total area of principal approval of use permits. The inclusion of principal approval in the calculation is based on the fact that in many cases, this principal approval is used by companies for mining exploitation: www.bpk.go.id/en/wp-content/uploads/2013/06/1.-hal-2-25.pdf
16 Total of 33 provinces.
10 I Uncovering Regional Wealth
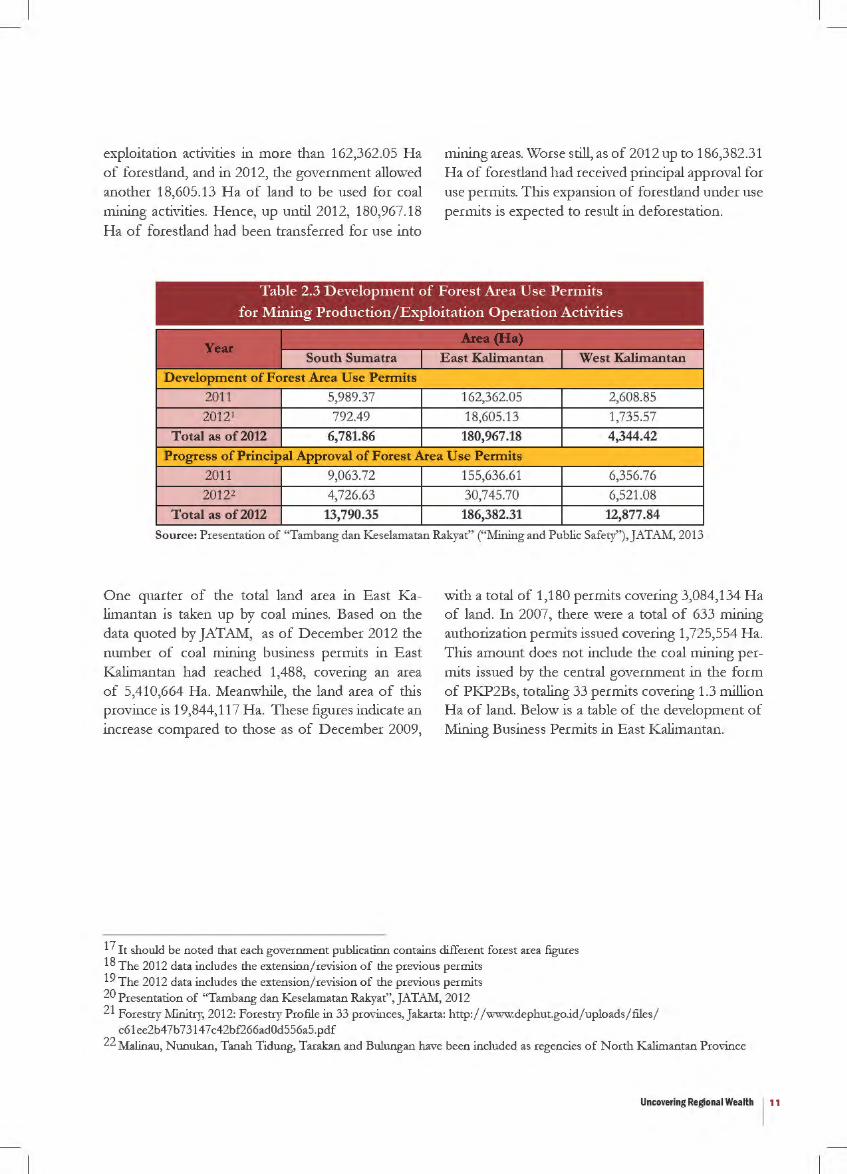
exploitation activities in more than 162,362.05 Ha of forestland, and in 2012, the government allowed another 18,605.13 Ha of land to be used for coal mining activities. Hence, up until 2012, 180,967.18 Ha of forestland had been transferred for use into
mining areas. Worse still, as of 2012 up to 186,382.31 Ha of forestland had received principal approval for use permits. This expansion of forestland under use permits is expected to result in deforestation.
Table 2.3 Development of Forest Area Use Permits
for Mining Production/Exploitation Operation Activities
Source: Presentation of "Tambang dan Keselamatan Rakyat" ("Mining and Public Safety''),JATAM, 2013
One quarter of the total land area in East Kalimantan is taken up by coal mines. Based on the data quoted by JATAM, as of December 2012 the number of coal mining business permits in East Kalimantan had reached 1,488, covering an area of 5,410,664 Ha. Meanwhile, the land area of this province is 19,844,117 Ha. These figures indicate an increase compared to those as of December 2009,
with a total of 1,180 permits covering 3,084,134 Ha of land. In 2007, there were a total of 633 mining authorization permits issued covering 1,725,554 Ha. This amount does not include the coal mining permits issued by the central government in the form of PKP2Bs, totaling 33 permits covering 1.3 million Ha of land. Below is a table of the development of Mining Business Permits in East Kalimantan.
17 It should be noted that each goverrunent publication contains different forest area figures 18 The 2012 data includes the extension/revision of the previous permits 19 The 2012 data includes the extension/ revision of the previous permits 20 Presentation of "Tambang dan Keselamatan Rakyat'', JATAM, 2012 21 Forestry Minitry, 2012: Forestry Profile in 33 provinces, Jakarta: http:/ /www.dephut.go.id/uploads/files/
c61 ee2b47b 73147 c42bf266ad0d556a5.pdf 22 Malinau, Nunukan, Tanah Tidung, Tarakan and Bulungan have been included as regencies of North Kalimantan Province
Uncovering Regional Wealth 111

Table 2.4 De,·elopment of Mining Business Permits in East Kalimantan
Year
No Area Number ofKP/IUP Area of mining zone (Ha)
2007 2009 2011 2007 2009 2011 1 Malinau1 9 7 39 45,210 11,114 544,594
2 Nunukan 17 22 30 176,298 70,112 119,875.47
3 Tana Tidung - 2 4 - 5,000 11,288 4 Bulungan 18 33 80 59,516 136,153.31 373,827.65
5 Berau 31 68 34 102,100.8 224,060.03 100,230
6 Samarinda 40 76 37 20,323.10 - 19,720
7 Kukar 412 678 224 660,886.21 1,236.37 729,914.41
8 East Kutai 53 38 - 310,675.95 670,549 -
9 West Kutai 15 138 223 247,956.33 395,486 1,217,624
10 North Penajam Paser 16 36 78 60,447.65 86,307.88 91,044 11 Paser 22 73 39 42,139.74 248,978.16 699,009
Total 663 1180 789 1,725,554 3,084,134 3,907,127
Source: Presentation of "Tam bang dan Keselamatan Rakyat" ("Milling and Public Safety''), JATAM, 2013
The area covered by oil palm in the regions continues to grow, particularly in Sumatra and Kalimantan. Indonesia has been the world's greatest producer of palm oil since 2007, when it took over the title from Malaysia, the current number two. Oil palm plantations have expanded to almost all of Indonesia's territories, especially on the two large islands of Sumatra and Kalimantan. In 2012, Sumatra hosted 62.5 percent of the oil palm plantation land in the
nation with 5,913,585 Ha, contributing 73.6 percent of the total national production (17,317,295 tons). Meanwhile, Kalimantan hosts the second-largest area of plantation land, representing 31 percent or 2,814,782 Ha, contributing 23.5 percent of total production (5,520,207 tons). The progress of oil palm plantation expansion in the three provinces during 2009-2011 is indicated in the following table.
Table 2.5 Oil Palm Areas by Pro,·ince, 2008-2012 (in Ha)
Year No Regions
2008 2009 2010
1 Sumatra 5,029,822 5,415,371 5,641,367
2 Java 26,425 27,163 28,057
3 Kalimantan 2,070,167 2,537,015 2,462,207
4 Sulawesi 178,632 211,380 196,302
5 Bali-Nusra - - -
6 Maluku-Papua 58,801 57,398 57,462
7 Indonesia 7,363,847 8,248,328 8,385,394
Source: Directorate General of Plantations
23 Plantations Director General, Plantations Nlirustry, 2012: Profile of palm oil in Indonesia 24 http:/ /fwi.or.id/tag/intip-hutan/ 25 East Kalimantan Province in 2012 26 RKPD East Kalimantan Government in 2013 27 It should be noted that each government publication contains different forest area figures.
12 I Uncovering Regional Wealth
2011 2012*
586,176 5,913,585
25,687 26,112
2,782,929 2,814,782
257,955 260,588
- -
59,077 59,554
8,992,824 9,074,621
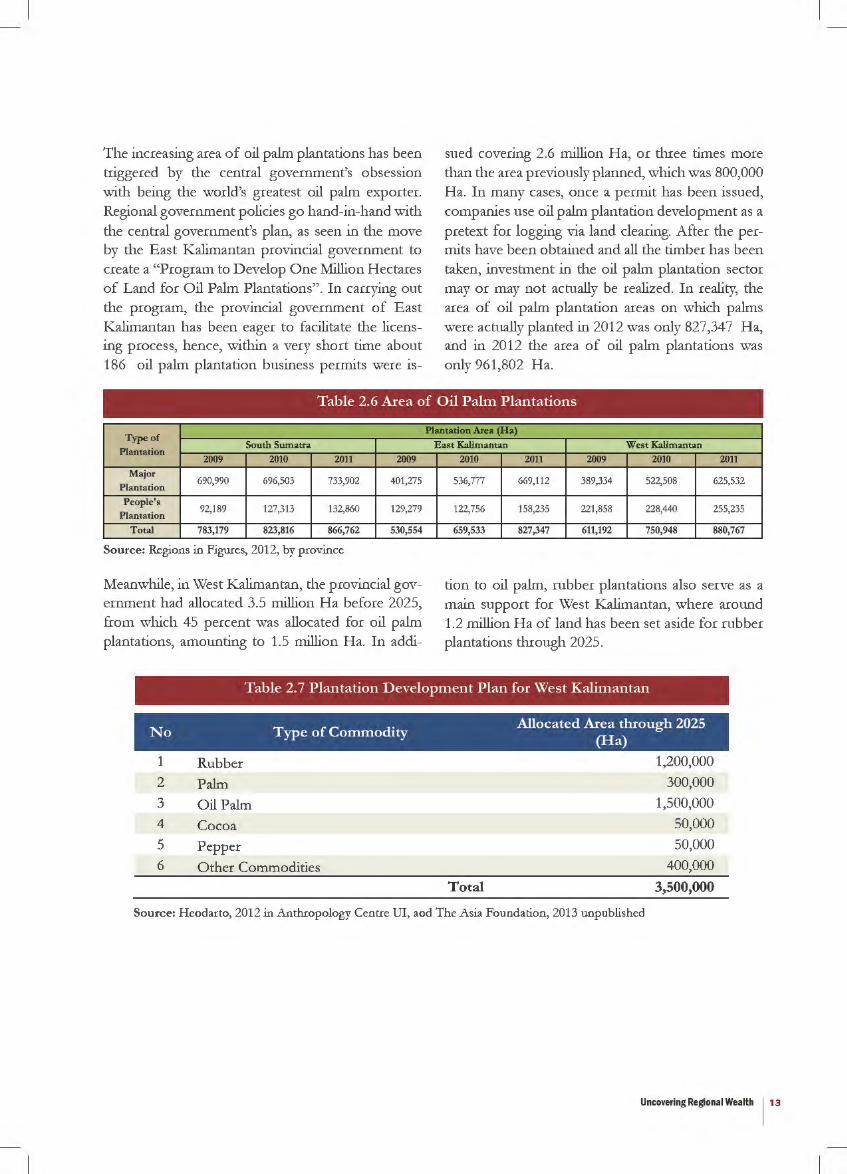
The increasing area of oil palm plantations has been triggered by the central government's obsession with being the world's greatest oil palm exporter. Regional government policies go hand-in-hand with the central government's plan, as seen in the move by the East Kalimantan provincial government to create a "Program to Develop One Million Hectares of Land for Oil Palm Plantations" . In carrying out the program, the provincial government of East Kalimantan has been eager to facilitate the licensing process, hence, within a very short time about 186 oil palm plantation business permits were is-
sued covering 2.6 million Ha, or three times more than the area previously planned, which was 800,000 Ha. In many cases, once a permit has been issued, companies use oil palm plantation development as a pretext for logging via land clearing. After the permits have been obtained and all the timber has been taken, investment in the oil palm plantation sector may or may not actually be realized. In reality, the area of oil palm plantation areas on which palms were actually planted in 2012 was only 827,347 Ha, and in 2012 the area of oil palm plantations was only 961,802 Ha.
Table 2.6 Area of Oil Palm Plantations
Type of Plantation
South Surnatta 2009 2010 2011 2009
Major 690,990 696,503 733,902 401,275
Plantation People's
92,189 127,313 132,860 129,279 Plantation
Total 783,179 823,816 866,762 530,554
Source: Regions in Figures, 2012, by province
Meanwhile, in West Kalimantan, the provincial government had allocated 3.5 million Ha before 2025, from which 45 percent was allocated for oil palm plantations, amounting to 1.5 million Ha. In addi-
Plantation Area (Ha) East Kalimantan West Kalimantan
2010 2011 2009 2010 2011
536,777 669,112 389,334 522,508 625,532
122,756 158,235 221,858 228,440 255,235
659,533 827,347 611,192 750,948 880,767
tion to oil palm, rubber plantations also serve as a main support for West Kalimantan, where around 1.2 million Ha of land has been set aside for rubber plantations through 2025.
Table 2.7 Plantation Development Plan for West Kalimantan
N T f C do Allocated Area through 2025
0 ype o ommo tty (Ha)
1 Rubber 1,200,000
2 Palm 300,000
3 Oil Palm 1,500,000
4 Cocoa 50,000
5 Pepper 50,000
6 Other Commodities 400,000
Total 3,500,000
Source: Hendarto, 2012 in Anthropology Centre UI, and The Asia Foundation, 2013 unpublished
Uncovering Regional Wealth 113
The expansion of mining and oil palm areas threaten increased horizontal conflicts. The government's commitment to promote economic growth through the mining and oil palm plantation sectors does not just threaten the existence of forests through the transfer of land and forest; it also puts pressure on the need to expand the land allocated for these two sectors. It is this need for land expansion that frequently results in land-based conflicts between local communities and companies. Additionally, some conflicts arise from land boundaries that have not been clearly demarcated by the government. Data from the Agrarian Renewal Consortium, for example, says that out of the designated area of forest, reaching 136.94 million Ha, or 69 percent of Indonesia's total territory, only around 12-13 percent of the area has been demarcated by the government. It is this condition that triggers the relatively high number of land conflicts.
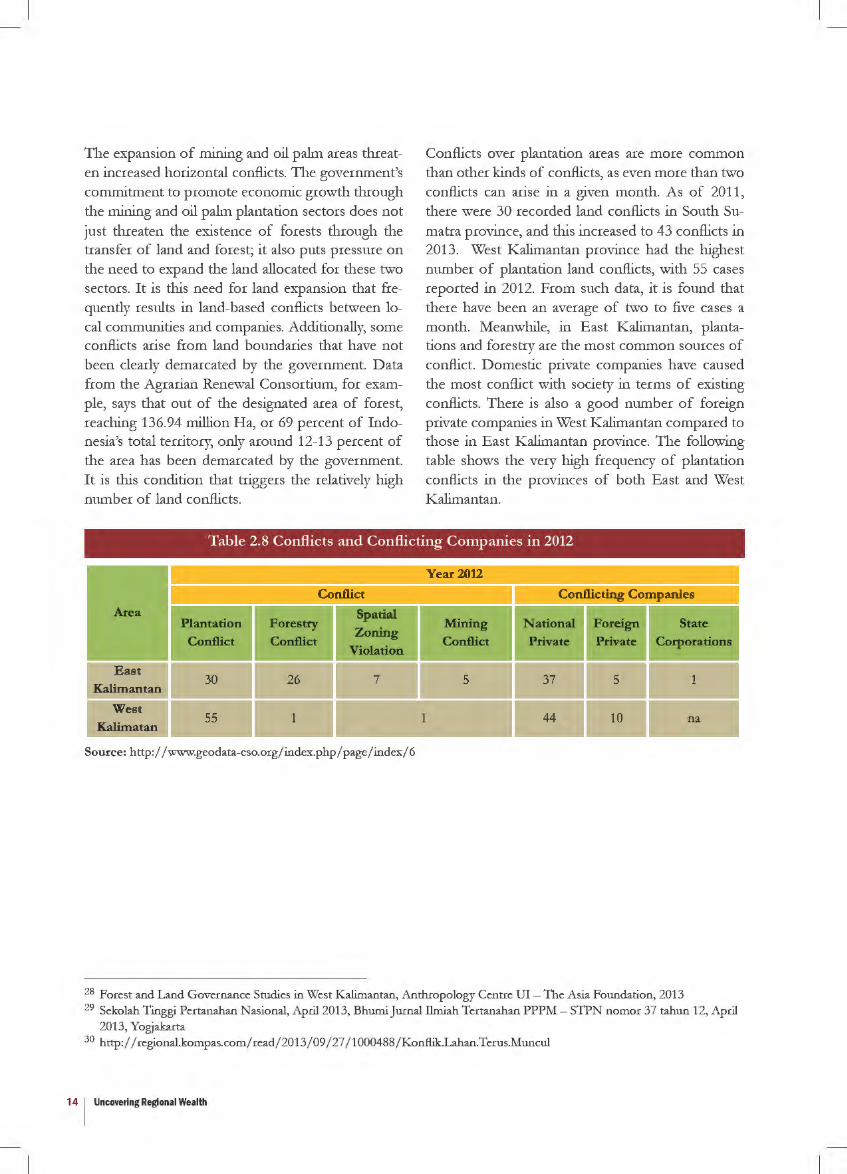
Conflicts over plantation areas are more common than other kinds of conflicts, as even more than two conflicts can arise in a given month. As of 2011, there were 30 recorded land conflicts in South Su
matra province, and this increased to 43 conflicts in 2013. West Kalimantan province had the highest number of plantation land conflicts, with 55 cases reported in 2012. From such data, it is found that there have been an average of two to five cases a month. Meanwhile, in East Kalimantan, plantations and forestry are the most common sources of conflict. Domestic private companies have caused the most conflict with society in terms of existing conflicts. There is also a good number of foreign private companies in West Kalimantan compared to those in East Kalimantan province. The following table shows the very high frequency of plantation conflicts in the provinces of both East and West Kalimantan.
Table 2.8 Conflicts and Conflicting Companies in 2012
Year 2012
Conflict Conflicting Companies Area Spatial
Plantation Forestry Zoning
Mining National Foreign State Conflict Conflict
Violation Conflict Private Private Corporations
East 30 26 7 5 37 5 1
Kalimantan
West 55 1
Kalimatan 1 44 10 na
Source: http:/ /www.geodata-cso.org/index.php/page/index/6
28 Forest and Land Governance Studies in West Kalimantan, Anthropology Centre UI-The Asia Foundation, 2013 29 Sekolah Tinggi Pertanahan Nasional, Apri12013, Bhumi Jurnal Ilmiah Tertanahan PPPM- STPN nomor 37 tahun 12, April
2013, Yogjakarta 30 http:/ /regional.kompas.com/read/2013/09/27 /1000488/Konflik.Lahan.Terus.Muncul
14 1 Uncovering Regional Wealth
2.3 EXPLOITATIVE PLANNING POLICIES IN THE ABSENCE OF ADEQUATE RECOVERY PROGRAMS
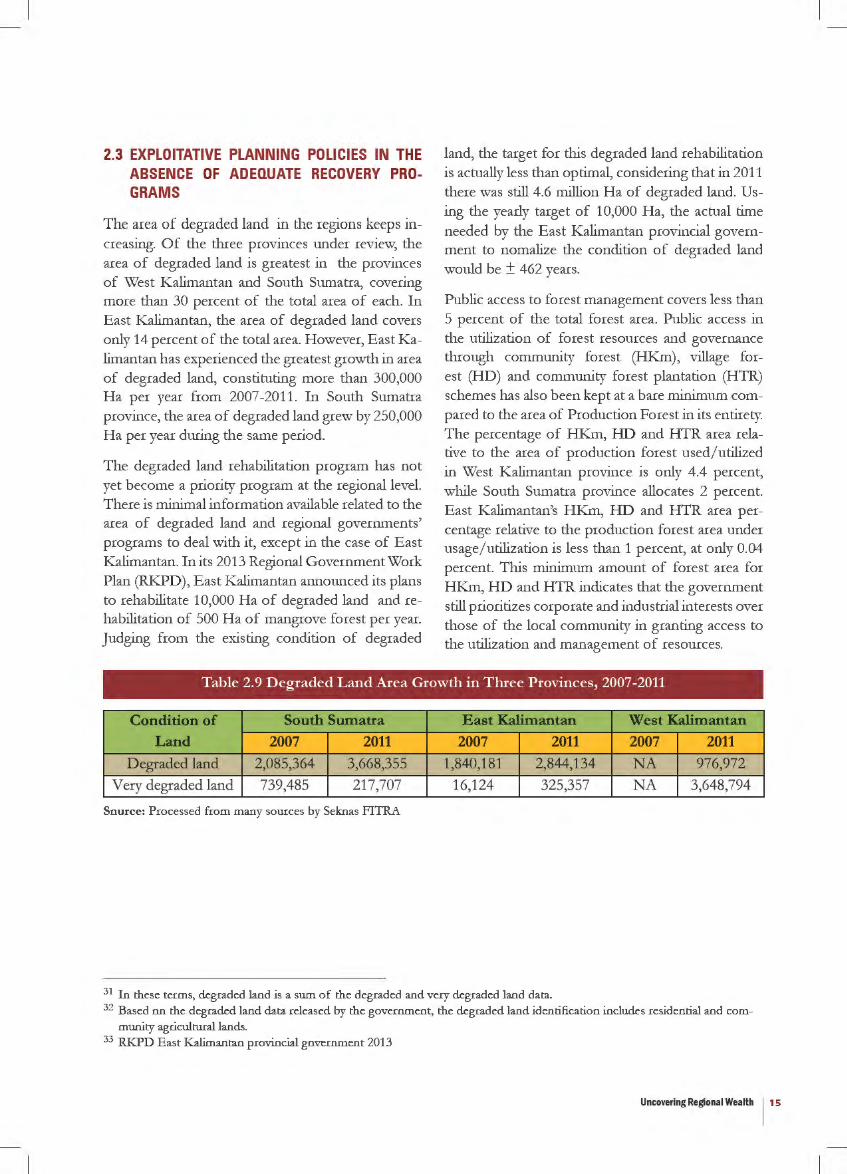
The area of degraded land in the regions keeps increasing. Of the three provinces under review, the area of degraded land is greatest in the provinces of West Kalimantan and South Sumatra, covering more than 30 percent of the total area of each. In East Kalimantan, the area of degraded land covers only 14 percent of the total area. However, East Kalimantan has experienced the greatest growth in area of degraded land, constituting more than 300,000 Ha per year from 2007-2011. In South Sumatra province, the area of degraded land grew by 250,000 Ha per year during the same period.
The degraded land rehabilitation program has not yet become a priority program at the regional level. There is minimal information available related to the area of degraded land and regional governments' programs to deal with it, except in the case of East Kalimantan. In its 2013 Regional Government Work Plan (RKPD), East Kalimantan announced its plans to rehabilitate 10,000 Ha of degraded land and rehabilitation of 500 Ha of mangrove forest per year. Judging from the existing condition of degraded
land, the target for this degraded land rehabilitation is actually less than optimal, considering that in 2011 there was still 4.6 million Ha of degraded land. Using the yearly target of 10,000 Ha, the actual time needed by the East Kalimantan provincial government to nomalize the condition of degraded land would be ± 462 years.
Public access to forest management covers less than 5 percent of the total forest area. Public access in the utilization of forest resources and governance through community forest (HKm), village forest (HD) and community forest plantation (HTR) schemes has also been kept at a bare minimum compared to the area of Production Forest in its entirety. The percentage of HKm, HD and HTR area relative to the area of production forest used/ utilized in West K alimantan province is only 4.4 percent, while South Sumatra province allocates 2 percent. East K alimantan's H Km, HD and HTR area percentage relative to the production forest area under usage/ utilization is less than 1 percent, at only 0.04 percent. This minimum amount of forest area for HKm, HD and HTR indicates that the government still prioritizes corporate and industrial interests over those of the local community in granting access to the utilization and management of resources.
Table 2. 9 Degraded Land Area Growth in Three Provinces, 2007-2011
Condition of South Sumatra East Kalimantan West Kalimantan Land 2007 2011 2007 2011 2007 2011
D egraded land 2,085,364 3,668,355 1,840,181 2,844,134 NA 976,972
Very degraded land 739,485 217,707 16,124 325,357 NA 3,648,794
Source: Processed from many sources by Seknas FITRA
31 In these terms, degraded land is a sum of the degraded and very degraded land data. 32 Based on the degraded land data released by the government, the degraded land identification includes residential and com
munity agricultural lands. 33 RKPD East Kalimantan provincial government 2013
Uncovering Regional Wealth 11 S
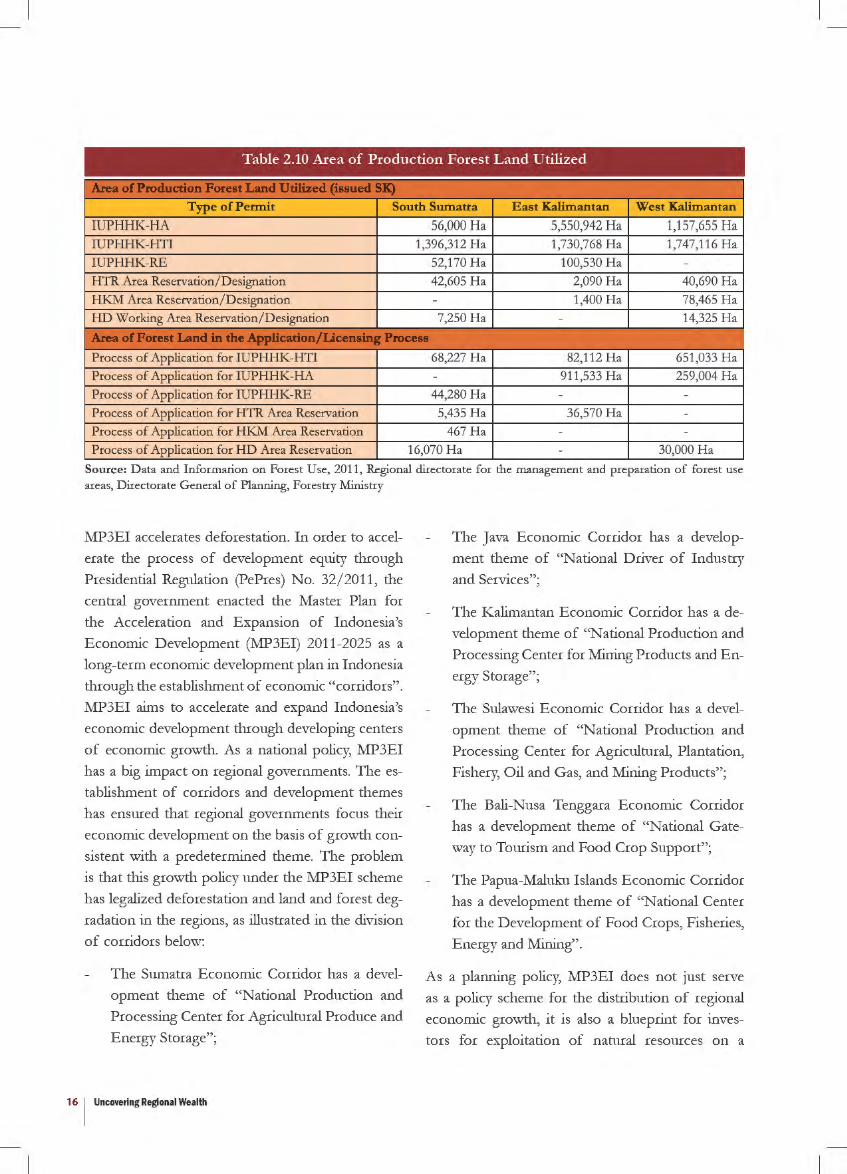
Table 2.10 Area of Production Forest Land Utilized
Source: Data and Information on Forest Use, 2011, Regional directorate for the management and preparation of forest use areas, Directorate General of Planning, Forestry Ministry
MP3EI accelerates deforestation. In order to accel
erate the process of development equity through
Presidential Regulation (PePres) No. 32/ 2011, the
central government enacted the Master Plan for
the Acceleration and Expansion of Indonesia's
Economic Development (MP3EI) 2011-2025 as a
long-term economic development plan in Indonesia
through the establishment of economic "corridors".
MP3EI aims to accelerate and expand Indonesia's
economic development through developing centers
of economic growth. As a national policy, MP3EI
has a big impact on regional governments. The es
tablishment of corridors and development themes
has ensured that regional governments focus their
economic development on the basis of growth con
sistent with a predetermined theme. The problem
is that this growth policy under the MP3EI scheme
has legalized deforestation and land and forest deg
radation in the regions, as illustrated in the division
of corridors below:
The Sumatra Economic Corridor has a devel
opment theme of "National Production and
Processing Center for Agricultural Produce and
Energy Storage";
16 1 Uncovering Regional Wealth
The Java Economic Corridor has a develop
ment theme of "National Driver of Industry
and Services";
The Kalimantan Economic Corridor has a de
velopment theme of ''National Production and
Processing Center for Mining Products and En
ergy Storage";
The Sulawesi Economic Corridor has a devel
opment theme of "National Production and
Processing Center for Agricultural, Plantation,
Fishery, Oil and Gas, and Mining Products";
The Bali-Nusa Tenggara Economic Corridor
has a development theme of "National Gate
way to Tourism and Food Crop Support";
The Papua-Maluku Islands Economic Corridor
has a development theme of "National Center
for the Development of Food Crops, Fisheries,
Energy and Mining''.
As a planning policy, MP3EI does not just serve
as a policy scheme for the distribution of regional
economic growth, it is also a blueprint for inves
tors for exploitation of natural resources on a
17Uncovering Regional Wealth
more massive scale. Despite the consideration of environment-based sustainable development under the MP3EI scheme, the government has failed to optimally fulfill this in practice. As found by Sek-nas FITRA, the pro-poor, pro-job, pro-growth and pro-environment policies as pillars of development are considered less capable of balancing sustainable development.
The Long-Road Corridor (Corridor Permit) poses a threat of deforestation and degradation. In addition to policies supporting the transfer of land and forest function for mining and agricultural/plantation ac-tivities, forest land is also threatened by the issuance of corridor permits. In Forestry Minister’s Regula-tion No. P. 30/Menhut-Ii/2010 on the Amendment of Forestry Minister’s Regulation No. P.9/Menhut-Ii/2010 on Permits for Corridor Construction and Utilization, Article 1, it is stated that:
“The corridor is a transportation pathway in the form of roadways, canals, dollies/railways or other pathways constructed and/or used mainly for trans-porting timber or non-timber forest products, or timber and non-timber primary industry products from IUPHHK areas to natural forests, or from IUPHHK areas to plantation forests, or from IPK or forest product primary industry areas to timber storage centers/log ponds at the edge of rivers or the sea, or other places via forest areas outside IUPHHK/BK areas to natural forest or plantation forest areas, IPK or the primary industrial area of the associated forest products.”
From this definition it is clear that the objective of the corridor construction is to facilitate the flow and distribution of mining and forestry products.
In Article 17 of Forestry Minister’s Regulation No. P. 30/Menhut-Ii/2010 on the Amendment of For-estry Minister’s Regulation No. P.9/Menhut-Ii/2010 on Permits for Corridor Construction and Utiliza-tion, it is stated that the provisions for constructing a corridor are as follows:
a. It should be managed so that the transportation route is as short as possible;
b. Non-forestry areas are preferred;
c. No burning is allowed; and
d. The maximum corridor width is forty (40) me-ters, consisting of main road/road surfaces, right and left road shoulders, felling from the edges of the right and left shoulders of the road and so on.
What actually happens in the field is that the issu-ance of a corridor permit often poses a threat to forests. The provinces of South Sumatra (with an area of 52,170 Ha) and Jambi (46,385 Ha) have in-troduced a land allocation known as Hutan Harapan, or ‘Hope Forest’—an ecosystem restoration forest of 98,555 Ha, which was previously used as a pro-duction forest concession area, where the ecosys-tem restoration is taking place. The current Hutan Harapan has once again come under threat by plans to construct a corridor for transporting coal-mining products. The total area of this coal transport road will pass through a forest area for total length of 51.3 kilometers and width of ±30-50 meters. Thus, up to 154 Ha of forest land will being opened due to the construction of the road, with an affected area of ± 5,300 Ha.
34 Seknas FITRA and The Asia Foundation, 2013: Measuring Commitment: An Analysis of National Budget and Planning Poli-cies and the Impact on Land and Forest Governance in Indonesia, Jakarta.
35 www.antarabengkulu.com/berita/18940/hutan-harapan-terancam-tambang-batubara
Part Ill
Reviewing Regional Budgets: Measuring Regional Government
Commitment and Partiality Toward Land and Forest Governance
3.1 OVERVIEW OF REGIONAL REVENUE
In a previous budget study conducted by Seknas FITRA, an analysis of regional revenue was needed to see where the revenue comes from and how great its fiscal capacity is in funding internal programs and personnel.
Regional revenue is obtained through locally generated revenue (PAD), balanced funds (daper) and a type called Miscellaneous Lawful Regional Revenue (LPDS). Law No. 33/2004 concerning fiscal balance for central and regional governments stipulates that there are three main sources of regional revenue:
• Locally Generated Revenue (PAD), consisting of Regional Tax, Regional Fees and Charges, Results of Separated Regional Asset Management, and Lawful Miscellaneous PAD.
• Balanced Funds, consisting of General Allocation Funds (DAU), Special Allocation Funds (DAK), and Profit-Sharing Funds (DBH).
• Other Revenue (LPDS), consisting of Grant Funds, Emergency Funds, Profit-Sharing Funds, Tax from Other Provincial and Local Governments, Adjustment and Special Autonomy Funds,
Financial Assistance from Other Provincial and Local Governments, and 'Other' Revenue.
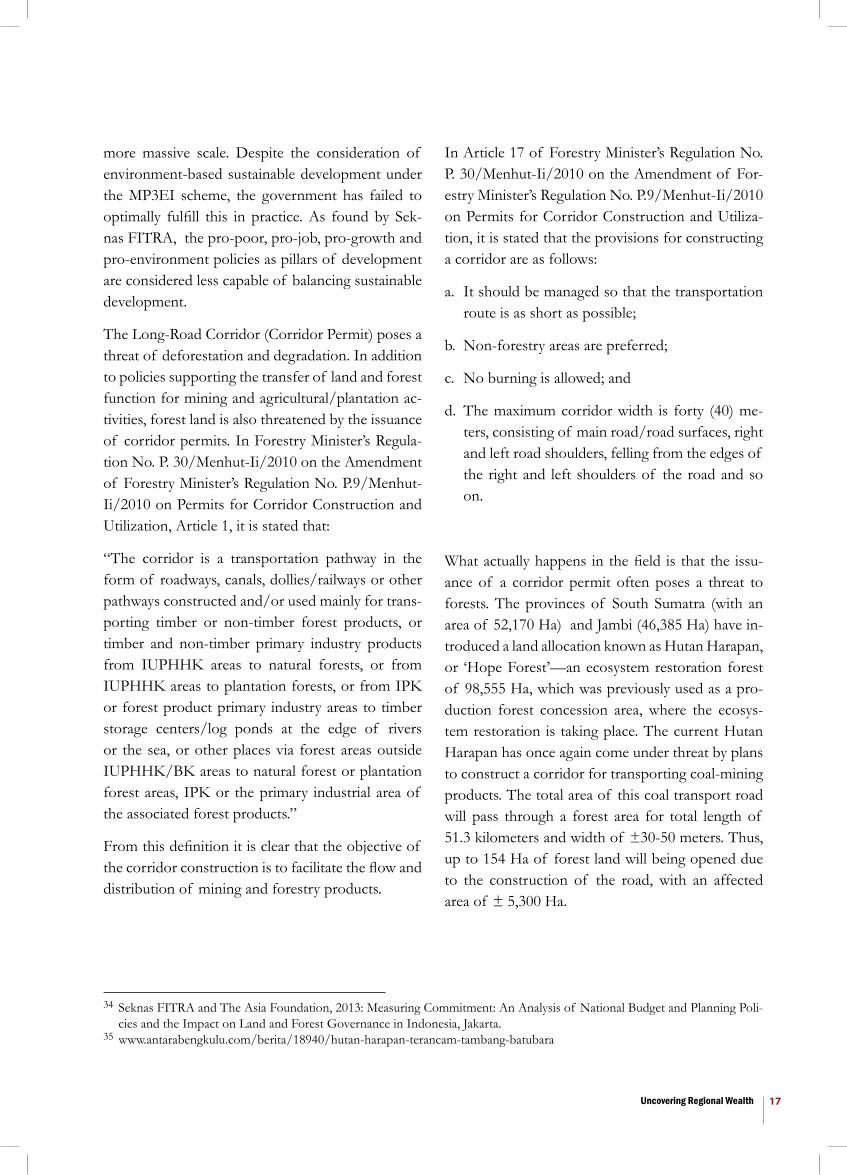
District government revenue remains dependent on balanced funds, while its provincial counterpart is almost equally distributed between balanced funds and locally generated revenue (PAD). The average proportion of balanced funds making up regional revenue in the six district-level governments studied reached 83.5 percent in the period 2009-2012. This figure confirms FITRA's previous findings, which suggested that there had been no significant change in regional governments' dependence on balanced funds. Despite the increased contribution from Other Revenue (LPDS) in the last few years, balanced funds remain the greatest contributor to regional revenue. Regional governments fail to optimally manage locally generated revenue (PAD) as the base source of regional revenue.
The district with the greatest dependence on balanced funds is Musi Banyuasin, where for four consecutive years the dependence rate was over 90 percent. Berau district, on the other hand, had the lowest average dependence from 2009-2012, at 73 percent. PAD contributed only 5.9 percent of the revenue in the six regions for 2009-2012. This
Graphic 3.1- Re,·enue Composition by District, 2009-2012
100% ~~~~~~~~~~~~n-~~ 90% 80% 70% 60% 50% 40% 30% 20% 10% 0%
18 1 Uncovering Regional Wealth
Sin tang KubuRaya Berau Bulungan
Graphic. 3.2 - Revenue Composition by Pro,·ince, 2009-2012
0% 10% 20% 30% 40% 50% 60% 70% 80% 90% 100%
• PAD • DAPER • LPDS
figure is still below the national average for PAD contribution during 2009-2012 of 6.6 percent. The highest PAD contribution was in Berau, with nearly 10 percent between 2009 and 2012. Musi Banyuasin district was only able to collect 4 percent during the same period, which is nearly stagnant.
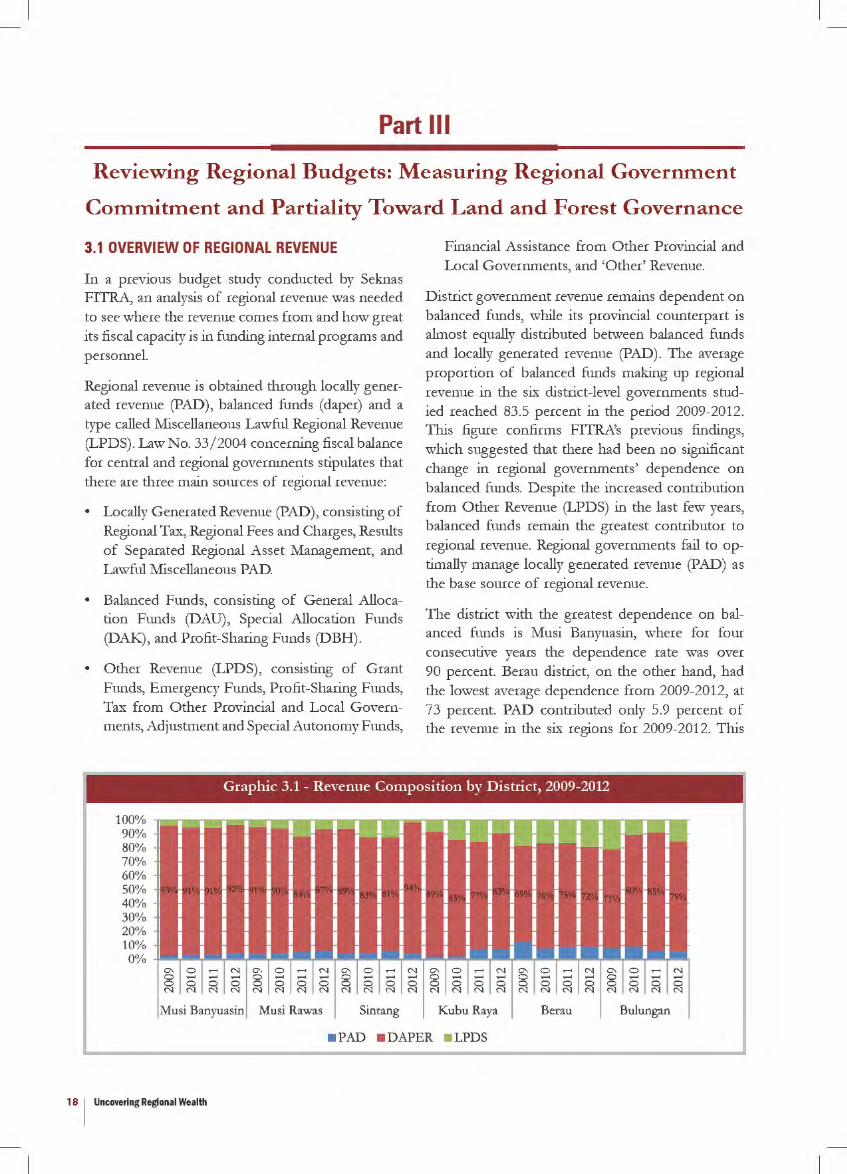
At the provincial level, findings indicated an average balanced fund contribution in the three provinces between 2009-2012 of 52.3 percent. This figure
shows that the provincial financial independence level is improving, and the three provinces are even above the average of the 33 provinces in Indonesia. The average PAD of all provinces in Indonesia during 2009-2012 was 40 percent of regional revenue. Meanwhile, East Kalimantan and South Sumatra's average PAD during 2009-2012 was 43.2 and 42.9 percent respectively, while West Kalimantan's was 42.2 percent.
Graphic 3.3 Balanced Funds Composition by Prm·ince
0% 10% 20% 30% 40% 50% 60% 70% 80% 90% 100%
• DBH • DAU • DAK
Uncovering Regional Wealth 119
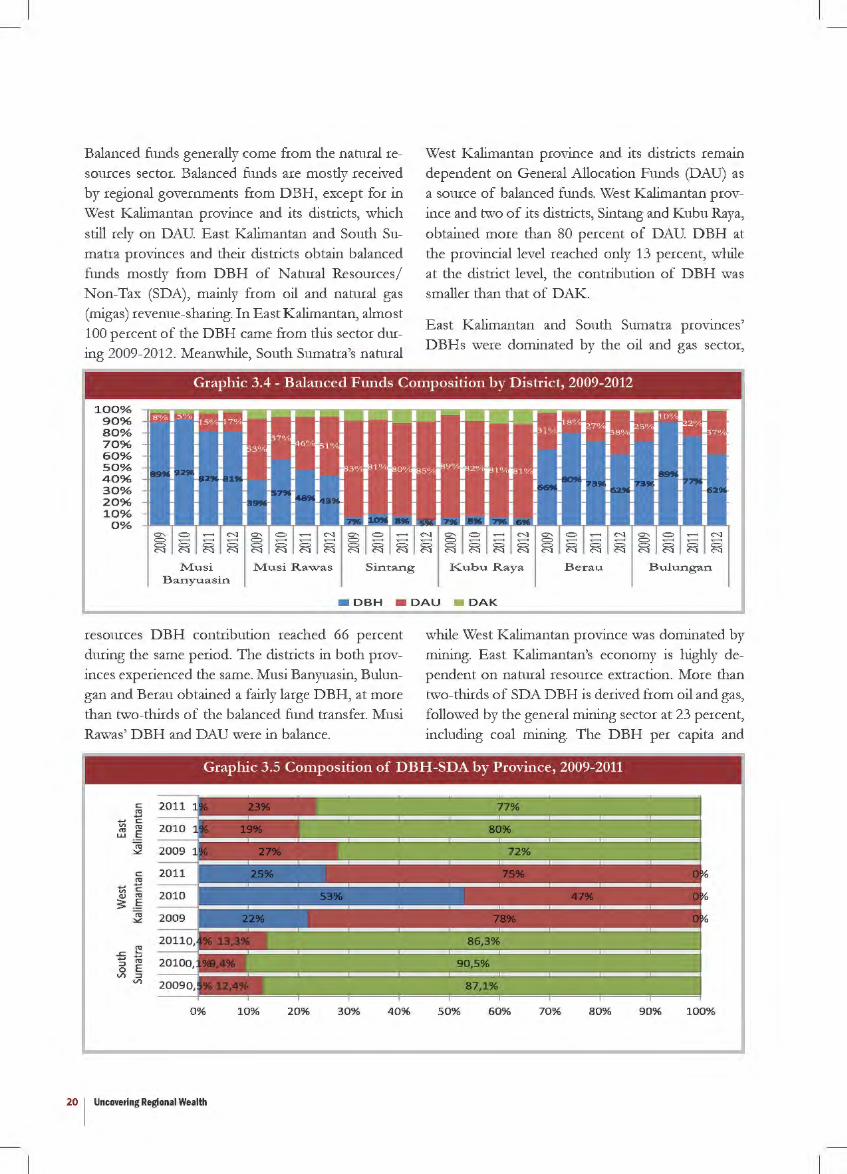
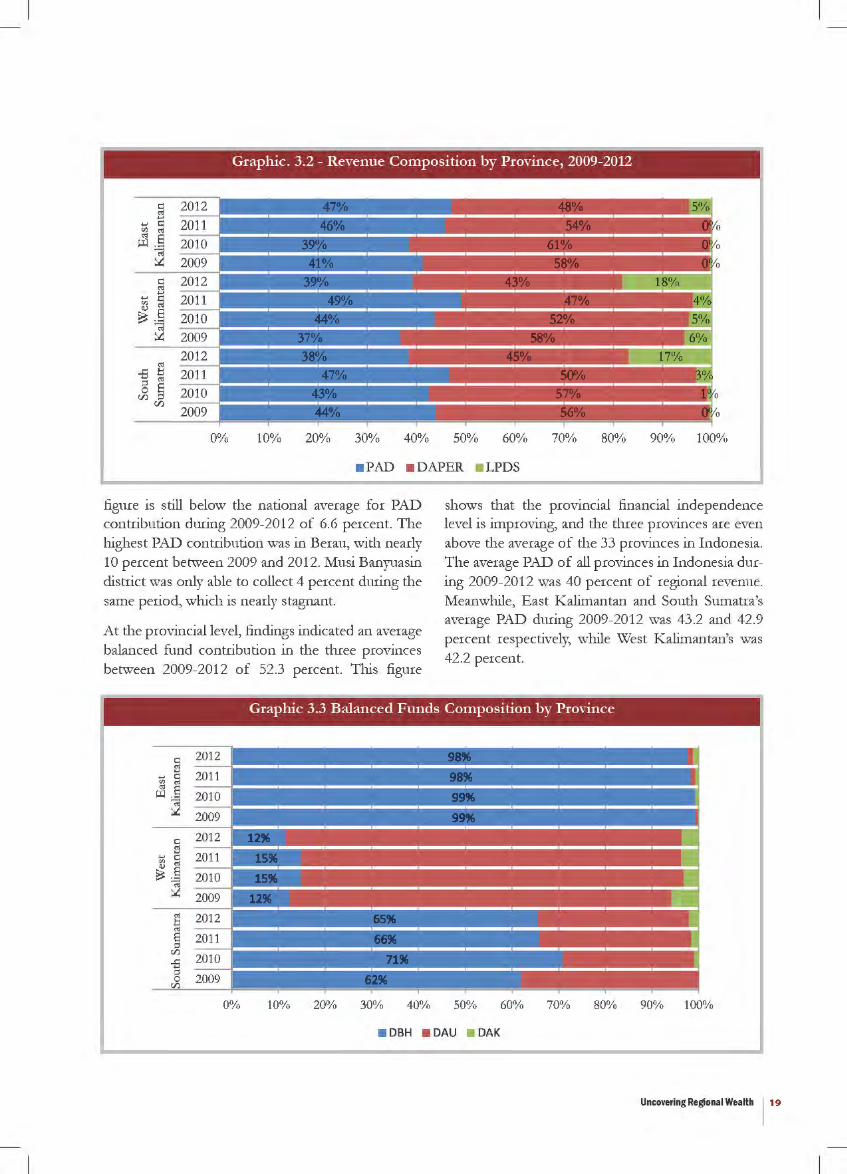
Balanced funds generally come from the natural resources sector. Balanced funds are mostly received by regional governments from DBH, except for in West Kalimantan province and its districts, which
still rely on DAU. East Kalimantan and South Sumatra provinces and their districts obtain balanced funds mostly from DBH of Natural Resources/ Non-Tax (SDA), mainly from oil and natural gas (migas) revenue-sharing. In East Kalimantan, almost 100 percent of the DBH came from this sector during 2009-2012. Meanwhile, South Sumatra's natural
West Kalimantan province and its districts remain dependent on General Allocation Funds (DAU) as a source of balanced funds. West Kalimantan province and two of its districts, Sintang and Kubu Raya,
obtained more than 80 percent of DAU. DBH at the provincial level reached only 13 percent, while at the district level, the contribution of DBH was smaller than that of DAK.
East Kalimantan and South Sumatra provinces' DBHs were dominated by the oil and gas sector,
Graphic 3.4 - Balanced Funds Composition by District, 2009-2012
100% 90% 80% 70% 60% 50% 40% 30% 20% 10%
0%
IHo/.: IW.I_ I_o ~-~-~-~-~-~-~-~-~-~-~-~-~-. ~-~ I .-J!O'Y•L . ~-1 I l 1.wl m"l I I I I I I I I I I I lw .11 xo/'fm"'• o r s•/.J 1!2'~'·1, " I I I I I 117 "/"L .. J_ I I I I I I I I I ~I I rx ~ I I f' 7 ~ I I I I J53 "/.l I 6 y.l' 1 '~'1 I I I I I I I I I I I I I I I I I I I I I I I I . l 0 I·. I t· 0 ,I . I I I I I I I I I I 1 1 1 1 1 1 1 1 f'3 "/.t ·'Y. HO"/.r s% ) ~rZ"/.r'"/<fH"/.1 1 1 1 1 1 1 1 I I I I I I I I I I I I I I I I I I I I I I I I I I I I I I I I I I I I I I I I I I I I I I I I I I I I I I I I I I I I I I I I I I I I I I I I I I I I I I I I I .1 I I I I I I I I I I I I I I
Musi Banyuasin
Musi Rav.ras Sin tang I<ubu Raya
• DBH • DAU • OAK
Berau Bulungan
resources DBH contribution reached 66 percent during the same period. The districts in both provinces experienced the same. Musi Banyuasin, Bulungan and Berau obtained a fairly large DBH, at more than two-thirds of the balanced fund transfer. Musi Rawas' DBH and DAU were in balance.
while West Kalimantan province was dominated by mining. East Kalimantan's economy is highly dependent on natural resource extraction. More than two-thirds of SDA DBH is derived from oil and gas, followed by the general mining sector at 23 percent, including coal mining. The DBH per capita and
Graphic 3.5 Composition of DBH-SDA by Province, 2009-2011
c: 2011 2 - c:
<I'> ro 2010 ro .§ LLJ
Cii 2009 "" c: 2011 2 - c: <I'>
2010 Q) ro ~ .§
Cii 2009 "" 2011
-5 ~ ::> ro 0 E
Vl ::> Vl 2009
0% 10% 20% 30% 40% 50% 60% 70% 80% 90% 100%
20 I Uncovering Regional Wealth
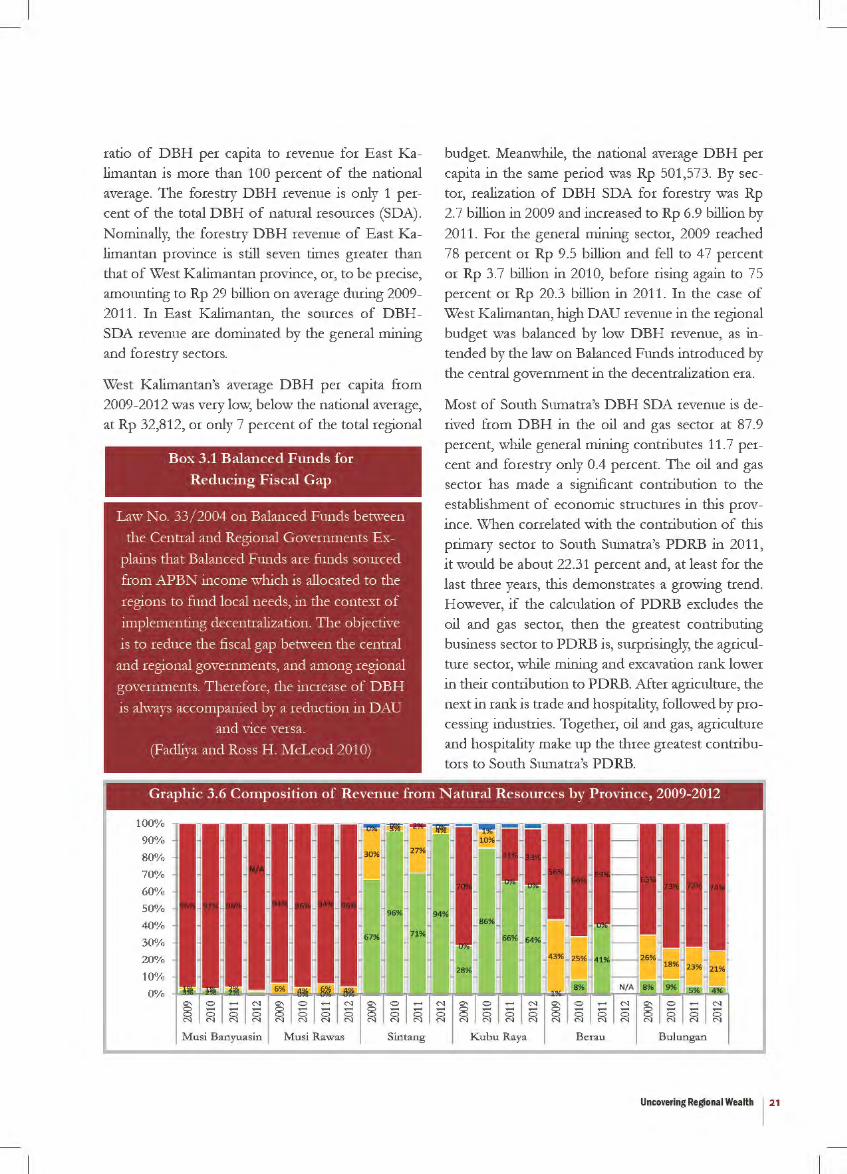
ratio of DBH per capita to revenue for East Kalimantan is more than 100 percent of the national average. The forestry DBH revenue is only 1 percent of the total DBH of natural resources (SDA).
Nominally, the forestry DBH revenue of East Kalimantan province is still seven times greater than that of West Kalimantan province, or, to be precise, amounting to Rp 29 billion on average during 2009-2011. In East Kalimantan, the sources of DBHSDA revenue are dominated by the general mining and forestry sectors.
West Kalimantan's average DBH per capita from 2009-2012 was very low, below the national average, at Rp 32,812, or only 7 percent of the total regional
Box 3.1 Balanced Funds for
Reducing Fiscal Gap
Lnv l\"o. 33/ 2004 on Balanced Funds between
the Central and Regional Governments Ex
plains that Balanced Funds are funds sourced
from APBN income which is allocated to the
regions to fund local needs, in the context of
implementing decentralization. The objective
is to reduce the fiscal gap between the central
and regional governments, and among regional
governments. T herefore, the increase of DBH
is always accompanied by a reduction in DAU and vice versa.
(Fadliya and Ross H . ~fcLeod 2010)
budget. Meanwhile, the national average DBH per capita in the same period was Rp 501,573. By sector, realization of DBH SDA for forestry was Rp 2.7 billion in 2009 and increased to Rp 6.9 billion by
2011. For the general mining sector, 2009 reached 78 percent or Rp 9.5 billion and fell to 47 percent or Rp 3.7 billion in 2010, before rising again to 75 percent or Rp 20.3 billion in 2011. In the case of West Kalimantan, high DAU revenue in the regional budget was balanced by low DBH revenue, as intended by the law on Balanced Funds introduced by the central government in the decentralization era.
Most of South Sumatra's DBH SDA revenue is de
rived from DBH in the oil and gas sector at 87.9 percent, while general mining contributes 11.7 percent and forestry only 0.4 percent. The oil and gas sector has made a significant contribution to the establishment of economic structures in this province. When correlated with the contribution of this primary sector to South Sumatra's PDRB in 2011, it would be about 22.31 percent and, at least for the last three years, this demonstrates a growing trend. However, if the calculation of PDRB excludes the oil and gas sector, then the greatest contributing business sector to PDRB is, surprisingly, the agriculture sector, while mining and excavation rank lower in their contribution to PDRB. After agriculture, the next in rank is trade and hospitality, followed by processing industries. Together, oil and gas, agriculture and hospitality make up the three greatest contributors to South Sumatra's PDRB.
Graphic 3.6 Composition of Re,·enue from N atural Resources by Province, 2009-2012
100%
90%
80%
70%
60%
50%
40%
30%
20%
10%
0% ~~~~~--~~~~~~~~~~~~~~~~~~~~~~~~~~~~~
Musi Banyuasin Musi Rawas Sin tang Kubu Raya Berau Bulungan
Uncovering Regional Wealth 121
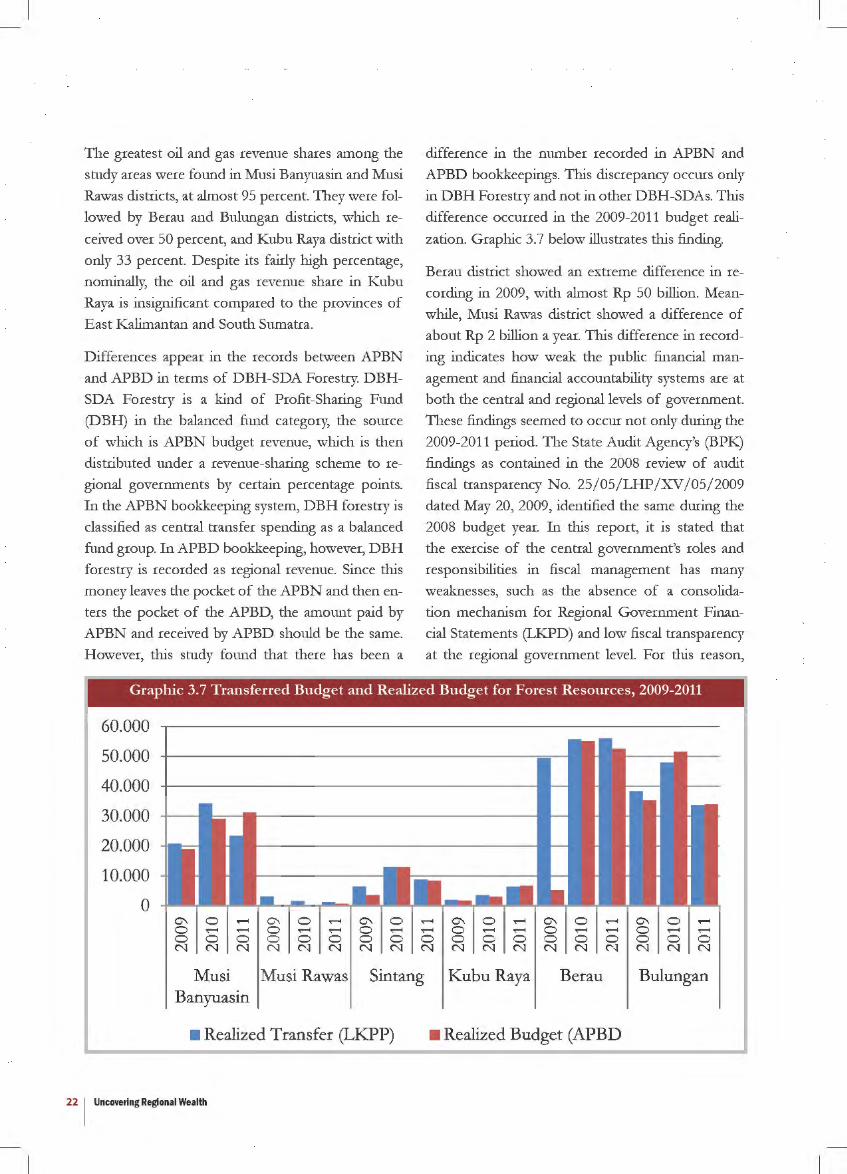
The greatest oil and gas revenue shares among the
study areas were found in Musi Banyuasin and Musi
Rawas districts, at almost 9S percent. They were fol
lowed by Berau and Bulungan districts, which re
ceived over SO percent, and Kubu Raya district with
only 33 percent. Despite its fairly high percentage,
nominally, the oil and gas revenue share in Kubu
Raya is insignificant compared to the provinces of
East Kalimantan and South Sumatra.
Differences appear in the records between APBN
and APBD in terms of DBH-SDA Forestry. DBH
SDA Forestry is a kind of Profit-Sharing Fund
(DBH) in the balanced fund category, the source
of which is APBN budget revenue, which is then
distributed under a revenue-sharing scheme to re
gional governments by certain percentage points.
In the APBN bookkeeping system, DBH forestry is classified as central transfer spending as a balanced
fund group. In APBD bookkeeping, however, DBH
forestry is recorded as regional revenue. Since this
money leaves the pocket of the APBN and then en
ters the pocket of the APBD, the amount paid by
APBN and received by APBD should be the same.
However, this study found that there has been a
difference in the number recorded in APBN and
APBD bookkeepings. This discrepancy occurs only
in DBH Forestry and not in other DBH-SDAs. This
difference occurred in the 2009-2011 budget reali
zation. Graphic 3.7 below illustrates this finding.
Berau district showed an extreme difference in re
cording in 2009, with almost Rp SO billion. Mean
while, Musi Rawas district showed a difference of
about Rp 2 billion a year. This difference in record
ing indicates how weak the public financial man
agement and financial accountability systems are at
both the central and regional levels of government.
These findings seemed to occur not only during the
2009-2011 period. The State Audit Agency's (BPK)
findings as contained in the 2008 review of audit
fiscal transparency No. 2S/ OS/ LHP / A.'V / OS/ 2009
dated May 20, 2009, identified the same during the
2008 budget year. In this report, it is stated that
the exercise of the central government's roles and
responsibilities in fiscal management has many
weaknesses, such as the absence of a consolida
tion mechanism for Regional Government Finan
cial Statements (LKPD) and low fiscal transparency
at the regional government level. For this reason,
Graphic 3. 7 Transferred Budget and Realized Budget for Forest Resources, 2009-2011
60.000
50.000
40.000
30.000
20.000
10.000
0 0\ 0 0 N
0 ....... ....... ....... 0 0 N N
0\ 0 ....... 0\ 0 ....... ....... 0 0 0 0 0 N N N N
0 ....... 0\ 0 ....... 0\ 0 ....... ....... ....... 0 ....... ....... 0 ....... ....... 0 0 0 0 0 0 0 0 N N N N N N N N
Musi Musi Rawas Sin tang Kubu Raya Berau Banyuasin
• Realized Transfer (LKPP) • Realized Budget (APBD
22 I Uncovering Regional Wealth
0\ 0 ....... 0 ....... ....... 0 0 0 N N N
Bulungan
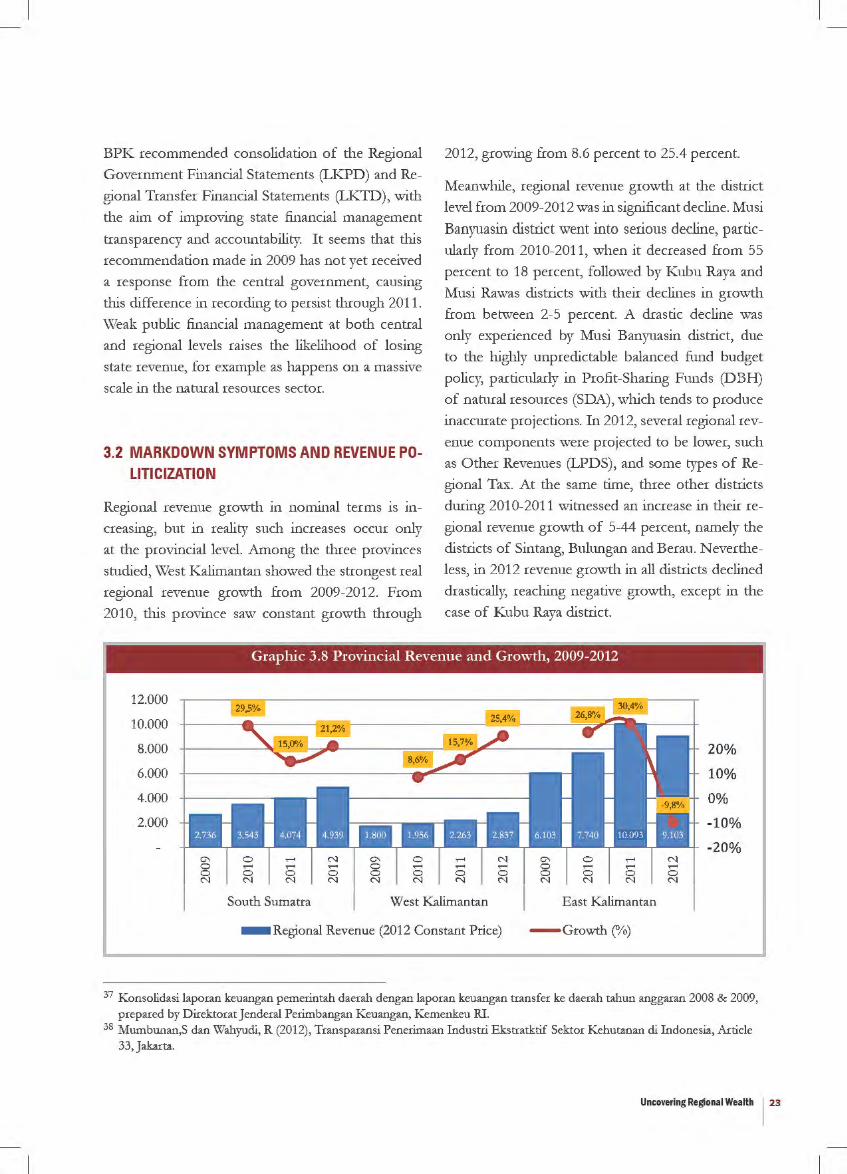
BPK recommended consolidation of the Regional
Government Financial Statements (LKPD) andRe
gional Transfer Financial Statements (LKTD), with
the aim of improving state financial management
transparency and accountability. It seems that this
recommendation made in 2009 has not yet received
a response from the central government, causing
this difference in recording to persist through 2011.
Weak public financial management at both central
and regional levels raises the likelihood of losing
state revenue, for example as happens on a massive
scale in the natural resources sector.
3.2 MARKDOWN SYMPTOMS AND REVENUE POLITICIZATION
Regional revenue growth in nominal terms is increasing, but in reality such increases occur only
at the provincial level. Among the three provinces
studied, West Kalimantan showed the strongest real
regional revenue growth from 2009-2012. From
2010, this province saw constant growth through
2012, growing from 8.6 percent to 25.4 percent.
Meanwhile, regional revenue growth at the district
level from 2009-2012 was in significant decline. Musi
Banyuasin district went into serious decline, partic
ularly from 2010-2011, when it decreased from 55
percent to 18 percent, followed by Kubu Raya and
Musi Rawas districts with their declines in growth
from between 2-5 percent. A drastic decline was
only experienced by Musi Banyuasin district, due
to the highly unpredictable balanced fund budget
policy, particularly in Profit-Sharing Funds (DBH)
of natural resources (SDA), which tends to produce
inaccurate projections. In 2012, several regional rev
enue components were projected to be lower, such
as Other Revenues (LPDS), and some types of Re
gional Tax. At the same time, three other districts
during 2010-2011 witnessed an increase in their re
gional revenue growth of 5-44 percent, namely the
districts of Sintang, Bulungan and Berau. Neverthe
less, in 2012 revenue growth in all districts declined
drastically, reaching negative growth, except in the
case of Kubu Raya district.
Graphic 3.8 Pro\'incial Revenue and Growth, 2009-2012
12.000
10.000
8.000 20%
6.000 10%
4.000 0%
2.000 -10%
-20%
South Sumatra West Kalimantan East Kalimantan
- Regional Revenue (2012 Constant Price) - Growth(%)
37 Konsolidasi laporan keuangan pemerintah daerah dengan laporan keuangan transfer ke daerah tahun anggaran 2008 & 2009, prepared by Direktorat Jenderal Perimbangan Keuangan, Kemenkeu RI.
38 Mumbunan,S dan Wahyudi, R (2012), Transparansi Penerimaan Industri Ekstratktif Sektor Kehutanan di Indonesia, Article 33, Jakarta.
Uncovering Regional Wealth 123

Markdown of budget plans as a strategy for reaching performance targets. T his study found that all regional governments were less than optimistic in projecting their revenue. At the district level, regional revenue projections are lower than or equal to those of 2-3 years ago. Meanwhile, at the provincial level, projections are lower than in the preceding year. East Kalimantan projected it would experience a drastic decline, from 30 percent in 2011 to -9.8 percent in 2012. This is a surprising projection, given that in previous years it saw its revenue exceed the targets. One example is what happened in 2011, when the province obtained an achievement target
150 percent higher than its revenue projection. That is, from Rp 6.62 trillion in projected value it reached Rp 10.09 trillion in its realized value. South Sumatra also projected its regional revenue in 2011 to reach Rp 3.5 trillion, but achieved spending of Rp 4 trillion. West Kalimantan projected its regional revenue to be Rp 1.78 trillion in 2011, and spent Rp 2.26 trillion. What these regional governments do in projecting their revenues is called a markdown plan of regional revenue, in which the revenue projection or target is planned to be lower than the previous year in order to make the performance they report on seem successful because it exceeds the stated target.
Graphic 3.9 District Revenue and Growth, 2009-2012
2.500.000 60% 50%
- 2.000.000 40% = 30% t 1.500.000 20%
10% Q.. 1.000.000 0% ~ -10% - 500.000 -20%
-30% 0 -40%
Musi Musi Rawas Sin tang Kubu Raya Berau Bulungan Banyuasin
- Regional Revenue - Growth
Table 3.1 Comparison of Original (M), Amended (P) and Realized (R) Provincial and District
Revenue, 2009-2012, Based on Constant Price 2012 (Rp billion)
24 1 Uncovering Regional Wealth
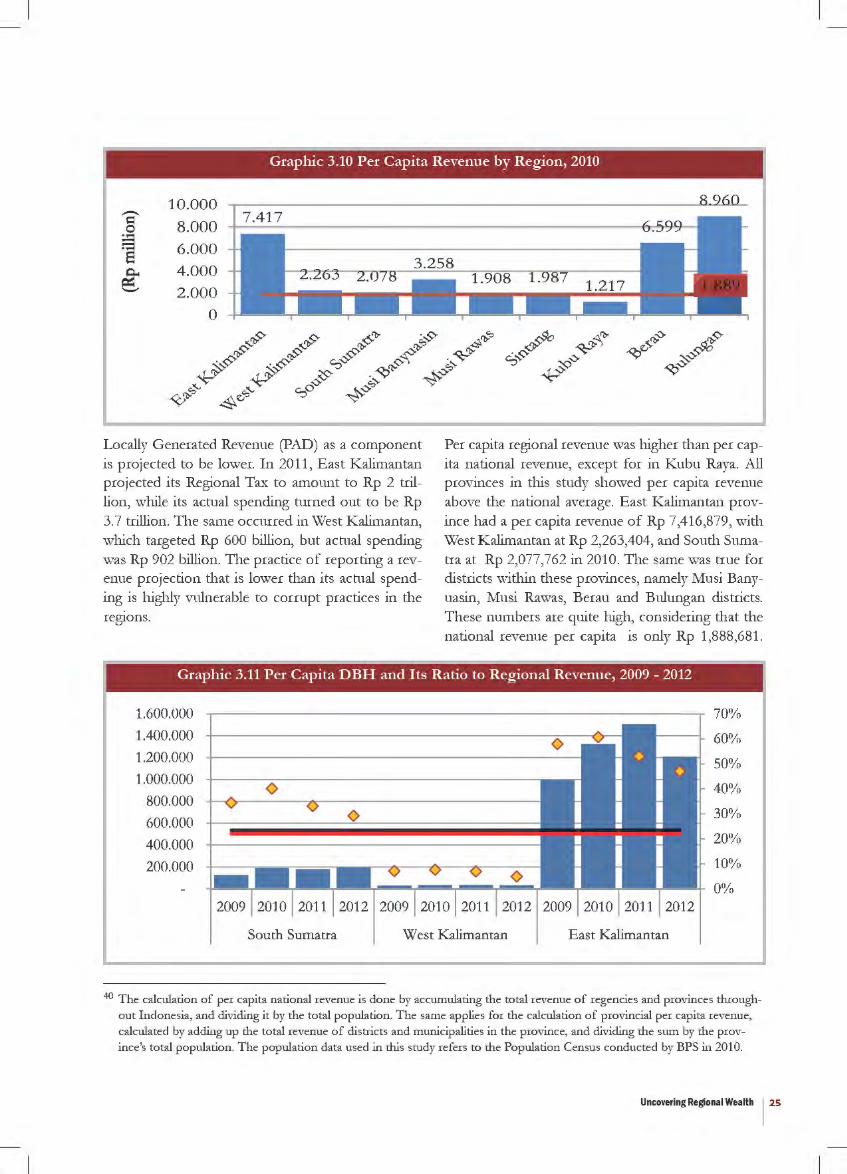
Graphic 3.10 Per Capita Revenue by Region, 2010
10.000 -c: 8.000 0 s 6.000 E ~ 4 .000 ._.
2.000
0
Locally Generated Revenue (PAD) as a component is projected to be lower. In 2011, East Kalimantan projected its Regional Tax to amount to Rp 2 trillion, while its actual spending turned out to be Rp 3.7 trillion. The same occurred in West Kalimantan, which targeted Rp 600 billion, but actual spending was Rp 902 billion. The practice of reporting a revenue projection that is lower than its actual spending is highly vulnerable to corrupt practices in the regiOns.
Per capita regional revenue was higher than per capita national revenue, except for in Kubu Raya. All provinces in this study showed per capita revenue above the national average. East Kalimantan province had a per capita revenue of Rp 7,416,879, with West K alimantan at Rp 2,263,404, and South Sumatra at Rp 2,077,762 in 2010. The same was true for districts within these provinces, namely Musi Banyuasin, Musi Rawas, Berau and Bulungan districts. These numbers are quite high, considering that the national revenue per capita is only Rp 1 ,888,681 .
Graphic 3.11 Per Capita DBH and Its Ratio to Regional Revenue, 2009- 2012
1.600.000
1.400.000
1.200.000
1.000.000
800.000
600.000
400.000
200.000
South Sumatra West Kalimantan East Kalimantan
70%
60%
50%
40%
30%
20%
10%
0%
40 The calculation of per capita national revenue is done by accumulating the total revenue of regencies and provinces throughout Indonesia, and dividing it by the total population. The same applies for the calculation of provincial per capita revenue, calculated by adding up the total revenue of districts and municipalities in the province, and dividing the sum by the province's total population. The population data used in this study refers to the Population Census conducted by BPS in 2010.
Uncovering Regional Wealth 125
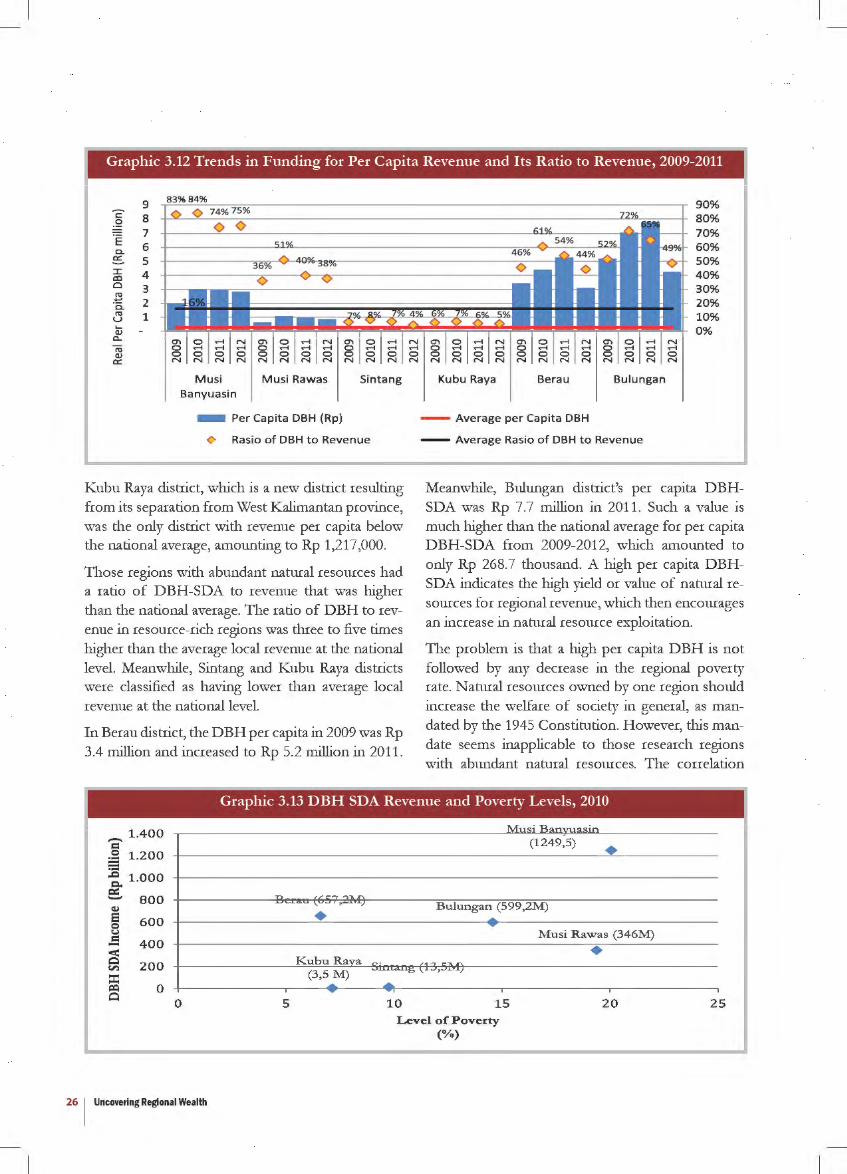
Graphic 3.12 Trends in Funding for Per Capita Re\'enue and Its Ratio to Revenue, 2009-2011
9 '"2 8 .2 .E 7
a. 6 .:=.. 5 I 4 co 0 3 "' ..... 2 ·a. "' u 1 .... Q)
a..
"' Q) cr::
Musi Banyuasin
M usi Raw as
- Per Capita DBH (Rp)
Sintang
<> Rasio of DBH t o Revenue
Kubu Raya district, which is a new district resulting from its separation from West Kalimantan province, was the only district with revenue per capita below the national average, amounting to Rp 1,217,000.
Those regions with abundant natural resources had a ratio of DBH-SDA to revenue that was higher than the national average. The ratio of DBH to revenue in resource-rich regions was three to five times higher than the average local revenue at the national level. Meanwhile, Sintang and Kubu Raya districts were classified as having lower than average local revenue at the national level.
In Berau district, the D BH per capita in 2009 was Rp 3.4 million and increased to Rp 5.2 million in 2011.
Kubu Raya Berau Bulungan
- Average per Capita DBH
- Average Rasio of DBH to Revenue
90% 80% 70% 60% SO% 40% 30% 20% 10% 0%
Meanwhile, Bulungan district's per capita DBHSDA was Rp 7.7 million in 2011. Such a value is much higher than the national average for per capita DBH-SDA from 2009-2012, which amounted to only Rp 268.7 thousand. A high per capita DBHSDA indicates the high yield or value of natural resources for regional revenue, which then encourages an increase in natural resource exploitation.
The problem is that a high per capita DBH is not followed by any decrease in the regional poverty rate. Natural resources owned by one region should increase the welfare of society in general, as mandated by the 1945 Constitution. H owever, this mandate seems inapplicable to those research regions with abundant natural resources. The correlation
Graphic 3.13 DBH SDA Re\'enue and Po\'erty Levels, 2010
1.4 00 -= _g 1.200 = ~ 1.000
e:. 800
600
400
200
0 0
26 1 Uncovering Regional Wealth
Be=u E657 ,2M)
• Kubu Rava ~ ·
(3,5 M) ~
5
M usillan\Cl.lasin (1249,5) •
Bulungan (599,2M) ...... .....
Musi Rawas (346M)
• ~ · ~
- o \' , -/
..... 10 15 20 25
Leve l of P o v e rty (% )
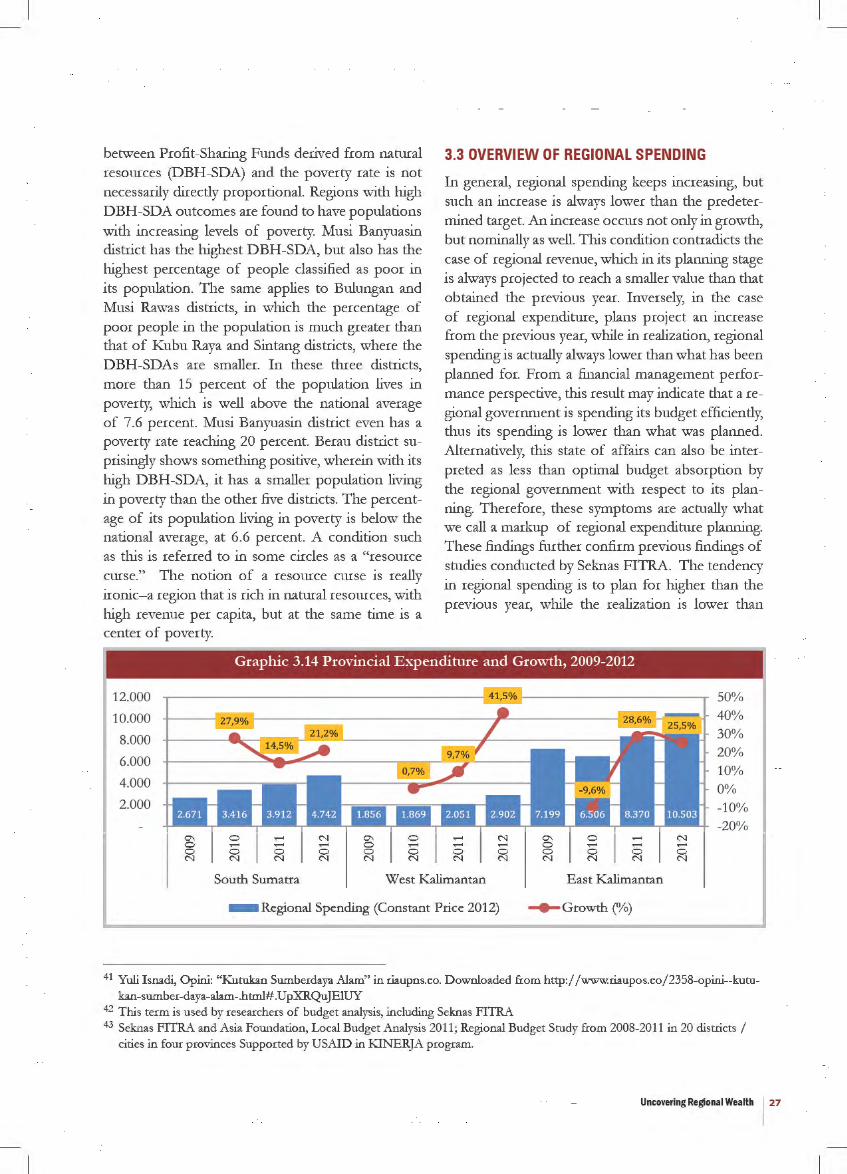
between Profit-Sharing Funds derived from natural resources (DBH-SDA) and the poverty rate is not necessarily directly proportional. Regions with high DBH-SDA outcomes are found to have populations with increasing levels of poverty. Musi Banyuasin district has the highest DBH-SDA, but also has the highest percentage of people classified as poor in its population. The same applies to Bulungan and Musi Rawas districts, in which the percentage of poor people in the population is much greater than that of Kubu Raya and Sintang districts, where the DBH-SDAs are smaller. In these three districts, more than 15 percent of the population lives in poverty, which is well above the national average of 7.6 percent. Musi Banyuasin district even has a poverty rate reaching 20 percent. Berau d_istri~t s~prisingly shows something positive, wher~ w1~.1ts high DBH-SDA, it has a smaller populauon livmg in poverty than the other five districts. The percentage of its population living in poverty is .b~ow the national average, at 6.6 percent. A condiuon such as this is referred to in some circles as a "resource curse." The notion of a resource curse is really ironic-a region that is rich in natural resources, with high revenue per capita, but at the same time is a center of poverty.
3.3 OVERVIEW OF REGIONAL SPENDING
In general, regional spending keeps increasing, but such an increase is always lower than the predetermined target. An increase occurs not only in growth, but nominally as well. This condition contradicts the case of regional revenue, which in its planning stage is always projected to reach a smaller value than that obtained the previous year. Inversely, in the case of regional expenditure, plans project an inc~ease from the previous year, while in realization, regronal spending is actually always lower than what has been planned for. From a financial management performance perspective, this result may indicate that aregional government is spending its budget efficiently, thus its spending is lower than what was planned. Alternatively, this state of affairs can also be interpreted as less than optimal budget absor~tion by the regional government with respect to 1ts planning. Therefore, these symptoms are. actually ~hat we call a markup of regional expenditure plannmg. These findings further confirm previous findings of studies conducted by Seknas FITRA. The tendency in regional spending is to plan for higher than the previous year, while the realization is lower than
Graphic 3.14 Pro\'incial Expenditure and Growth, 2009-2012
12.000 SO%
10.000 40%
8.000 30% 20%
6.000 10%
4.000 0% 2.000 -10%
-20%
South Sumatra West Kalimantan East Kalimantan
- Regional Spending (Constant Price 2012) - Growth(%)
41 Yuli Isnadi, Opini: "Kutukan Sumberdaya Alam" in riaupos.co. Downloaded from http:/ /www:riaupos.co/2358-opini--kutukan-sumber-daya-alam-.html#.UpXRQuJEIUY
42 This term is used by researchers of budget analysis, including Seknas FITRA . . . 43 Seknas FITRA and Asia Foundation, Local Budget Analysis 2011; Regional Budget Study from 2008-2011 m 20 distncts /
cities in four provinces Supported by USAID in KINERJA program.
Uncovering Regional Wealth 127
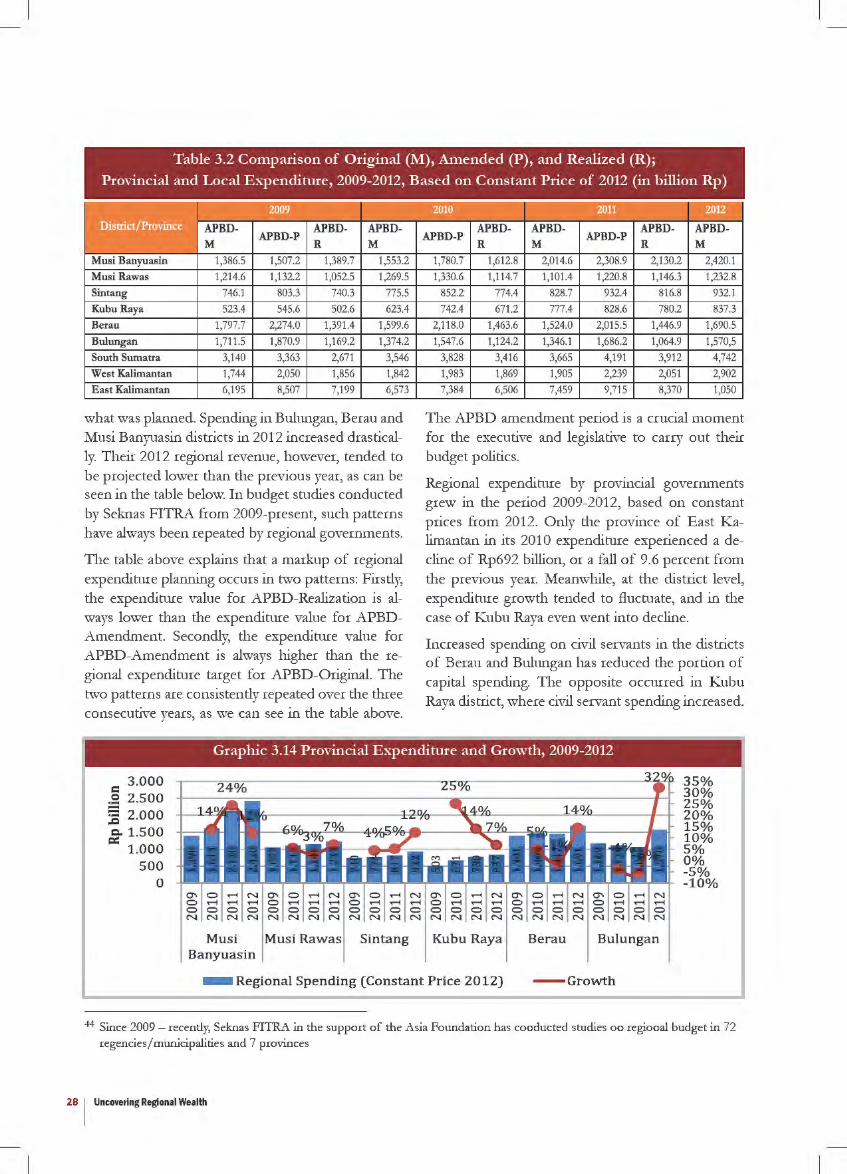
Table 3.2 Comparison of Original (M), Amended (P), and Realized (R);
Provincial and Local Expenditure, 2009-2012, Based on Constant Price of 2012 (in billion Rp)
mE .... • I APBD- APBD- APBD-M
APBD-P R M
Musi Banyuasin 1,386.5 1,507.2 1,389.7 1,553.2 MusiRawas 1,214.6 1,132.2 1,052.5 1,269.5 Sin tang 746.1 803.3 740.3 775.5 KubuRaya 523.4 545.6 502.6 623.4 Berau 1,797.7 2,274.0 1,391.4 1,599.6
Bulungan 1,711.5 1,870.9 1,169.2 1,374.2 South Sumatra 3,140 3,363 2,671 3,546 West Kalimantan 1,744 2,050 1,856 1,842
East Kalimantan 6,195 8,507 7,199 6,573
what was planned. Spending in Bulungan, Berau and Musi Banyuasin districts in 2012 increased drastically. Their 2012 regional revenue, however, tended to be projected lower than the previous year, as can be seen in the table below. In budget studies conducted by Seknas FITRA from 2009-present, such patterns have always been repeated by regional governments.
The table above explains that a markup of regional expenditure planning occurs in two patterns: Firstly, the expenditure value for APBD-Realization is always lower than the expenditure value for APBDAmendment. Secondly, the expenditure value for APBD-Amendment is always higher than the regional expenditure target for APBD-Original. The two patterns are consistently repeated over the three consecutive years, as we can see in the table above.
fi!Im fEll fii.m APBD- APBD- APBD- APBD-
APBD-P R M
APBD-P R M
1,780.7 1,612.8 2,014.6 2,308.9 2,130.2 2,420.1 1,330.6 1,114.7 1,101.4 1,220.8 1,146.3 1,232.8
852.2 774.4 828.7 932.4 816.8 932.1 742.4 671.2 777.4 828.6 780.2 837.3
2,118.0 1,463.6 1,524.0 2,015.5 1,446.9 1,690.5
1,547.6 1,124.2 1,346.1 1,686.2 1,064.9 1,570,5 3,828 3,416 3,665 4,191 3,912 4,742
1,983 1,869 1,905 2,239 2,051 2,902
7,384 6,506 7,459 9,715 8,370 1,050
The APBD amendment period is a crucial moment for the executive and legislative to carry out their budget politics.
Regional expenditure by provincial governments grew in the period 2009-2012, based on constant prices from 2012. Only the province of East Kalimantan in its 2010 expenditure experienced a decline of Rp692 billion, or a fall of 9.6 percent from the previous year. Meanwhile, at the district level, expenditure growth tended to fluctuate, and in the case of Kubu Raya even went into decline.
Increased spending on civil servants in the districts of Berau and Bulungan has reduced the portion of capital spending. The opposite occurred in Kubu Raya district, where civil servant spending increased.
Graphic 3.14 Provincial Expenditure and Growth, 2009-2012
3.000 = :3 2.500 :c 2.000 !Z 1.500
1.000 500
0
Musi Banyuasin
Musi Rawas Sintang Kubu Raya
- Regional Spending (Constant Price 2012)
Berau Bulungan
- Growth
35% 30% 25% 20% 15% 10% 5% 0% -5% -10%
44 Since 2009 - recently, Seknas FITRA in the support of the Asia Foundation has conducted studies on regional budget in 72 regencies/ municipalities and 7 provinces
28 1 Uncovering Regional Wealth
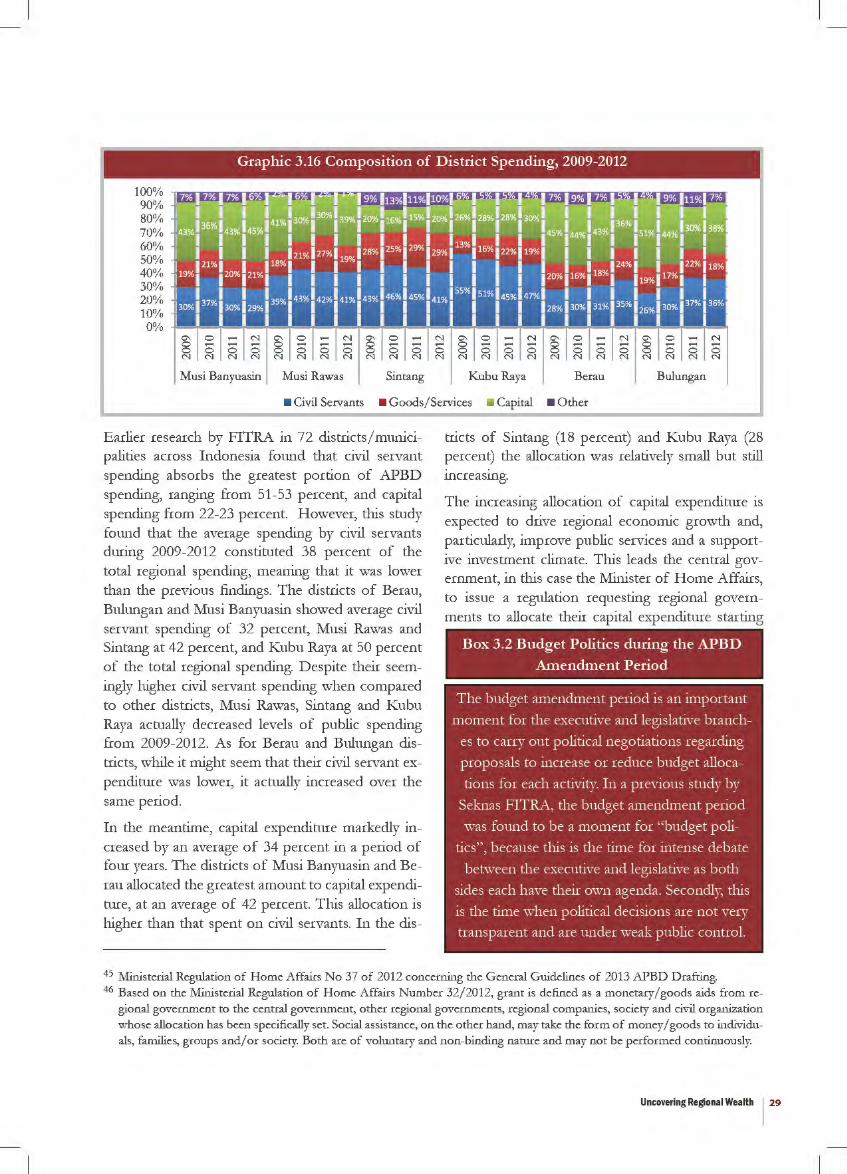
Graphic 3.16 Composition of District Spending, 2009-2012
lOOo/o ~mn~~mn~nr~~~~r.•~~ 90% 80% 70% 60% 50% 40% 30% 20% 10% 0%
Musi Banyuasin Musi Rawas Sin tang Kubu Raya Berau Bulungan
• Civil Servants • Goods/Services • Capital • Other
Earlier research by FITRA in 72 districts/ municipalities across Indonesia found that civil servant spending absorbs the greatest portion of APBD spending, ranging from 51-53 percent, and capital spending from 22-23 percent. H owever, this study found that the average spending by civil servants during 2009-2012 constituted 38 percent of the total regional spending, meaning that it was lower than the previous findings. The districts of Berau, Bulungan and Musi Banyuasin showed average civil servant spending of 32 percent, Musi Rawas and Sintang at 42 percent, and Kubu Raya at 50 percent of the total regional spending. D espite their seemingly higher civil servant spending when compared to other districts, Musi Rawas, Sintang and Kubu Raya actually decreased levels of public spending from 2009-2012. As for Berau and Bulungan districts, while it might seem that their civil servant expenditure was lower, it actually increased over the same period.
In the meantime, capital expenditure markedly increased by an average of 34 percent in a period of four years. The districts of Musi Banyuasin and Berau allocated the greatest amount to capital expenditure, at an average of 42 percent. T his allocation is higher than that spent on civil servants. In the dis-
tricts of Sintang (18 percent) and Kubu Raya (28 percent) the allocation was relatively small but still
0 0
mcreasmg.
The increasing allocation of capital expenditure is expected to drive regional economic growth and, particularly, improve public services and a supportive investment climate. This leads the central government, in this case the Minister of H ome Affairs, to issue a regulation requesting regional governments to allocate their capital expenditure starting
Box 3.2 Budget Politics during the APBD
Amendment Period
The budget amendment period is an important
moment for the executive and legislative branch
es to carry out political negotiations regarding
proposals to increase or reduce budget alloca
tions for each activity. In a previous study by
Seknas FITRA, the budget amendment period
\Vas found to be a moment for "budget poli
tics'', because this is the time for intense debate
between the executive and legislative as both
sides each have their o\vn agenda. Secondly, tlus
is the time \vhen political decisions are not very
transparent and are under \Veak public control.
45 Ministerial Regulation of Home Affairs No 37 of 2012 concerning the General Guidelines of 2013 APBD D rafting. 46 Based on the Ministerial Regulation of Home Affairs Number 32/2012, grant is defined as a monetary/goods aids from re
gional government to the central government, other regional governments, regional companies, society and civil organization whose allocation has been specifically set. Social assistance, on the other hand, may take the form of money/ goods to individuals, families, groups and/ or society. Both are of voluntary and non-binding nature and may not be performed continuously.
Uncovering Regional Wealth 129
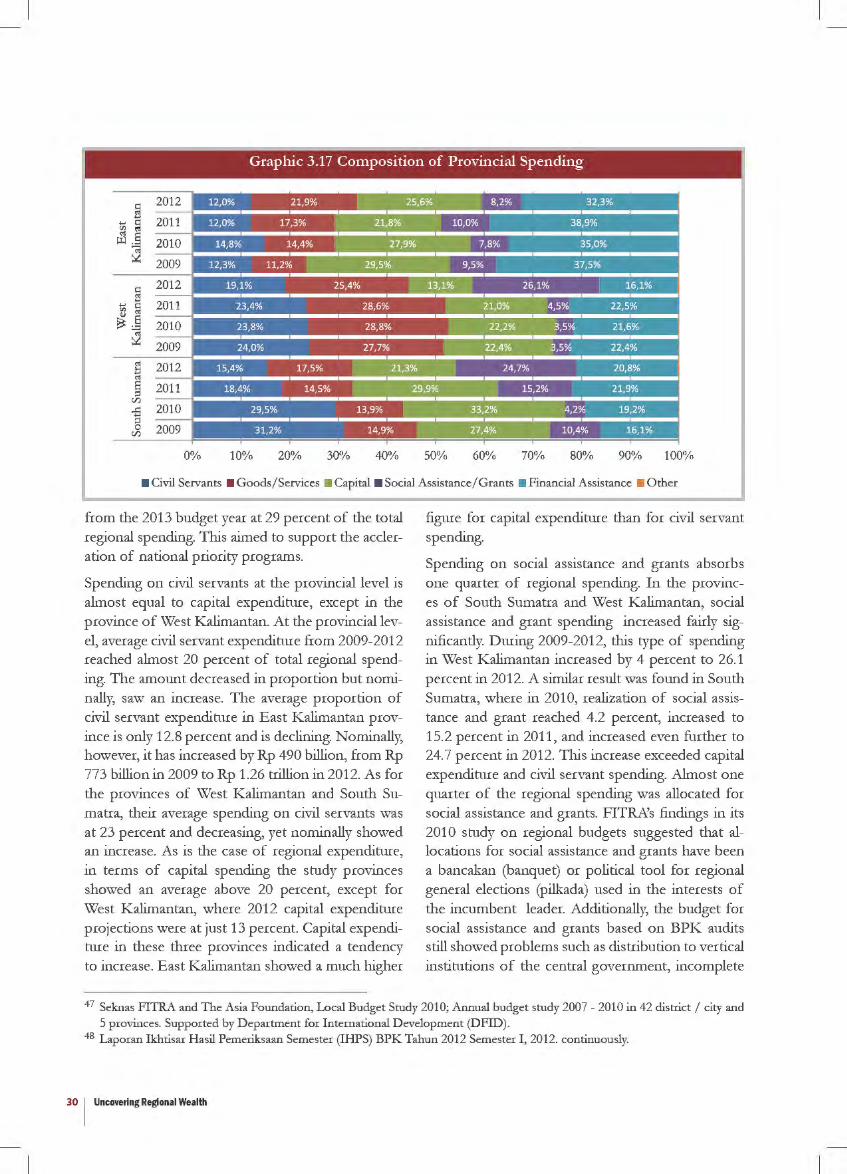
Graphic 3.17 Composition of Pro\'incial Spending
0% 10% 20% 30% 40% 50% 60% 70% 80% 90% 100%
• Civil Servants • Goods/Services • Capital • Social Assistance/Grants • Financial Assistance • Other
from the 2013 budget year at 29 percent of the total regional spending. This aimed to support the accleration of national priority programs.
Spending on civil servants at the provincial level is almost equal to capital expenditure, except in the province of West Kalimantan. At the provincial level, average civil servant expenditure from 2009-2012 reached almost 20 percent of total regional spending. The amount decreased in proportion but nominally, saw an increase. The average proportion of civil servant expenditure in East Kalimantan province is only 12.8 percent and is declining. Nominally, however, it has increased by Rp 490 billion, from Rp 773 billion in 2009 to Rp 1.26 trillion in 2012. As for the provinces of West Kalimantan and South Sumatra, their average spending on civil servants was at 23 percent and decreasing, yet nominally showed an increase. As is the case of regional expenditure, in terms of capital spending the study provinces showed an average above 20 percent, except for West Kalimantan, where 2012 capital expenditure projections were at just 13 percent. Capital expenditure in these three provinces indicated a tendency to increase. East Kalimantan showed a much higher
figure for capital expenditure than for civil servant spending.
Spending on social assistance and grants absorbs one quarter of regional spending. In the provinces of South Sumatra and West Kalimantan, social assistance and grant spending increased fairly significantly. During 2009-2012, this type of spending in West Kalimantan increased by 4 percent to 26.1 percent in 2012. A similar result was found in South Sumatra, where in 2010, realization of social assistance and grant reached 4.2 percent, increased to 15.2 percent in 2011, and increased even further to 24.7 percent in 2012. This increase exceeded capital expenditure and civil servant spending. Almost one quarter of the regional spending was allocated for social assistance and grants. FITRA's findings in its 2010 study on regional budgets suggested that allocations for social assistance and grants have been a bancakan (banquet) or political tool for regional general elections (pilkada) used in the interests of the incumbent leader. Additionally, the budget for social assistance and grants based on BPK audits still showed problems such as distribution to vertical institutions of the central government, incomplete
47 Seknas FITRA and The Asia Foundation, Local Budget Study 2010; Annual budget study 2007- 2010 in 42 district/ city and 5 provinces. Supported by Department for International Development (DFID).
48 Laporan Ikhtisar Hasil Pemeriksaan Semester (IHPS) BPK Tahun 2012 Semester I, 2012. continuously.
30 I Uncovering Regional Wealth
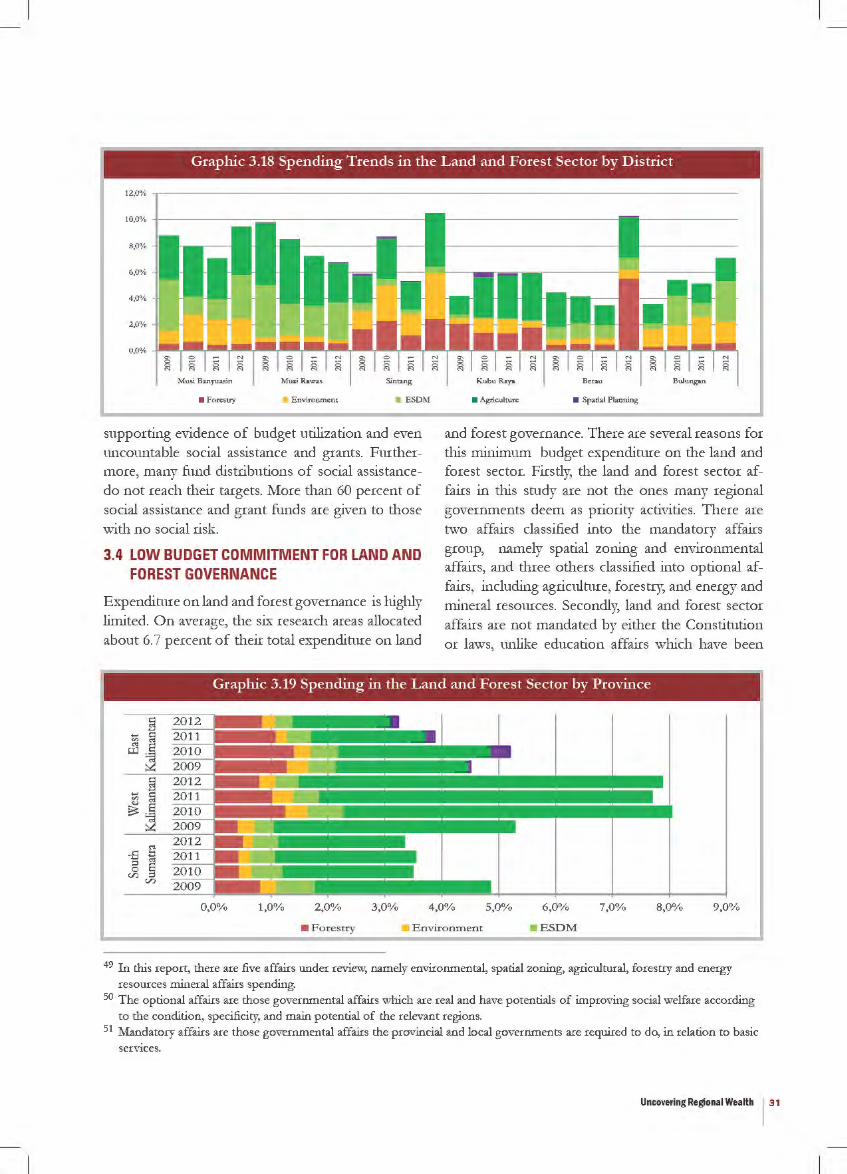
Graphic 3.18 Spending Trends in the Land and Forest Sector by District
• fo.r:esuy • Eovlronmeot • ESDM
supporting evidence of budget utilization and even uncountable social assistance and grants. Furthermore, many fund distributions of social assistancedo not reach their targets. More than 60 percent of social assistance and grant funds are given to those with no social risk.
3.4 LOW BUDGET COMMITMENT FOR LAND AND FOREST GOVERNANCE
Expenditure on land and forest governance is highly limited. On average, the six research areas allocated about 6.7 percent of their total expenditure on land
• Agriculture • Spacial Pl>oniog
and forest governance. There are several reasons for this minimum budget expenditure on the land and forest sector. Firstly, the land and forest sector affairs in this study are not the ones many regional governments deem as priority activities. There are two affairs classified into the mandatory affairs group, namely spatial zoning and environmental affairs, and three others classified into optional affairs, including agriculture, forestry, and energy and mineral resources. Secondly, land and forest sector affairs are not mandated by either the Constitution or laws, unlike education affairs which have been
Graphic 3.19 Spending in the Land and Forest Sector by Pro\'ince
• Forestry • Environme nt • ESDM
49 In this report, there are five affairs under review, namely environmental, spatial zoning, agricultural, forestry and energy resources mineral affairs spending.
50 The optional affairs are those governmental affairs which are real and have potentials of improving social welfare according to the condition, specificity, and main potential of the relevant regions.
51 Mandatory affairs are those governmental affairs the provincial and local governments are required to do, in relation to basic serVIces.
Uncovering Regional Wealth 131
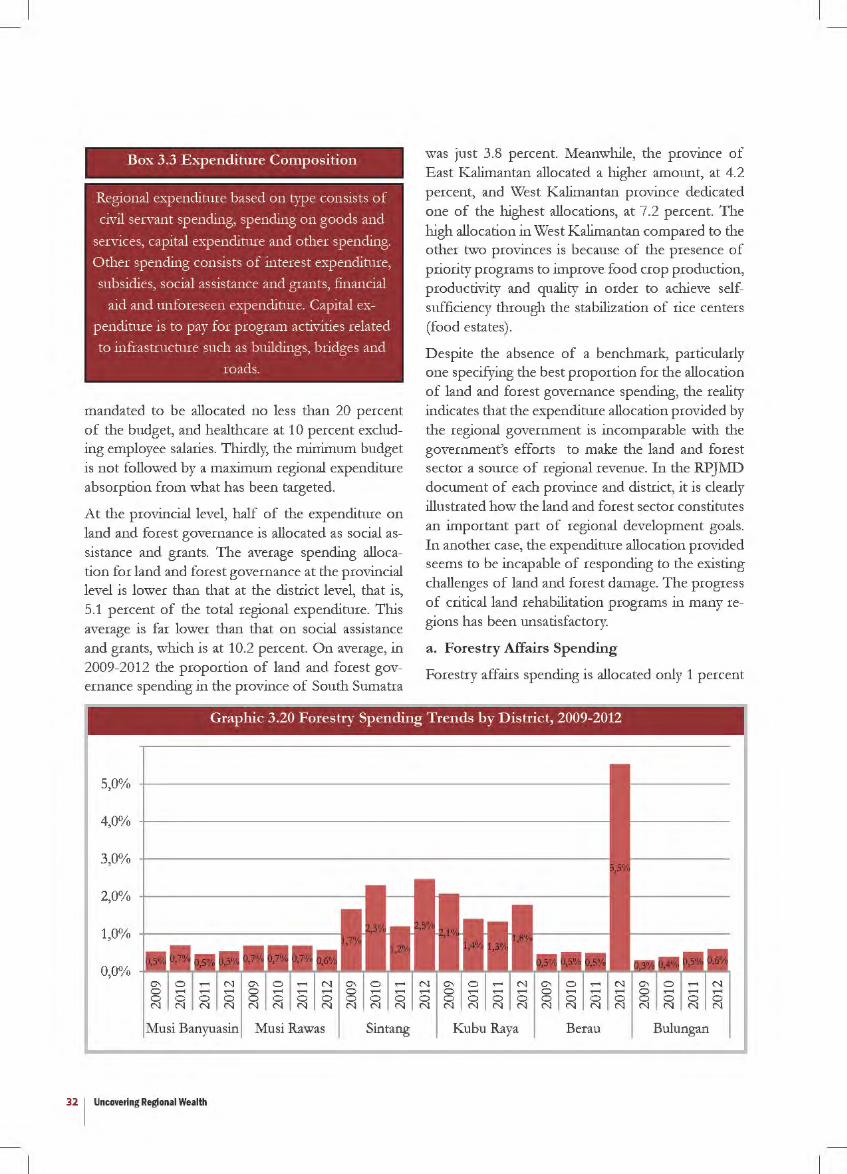
Box 3.3 Expenditure Composition
Regional expenditure based on type consists of
civil servant spending, spending on goods and
services, capital expenditure and other spending.
Other spending consists of interest expenditure,
subsidies, social assistance and grants, financial
aid and unforeseen expenditure. Capital ex
penditure is to pay for program activities related
to infrastructure such as buildings, bridges and
roads.
mandated to be allocated no less than 20 percent of the budget, and healthcare at 10 percent excluding employee salaries. Thirdly, the minimum budget is not followed by a maximum regional expenditure absorption from what has been targeted.
At the provincial level, half of the expenditure on land and forest governance is allocated as social assistance and grants. The average spending allocation for land and forest governance at the provincial level is lower than that at the district level, that is, 5.1 percent of the total regional expenditure. This average is far lower than that on social assistance and grants, which is at 10.2 percent. On average, in 2009-2012 the proportion of land and forest governance spending in the province of South Sumatra
was just 3.8 percent. Meanwhile, the province of East Kalimantan allocated a higher amount, at 4.2 percent, and West K alimantan province dedicated one of the highest allocations, at 7.2 percent. The high allocation in West K alimantan compared to the other two provinces is because of the presence of priority programs to improve food crop production, productivity and quality in order to achieve selfsufficiency through the stabilization of rice centers (food estates).
D espite the absence of a benchmark, particularly one specifying the best proportion for the allocation of land and forest governance spending, the reality indicates that the expenditure allocation provided by the regional government is incomparable with the government's efforts to make the land and forest sector a source of regional revenue. In the RPJMD document of each province and district, it is clearly illustrated how the land and forest sector constitutes an important part of regional development goals. In another case, the expenditure allocation provided seems to be incapable of responding to the existing challenges of land and forest damage. The progress of critical land rehabilitation programs in many regions has been unsatisfactory.
a . Forestry Affairs Spending
Forestry affairs spending is allocated only 1 percent
Graphic 3.20 Forestry Spending Trends by District, 2009-2012
5,0%
4,0%
3,0%
2,0%
1,0%
0,0%
Sin tang Kubu Raya Berau Bulungan
32 I Uncovering Regional Wealth
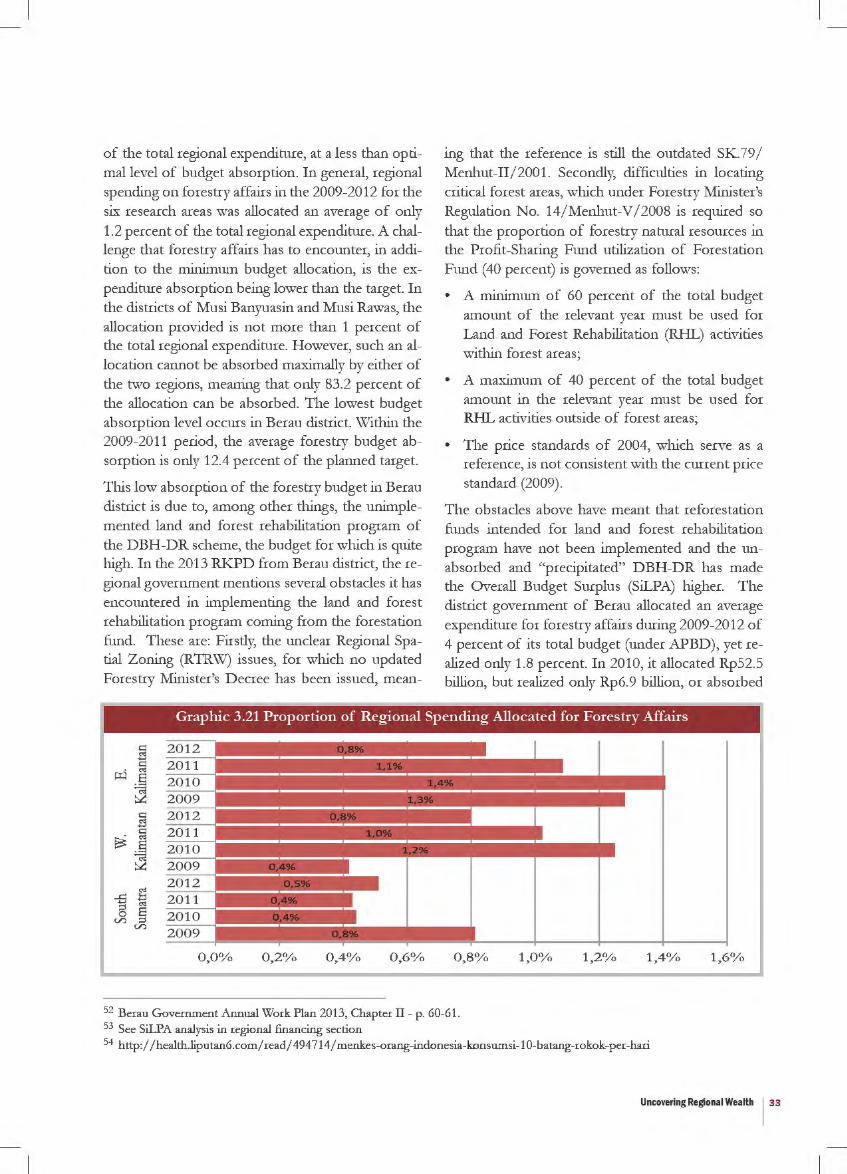
of the total regional expenditure, at a less than optimal level of budget absorption. In general, regional spending on forestry affairs in the 2009-2012 for the six research areas was allocated an average of only 1.2 percent of the total regional expenditure. A challenge that forestry affairs has to encounter, in addition to the minimum budget allocation, is the expenditure absorption being lower than the target. In the districts of Musi Banyuasin and Musi Rawas, the allocation provided is not more than 1 percent of the total regional expenditure. However, such an allocation cannot be absorbed maximally by either of the two regions, meaning that only 83.2 percent of the allocation can be absorbed. The lowest budget absorption level occurs in Berau district. Within the 2009-2011 period, the average forestry budget absorption is only 12.4 percent of the planned target.
This low absorption of the forestry budget in Berau district is due to, among other things, the unimplemented land and forest rehabilitation program of the DBH-DR scheme, the budget for which is quite high. In the 2013 RKPD from Berau district, theregional government mentions several obstacles it has encountered in implementing the land and forest rehabilitation program coming from the forestation fund. These are: Firstly, the unclear Regional Spatial Zoning (RTRW) issues, for which no updated Forestry Minister's D ecree has been issued, mean-
ing that the reference is still the outdated SK.79 / Menhut-II/ 2001. Secondly, difficulties in locating critical forest areas, which under Forestry Minister's Regulation No. 14/ Menhut-V / 2008 is required so that the proportion of forestry natural resources in the Profit-Sharing Fund utilization of Forestation Fund (40 percent) is governed as follows:
• A minimum of 60 percent of the total budget amount of the relevant year must be used for Land and Forest Rehabilitation (RHL) activities within forest areas;
• A maximum of 40 percent of the total budget amount in the relevant year must be used for RHL activities outside of forest areas;
• The price standards of 2004, which serve as a reference, is not consistent with the current price standard (2009).
The obstacles above have meant that reforestation funds intended for land and forest rehabilitation program have not been implemented and the unabsorbed and "precipitated" DBH-DR has made the Overall Budget Surplus (SiLPA) higher. The district government of Berau allocated an average expenditure for forestry affairs during 2009-2012 of 4 percent of its total budget (under APBD), yet realized only 1.8 percent. In 2010, it allocated Rp52.5 billion, but realized only Rp6.9 billion, or absorbed
Graphic 3.21 Proportion of Regional Spending Allocated for Forestry Affairs
0,2%
52 Beran Government Annual Work Plan 2013, Chapter II - p. 60-61. 53 See SiLPA analysis in regional financing section
1,4o/o
54 http:/ /health.liputan6.com/ read/ 494714/ menkes-orang-indonesia-konsumsi-1 0-batang-rokok-per-hari
Uncovering Regional Wealth 133
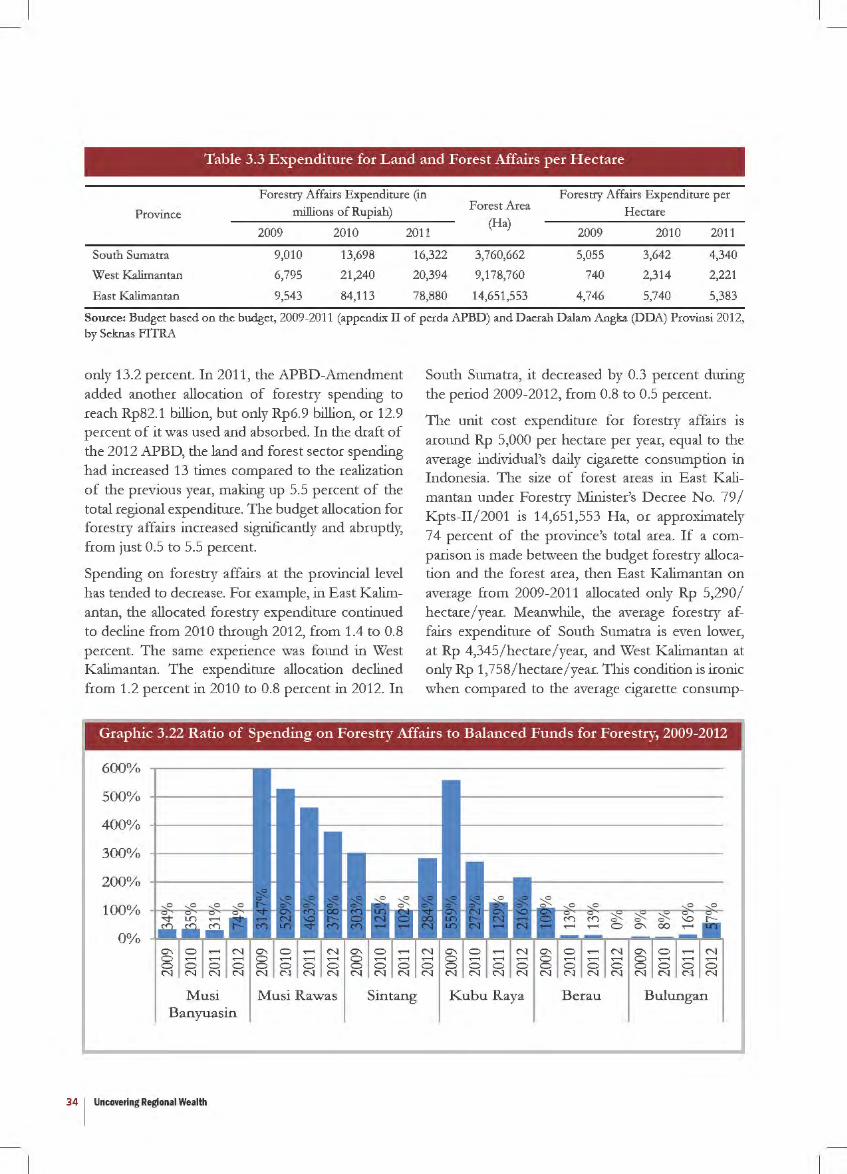
Table 3.3 Expenditure for Land and Forest Affairs per Hectare
Forestry Mfairs Expenditure (in Forest Area
Forestry Affairs Expenditure per
Province millions of Rupiah) Hectare
2009 2010 2011 (Ha)
2009 2010 2011
South Sumatra 9,010 13,698 16,322 3,760,662 5,055 3,642 4,340
West Kalimantan 6,795 21,240 20,394 9,178,760 740 2,314 2,221
East Kalimantan 9,543 84,113 78,880 14,651,553 4,746 5,740 5,383
Source: Budget based on the budget, 2009-2011 (appendix II of perda APBD) and Daerah Dalam Angka (DDA) Provinsi 2012, by Seknas FITRA
only 13.2 percent. In 2011, the APED-Amendment added another allocation of forestry spending to reach Rp82.1 billion, but only Rp6. 9 billion, or 12.9 percent of it was used and absorbed. In the draft of the 2012 APBD, the land and forest sector spending had increased 13 times compared to the realization of the previous year, making up 5.5 percent of the total regional expenditure. The budget allocation for forestry affairs increased significantly and abruptly, from just 0.5 to 5.5 percent.
Spending on forestry affairs at the provincial level has tended to decrease. For example, in East Kalimantan, the allocated forestry expenditure continued to decline from 2010 through 2012, from 1.4 to 0.8 percent. The same experience was found in West Kalimantan. The expenditure allocation declined from 1.2 percent in 2010 to 0.8 percent in 2012. In
South Sumatra, it decreased by 0.3 percent during the period 2009-2012, from 0.8 to 0.5 percent.
The unit cost expenditure for forestry affairs is around Rp 5,000 per hectare per year, equal to the average individual's daily cigarette consumption in Indonesia. The size of forest areas in East Kalimantan under Forestry Minister's Decree No. 79/ Kpts-II/2001 is 14,651,553 Ha, or approximately 7 4 percent of the province's total area. If a comparison is made between the budget forestry allocation and the forest area, then East Kalimantan on average from 2009-2011 allocated only Rp 5,290/ hectare/year. Meanwhile, the average forestry affairs expenditure of South Sumatra is even lower, at Rp 4,345/hectare/year, and West Kalimantan at only Rp 1,758/hectare/year. This condition is ironic when compared to the average cigarette consump-
Graphic 3.22 Ratio of Spending on Forestry Affairs to Balanced Funds for Forestry, 2009-2012
600%
500%
400%
300%
200%
100%
0%
Musi Banyuasin
34 1 Uncovering Regional Wealth
Musi Rawas Sin tang KubuRaya Berau Bulungan
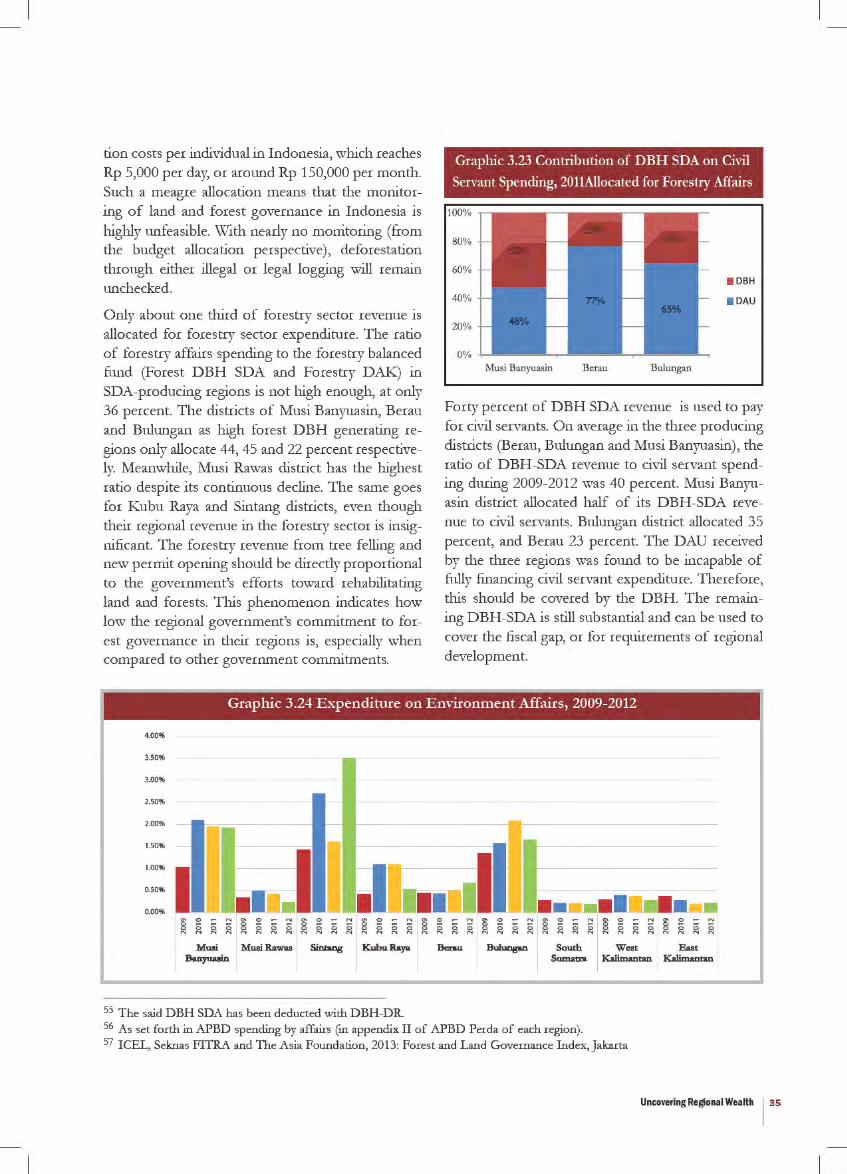
tion costs per individual in Indonesia, which reaches Rp 5,000 per day, or around Rp 150,000 per month. Such a meagre allocation means that the monitoring of land and forest governance in Indonesia is highly unfeasible. With nearly no monitoring (from the budget allocation perspective), deforestation through either illegal or legal logging will remain unchecked.
Only about one third of forestry sector revenue is allocated for forestry sector expenditure. The ratio of forestry affairs spending to the forestry balanced fund (Forest DBH SDA and Forestry DAK) in SDA-producing regions is not high enough, at only 36 percent. The districts of Musi Banyuasin, Berau and Bulungan as high forest DBH generating regions only allocate 44, 45 and 22 percent respectively. Meanwhile, Musi Rawas district has the highest ratio despite its continuous decline. The same goes for Kubu Raya and Sintang districts, even though their regional revenue in the forestry sector is insignificant. The forestry revenue from tree felling and new permit opening should be directly proportional to the government's efforts toward rehabilitating land and forests. This phenomenon indicates how low the regional government's commitment to forest governance in their regions is, especially when compared to other government commitments.
Graphic 3.23 Contribution of DBH SDA on Civil
Servant Spending, 2011Allocated for Forestry Affairs
100%
80%
60%
40%
20%
0%
I I I I I II I I I I I II I I I Musi Banyuasin Berau Bulungan
Forty percent of DBH SDA revenue is used to pay for civil servants. On average in the three producing districts (Berau, Bulungan and Musi Banyuasin), the ratio of DBH-SDA revenue to civil servant spending during 2009-2012 was 40 percent. Musi Banyuasin district allocated half of its DBH-SDA revenue to civil servants. Bulungan district allocated 35 percent, and Berau 23 percent. The DAU received by the three regions was found to be incapable of fully financing civil servant expenditure. Therefore, this should be covered by the DBH. The remaining DBH-SDA is still substantial and can be used to cover the fiscal gap, or for requirements of regional development.
Graphic 3.24 Expenditure on Environment Affairs, 2009-2012
4.00%
3.50%
3.00%
2.50%
2.00%
1.50%
1.00%
0.50%
0.00%
Muai Muai Rawu Sinwlg Kubu RAY'" Berau Bulungan South West Eaat Banyuasin Sumatra KalimantlUl Kalimantan
55 The said DBH SDA has been deducted with DBH-DR 56 As set forth in APBD spending by affairs (ln appendix II of APBD Perda of each region). 57 ICEL, Seknas FITRA and The Asia Foundation, 2013: Forest and Land Governance Index, Jakarta
Uncovering Regional Wealth 135
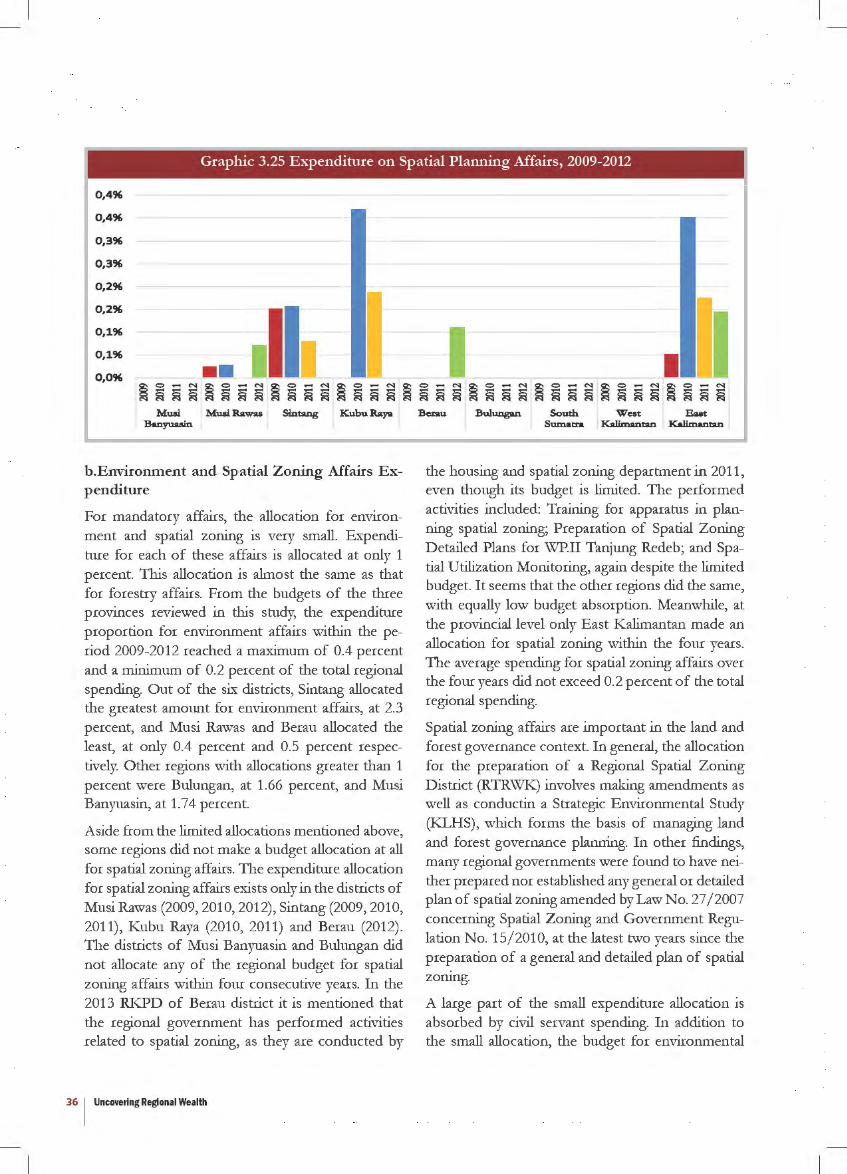
Graphic 3.25 Expenditure on Spatial Planning Affairs, 2009-2012
0,4%
0,4%
0,3%
0,3%
0,2%
0,2%
0,1%
0,1%
0,0%
Musi Musi Rawas Sintang Knbu Raya Banyuaain
b.Environment and Spatial Zoning Affairs Expenditure
For mandatory affairs, the allocation for environment and spatial zoning is very small. Expenditure for each of these affairs is allocated at only 1 percent. This allocation is almost the same as that for forestry affairs. From the budgets of the three provinces reviewed in this study, the expenditure proportion for environment affairs within the period 2009-2012 reached a maximum of 0.4 percent and a minimum of 0.2 percent of the total regional spending. Out of the SL'{ districts, Sintang allocated the greatest amount for environment affairs, at 2.3 percent, and Musi Rawas and Berau allocated the least, at only 0.4 percent and 0.5 percent respectively. Other regions with allocations greater than 1 percent were Bulungan, at 1.66 percent, and Musi Banyuasin, at 1.74 percent.
Aside from the limited allocations mentioned above, some regions did not make a budget allocation at all for spatial zoning affairs. The expenditure allocation for spatial zoning affairs exists only in the districts of Musi Rawas (2009, 2010, 2012), Sintang (2009, 2010, 2011), Kubu Raya (2010, 2011) and Berau (2012). The districts of Musi Banyuasin and Bulungan did not allocate any of the regional budget for spatial zoning affairs within four consecutive years. In the 2013 RKPD of Berau district it is mentioned that the regional government has performed activities related to spatial zoning, as they are conducted by
36 1 Uncovering Regional Wealth
Berau Bulungan South West East Sumatra Kaliml&ntan Kalimantan
the housing and spatial zoning department in 2011, even though its budget is limited. The performed activities included: Training for apparatus in planning spatial zoning; Preparation of Spatial Zoning Detailed Plans for WP.II Tanjung Redeb; and Spatial Utilization Monitoring, again despite the limited budget. It seems that the other regions did the same, with equally low budget absorption. Meanwhile, at the provincial level only East Kalimantan made an allocation for spatial zoning within the four years. The average spending for spatial zoning affairs over the four years did not exceed 0.2 percent of the total regional spending.
Spatial zoning affairs are important in the land and forest governance context. In general, the allocation for the preparation of a Regional Spatial Zoning District (RTRWK) involves making amendments as well as conductin a Strategic Environmental Study (KLHS), which forms the basis of managing land and forest governance planning. In other findings, many regional governments were found to have neither prepared nor established any general or detailed plan of spatial zoning amended by Law No. 27/ 2007 concerning Spatial Zoning and Government Regulation No. 15/ 2010, at the latest two years since the preparation of a general and detailed plan of spatial zonmg.
A large part of the small expenditure allocation is absorbed by civil servant spending. In addition to the small allocation, the budget for environmental
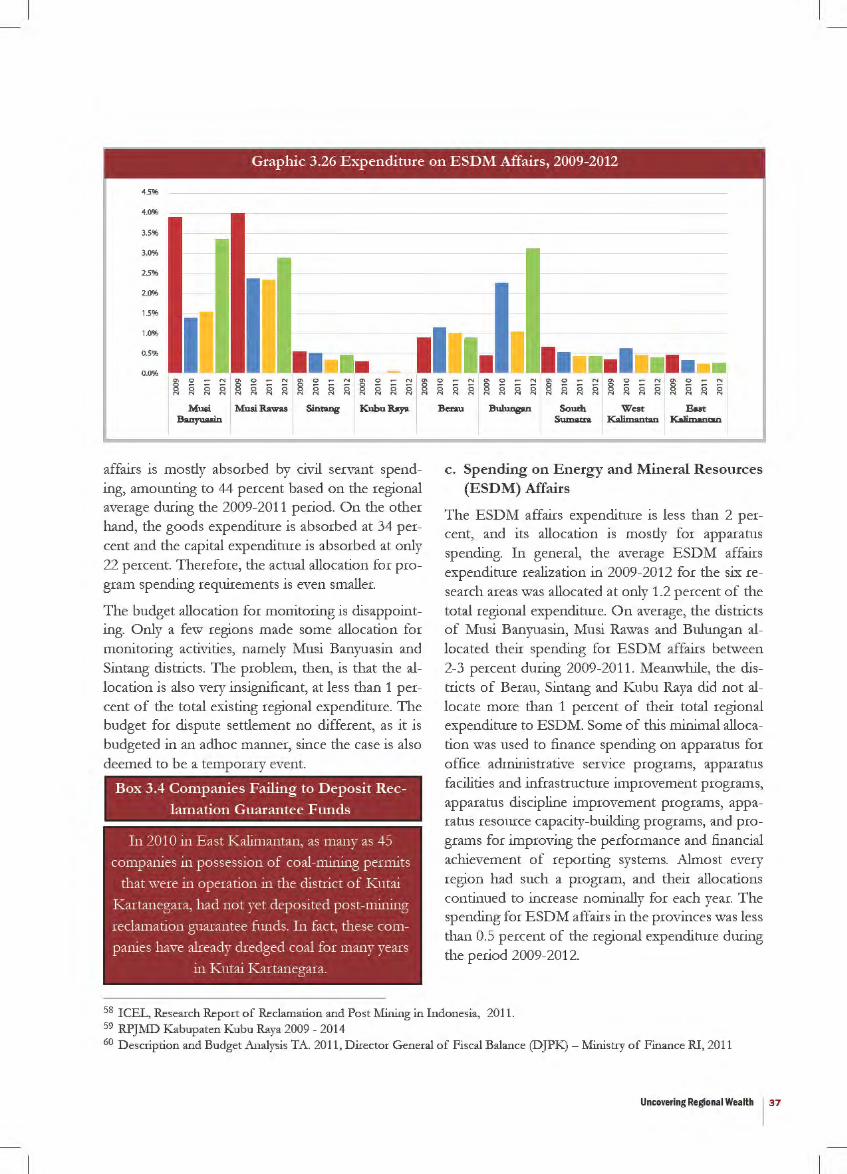
Graphic 3.26 Expenditure on ESDM Affairs, 2009-2012
45%
4.0%
35%
25%
2.0%
15%
1.0%
05%
0.0%
Muai Muai Rswa.s Sintang Kubu Raya &nyuaain
affairs is mostly absorbed by civil servant spending, amounting to 44 percent based on the regional average during the 2009-2011 period. On the other hand, the goods expenditure is absorbed at 34 percent and the capital expenditure is absorbed at only 22 percent. Therefore, the actual allocation for program spending requirements is even smaller.
The budget allocation for monitoring is disappointing. Only a few regions made some allocation for monitoring activities, namely Musi Banyuasin and Sintang districts. The problem, then, is that the allocation is also very insignificant, at less than 1 percent of the total existing regional expenditure. The budget for dispute settlement no different, as it is budgeted in an adhoc manner, since the case is also deemed to be a temporary event.
Box 3.4 Companies Failing to Deposit Rec
lamation Guarantee Funds
In 2010 in East Kalimantan, as many as 45
companies in possession of coal-mining permits
that were in operation in the district of Kutai
Kartanegara, had not yet deposited post-mining
reclamation guarantee funds. In fact, these com
parties have already dredged coal for many years
in Kutai Kartanegara.
1- •• Bcmu Bulungan South West But
Sumatra Kalimantan Kalimantan
c. Spending on Energy and Mineral Resources (ESDM) Affairs
The ESDM affairs expenditure is less than 2 percent, and its allocation is mostly for apparatus spending. In general, the average ESDM affairs expenditure realization in 2009-2012 for the six research areas was allocated at only 1.2 percent of the total regional expenditure. On average, the districts of Musi Banyuasin, Musi Rawas and Bulungan allocated their spending for ESDM affairs between 2-3 percent during 2009-2011. Meanwhile, the districts of Berau, Sintang and Kubu Raya did not allocate more than 1 percent of their total regional expenditure to ESDM. Some of this minimal allocation was used to finance spending on apparatus for office administrative service programs, apparatus facilities and infrastructure improvement programs, apparatus discipline improvement programs, apparatus resource capacity-building programs, and programs for improving the performance and financial achievement of reporting systems. Almost every region had such a program, and their allocations continued to increase nominally for each year. The spending for ESDM affairs in the provinces was less than 0.5 percent of the regional expenditure during the period 2009-2012.
58 ICEL, Research Report of Reclamation and Post Mining in Indonesia, 2011. 59 RPJMD Kabupaten Kubu Raya 2009 - 2014 60 Description and Budget Analysis TA. 2011, Director General of Fiscal Balance (DJPK) - Ministry of Finance RI, 2011
Uncovering Regional Wealth 137
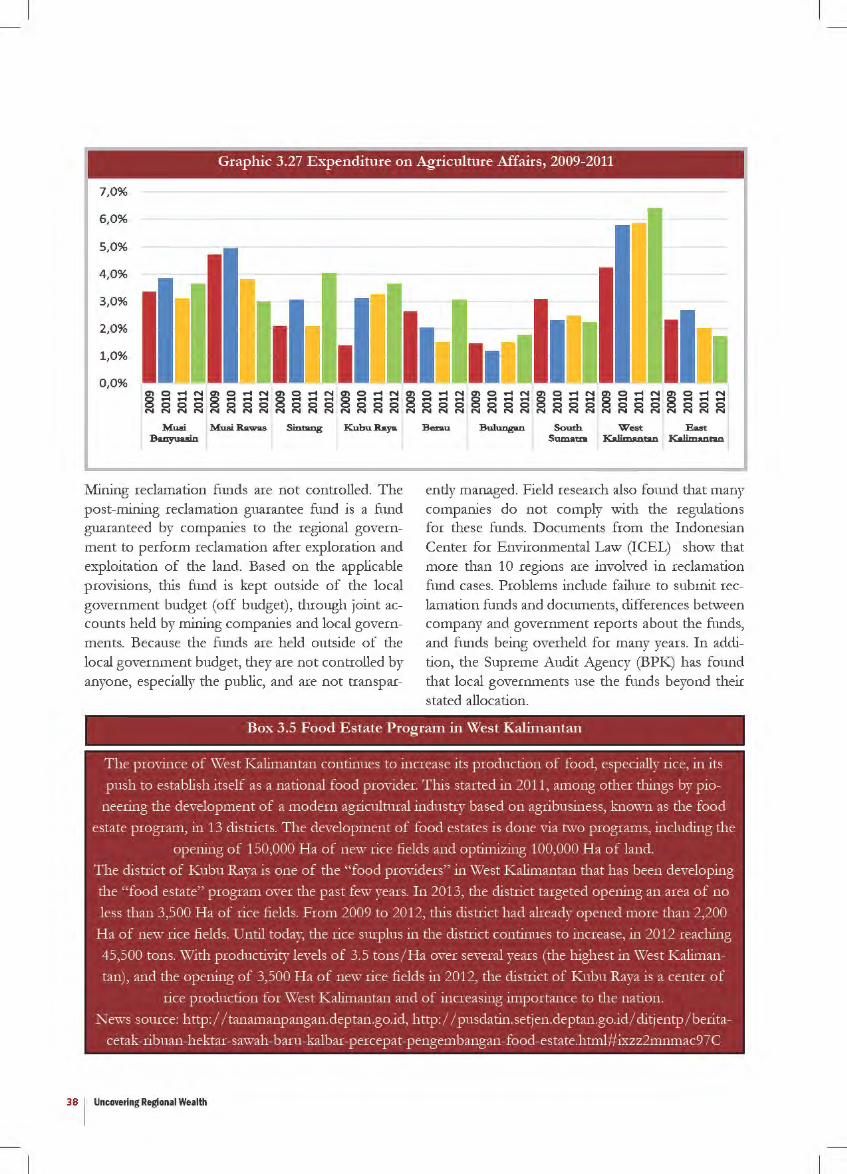
Graphic 3.27 Expenditure on Agriculture Affairs, 2009-2011
7,0%
6,0%
5,0%
4,0%
3,0%
2,0%
1,0%
0,0%
Musi Musi Rawas Sintang Kubu Raya :&nyuaain
Mining reclamation funds are not controlled. The post-mining reclamation guarantee fund is a fund guaranteed by companies to the regional government to perform reclamation after exploration and exploitation of the land. Based on the applicable provisions, this fund is kept outside of the local government budget (off budget), through joint accounts held by mining companies and local governments. Because the funds are held outside of the local government budget, they are not controlled by anyone, especially the public, and are not transpar-
II I Bcmu Bulungan South West Bast
Sumatra Kalimantan Kalimantan
ently managed. Field research also found that many companies do not comply with the regulations for these funds. Documents from the Indonesian Center for Environmental Law (ICEL) show that more than 10 regions are involved in reclamation fund cases. Problems include failure to submit reclamation funds and documents, differences between company and government reports about the funds, and funds being overheld for many years. In addition, the Supreme Audit Agency (BPK) has found that local governments use the funds beyond their stated allocation.
Box 3.5 Food Estate P rogram in West Kalimantan
The province of \\'est Kalimantan continues to increase its production of food, especially rice, in its
push to establish itself as a national food provider. This started in 2011, among other things by pio
neering the development of a modern agricultural industry based on agribusiness, known as the food
estate program, in 13 districts. The development of food estates is done via two programs, including the
opening of 150,000 Ha of new rice fields and optimizing 100,000 Ha of land.
The district of Kubu Raya is one of the "food providers" in \\'est Kalimantan that has been developing
the "food estate" program over the past fe\v years. In 2013, the district targeted opening an area of no
less than 3,500 Ha of rice fields. From 2009 to 20 12, this district had already opened more than 2,200
Ha of new rice fields. Cntil today, the rice surplus in the district continues to increase, in 2012 reaching
45,500 tons. \\'ith productivity levels of 3.5 tonsi Ha over several years (the highest in West Kaliman
tan), and the opening of 3,500 Ha of new rice fields in 2012, the district of Kubu Raya is a center of
rice production for \\'est Kalimantan and of increasing importance to the nation.
N e\vs source: http: I I tanamanpangan.deptan.go.id, http: I I pusdatin.setjen.deptan.go.idl ditjentp l berita
cetak-ribllan-hektar-sawah-baru-kalbar-percepat-pengembangan-food-estate.html#ixzz2mnmac97C
38 1 Uncovering Regional Wealth
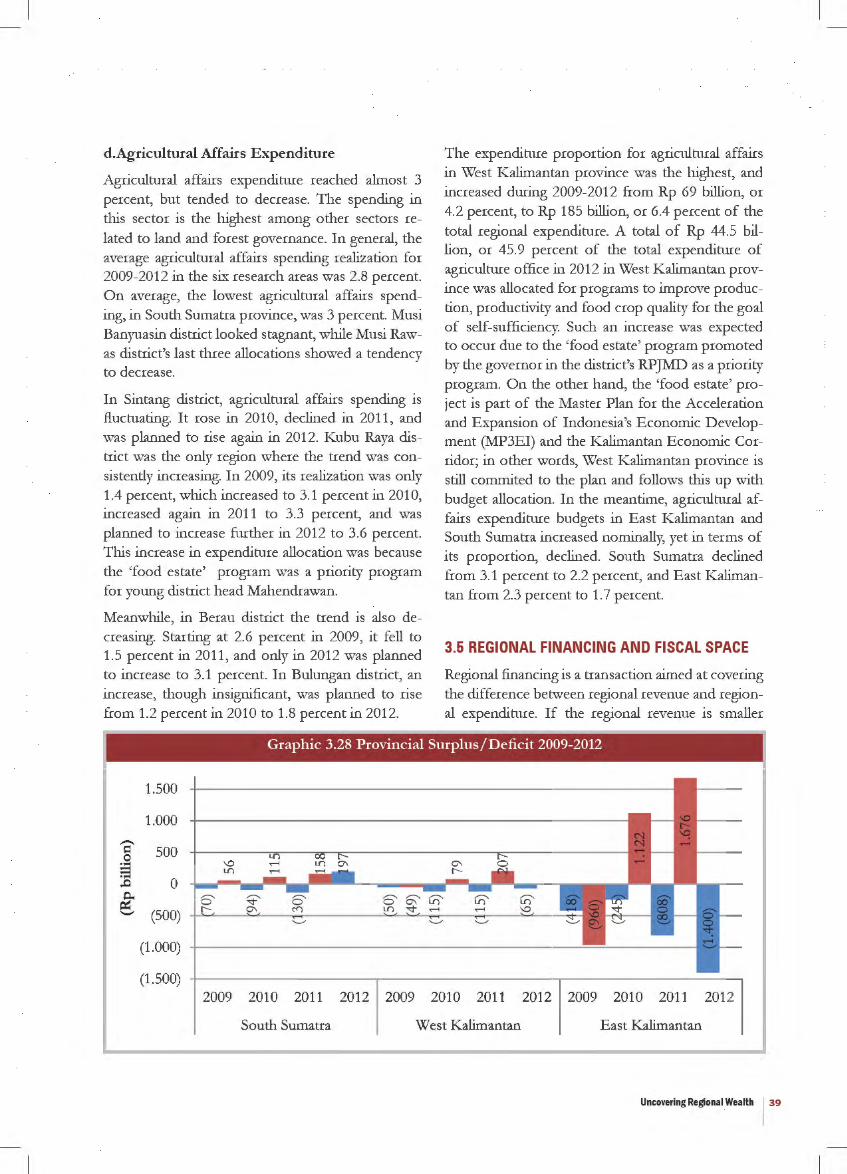
d.Agricultural Affairs Expenditure
Agricultural affairs expenditure reached almost 3 percent, but tended to decrease. The spending in this sector is the highest among other sectors related to land and forest governance. In general, the average agricultural affairs spending realization for 2009-2012 in the six research areas was 2.8 percent. On average, the lowest agricultural affairs spending, in South Sumatra province, was 3 percent. Musi Banyuasin district looked stagnant, while Musi Rawas district's last three allocations showed a tendency to decrease.
In Sintang district, agricultural affairs spending is fluctuating. It rose in 2010, declined in 2011, and was planned to rise again in 2012. Kubu Raya district was the only region where the trend was consistently increasing. In 2009, its realization was only 1.4 percent, which increased to 3.1 percent in 2010, increased again in 2011 to 3.3 percent, and was planned to increase further in 2012 to 3.6 percent. This increase in expenditure allocation was because the 'food estate' program was a priority program for young district head Mahendrawan.
Meanwhile, in Berau district the trend is also decreasing. Starting at 2.6 percent in 2009, it fell to 1.5 percent in 2011, and only in 2012 was planned to increase to 3.1 percent. In Bulungan district, an increase, though insignificant, was planned to rise from 1.2 percent in 2010 to 1.8 percent in 2012.
The expenditure proportion for agricultural affairs in West Kalimantan province was the highest, and increased during 2009-2012 from Rp 69 billion, or 4.2 percent, to Rp 185 billion, or 6.4 percent of the total regional expenditure. A total of Rp 44.5 billion, or 45.9 percent of the total expenditure of agriculture office in 2012 in West Kalimantan province was allocated for programs to improve production, productivity and food crop quality for the goal of self-sufficiency. Such an increase was expected to occur due to the 'food estate' program promoted by the governor in the district's RPJMD as a priority program. On the other hand, the 'food estate' project is part of the Master Plan for the Acceleration and Expansion of Indonesia's Economic Development (MP3EI) and the Kalimantan Economic Corridor; in other words, West Kalimantan province is still commited to the plan and follows this up with budget allocation. In the meantime, agricultural affairs expenditure budgets in East Kalimantan and South Sumatra increased nominally, yet in terms of its proportion, declined. South Sumatra declined from 3.1 percent to 2.2 percent, and East Kalimantan from 2.3 percent to 1.7 percent.
3.5 REGIONAL FINANCING AND FISCAL SPACE
Regional financing is a transaction aimed at covering the difference between regional revenue and regional expenditure. If the regional revenue is smaller
Graphic 3.28 Provincial Surplus/Deficit 2009-2012
1.500
1.000 -~ 500 0 s 0 ..0
~ .._, (500)
(1.000)
(1.500) 2009 2010 2011 2012 2009 2010 2011 2012 2009 2010 2011 2012
South Sumatra West Kalimantan East Kalimantan
Uncovering Regional Wealth 139
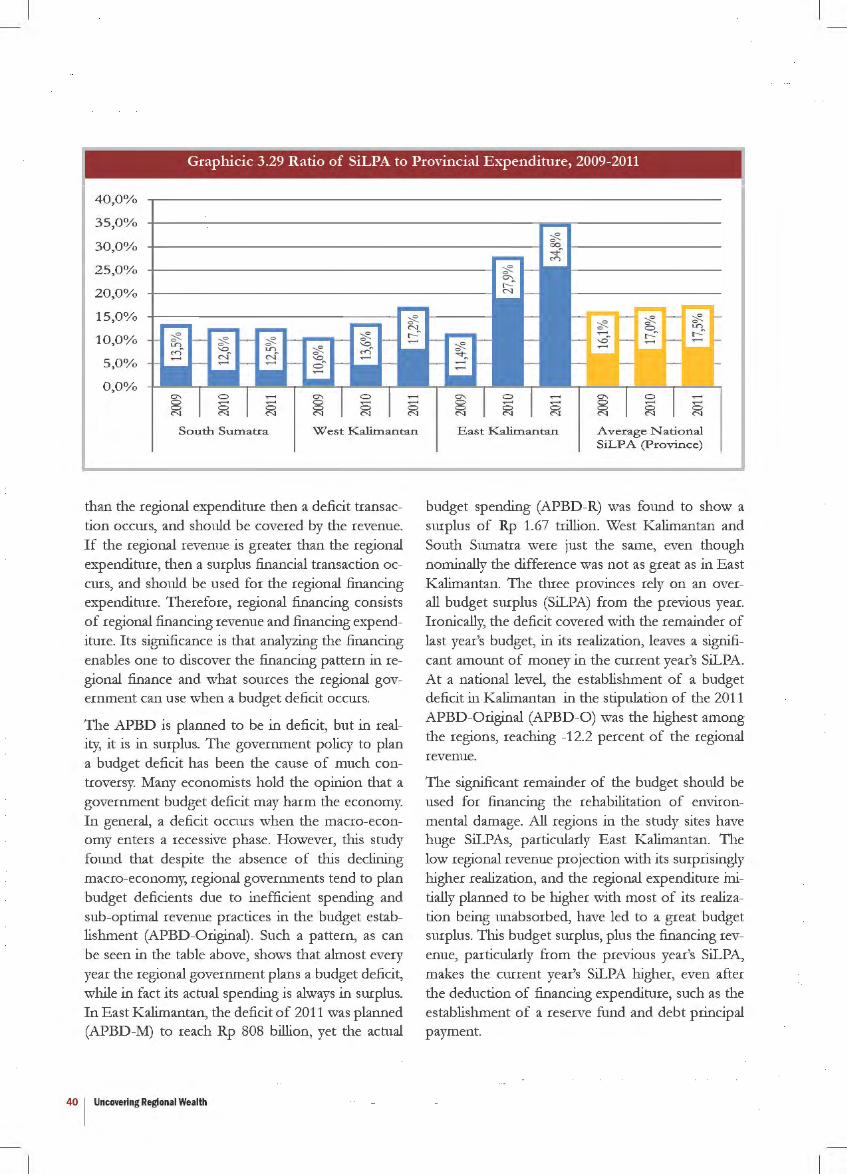
Graphicic 3.29 Ratio of SiLPA to Pro\'incial Expenditure, 2009-2011
40,0%
35,0°/o
30,0%
25,0°/o
20,0°/o
15,0°/o
10,0°/o
5,0°/o
South Sumatra West Kalimantan
than the regional expenditure then a deficit transaction occurs, and should be covered by the revenue. If the regional revenue is greater than the regional expenditure, then a surplus financial transaction occurs, and should be used for the regional financing expenditure. Therefore, regional financing consists of regional financing revenue and financing expenditure. Its significance is that analyzing the financing enables one to discover the financing pattern in regional finance and what sources the regional government can use when a budget deficit occurs.
The APED is planned to be in deficit, but in reality, it is in surplus. T he government policy to plan a budget deficit has been the cause of much controversy. Many economists hold the opinion that a government budget deficit may harm the economy. In general, a deficit occurs when the macro-economy enters a recessive phase. However, this study found that despite the absence of this declining macro-economy, regional governments tend to plan budget deficients due to inefficient spending and sub-optimal revenue practices in the budget establishment (APED -Original). Such a pattern, as can be seen in the table above, shows that almost every year the regional government plans a budget deficit, while in fact its actual spending is always in surplus. In East Kalimantan, the deficit of 2011 was planned (APED-l\.1) to reach Rp 808 billion, yet the actual
40 I Uncovering Regional Wealth
East Kalimantan Average National SiLP A (Province)
budget spending (APED-R) was found to show a surplus of Rp 1.67 trillion. West Kalimantan and South Sumatra were just the same, even though nominally the difference was not as great as in East Kalimantan. The three provinces rely on an overall budget surplus (SiLPA) from the previous year. Ironically, the deficit covered with the remainder of last year's budget, in its realization, leaves a significant amount of money in the current year's SiLPA. At a national level, the establishment of a budget deficit in Kalimantan in the stipulation of the 2011 APED-Original (APED -0) was the highest among the regions, reaching -12.2 percent of the regional revenue.
The significant remainder of the budget should be used for financing the rehabilitation of environmental damage. All regions in the study sites have huge SiLPAs, particularly East Kalimantan. The low regional revenue projection with its surprisingly higher realization, and the regional expenditure initially planned to be higher with most of its realization being unabsorbed, have led to a great budget surplus. T his budget surplus, plus the financing revenue, particularly from the previous year's SiLPA, makes the current years SiLPA higher, even after the deduction of financing expenditure, such as the establishment of a reserve fund and debt principal payment.
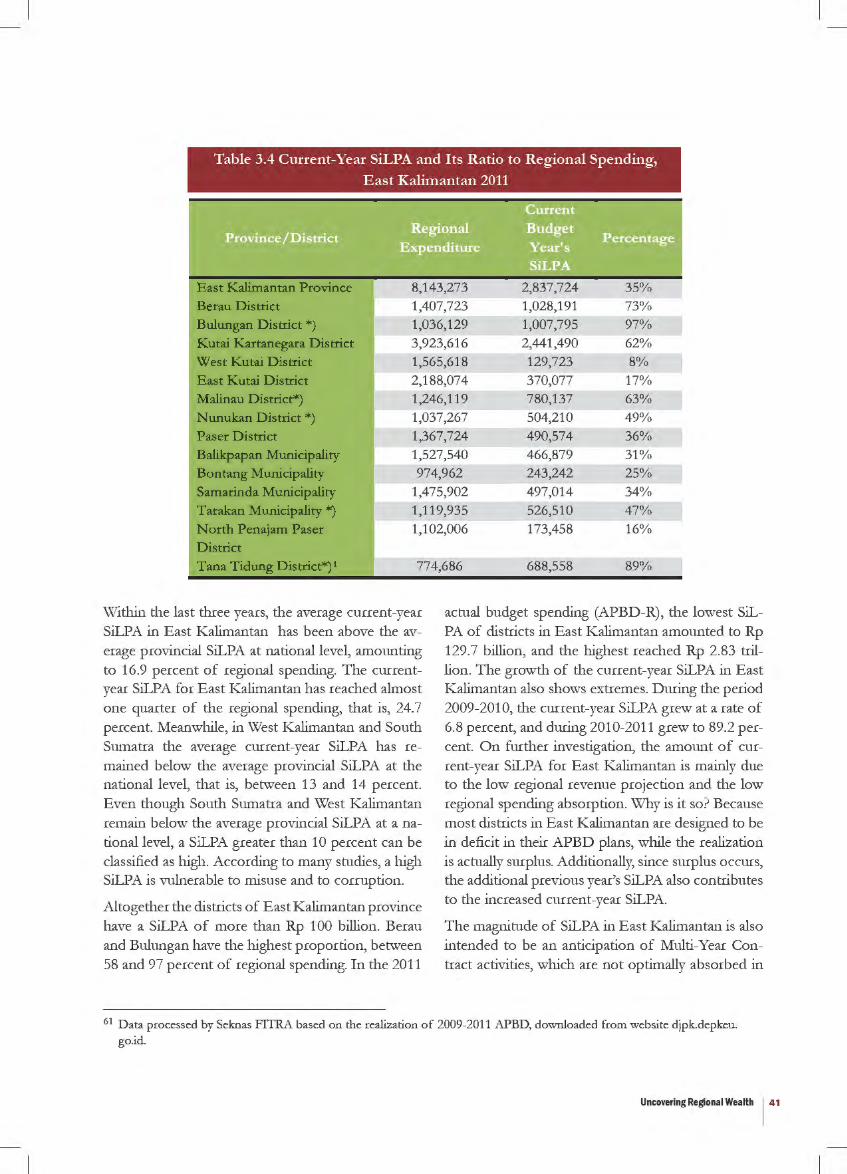
Table 3.4 Current-Year SiLPA and Its Ratio to Regional Spending,
East Kalimantan 2011
East Kalimantan Province 8,143,273 2,837,724 35% Berau District 1,407,723 1,028,191 73% Bulungan District *) 1,036,129 1,007,795 97% Kutai Kartanegara District 3,923,616 2,441,490 62% West Kutai District 1,565,618 129,723 8% East Kutai District 2,188,074 370,077 17% Malinau District*) 1,246,119 780,137 63% Nunukan District*) 1,037,267 504,210 49% Paser District 1,367,724 490,574 36% Balikpapan Municipality 1,527,540 466,879 31% Bon tang Municipality 974,962 243,242 25% Samarinda Municipality 1,475,902 497,014 34% Tarakan Municipality*) 1,119,935 526,510 47% North Penajam Paser 1,102,006 173,458 16% District Tana Tidung District*) t 774,686 688,558 89%
Within the last three years, the average current-year SiLPA in East Kalimantan has been above the average provincial SiLPA at national level, amounting to 16.9 percent of regional spending. The currentyear SiLPA for East Kalimantan has reached almost one quarter of the regional spending, that is, 24.7 percent. Meanwhile, in West Kalimantan and South Sumatra the average current-year SiLPA has remained below the average provincial SiLPA at the national level, that is, between 13 and 14 percent. Even though South Sumatra and West Kalimantan remain below the average provincial SiLPA at anational level, a SiLPA greater than 10 percent can be classified as high. According to many studies, a high SiLPA is vulnerable to misuse and to corruption.
Altogether the districts of East Kalimantan province have a SiLPA of more than Rp 100 billion. Berau and Bulungan have the highest proportion, between 58 and 97 percent of regional spending. In the 2011
actual budget spending (APBD-R), the lowest SiLPA of districts in East Kalimantan amounted to Rp 129.7 billion, and the highest reached Rp 2.83 trillion. The growth of the current-year SiLPA in East Kalimantan also shows extremes. D uring the period 2009-2010, the current-year SiLPA grew at a rate of 6.8 percent, and during 2010-2011 grew to 89.2 percent. On further investigation, the amount of current-year SiLPA for East Kalimantan is mainly due to the low regional revenue projection and the low regional spending absotption. Why is it so? Because most districts in East Kalimantan are designed to be in deficit in their APBD plans, while the realization is actually surplus. Additionally, since smplus occurs, the additional previous year's SiLPA also contributes to the increased current-year SiLPA.
The magnitude of SiLPA in East Kalimantan is also intended to be an anticipation of Multi-Year Contract activities, which are not optimally absorbed in
61 Data processed by Seknas FITRA based on the realization of 2009-2011 APBD, downloaded from website djpk.depkeu. go.id.
Uncovering Regional Wealth 141
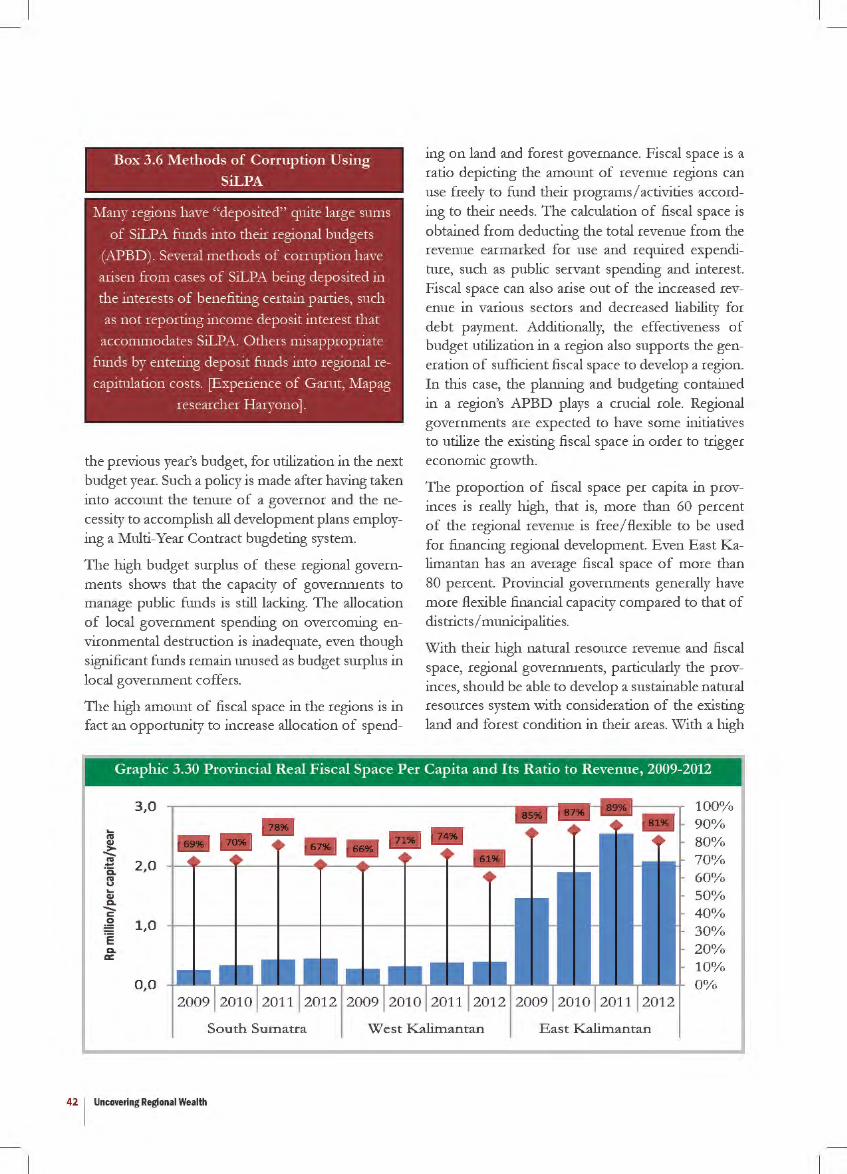
Box 3.6 Methods of Corruption Using
SiLPA
~!any regions have "deposited" quite large sums
of SiLPA funds into their regional budgets
(APBD). Several methods of corruption have
arisen from cases of SiLPA being deposited in
the interests of benefiting certain parties, such
as not reporting income deposit interest that
accommodates SiLPA. Others misappropriate
funds by entering deposit funds into regional re
capitulation costs. [Experience of Garut, ~fapag
researcher Haryono].
the previous year's budget, for utilization in the next budget year. Such a policy is made after having taken into account the tenure of a governor and the necessity to accomplish all development plans employing a Multi-Year Contract bugdeting system.
The high budget surplus of these regional governments shows that the capacity of governments to manage public funds is still lacking. The allocation of local government spending on overcoming environmental destruction is inadequate, even though significant funds remain unused as budget smplus in local government coffers.
The high amount of fiscal space in the regions is in fact an opportunity to increase allocation of spend-
ing on land and forest governance. Fiscal space is a ratio depicting the amount of revenue regions can use freely to fund their programs/ activities according to their needs. The calculation of fiscal space is obtained from deducting the total revenue from the revenue earmarked for use and required expenditure, such as public servant spending and interest. Fiscal space can also arise out of the increased revenue in various sectors and decreased liability for debt payment. Additionally, the effectiveness of budget utilization in a region also supports the generation of sufficient fiscal space to develop a region. In this case, the planning and budgeting contained in a region's APBD plays a crucial role. Regional governments are expected to have some initiatives to utilize the existing fiscal space in order to trigger economic growth.
The proportion of fiscal space per capita in provinces is really high, that is, more than 60 percent of the regional revenue is free / flexible to be used for financing regional development. Even East Kalimantan has an average fiscal space of more than 80 percent. Provincial governments generally have more flexible financial capacity compared to that of districts/ municipalities.
With their high natural resource revenue and fiscal space, regional governments, particularly the provinces, should be able to develop a sustainable natural resources system with consideration of the existing land and forest condition in their areas. With a high
Graphic 3.30 Provincial Real Fiscal Space Per Capita and Its Ratio to Re\'enue, 2009-2012
... "' i D.
:3 ... Cll D. -c:
3,0
2,0
~ 1,0 ·e D. a:
0,0
42 I Uncovering Regional Wealth
South Sumatra West Kalimantan East I<a.li.mantan
100% 90% 80% 70% 60% 50% 40% 30% 20% 10% 0%
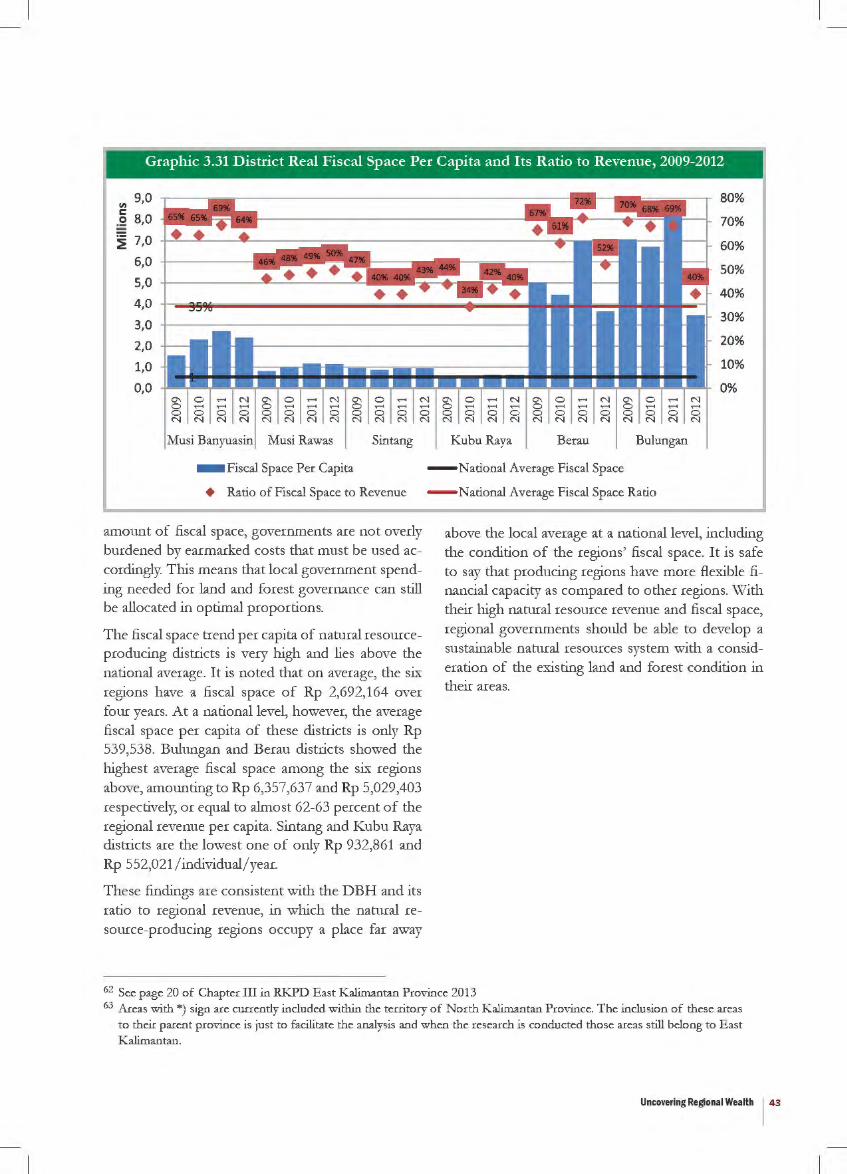
Graphic 3.31 District Real Fiscal Space Per Capita and Its Ratio to Revenue, 2009-2012
"' 9,0
c 8,0 .2
~ 7,0
6,0
5,0
4,0
3,0
2,0
1,0
0,0
Sin tang
- Fiscal Space Per Capita
+ Ratio of Fiscal Space to Revenue
amount of fiscal space, governments are not overly burdened by earmarked costs that must be used accordingly. This means that local government spending needed for land and forest governance can still be allocated in optimal proportions.
The fiscal space trend per capita of natural resourceproducing districts is very high and lies above the national average. It is noted that on average, the six regions have a fiscal space of Rp 2,692,164 over four years. At a national level, however, the average fiscal space per capita of these districts is only Rp 539,538. Bulungan and Berau districts showed the highest average fiscal space among the six regions above, amounting to Rp 6,357,637 and Rp 5,029,403 respectively, or equal to almost 62-63 percent of the regional revenue per capita. Sintang and Kubu Raya districts are the lowest one of only Rp 932,861 and Rp 552,021 /individual/year.
These findings are consistent with the DBH and its ratio to regional revenue, in which the natural resource-producing regions occupy a place far away
80%
70%
60%
SO%
40%
30%
20%
10%
0%
Kubu Raya Berau Bulungan
-National Average Fiscal Space
- National Average Fiscal Space Ratio
above the local average at a national level, including the condition of the regions' fiscal space. It is safe to say that producing regions have more flexible financial capacity as compared to other regions. With their high natural resource revenue and fiscal space, regional governments should be able to develop a sustainable natural resources system with a consideration of the existing land and forest condition in their areas.
62 See page 20 of Chapter III in RKPD East Kalimantan Province 2013 63 Areas with *) sign are currendy included within the territory of North Kalimantan Province. The inclusion of these areas
to their parent province is just to facilitate the analysis and when the research is conducted those areas still belong to East Kalimantan.
Uncovering Regional Wealth 143
44 Uncovering Regional Wealth
4.1 CONCLUSION
The responsibility taken for land and forest govern-ance by regional governments is less than optimal. The central government has failed to deal with the challenges presented by decentralization in a way that benefits society. Regional responsibility is inter-preted by regional governments to mean using land and forests for the greatest possible profit. Mean-while, not enough responsibility has been taken for the constant increase in environmental damage that has occurred since decentralization. Local leadership and regional governments’ capability and capacity to plan, implement and monitor land and forest gov-ernance has become part of the poor accountability of the regional government.
Firstly, the vision and mission of regional govern-ments has tended to prioritize the optimization of natural resource use with no optimum recovery plan. The regional governments’ visions and mis-sions emphasize land and forest exploitation as a source of regional revenue. Meanwhile, their en-vironmental recovery policies, in addition to being planned in a less than optimal way, are given very small budget allocations. Sustainable development policies are interpreted as plans to expand mining and oil palm plantations.
Secondly, authority over land and forest govern-ance is still chaotic, as monitoring is not properly conducted. Regional governments have been au-thorized, to a fairly large extent, by the central gov-ernment to manage mining and plantations. As for the management of forest resources, the central government still holds control. Regional authority over the management of mining and plantations has resulted in mining business permits and plantation business permits to be rapidly granted on a mas-sive scale. Meanwhile, authority held by the central government to monitor regional authorities is inad-equate. The number of monitoring officers (mining inspectors and PPNS) is estimated to be inadequate for the job of monitoring land and forest issues. The central government has also not established
Conclusion and Recommendations
Part IV
any scheme for monitoring forest damage resulting from mining and plantation activities. The budget allocated for monitoring is disappointing. Only a few regions make allocations for monitoring, and budgets for dispute settlement is allocated in an ad hoc manner.
Thirdly, the regional incentive scheme is incapable of addressing forest and land damage issues. The regional government has failed to implement any incentive scheme to recover forest and land damage due to inappropriate regulations. Up to 80 percent of the scheme through Profit-Sharing Funds for forestry affairs (included in this is DBH-DR foresta-tion fund) in Bulungan was not absorbed because it failed to meet the utilization provisions, which indicates how ineffective this policy is. Meanwhile, the incentive scheme for regional governments to reduce conflicts and to demarcate boundaries is not well-developed. One of the reasons for conflicts arising is the unclear demarcation of boundaries by regional governments, a process which is still unfin-ished.
The politics of local government budget policies has led to poor land and forest governance. The current direction of budget policymaking regard-ing land and forest governance puts great emphasis on increasing revenue in land and forestry sectors, while expenditure on the rehabilitation of damaged land and forests is still very limited.
Firstly, markdown of revenue plans and markup of expenditure plans has the potential to harm regional land and forest governance activities. Regional reve-nue is always set lower than actual spending. In con-trast, regional expenditure is always set higher than the actual expenditure. Regional governments re-peat these scenarios again and again, indicating that public financial management at the regional level is very poor. Poor public financial management brings with it the potential for loss of regional revenue, particularly in the land and forest sector.
Secondly, the high regional revenue from the land
45Uncovering Regional Wealth
and forest sector is not followed up with an alloca-tion of regional spending on prevention of defor-estation and land and forest degradation. The high amount of regional revenue from this sector has no impact on social welfare, unlike what is promised by regional governments’ vision and missions. Despite the absence of a benchmark, particularly one speci-fying the ideal amount to allocate on land and for-est governance spending, the findings indicate that the spending allocation provided by regional gov-ernments are disproportionate with their efforts to make the land and forest sector a source of regional revenue. In several cases, it was found that spending on land and forest governance only received half the portion allocated to social assistance and grant spending. The expenditure allocation for the forest-ry, environment and spatial zoning sectors were only allocated around 1 percent each. Even for forestry functions, such a small budget cannot be absorbed well.
Thirdly, it should be possible to use regional financ-ing to fund greater spending on land and forest gov-ernance, since many regions have high SiLPA and fiscal space.
4.2 RECOMMENDATIONS
For the central government, this research recom-mends :
1. That the central government develop and revise its incentive schemes for more optimal land and forest governance by:
a. Revising the policy on DBH DR manage-ment in order to steer it more towards its objective, that is, mitigating forest and land damage by allowing regions to innovate.
b. Giving more authority to regional govern-ments, particularly for the acceleration of environmental damage recovery or rehabil-itation targets, and giving the public access to governance mechanisms. International experience suggests that public participa-tion in forest governance is effective in maintaining forest coverage. There is a
need for further studies on this in order to maximize regional authority. The granting of greater authority should be followed by the establishment of clear performance in-dicators and an adequate fiscal policy for its implementation.
c. Developing an incentive scheme to reduce more massive environment damage, for ex-ample, to encourage regional governments that are serious about settling boundary de-marcation and land disputes. As is already is known, clear boundary demarcation is a critical stage in mitigating deforestation and land and forest degradation. However, thus far, many regions have not accomplished these activities.
2. That the central government maximize the monitoring role of regional planning and budg-eting policy in order to prevent high rates of deforestation and land and forest degradation in the regions. The central government can do this by:
a. Developing benchmarks related to land and forest governance. For example, a bench-mark for land recovery costs, number of monitoring personnel per hectare and oth-er issues.
b. Developing a review instrument for re-gional planning and budgeting policy with greater partiality to mitigation of defor-estation and land and forest degradation. Studies conducted by the government are generally too broad and give too little con-sideration to environmental damage and greenhouse gas emissions. The Indonesian government’s commitment to mitigating emissions should be addressed by, among other things, providing review instruments for regional policy. Such a review instru-ment may take the form of a “pro-environ-mental policy statement” in planning policy documents such as the RPJMD and budget policies such as APBD.
c. Adjusting the guidelines for drafting an
46 Uncovering Regional Wealth
APBD each year, in order that activities re-lated to preventing deforestation and land and forest degradation can be implemented optimally, such as adding a new account code.
d. Developing more transparent and account-able public financial management monitor-ing and control instruments, particularly for tracking regional revenues from the land and forest sector and reclamation guarantee fund.
e. Encouraging the House of Representatives (DPR) to play a more optimal monitoring role by developing sanction schemes for regions that may be conducting public fi-nancial management malpractice. The large number of regions that have high SiLPA ought to be addressed by the central gov-ernment through certain policy schemes, including a sanction instrument for regions.
For regional governments, this research recom-mends :
1. Increasing the expenditure allocation on land and forest governance, and improving public finance management by making it more trans-parent and accountable.
2. Developing local government innovation schemes to:
a. Build regional government transparency, participation and accountability mecha-nisms in land and forest governance. This can be achieved, for example, by devel-oping more transparent and accountable management of reclamation guarantee funds through the establishment of an in-stitution or system and providing an alter-native scheme for public participation in overcoming and preventing environmental damage, as well as in optimally maintaining forest coverage in the regions.
b. Adjust the the guidelines for drafting the
APBD each year to ensure optimal imple-mentation of strategic activities to prevent deforestation and land and forest degrada-tion.
c. Use the internal review scheme to assess whether or not planning policies and budg-ets have been effective in preventing defor-estation and land and forest degradation.
d. Provide governance access to communities that are committed to maintaining forest coverage in Other Use Areas (APL), re-membering that the authority for APL poli-cies lies with regional governments.
3. Strengthen the monitoring of regional govern-ments to reduce the rate of deforestation and land and forest degradation. This can be done by:
a. Increasing the number of mining and civil servant inspectors by using an alternative scheme to improve the monitoring of min-ing and forest areas.
b. Encouraging the Regional People’s Rep-resentatives Assembly (DPRD) to play a more active monitoring role, including by establishing a Regional Financial Account-ability Agency (BAKD) in order to ensure the efficiency and effectiveness of budget management.
For civil society, this research recommends that groups:
1. Use the results of this study as an instrument to improve budget and planning policies in the regions, and to thereby improve land and forest governance.
2. Conduct studies related to budget policies for better land and forest governance, both at the national and local levels, as a way to increase public debate on the issue. Studies on financing benchmarks for environmental recovery and the mitigation of deforestation and land and forest degradation also need to be followed up
47Uncovering Regional Wealth
on. Meanwhile, studies on the loss of state reve-nue in the land and forest sector still need to be conducted because of the considerable amount of money being lost.
3. Work on issues of budget policy that support a stronger civil society movement for land and forest governance, as part of strengthening In-donesian civil society in general.
4. Advocate for public involvement in the process of preparing and monitoring budgets so that the rights and aspirations of communities can be adequately considered by governments in drafting budgets, including aspirations for the conservation of natural resources and preven-tion of deforestation.
48 Uncovering Regional Wealth
Bibliography
West Kalimantan Statistics Agency, 2012, Daerah Dalam Angka 2012 (Regional Figures 2012). Pontianak.East Kalimantan Statistics Agency, 2012, Daerah Dalam Angka 2012 (Regional Figures 2012). Samarinda.South Sumatra Statistics Agency, 2012 Daerah Dalam Angka 2012 (Regional Figures 2012). Palembang.CIFOR, 2011, Tata Kelola Keuangan dan Dana Reboisasi selama Periode Soeharto dan Paska Soeharto 1998 – 2009 (Financial Governance and Reforestation Funding in the Suharto and post-Suharto period 1989 – 2009), Bogor.Director General of Fiscal Balance, 2011, Deskripsi dan Analisis APBD TA (Regional Budget Description and Analysis), 2011, Ministry of Finance, Jakarta.Director General of Fiscal Balance (DJPK), 2012, Konsolidasi laporan keuangan pemerintah daerah dengan laporan keuangan transfer ke daerah tahun anggaran 2008 & 2009 (Consolidated regional government finan-cial report with regional financial transfers 2008 & 2009), Ministry of Finance, Jakarta.Director General of Plantations, 2012, Profil Kelapa Sawit di Indonesia, (Profile of Palm Oil in Indonesia), Ministry of Plantations, Jakarta.Director General of Forestry Planning, 2012, Data dan Informasi Ditjen Planologi tahun 2012 (Director General of Urban Design Data and Information), Ministry of Forestry, Jakarta.Directorate of Managament and Preparations for Forest Use, Director General Forest Design, 2011, Data dan Informasi Pemanfaatan Hutan tahun 2011 (Data and Information about Forest Usage 2011). Kemen-terian Kehutanan, Jakarta.http://www.antarabengkulu.com/berita/18940/hutan-harapan-terancam-tambang-batubarahttp://www.fwi.or.id/tag/intip-hutan/http://www.geodata-cso.org/index.php/page/index/6http://www.health.liputan6.com/read/494714/menkes-orang-indonesia-konsumsi-10-batang-rokok-per-harihttp://www.pusdatin.setjen.deptan.go.id/ditjentp/berita-cetak-ribuan-hektar-sawah-baru-kalbar-percepat-pengembangan-food-estate.htmlhttp://www.regional.kompas.com/read/2013/09/27/1000488/Konflik.Lahan.Terus.MunculIndonesian Center for Environment Law (ICEL), 2011, Research Report: Potret Reklamasi dan Pasca Tam-bang di Indonesia (An Overview of Reclamation and Post Mining in Indonesia), Jakarta.Indonesia Corruption Watch, 2012, Setengah Hati Berantas Kejahatan Kehutanan (Half-hearted Forest Crime Eradication), Jakarta.JATAM, 2012, Presentation: “Tambang dan Keselamatan Rakyat” (Mining and People’s Safety), Jakarta.Coordinating Ministry of Economic Affaris, 2011, Masterplan Percepatan dan Perluasan Pembangunan Ekonomi Indonesia (MP3EI) (Masterpaln for the Accelaration and Expansion of Indonesia’s Economic Development). Jakarta.KOMPPAK, 2013, Menyediakan Taring bagi Macan yang Ompong: Tanggapan Kelompok Sipil atas Ran-cangan Peraturan Daerah tentang Reklamasi dan Paska Tambang (Providing for the toothless tiger: civil society responses over the draft post-mining reclamation area), Position Paper, Balikpapan.Mumbunan, S., Wahyudi, R., 2012, Transparansi Penerimaan Industri Ekstratktif Sektor Kehutanan di In-donesia (Revenue transparency in the forestry extractive industry sector in Indonesia), Article 33, Jakarta.Ministerial Regulation of Forestry of Republic of Indonesia Number: P. 30/Menhut-Ii/2010 on Amend-
49Uncovering Regional Wealth
ment of Ministerial Regulation of Forestry Number P.9/Menhut-Ii/2010 on Permit of Corridor Construc-tion and Utilization.Ministerial Regulation of Home Affairs Number 32/2012 concerning Guidelines of Grant and Social As-sistance from APBD.Government Regulation Number 15 of 2010 concerning Implementation of Spatial Zoning.Kubu Raya district government, 2009, Rencana Pemerintah Jangka Menengah Dareah 2009-2014 (Mid-term regional development plan 2009-14), Kubu Raya.Berau district government, 2012, Rencana Kerja Pemerintah Daerah Kabupaten Berau Tahun 2013 (Berau district government work plan 2013). Berau.Kalimantan Barat provincial government, 2012, Rencana Kerja Pemerintah Daerah Provinsi Kalimantan Barat Tahun 2013 (West Kalimantan provincial government work plan 2013). Pontianak.Kalimantan Timur provincial government, 2012, Rencana Kerja Pemerintah Daerah Provinsi Kalimantan Timur Tahun 2013 (East Kalimantan provincial government work plan 2013). Samarinda.Sumatera Selatan provincial government, 2012, Rencana Kerja Pemerintah Daerah Provinsi Sumatera Sela-tan Tahun 2013 (South Sumatra provincial government work plan 2013). Palembang.Centre for Anthropology Studies Universitas Indonesia, 2013, Analisis Ekonomi Politik dan Agenda Peru-bahan Tata Kelola Hutan dan Lahan di Provinsi Sumatera Selatan (Political economy analysis and agenda for reforming South Sumatra’s forest and land governance), Jakarta.Seknas FITRA and Asia Foundation, 2012, Analisis Anggaran Daerah 2011; Studi Terhadap APBD Tahun 2008-2011 di 20 Kabupaten/Kota di 4 Provinsi (Regional budget analysis 2011: Regional budget study year 2008-11 in 20 districts and 4 provinces), Jakarta.Seknas FITRA and Asia Foundation, 2011, Studi Anggaran Daerah 2010; Studi terhadap Anggaran Tahun 2007 - 2010 di 42 kabupaten/kota dan 5 provinsi,(Regional budget study 2010: Annual budget 2007-10 in 42 districts / cities and 5 provinces), Jakarta.Seknas FITRA and Asia Foundation, 2013, Mengukur Komitmen: Analisis Kebijakan Perencanaan dan Anggaran Nasional dalam Pengelolaan Hutan dan Lahan (Measuring Commitment: an analysis of national budget and planning policies and the impact on land and forest governance in Indonesia), Jakarta.Sekolah Tinggi Pertanahan Nasional, 2013, Bhumi Jurnal Ilmiah Tertanahan PPPM – STPN nomor 37 ta-hun 12, Yogjakarta.The Asia Foundation, 2002, Indonesia’s Second Rapid Decentralization Appraisal Report (Juni-November 2002), The Asia Foundation, Jakarta.Law Number 27 of 2007 concerning Spatial Zoning.Law Number 33 of 2004 concerning Financial Distribution between Central and Regional Governments.Law Number 35 of 2007 concerning Establishment of Kubu Raya Province in West Kalimantan Province.World Bank, 2013, Country Environmental Assessment, Investing in a more sustainable Indonesia, Jakarta.Yuli Isnadi, Opinion: “Kutukan Sumberdaya Alam” dalam http://www.riaupos.co/2358-opini--kutukan-sumber-daya-alam-.html#.UpXRQuJElUY
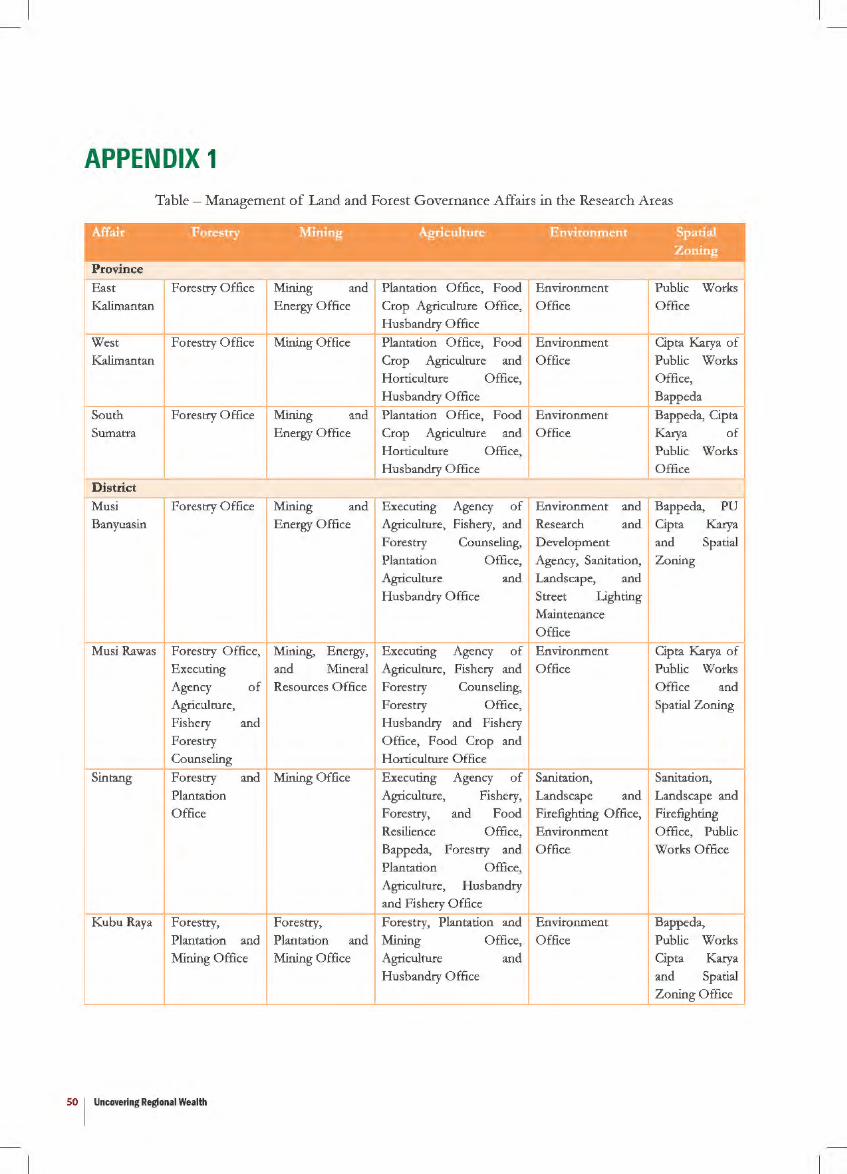
APPENDIX 1 Table - Management of Land and Forest Governance Affairs in the Research Areas
Mfair Forestry Mining Agriculture Environment Spatial
Provmce
East
Kalimantan
West
Kalimantan
South Sumatra
District
Musi Banyuasin
MusiRawas
Sin tang
Kubu Raya
Forestry Office Mining and Energy Office
Forestry Office Mining Office
Plantation Office, Food
Crop Agriculture Office, Husbandry Office
Plantation Office, Food Crop Agriculture and Horticulture Office, Husbandry Office
Environment
Office
Environment Office
Forestry Office Mining and Plantation Office, Food Environment
Forestry Office
Energy Office Crop Agriculture and Office
Mining and Energy Office
Horticulture Office, Husbandry Office
Agency of Environment Fishery, and Research
and and
Executing Agriculture, Forestry Plantation Agriculture Husbandry Office
Counseling, Office,
and
Development Agency, Sanitation, Landscape, and
Street Lighting Maintenance Office
Forestry Office, Mining, Energy, Executing Agency of Environment Executing and Mineral Agriculture, Fishery and Office Agency of Resources Office Forestry Counseling, Agriculture, Forestry Office, Fishery and Husbandry and Fishery Forestry Office, Food Crop and Counseling Horticulture Office
Forestry and Mining Office Executing Agency of Sanitation, Plantation Agriculture, Fishery, Landscape and Office Forestry, and Food Firefighting Office,
Forestry, Plantation and
Mining Office
Forestry,
Plantation and Mining Office
Resilience Office, Environment Bappeda, Forestry and Office Plantation Office, Agriculture, Husbandry and Fishery Office
Forestry, Plantation and Environment
Mining Office, Office Agriculture and Husbandry Office
SO I Uncovering Regional Wealth
Zoning
Public Works
Office
Cipta Karya of Public Works Office, Bappeda
Bappeda, Cipta Karya of Public Works Office ______,
Bappeda, PU Cipta Karya and Spatial Zoning
Cipta Karya of Public Works
Office and Spatial Zoning
J Sanitation, Landscape and Firefighting Office, Public Works Office
J Bappeda, Public Works
Cipta Karya and Spatial Zoning Office

Berau Forestry Office Mining and Food Resilience and Environment Housing and Energy Office Counseling Executing Office Spatial Zoning
Agency, Plantation Office, Office, Food Crop R~o@ J Agriculture Office, Secretariate Husbandry and Animal Health Office
Bulungan Forestry Office Mining Office Agriculture Office Regional Bappeda, Environmental Public Works
Impact Control Cipta Karya Agency, Sanitation, and Spatial Landscape, Grave Zoning Office and Fire Problem Response Office
Uncovering Regional Wealth I 51
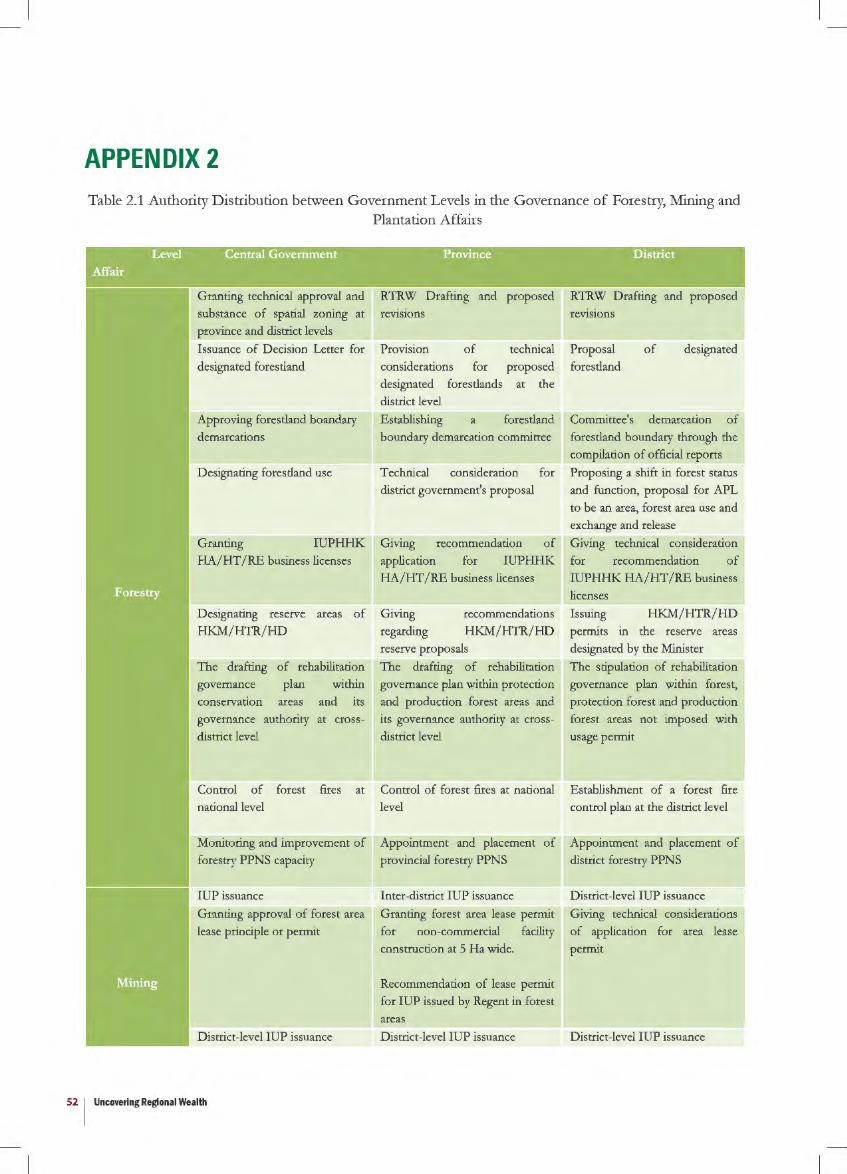
APPENDIX 2 Table 2.1 Authority Distribution between Government Levels in the Governance of Forestry, Mining and
Plantation Affairs
Mfair
Level Central Government Province District
Granting technical approval and RTRW Drafting and proposed RTRW Drafting and proposed substance of spatial zoning at revtsiOns revlSlons province and district levels
Issuance of Decision Letter for
designated forestland
Approving forestland boandary demarcations
Designating forestland use
Granting IUPHHK
HA/HT IRE business licenses
Designating reserve areas of
HKM/HTR/HD
The drafting of rehabilitation governance plan within conservation areas and its
governance authority at crossdistrict level
Provision of technical
considerations for proposed designated forestlands at the district level
Establishing a forestland boundary demarcation committee
Technical consideration for district government's proposal
Giving recommendation of application for IUPHHK
HA/HT /RE business licenses
Giving
regarding
recommendations
HKM/HTR/HD reserve proposals
The drafting of rehabilitation governance plan within protection and production forest areas aod
its governance authority at crossdistrict level
Proposal forestland
of designated
Committee's demarcation of forestland boundary through the
compilation of official reports
Proposing a shift in forest status and function, proposal for APL
to be an area, forest area use and exchange and release
Giving technical consideration for recommendation of
IUPHHK HA/HT /RE business licenses
Issuing HKM/HTR/HD permits in the reserve areas
designated by the Minister
The stipulation of rehabilitation governance plan within forest, protection forest and production
forest areas not imposed with usage permit
Control of forest fires at Control of forest fires at national Establishment of a forest fire national level
Monitoring and improvement of forestry PPNS capacity
IUP issuance
Granting approval of forest area lease principle or permit
District-level IUP issuance
level
Appointment and placement of provincial forestry PPNS
Inter-district IUP issuance
Granting forest area lease permit for non-commercial facility construction at 5 Ha wide.
Recommendation of lease permit for IUP issued by Regent in forest areas
District-level IUP issuance
control plan at the district level
Appointment and placement of district forestry PPNS
District-level IUP issuance
Giving technical considerations of application for area lease permit
District-level IUP issuance
52 I Uncovering Regional Wealth

Stipulating NPSK (criteria Issuing inter-district IUPs
guidelines of standard norms)
Issuing Decision Letters for the
release of forestland (Ministry of
Forestry)
Proposing the release
forestland for a plantation
Issuing IUP in districts
of Proposing the release
forestland for a plantation
of
Uncovering Regional Wealth I 53

54 Uncovering Regional Wealth

55Uncovering Regional Wealth

56 Uncovering Regional Wealth