Embed Size (px)
Citation preview

Uncovering Overlap Community Structure in Complex Networks using Particle Competition
Fabricio A. Breve [email protected] Zhao [email protected] G. Quiles [email protected]
Department of Computer Science. Institute of Mathematics and Computer Science. University of São Paulo. São Carlos-SP. Brazil
International Conference on Artificial Intelligence and Computational Intelligence - AICI'09

Contents
Introduction Overlap Community Structure
Model Description Initial Configuration Node and Particle Dynamics Random-Deterministic Walk Fuzzy Output Algorithm
Computer Simulations Synthetic Networks Real-World Network
Conclusions

Introduction
Communities are defined as a subgraph whose nodes are densely connected within itself but sparsely connected with the rest of the network.
However, in practice there are common cases where some nodes in a network can belong to more than one community. Example: in a social network of friendship, individuals often belong to several
communities: their families, their colleagues, their classmates, etc.
These nodes are called overlap nodes, and most known community detection algorithms cannot detect them
Uncovering the overlapping community structure of complex networks becomes an important topic in data mining. [1 – 3]
1. Zhang, S.,Wang, R.S., Zhang, X.S.: Identication of overlapping community structure in complex networks using fuzzy c-means clustering. Physica A Statistical Mechanics and its Applications 374 (January 2007) 483-490.
2. Palla, G., Derenyi, I., Farkas, I., Vicsek, T.: Uncovering the overlapping community structure of complex networks in nature and society. Nature 435(7043) (2005) 814-818 .
3. Zhang, S., Wang, R.S., Zhang, X.S.: Uncovering fuzzy community structure in complex networks. Physical Review E (Statistical, Nonlinear, and Soft Matter Physics) 76(4) (2007) 046103.

Proposed Method
Particles competition For possession of nodes of the networkRejecting intruder particles
ObjectivesDetect community structureUncover overlap community structure

Initial Configuration
A particle is generated for each community to be detected
Nodes have an ownership vector Initially, nodes have levels set equally for each
particle Ex: [ 0.25 0.25 0.25 0.25 ] (4 classes)
Particles initial position is set randomly.0
1

Node Dynamics When a particle selects a neighbor to
visit: It decreases the ownership level of other
particles It increases its own ownership level
0
1
0
1
t
t+1

Particle Dynamics A particle will get:
stronger when it is targeting a node being dominated by it
weaker when it is targeting a node dominated by other particles
0,8
0,2 0,2
0,8
0 0,5 1 0 0,5 1 0 0,5 1 0 0,5 1

Particles Walk Shocks
A particle really visits a target node only if its ownership level on that node is higher than others;
otherwise, a shock happens and the particle stays at the current node until next iteration.
How a particle chooses a neighbor node to target? Random walk Deterministic walk
0.6
0.4
0.3
0.7

Random-deterministic walk
Random walkThe particle randomly
chooses any neighbor to visit with no concern about ownership levels
Deterministic walkThe particle will prefer
visiting nodes that it already dominates
The particles must exhibit both movements in order to achieve an equilibrium between exploratory and defensive behavior

0.8
0.2
0.60.4
0.3
0.7
Deterministic Moving Probabilities
Random Moving Probabilities
35%
18%
47%
33%
33%
33%
v1
v2
v3
v4
v2
v3
v4
v2
v3
v4

Fuzzy Output
Instantaneous ownership levels Very volatile under certain conditions
In overlap nodes the dominating team changes frequently
Levels do not correspond to overlap measures
Long-term ownership levels Temporal averaged domination level for each team
at each node Weighted by particle strength Considers only the random movements

Fuzzy Output
At the end of the iterations, the degrees of membership for each node are calculated using the long term ownership levels

Algorithm
1) Build the adjacency matrix,
2) Set nodes domination levels,
3) Set initial positions of particles randomly and set particle strength
4) Repeat steps 5 to 8 until convergence or until a predefined number of steps has been achieved,
5) For each particle, complete steps 6 to 8,
6) Select the target node by using the combined random-deterministic rule,
7) Update target node domination levels,
8) Update particle strength,
9) Calculate the membership levels (fuzzy classication) based on long-term ownership levels

COMPUTER SIMULATIONS

Connections Fuzzy ClassificationA-B-C-D A B C D16-0-0-0 0.9928 0.0017 0.0010 0.004615-1-0-0 0.9210 0.0646 0.0079 0.006514-2-0-0 0.8520 0.1150 0.0081 0.024813-3-0-0 0.8031 0.1778 0.0107 0.008412-4-0-0 0.7498 0.2456 0.0032 0.001411-5-0-0 0.6875 0.3101 0.0016 0.000810-6-0-0 0.6211 0.3577 0.0111 0.01019-7-0-0 0.5584 0.4302 0.0011 0.01038-8-0-0 0.4949 0.4944 0.0090 0.00178-4-4-0 0.5025 0.2493 0.2461 0.00217-4-4-1 0.4397 0.2439 0.2491 0.06726-4-4-2 0.3694 0.2501 0.2549 0.12565-4-4-3 0.3144 0.2491 0.2537 0.18284-4-4-4 0.2512 0.2506 0.2504 0.2478
Table 1. Fuzzy classification of a node connected to network with 4 communities generated with zout/k = 0.125

Connections Fuzzy ClassificationA-B-C-D A B C D16-0-0-0 0.9912 0.0027 0.0024 0.003715-1-0-0 0.9318 0.0634 0.0026 0.002314-2-0-0 0.8715 0.1219 0.0023 0.004413-3-0-0 0.8107 0.1827 0.0036 0.003012-4-0-0 0.7497 0.2437 0.0044 0.002211-5-0-0 0.6901 0.3036 0.0034 0.002910-6-0-0 0.6298 0.3654 0.0020 0.00289-7-0-0 0.5584 0.4360 0.0026 0.00308-8-0-0 0.4952 0.4985 0.0027 0.00368-4-4-0 0.5060 0.2485 0.2427 0.00287-4-4-1 0.4442 0.2477 0.2429 0.06526-4-4-2 0.3762 0.2465 0.2514 0.12595-4-4-3 0.3178 0.2500 0.2473 0.18494-4-4-4 0.2470 0.2518 0.2489 0.2523
Table 2. Fuzzy classification of a node connected to network with 4 communities generated with zout/k = 0.250

Connections Fuzzy ClassificationA-B-C-D A B C D16-0-0-0 0.9709 0.0092 0.0108 0.009115-1-0-0 0.9160 0.0647 0.0093 0.010114-2-0-0 0.8571 0.1228 0.0104 0.009713-3-0-0 0.8008 0.1802 0.0100 0.009012-4-0-0 0.7422 0.2385 0.0095 0.009811-5-0-0 0.6825 0.2958 0.0123 0.009310-6-0-0 0.6200 0.3566 0.0111 0.01239-7-0-0 0.5582 0.4181 0.0128 0.01098-8-0-0 0.4891 0.4846 0.0130 0.01338-4-4-0 0.5045 0.2437 0.2406 0.01137-4-4-1 0.4397 0.2461 0.2436 0.07056-4-4-2 0.3797 0.2471 0.2445 0.12875-4-4-3 0.3175 0.2439 0.2473 0.19134-4-4-4 0.2462 0.2494 0.2549 0.2495
Table 3. Fuzzy classification of a node connected to network with 4 communities generated with zout/k = 0.375
-5 -4 -3 -2 -1 0 1 2 3 4 5-6
-4
-2
0
2
4
6
0
0.1
0.2
0.3
0.4
0.5
0.6
0.7
0.8
0.9
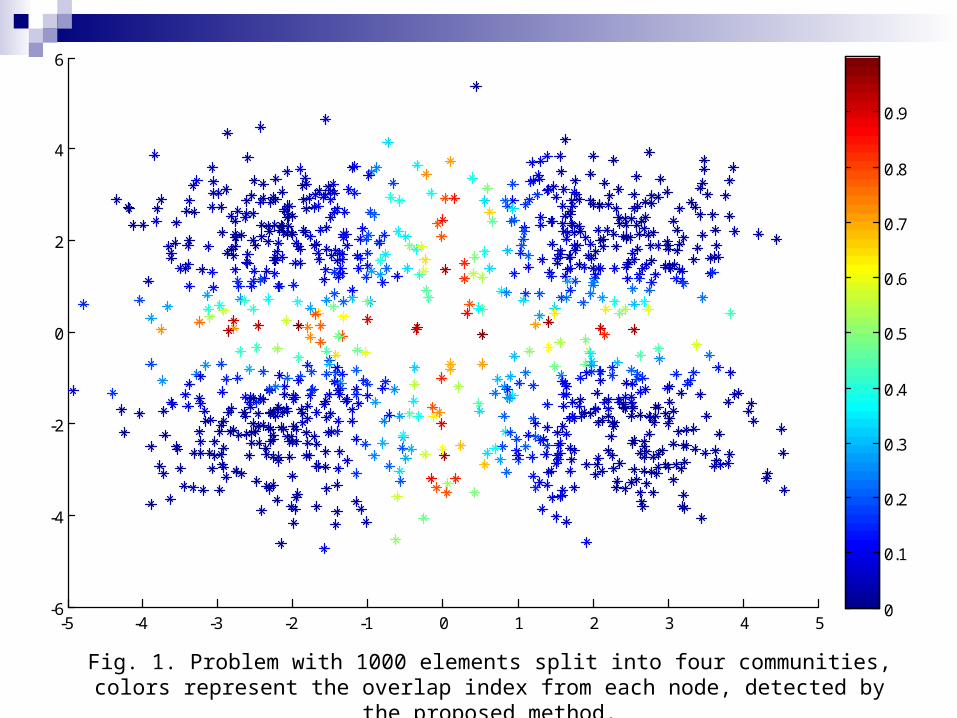
Fig. 1. Problem with 1000 elements split into four communities, colors represent the overlap index from each node, detected by the proposed method.

Fig. 2. The karate club network, colors represent the overlap index from each node, detected by the proposed method.
Conclusions
The algorithm outputs not only hard labels, but also soft labels (fuzzy values) for each node in the network, which corresponds to the levels of membership from that node to each community.
Computer simulations were performed in both synthetic and real data, and the results shows that our model is a promising mechanism to uncover overlap community structure in complex networks.

Uncovering Overlap Community Structure in Complex Networks using Particle Competition
Fabricio A. Breve [email protected] Zhao [email protected] G. Quiles [email protected]
Department of Computer Science. Institute of Mathematics and Computer Science. University of São Paulo. São Carlos-SP. Brazil
International Conference on Artificial Intelligence and Computational Intelligence - AICI'09