Embed Size (px)
Citation preview
RESEARCH ARTICLE Open Access
Uncovering co-expression gene networkmodules regulating fruit acidity in diverse applesYang Bai1, Laura Dougherty1, Lailiang Cheng2, Gan-Yuan Zhong3 and Kenong Xu1*
Abstract
Background: Acidity is a major contributor to fruit quality. Several organic acids are present in apple fruit, but malicacid is predominant and determines fruit acidity. The trait is largely controlled by the Malic acid (Ma) locus,underpinning which Ma1 that putatively encodes a vacuolar aluminum-activated malate transporter1 (ALMT1)-likeprotein is a strong candidate gene. We hypothesize that fruit acidity is governed by a gene network in which Ma1is key member. The goal of this study is to identify the gene network and the potential mechanisms through whichthe network operates.
Results: Guided by Ma1, we analyzed the transcriptomes of mature fruit of contrasting acidity from six apple accessionsof genotype Ma_ (MaMa or Mama) and four of mama using RNA-seq and identified 1301 fruit acidity associated genes,among which 18 were most significant acidity genes (MSAGs). Network inferring using weighted gene co-expressionnetwork analysis (WGCNA) revealed five co-expression gene network modules of significant (P < 0.001) correlation withmalate. Of these, the Ma1 containing module (Turquoise) of 336 genes showed the highest correlation (0.79). We alsoidentified 12 intramodular hub genes from each of the five modules and 18 enriched gene ontology (GO) terms andMapMan sub-bines, including two GO terms (GO:0015979 and GO:0009765) and two MapMap sub-bins (1.3.4 and 1.1.1.1)related to photosynthesis in module Turquoise. Using Lemon-Tree algorithms, we identified 12 regulator genes ofprobabilistic scores 35.5–81.0, including MDP0000525602 (a LLR receptor kinase), MDP0000319170 (an IQD2-like CaMbinding protein) and MDP0000190273 (an EIN3-like transcription factor) of greater interest for being one of the 18 MSAGsor one of the 12 intramodular hub genes in Turquoise, and/or a regulator to the cluster containing Ma1.
Conclusions: The most relevant finding of this study is the identification of the MSAGs, intramodular hub genes,enriched photosynthesis related processes, and regulator genes in a WGCNA module Turquoise that not onlyencompasses Ma1 but also shows the highest modular correlation with acidity. Overall, this study provides importantinsight into the Ma1-mediated gene network controlling acidity in mature apple fruit of diverse genetic background.
Keywords: Malus, Fruit acidity, Ma1, Aluminum-activated malate transporter1 (ALMT1), Gene network
BackgroundApple fruit acidity refers to the sensory intensity of tartnessof fruit flesh tissues. The stronger the tartness taste, thehigher the fruit acidity levels. Chemically, fruit acidity canbe quantified by measuring fruit juice pH and/or titratableacidity (TA). It has been shown that several organic acidsare present in mature apple fruit, including malic acid,quinic acid, citric acid and others, but malic acid consists ofmore than 90 % of the total [1–3], thereby largely determin-ing fruit acidity. For dessert apples, fruit acidity could be
grouped into three categories by TA: low (<3.0 mg/ml),normal (3.0–10.0 mg/ml), and high (>10.0 mg/ml), andcategories high and low are not acceptable [4]. This makesfruit acidity an essential quality component not only for de-termining the fate of existing varieties, but also for prompt-ing routine evaluations of acidity levels in apple breeding asgenotypes of fruit acidity beyond the acceptable normalrange can make up 25–50 % in breeding populations. As aresult, fruit acidity has long been an important subject areaof investigations in apple genetics.Apple fruit acidity is primarily controlled by the major
gene or QTL on chromosome 16, called Malic acid (Ma)alongside a significant QTL on chromosome 8 and a fewother QTLs with relatively smaller effects [4–9]. With
* Correspondence: [email protected] Section, School of Integrative Plant Science, Cornell University,New York State Agricultural Experiment Station, Geneva, NY 14456, USAFull list of author information is available at the end of the article
© 2015 Bai et al. Open Access This article is distributed under the terms of the Creative Commons Attribution 4.0International License (http://creativecommons.org/licenses/by/4.0/), which permits unrestricted use, distribution, andreproduction in any medium, provided you give appropriate credit to the original author(s) and the source, provide a link tothe Creative Commons license, and indicate if changes were made. The Creative Commons Public Domain Dedication waiver(http://creativecommons.org/publicdomain/zero/1.0/) applies to the data made available in this article, unless otherwise stated.
Bai et al. BMC Genomics (2015) 16:612 DOI 10.1186/s12864-015-1816-6
regard to the allelic interactions at the major QTL Ma,normal/high acid allele (Ma) is largely dominant over thelow acid allele (ma). Genotypes MaMa and Mama havefruit of normal to high acidity while genotype mama of lowacidity with little or none commercial value. To focus onthe most important genetic factor, we [10] and others [11]have recently isolated the major QTL Ma. The commonfindings were that the Ma locus harbors two new membersof the Aluminum-activated Malate Transporter1 (ALMT1)gene family, called Ma1 and Ma2. The studies furtherfound that Ma1 was expressed in significantly positivecorrelation with fruit acidity levels while the expression ofMa2 was barely detectable in both high and low acid fruit,suggesting that it was gene Ma1 rather than Ma2 that wasthe very gene underlying Ma [10, 11]. In addtion, a detailedanalysis of the allele specific DNA sequences of Ma1 indi-cated that a single base mutation that would stop the pro-tein translation process prematurely was almost completelyassociated with low acidity in a diverse set of apple germ-plasm studied, suggesting that the low acidity is caused bythe malfunction of the MA1 protein due to the deducedtruncation at the C-terminus [10].These latest findings have markedly increased our
understanding on fruit acidity, but many questions remainto be answered. For example, how does the landscape oftranscriptomes differ between genotypes Ma_ (MaMa andMama) and mama at maturity stage? If fruit acidity isgoverned by a gene network in which Ma1 is the geneticdeterminant, what would the other possible members inthe network? What are the potential biological processand/or regulatory mechanisms responsible for the con-trast acidity levels between genotype groups Ma_ andmama? The development of mRNA sequencing (RNA-seq) technology that unlocks the power of high through-put of next generation sequencing has provided an idealmeans to address these questions. Since its inception[12, 13], RNA-seq has been rapidly adapted in tran-scriptomics studies in plants such as Arabidopsis [14],grape [15], maize [16] and rice [17]. In apple, RNA-seq based studies have recently been reported as well[18–24]. More importantly, to begin resolving the lowcoverage issue of the current version of apple refer-ence transcriptome, we have improved it with RNA-seq reads from fruit of Golden Delicious (GD), thesource of the reference genome [25], which is availableat the Genome Database for Rosaceae (GDR) [26]. Wehave also used the improved reference transcriptomethrough RNA-seq approach to construct a co-expressiongene network associated with developmental regulation ofmalate levels varying from 5.2 to 14.5 mg/g fw (normal tohigh acidity) in developing fruit of ‘Golden Delicious’ ofgenotype Mama [24].The objectives of this study are to address the ques-
tions aforementioned. To do so, we first sequenced 30
RNA-seq libraries representing transcriptomes of ma-ture fruit from ten apple varieties of genotypes MaMa,and Mama and mama, and then mapped the RNA-seqreads against the improved apple reference transcrip-tome [25]. Using Ma1 as a guide gene, a series of down-stream analyses was conducted, leading to identificationof weighted co-expression gene network modules sig-nificantly correlated with malate, most significant acid-ity genes, intramodular hub genes, regulator genes,enriched gene ontology (GO) terms and MapMan sub-bins, and others. To the best of our knowledge, this isfirst report attempting to understand the Ma1-mediatedgene network regulating fruit acidity in apples of diversegenetic background.
MethodsPlant materials and fruit acidity quantificationTen apple varieties of known genotype at the Ma locuswere chosen, including four of mama–Britegold (B),Sweet Delicious (S), Novosibirski Sweet (N) andPI323617 (P), four of Mama–Fuji (F, Red Sport Type2), Rome Beauty Law (R), Cox’s Orange Pippin (C) andJonathan (J), and two of MaMa–Empire (E) andGranny Smith (G). Genotypes Mama and MaMa werejointly designated Ma_ to represent a group that had atleast one functional allele of Ma1. The trees werebudded onto rootstock P22 and grown in a researchorchard of Cornell University at Geneva, New York.Fruit of three replicates per variety and 8–10 fruit perreplicate were harvested at maturity from 2 to 3 treesin fall 2012 (Additional file 1: Table S1). Each fruit wascross-sectioned into two halves: one half were used formaturity evaluation and fruit juice extraction, and theother half were sliced and immediately frozen in liquidnitrogen for RNA isolation and for quantitation ofmalate and other metabolites. The evaluation of fruitmaturity and fruit acidity was conducted as previouslydescribed [4]. Fruit of Cornell Starch Index 4.0–6.0 [27]were considered matured and only matured fruit (withthe core removed) were used for analysis. Two indica-tors of fruit acidity were measured: pH by a pH meter(Accumet AB15, Fisher Scientific, PA, USA) and titratableacidity (TA, malic acid equivalent) by an autotitrator(Metrohm 848 Titrino Plus with 869 compact samplechanger, Metrohm, Herisau, Switzerland).Fruit organic acids were extracted and measured
using an Agilent 7890A GC/5795C MS (Agilent Technol-ogy, Palo Alto, CA, USA) with the same configurationsand settings as described previously [24]. Metaboliteswere identified by comparing fragmentation patterns withthose in mass spectral libraries and quantified based onstandard curves for each metabolite and the internalstandard ribitol.
Bai et al. BMC Genomics (2015) 16:612 Page 2 of 16
RNA-seq library construction and data analysisFruit RNA isolation and RNA-seq library constructionwere performed as previously described [25]. Briefly, totalRNA was isolated from 3 g of ground fruit flesh tissuesand then treated with DNase I (amplification grade,Invitrogen/Life Technologies, Carlsbad, CA). For mRNAisolation and strand specific RNA-seq library construction,NEBNext Poly(A) mRNA Magnetic Isolation Module andNEBNext Ultra Directional RNA Library Prep Kit forIllumina (New England Biolabs, Ipswich, MA) were used.The mRNA was isolated from 5 μg of total RNA and wasfragmented at 94 °C for 10 min. The first strand cDNAwas reverse transcribed from the fragmented mRNA withdATP mix and second strand cDNA was synthesized fromthe first strand cDNA with dUTP mix. The resultingdouble strand cDNA was end-repaired, adaptor-ligatedand size-selected, and then followed by the USER enzymedigestion of the second strand cDNA. The intact modifiedfirst strand cDNA was PCR-enriched for 14–16 cycles toobtain the individual sequencing ready RNA-seq libraries.These libraries were multiplexed in equal amount forsingle end 100-base sequencing in three lanes of HiSeq2000 (Illumina, San Diego, CA) at the Cornell UniversityBiotechnology Resource Center (Ithaca, NY). The tenapple varieties were sequenced in three biological repli-cates with one replicate per lane.Illumina sequencing of the pooled RNA-seq libraries
generated 30 FASTQ files of sequences with a total of615.6 million raw reads (Additional file 2: Table S2).The raw reads were fed into Bowtie [28] to remove barcodes and adapters and then aligned to the rRNA refer-ence sequences allowing up to three mismatches, whichwere downloaded from the SILVA rRNA database (http://www.arb-silva.de) [29]. The rRNA depleted reads wereimported into CLC Genomics Workbench v6.5 (CLCBio,Cambridge, Massachusetts) to trim low quality reads and/or bases using the quality limit of 0.05 and the ambiguouslimit of 1. The resultant clean and high quality readswere mapped by CLC Genomics Workbench (using theminimum similarity fraction of 0.98, the minimumlength fraction of 0.8 and the maximum number of hitsof 10) against the improved apple reference transcrip-tome [25], which is available at URL http://www.rosa-ceae.org/species/malus/malus_x_domestica/CU_RNA_seq_genes of GDR [26]. In addition to 53,654 of the63,541 originally predicted genes or MDPs (the threeletters prefixing gene IDs in apple), the reference tran-scriptome includes 17,524 novel transcripts [25]. Forconvenience, these novel transcripts will be referred to‘genes’ and named ‘G######s’ as in ‘G101234’, and‘MDP0000’ (e.g. MDP0000252114) in the original geneIDs will be abbreviated to ‘M’ (e.g. M252114) hereafter.Gene expression levels were calculated and represented byreads per kilobase of exon model per million mapped
reads (RPKM) [12]. Genes of RPKM >0.3 were consideredexpressed according to a previous study [30].
Identification of fruit acidity associated genes (FAAGs)Fruit acidity associated genes (FAAGs) were defined forthose that were differentially expressed between genotypegroups Ma_ and mama and/or those that were expressedsimilarly as the guide gene Ma1. To identify differentiallyexpressed genes (DEGs) between the two genotype groups,the gene expression data RPKMs were subjected to Bag-gerly’s test [31]. To control the false discovery rate (FDR),the original P values in Baggerly’s test were adjusted formultiple testing using Benjamini-Hochberg correction [32].The cutoff for declaring a gene expressed differentially wasPFDR <0.05. However, any genes with an RPKM range <5 inthe 29 RNA seq samples were removed from the list. Toidentify genes expressed similarly as Ma1, two filterswere applied: 1) the mean difference in RPKM betweenthe two genotype groups was greater than ten (8.53 forMa1), and 2) the fold change in mean RPKM betweenthe two genotype groups was greater than 1.5 (1.69 forMa1). Genes passed both filters were considered ofsimilar expression as Ma1.
Inferring fruit acidity associated co-expression genenetwork modulesThe co-expression gene network modules (highly co-expressed clusters of genes) were inferred from the fruitacidity associated genes (FAAGs) using weighted geneco-expression network analysis (WGCNA), an R package[33]. Before network inferring, the expression data(RPKM) were normalized by square root transformation.The automatic one-step network construction and moduledetection method with default settings were used, whichinclude an unsigned type of topological overlap matrix(TOM), a power β of 6, a minimal module size of 30, anda branch merge cut height of 0.25. The module eigengene(the first principal component of a given module) valuewas calculated and used to test the association of moduleswith acidity in the ten genotypes of 29 samples. Genesignificance (GS, the correlation between gene expressionand acidity), total network connectivity (kTotal), and mod-ule membership (MM) that is also known as eigengene-based intramodular connectivity (kME), were calculatedfor each of the 1301 FAAGs in the ten modules. The mostsignificant module (Turquoise) was visualized usingCytoscape 3.1 [34] and were also analyzed using NetworkAnalyzer [35], a Cytoscape plugin.
Identification of regulator genesDetection of regulator genes was performed using Lemon-Tree software [36], which is an improved and ‘one-stopshop’ version of the stochastic Bayesian module networkalgorithm Learning Module Networks (LeMoNe), which
Bai et al. BMC Genomics (2015) 16:612 Page 3 of 16
requires run scripts on both MATLAB and Perl [37].Using expression data from the 1301 FAAGs, ten inde-pendent Gibbs sampler runs [38] were conducted withLemon-Tree. From these ten runs, we were able to gener-ate a single set of tight independent clusters, and thenselect 50 (Clusters 0–49) of at least ten genes per clusterfor testing 96 candidate regulators. The candidate regula-tors were genes annotated as transcription factors orsignal transducers in GO terms and/or MapMan (sub-)bins in the 1301 genes. We considered candidate regula-tors as regulators when their probabilistic (P.) scores asso-ciated with their assignment to any of the 50 tight clusterswere within top 1 %.
Functional annotation and enrichment analysis of WGCNAmodulesWe previously used both MapMan bins [39] and GeneOntology (GO) terms to annotate the improved applereference transcriptome [24, 25]. Briefly, for annotationwith MapMan (sub-) bins, several databases were BLAST-searched with the apple reference transcriptome of 71,178genes using Mercator, a web-based search tool [40]. Thesearched databases include: TAIR-Arabidopsis TAIRproteins (release 10), PPAP-SwissProt/UniProt PlantProteins, CHLAMY-JGI Chlamy release 4 Augustusmodels, ORYZA-TIGR5 rice proteins, KOG-Clusters oforthologous eucaryotic genes database, CDD- con-served domain database, and IPR-interpro scan. ForGO term annotations, relevant information for applegenes (MDPs) is available at GDR [26] and was directlyadapted. However, GO terms for the new transcripts[25] were obtained by BLAST2GO program [41] to-gether with BLASTx search against the NCBI ReferenceProteins database (cutoff E = 10−6). Enrichment analysesof the WGCNA modules were all conducted by hyper-geometric tests using CLC GW against the same back-ground of 39,679 expressed genes. The hypergeometrictest is similar to the unconditional GOstats test [42],and the cutoff for significant enrichment is PFDR<0.05.Depending upon actual test, the background wasdefined by 39,679 annotated genes in MapMan (sub-)bins, by 16,153 in GO biological process (BP), or by21,612 in GO molecular functions (MF).
qRT-PCR analysisqRT-PCR analyses were conducted with the same totalRNA samples (after DNase I treatment) used for the RNA-seq library construction. Two micrograms of total RNAwere reverse transcribed using the Superscript III RTmodule (Invitrogen/Life technology, Carlsbad, CA). Theresulting first strand cDNA was diluted by 5-fold and usedas templates for qRT-PCR analysis on a LightCycler 480(Roche, Indianapolis, IN), where an apple actin gene(EB136338) was served as reference. The primer sequences
for the reference gene and the eight target genes were listed(Additional file 3: Table S3). The actual qRT-PCR reactionsand subsequent expression analysis were conducted simi-larly as described previously [24].
Statistical analysesStatistical analyses, such as ANOVA, Student’s t test andTukey’s HSD (honest significant difference) test, wereperformed using JMP Pro10 (SAS, Cary, NC).
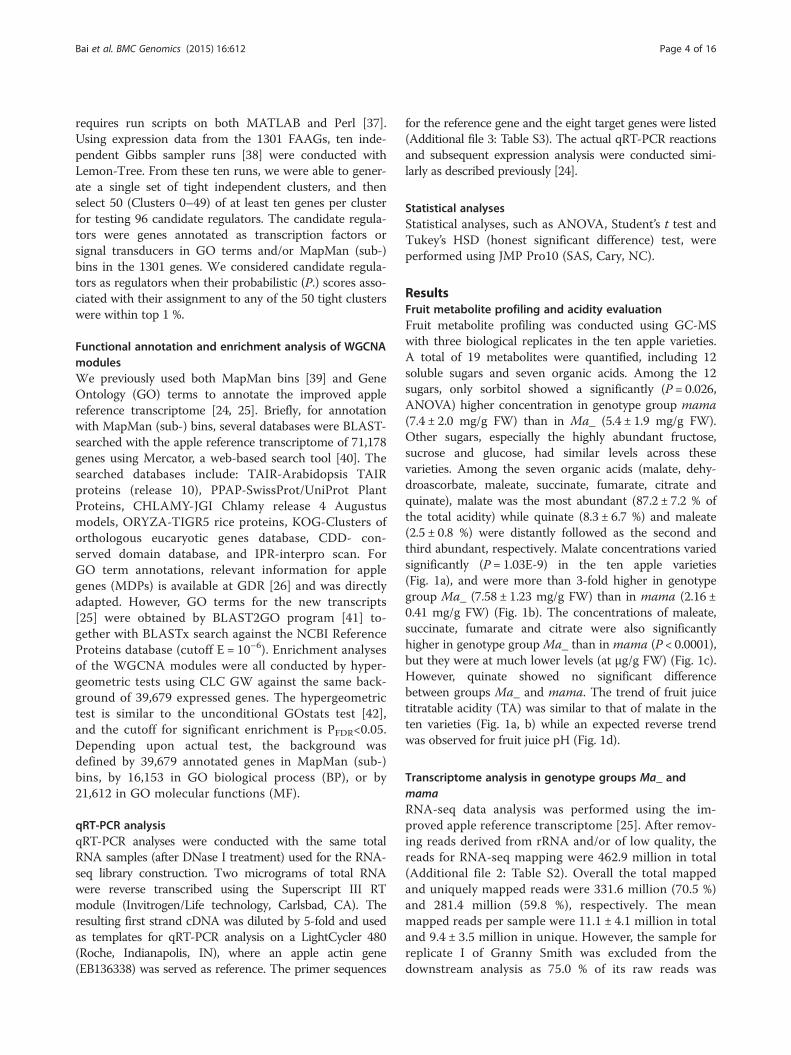
ResultsFruit metabolite profiling and acidity evaluationFruit metabolite profiling was conducted using GC-MSwith three biological replicates in the ten apple varieties.A total of 19 metabolites were quantified, including 12soluble sugars and seven organic acids. Among the 12sugars, only sorbitol showed a significantly (P = 0.026,ANOVA) higher concentration in genotype group mama(7.4 ± 2.0 mg/g FW) than in Ma_ (5.4 ± 1.9 mg/g FW).Other sugars, especially the highly abundant fructose,sucrose and glucose, had similar levels across thesevarieties. Among the seven organic acids (malate, dehy-droascorbate, maleate, succinate, fumarate, citrate andquinate), malate was the most abundant (87.2 ± 7.2 % ofthe total acidity) while quinate (8.3 ± 6.7 %) and maleate(2.5 ± 0.8 %) were distantly followed as the second andthird abundant, respectively. Malate concentrations variedsignificantly (P = 1.03E-9) in the ten apple varieties(Fig. 1a), and were more than 3-fold higher in genotypegroup Ma_ (7.58 ± 1.23 mg/g FW) than in mama (2.16 ±0.41 mg/g FW) (Fig. 1b). The concentrations of maleate,succinate, fumarate and citrate were also significantlyhigher in genotype group Ma_ than in mama (P < 0.0001),but they were at much lower levels (at μg/g FW) (Fig. 1c).However, quinate showed no significant differencebetween groups Ma_ and mama. The trend of fruit juicetitratable acidity (TA) was similar to that of malate in theten varieties (Fig. 1a, b) while an expected reverse trendwas observed for fruit juice pH (Fig. 1d).
Transcriptome analysis in genotype groups Ma_ andmamaRNA-seq data analysis was performed using the im-proved apple reference transcriptome [25]. After remov-ing reads derived from rRNA and/or of low quality, thereads for RNA-seq mapping were 462.9 million in total(Additional file 2: Table S2). Overall the total mappedand uniquely mapped reads were 331.6 million (70.5 %)and 281.4 million (59.8 %), respectively. The meanmapped reads per sample were 11.1 ± 4.1 million in totaland 9.4 ± 3.5 million in unique. However, the sample forreplicate I of Granny Smith was excluded from thedownstream analysis as 75.0 % of its raw reads was
Bai et al. BMC Genomics (2015) 16:612 Page 4 of 16
removed by the rRNA and quality filters (Additional file2: Table S2).The maximum number of expressed genes was 52,102 in
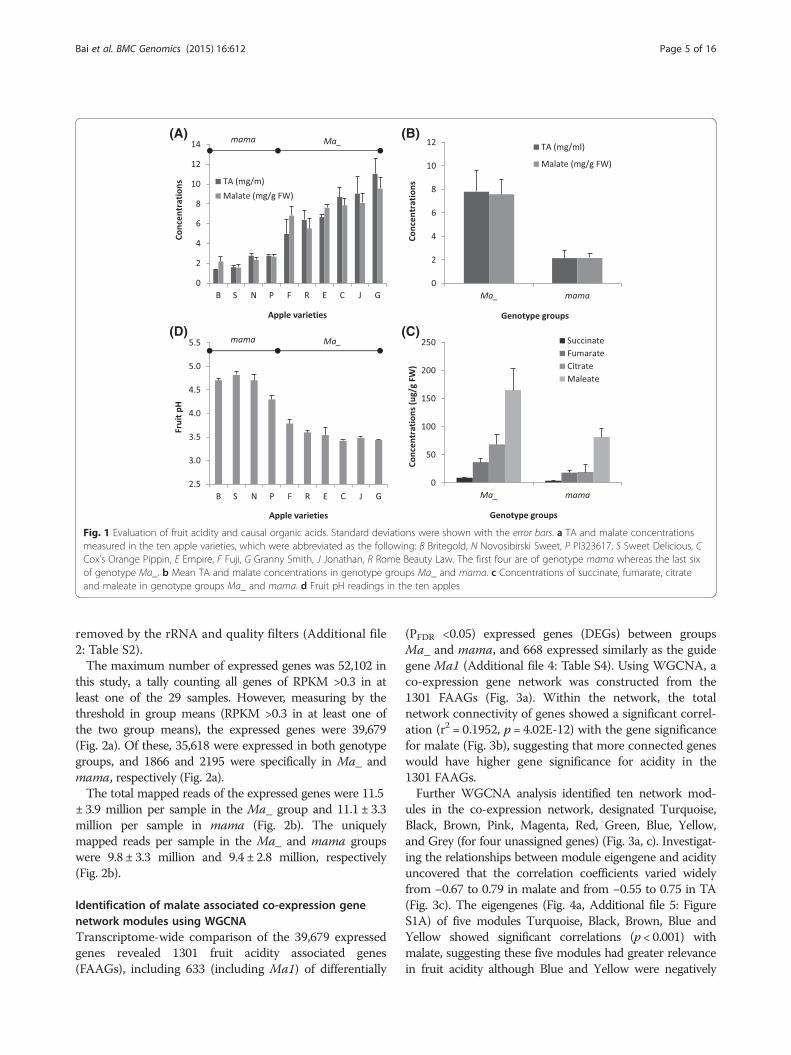
this study, a tally counting all genes of RPKM >0.3 in atleast one of the 29 samples. However, measuring by thethreshold in group means (RPKM >0.3 in at least one ofthe two group means), the expressed genes were 39,679(Fig. 2a). Of these, 35,618 were expressed in both genotypegroups, and 1866 and 2195 were specifically in Ma_ andmama, respectively (Fig. 2a).The total mapped reads of the expressed genes were 11.5
± 3.9 million per sample in the Ma_ group and 11.1 ± 3.3million per sample in mama (Fig. 2b). The uniquelymapped reads per sample in the Ma_ and mama groupswere 9.8 ± 3.3 million and 9.4 ± 2.8 million, respectively(Fig. 2b).
Identification of malate associated co-expression genenetwork modules using WGCNATranscriptome-wide comparison of the 39,679 expressedgenes revealed 1301 fruit acidity associated genes(FAAGs), including 633 (including Ma1) of differentially
(PFDR <0.05) expressed genes (DEGs) between groupsMa_ and mama, and 668 expressed similarly as the guidegene Ma1 (Additional file 4: Table S4). Using WGCNA, aco-expression gene network was constructed from the1301 FAAGs (Fig. 3a). Within the network, the totalnetwork connectivity of genes showed a significant correl-ation (r2 = 0.1952, p = 4.02E-12) with the gene significancefor malate (Fig. 3b), suggesting that more connected geneswould have higher gene significance for acidity in the1301 FAAGs.Further WGCNA analysis identified ten network mod-
ules in the co-expression network, designated Turquoise,Black, Brown, Pink, Magenta, Red, Green, Blue, Yellow,and Grey (for four unassigned genes) (Fig. 3a, c). Investigat-ing the relationships between module eigengene and acidityuncovered that the correlation coefficients varied widelyfrom −0.67 to 0.79 in malate and from −0.55 to 0.75 in TA(Fig. 3c). The eigengenes (Fig. 4a, Additional file 5: FigureS1A) of five modules Turquoise, Black, Brown, Blue andYellow showed significant correlations (p < 0.001) withmalate, suggesting these five modules had greater relevancein fruit acidity although Blue and Yellow were negatively
(A) (B)
(D) (C)
Fig. 1 Evaluation of fruit acidity and causal organic acids. Standard deviations were shown with the error bars. a TA and malate concentrationsmeasured in the ten apple varieties, which were abbreviated as the following: B Britegold, N Novosibirski Sweet, P PI323617, S Sweet Delicious, CCox’s Orange Pippin, E Empire, F Fuji, G Granny Smith, J Jonathan, R Rome Beauty Law. The first four are of genotype mama whereas the last sixof genotype Ma_. b Mean TA and malate concentrations in genotype groups Ma_ and mama. c Concentrations of succinate, fumarate, citrateand maleate in genotype groups Ma_ and mama. d Fruit pH readings in the ten apples
Bai et al. BMC Genomics (2015) 16:612 Page 5 of 16
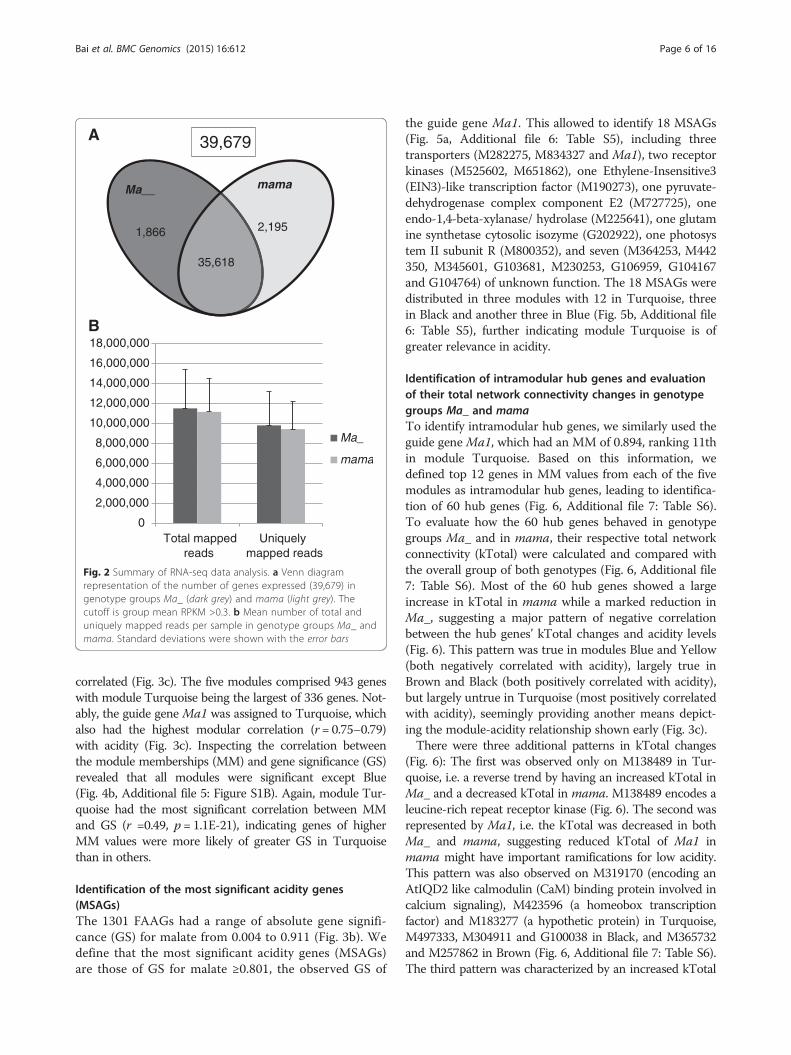
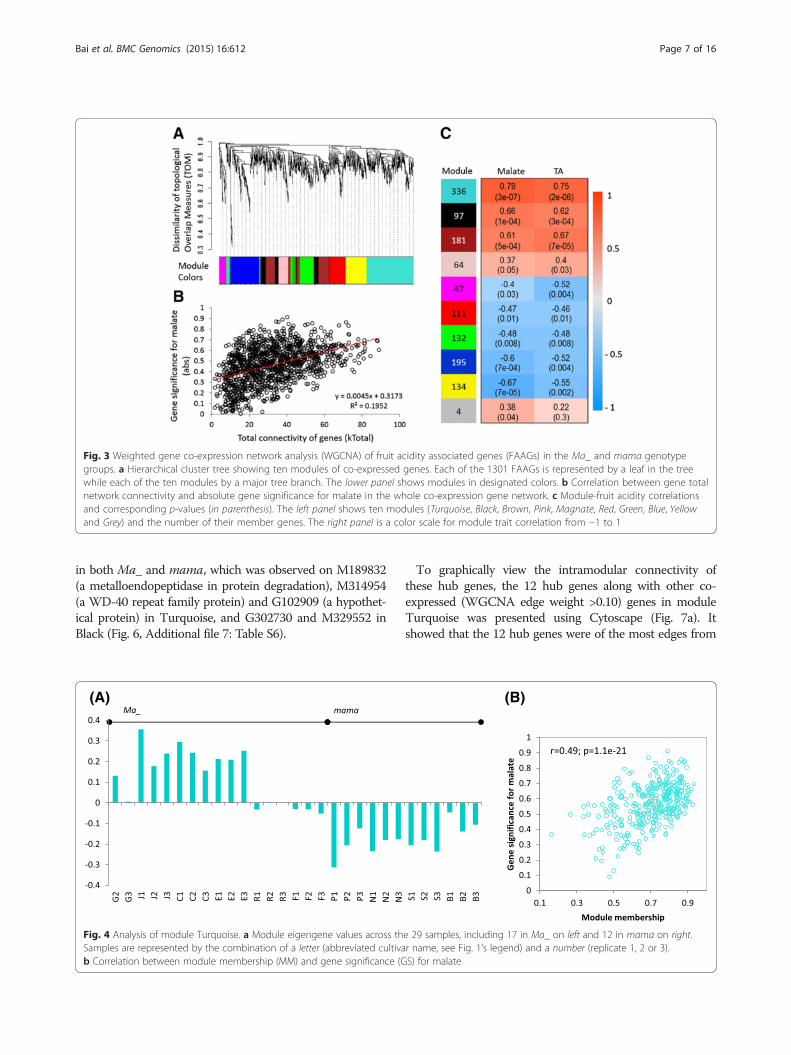
correlated (Fig. 3c). The five modules comprised 943 geneswith module Turquoise being the largest of 336 genes. Not-ably, the guide gene Ma1 was assigned to Turquoise, whichalso had the highest modular correlation (r = 0.75–0.79)with acidity (Fig. 3c). Inspecting the correlation betweenthe module memberships (MM) and gene significance (GS)revealed that all modules were significant except Blue(Fig. 4b, Additional file 5: Figure S1B). Again, module Tur-quoise had the most significant correlation between MMand GS (r =0.49, p = 1.1E-21), indicating genes of higherMM values were more likely of greater GS in Turquoisethan in others.
Identification of the most significant acidity genes(MSAGs)The 1301 FAAGs had a range of absolute gene signifi-cance (GS) for malate from 0.004 to 0.911 (Fig. 3b). Wedefine that the most significant acidity genes (MSAGs)are those of GS for malate ≥0.801, the observed GS of
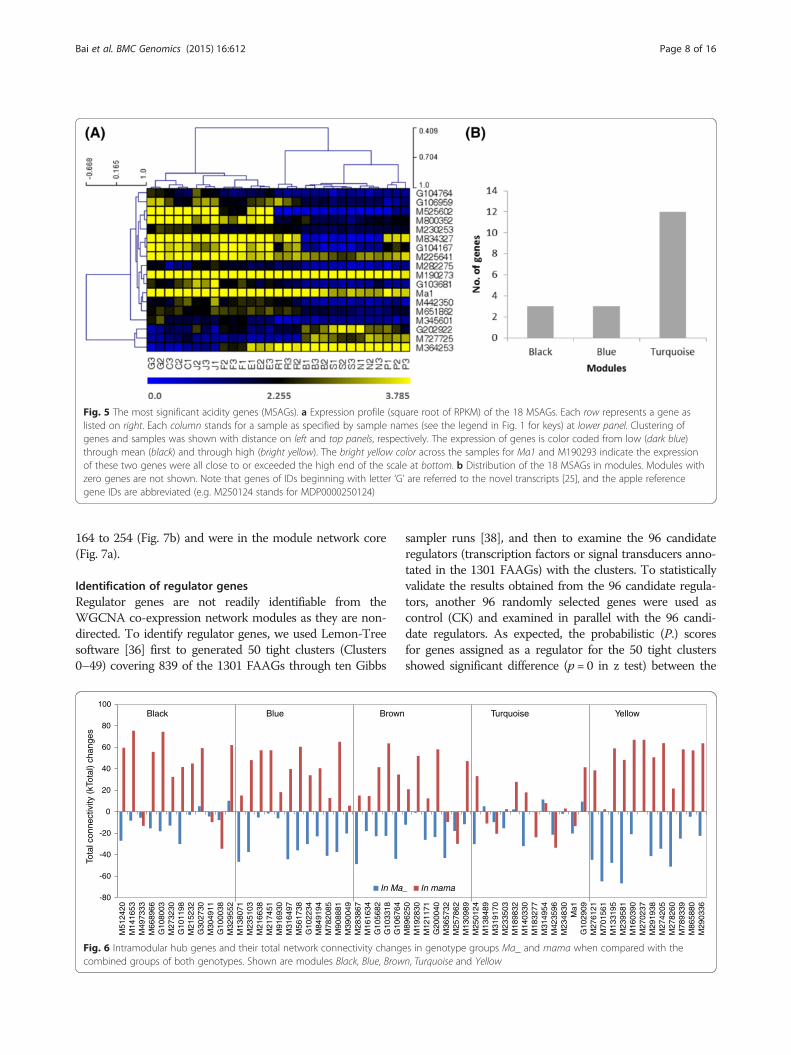
the guide gene Ma1. This allowed to identify 18 MSAGs(Fig. 5a, Additional file 6: Table S5), including threetransporters (M282275, M834327 and Ma1), two receptorkinases (M525602, M651862), one Ethylene-Insensitive3(EIN3)-like transcription factor (M190273), one pyruvate-dehydrogenase complex component E2 (M727725), oneendo-1,4-beta-xylanase/ hydrolase (M225641), one glutamine synthetase cytosolic isozyme (G202922), one photosystem II subunit R (M800352), and seven (M364253, M442350, M345601, G103681, M230253, G106959, G104167and G104764) of unknown function. The 18 MSAGs weredistributed in three modules with 12 in Turquoise, threein Black and another three in Blue (Fig. 5b, Additional file6: Table S5), further indicating module Turquoise is ofgreater relevance in acidity.
Identification of intramodular hub genes and evaluationof their total network connectivity changes in genotypegroups Ma_ and mamaTo identify intramodular hub genes, we similarly used theguide gene Ma1, which had an MM of 0.894, ranking 11thin module Turquoise. Based on this information, wedefined top 12 genes in MM values from each of the fivemodules as intramodular hub genes, leading to identifica-tion of 60 hub genes (Fig. 6, Additional file 7: Table S6).To evaluate how the 60 hub genes behaved in genotypegroups Ma_ and in mama, their respective total networkconnectivity (kTotal) were calculated and compared withthe overall group of both genotypes (Fig. 6, Additional file7: Table S6). Most of the 60 hub genes showed a largeincrease in kTotal in mama while a marked reduction inMa_, suggesting a major pattern of negative correlationbetween the hub genes’ kTotal changes and acidity levels(Fig. 6). This pattern was true in modules Blue and Yellow(both negatively correlated with acidity), largely true inBrown and Black (both positively correlated with acidity),but largely untrue in Turquoise (most positively correlatedwith acidity), seemingly providing another means depict-ing the module-acidity relationship shown early (Fig. 3c).There were three additional patterns in kTotal changes
(Fig. 6): The first was observed only on M138489 in Tur-quoise, i.e. a reverse trend by having an increased kTotal inMa_ and a decreased kTotal in mama. M138489 encodes aleucine-rich repeat receptor kinase (Fig. 6). The second wasrepresented by Ma1, i.e. the kTotal was decreased in bothMa_ and mama, suggesting reduced kTotal of Ma1 inmama might have important ramifications for low acidity.This pattern was also observed on M319170 (encoding anAtIQD2 like calmodulin (CaM) binding protein involved incalcium signaling), M423596 (a homeobox transcriptionfactor) and M183277 (a hypothetic protein) in Turquoise,M497333, M304911 and G100038 in Black, and M365732and M257862 in Brown (Fig. 6, Additional file 7: Table S6).The third pattern was characterized by an increased kTotal
35,618
2,1951,866
mamaMa__
0
2,000,000
4,000,000
6,000,000
8,000,000
10,000,000
12,000,000
14,000,000
16,000,000
18,000,000
Total mappedreads
Uniquelymapped reads
Ma_
mama
A
B
39,679
Fig. 2 Summary of RNA-seq data analysis. a Venn diagramrepresentation of the number of genes expressed (39,679) ingenotype groups Ma_ (dark grey) and mama (light grey). Thecutoff is group mean RPKM >0.3. b Mean number of total anduniquely mapped reads per sample in genotype groups Ma_ andmama. Standard deviations were shown with the error bars
Bai et al. BMC Genomics (2015) 16:612 Page 6 of 16
in both Ma_ and mama, which was observed on M189832(a metalloendopeptidase in protein degradation), M314954(a WD-40 repeat family protein) and G102909 (a hypothet-ical protein) in Turquoise, and G302730 and M329552 inBlack (Fig. 6, Additional file 7: Table S6).
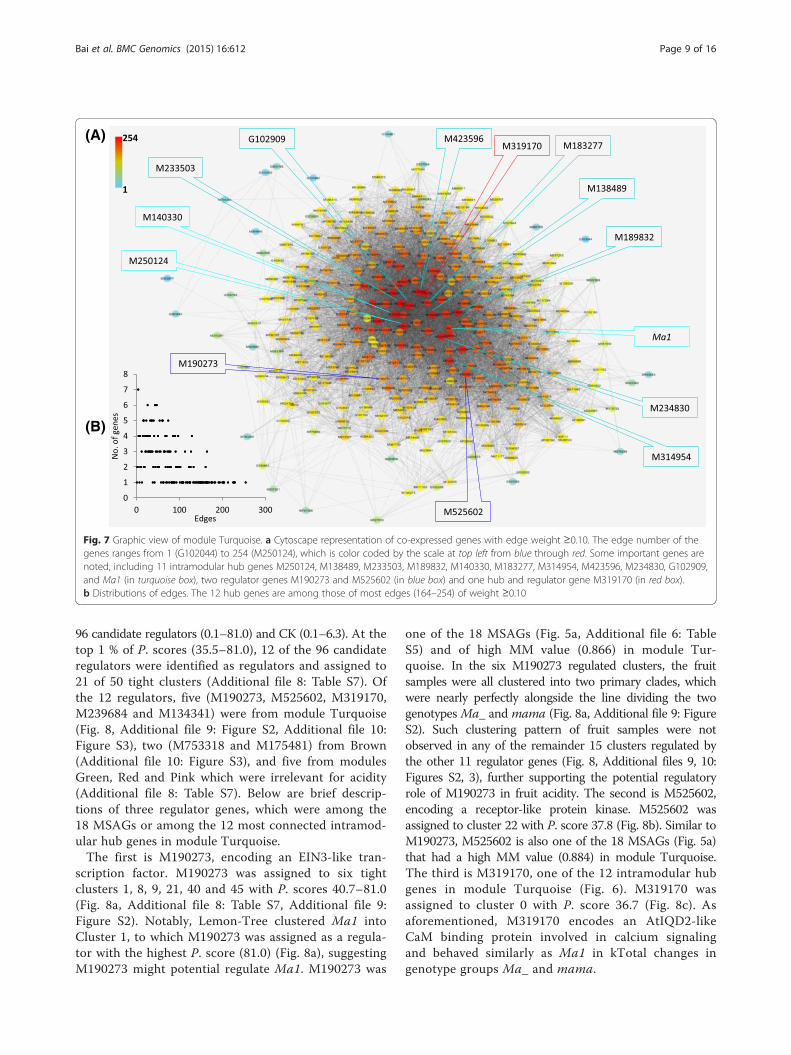
To graphically view the intramodular connectivity ofthese hub genes, the 12 hub genes along with other co-expressed (WGCNA edge weight >0.10) genes in moduleTurquoise was presented using Cytoscape (Fig. 7a). Itshowed that the 12 hub genes were of the most edges from
Fig. 3 Weighted gene co-expression network analysis (WGCNA) of fruit acidity associated genes (FAAGs) in the Ma_ and mama genotypegroups. a Hierarchical cluster tree showing ten modules of co-expressed genes. Each of the 1301 FAAGs is represented by a leaf in the treewhile each of the ten modules by a major tree branch. The lower panel shows modules in designated colors. b Correlation between gene totalnetwork connectivity and absolute gene significance for malate in the whole co-expression gene network. c Module-fruit acidity correlationsand corresponding p-values (in parenthesis). The left panel shows ten modules (Turquoise, Black, Brown, Pink, Magnate, Red, Green, Blue, Yellowand Grey) and the number of their member genes. The right panel is a color scale for module trait correlation from −1 to 1
(A) (B)
Fig. 4 Analysis of module Turquoise. a Module eigengene values across the 29 samples, including 17 in Ma_ on left and 12 in mama on right.Samples are represented by the combination of a letter (abbreviated cultivar name, see Fig. 1’s legend) and a number (replicate 1, 2 or 3).b Correlation between module membership (MM) and gene significance (GS) for malate
Bai et al. BMC Genomics (2015) 16:612 Page 7 of 16
164 to 254 (Fig. 7b) and were in the module network core(Fig. 7a).
Identification of regulator genesRegulator genes are not readily identifiable from theWGCNA co-expression network modules as they are non-directed. To identify regulator genes, we used Lemon-Treesoftware [36] first to generated 50 tight clusters (Clusters0–49) covering 839 of the 1301 FAAGs through ten Gibbs
sampler runs [38], and then to examine the 96 candidateregulators (transcription factors or signal transducers anno-tated in the 1301 FAAGs) with the clusters. To statisticallyvalidate the results obtained from the 96 candidate regula-tors, another 96 randomly selected genes were used ascontrol (CK) and examined in parallel with the 96 candi-date regulators. As expected, the probabilistic (P.) scoresfor genes assigned as a regulator for the 50 tight clustersshowed significant difference (p = 0 in z test) between the
Fig. 5 The most significant acidity genes (MSAGs). a Expression profile (square root of RPKM) of the 18 MSAGs. Each row represents a gene aslisted on right. Each column stands for a sample as specified by sample names (see the legend in Fig. 1 for keys) at lower panel. Clustering ofgenes and samples was shown with distance on left and top panels, respectively. The expression of genes is color coded from low (dark blue)through mean (black) and through high (bright yellow). The bright yellow color across the samples for Ma1 and M190293 indicate the expressionof these two genes were all close to or exceeded the high end of the scale at bottom. b Distribution of the 18 MSAGs in modules. Modules withzero genes are not shown. Note that genes of IDs beginning with letter ‘G’ are referred to the novel transcripts [25], and the apple referencegene IDs are abbreviated (e.g. M250124 stands for MDP0000250124)
-80
-60
-40
-20
0
20
40
60
80
100
M51
2420
M14
1653
M49
7333
M66
8966
G10
8003
M27
3230
G10
1198
M21
5232
G30
2730
M30
4911
G10
0038
M32
9552
M13
8071
M23
5103
M21
6638
M21
7451
M91
6930
M31
6497
M56
1738
G10
2234
M84
9194
M78
2085
M90
8881
M39
0049
M28
3867
M16
1634
G10
5682
G10
3318
G10
6764
M89
6250
M19
2830
M12
1171
G20
0040
M36
5732
M25
7862
M13
0989
M25
0124
M13
8489
M31
9170
M23
3503
M18
9832
M14
0330
M18
3277
M31
4954
M42
3596
M23
4830
Ma1
G10
2909
M27
6121
M70
1561
M13
3195
M23
9581
M16
0390
M27
0237
M29
1938
M27
4205
M27
8260
M78
9339
M86
5880
M29
0336
Tota
l con
nect
ivity
(kT
otal
) ch
ange
s
In Ma_ In mama
Black Blue Brown Turquoise Yellow
Fig. 6 Intramodular hub genes and their total network connectivity changes in genotype groups Ma_ and mama when compared with thecombined groups of both genotypes. Shown are modules Black, Blue, Brown, Turquoise and Yellow
Bai et al. BMC Genomics (2015) 16:612 Page 8 of 16
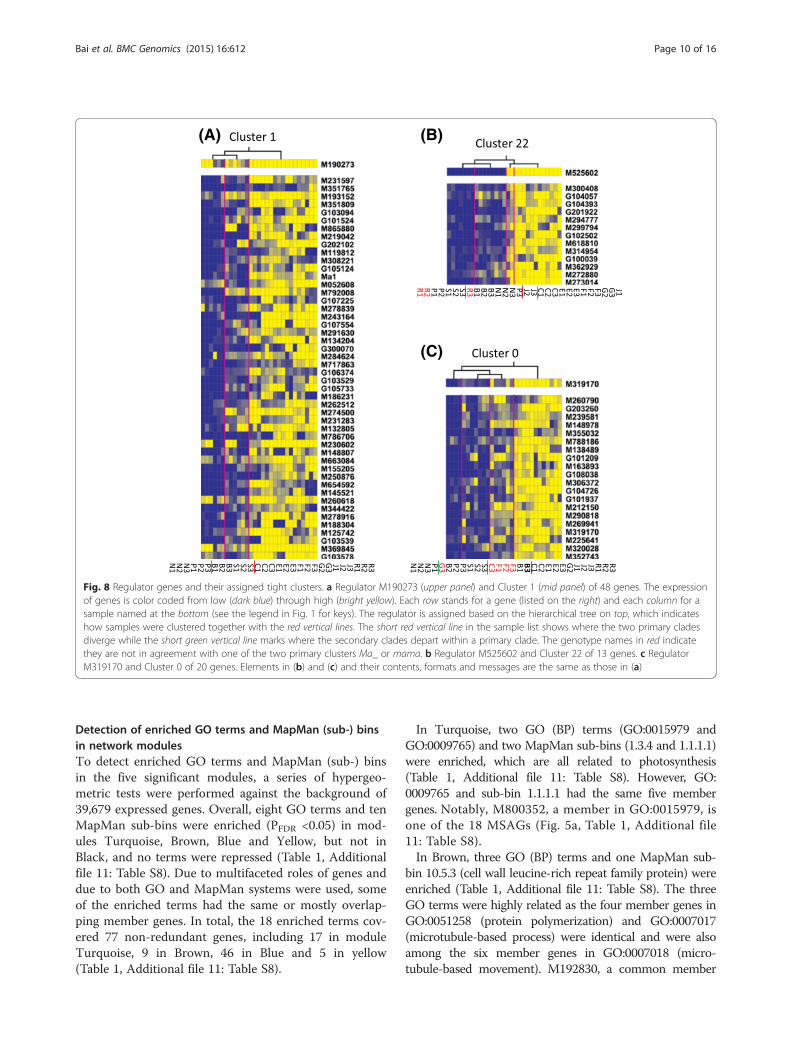
96 candidate regulators (0.1–81.0) and CK (0.1–6.3). At thetop 1 % of P. scores (35.5–81.0), 12 of the 96 candidateregulators were identified as regulators and assigned to21 of 50 tight clusters (Additional file 8: Table S7). Ofthe 12 regulators, five (M190273, M525602, M319170,M239684 and M134341) were from module Turquoise(Fig. 8, Additional file 9: Figure S2, Additional file 10:Figure S3), two (M753318 and M175481) from Brown(Additional file 10: Figure S3), and five from modulesGreen, Red and Pink which were irrelevant for acidity(Additional file 8: Table S7). Below are brief descrip-tions of three regulator genes, which were among the18 MSAGs or among the 12 most connected intramod-ular hub genes in module Turquoise.The first is M190273, encoding an EIN3-like tran-
scription factor. M190273 was assigned to six tightclusters 1, 8, 9, 21, 40 and 45 with P. scores 40.7–81.0(Fig. 8a, Additional file 8: Table S7, Additional file 9:Figure S2). Notably, Lemon-Tree clustered Ma1 intoCluster 1, to which M190273 was assigned as a regula-tor with the highest P. score (81.0) (Fig. 8a), suggestingM190273 might potential regulate Ma1. M190273 was
one of the 18 MSAGs (Fig. 5a, Additional file 6: TableS5) and of high MM value (0.866) in module Tur-quoise. In the six M190273 regulated clusters, the fruitsamples were all clustered into two primary clades, whichwere nearly perfectly alongside the line dividing the twogenotypes Ma_ and mama (Fig. 8a, Additional file 9: FigureS2). Such clustering pattern of fruit samples were notobserved in any of the remainder 15 clusters regulated bythe other 11 regulator genes (Fig. 8, Additional files 9, 10:Figures S2, 3), further supporting the potential regulatoryrole of M190273 in fruit acidity. The second is M525602,encoding a receptor-like protein kinase. M525602 wasassigned to cluster 22 with P. score 37.8 (Fig. 8b). Similar toM190273, M525602 is also one of the 18 MSAGs (Fig. 5a)that had a high MM value (0.884) in module Turquoise.The third is M319170, one of the 12 intramodular hubgenes in module Turquoise (Fig. 6). M319170 wasassigned to cluster 0 with P. score 36.7 (Fig. 8c). Asaforementioned, M319170 encodes an AtIQD2-likeCaM binding protein involved in calcium signalingand behaved similarly as Ma1 in kTotal changes ingenotype groups Ma_ and mama.
(A)
(B)
Fig. 7 Graphic view of module Turquoise. a Cytoscape representation of co-expressed genes with edge weight ≥0.10. The edge number of thegenes ranges from 1 (G102044) to 254 (M250124), which is color coded by the scale at top left from blue through red. Some important genes arenoted, including 11 intramodular hub genes M250124, M138489, M233503, M189832, M140330, M183277, M314954, M423596, M234830, G102909,and Ma1 (in turquoise box), two regulator genes M190273 and M525602 (in blue box) and one hub and regulator gene M319170 (in red box).b Distributions of edges. The 12 hub genes are among those of most edges (164–254) of weight ≥0.10
Bai et al. BMC Genomics (2015) 16:612 Page 9 of 16
Detection of enriched GO terms and MapMan (sub-) binsin network modulesTo detect enriched GO terms and MapMan (sub-) binsin the five significant modules, a series of hypergeo-metric tests were performed against the background of39,679 expressed genes. Overall, eight GO terms and tenMapMan sub-bins were enriched (PFDR <0.05) in mod-ules Turquoise, Brown, Blue and Yellow, but not inBlack, and no terms were repressed (Table 1, Additionalfile 11: Table S8). Due to multifaceted roles of genes anddue to both GO and MapMan systems were used, someof the enriched terms had the same or mostly overlap-ping member genes. In total, the 18 enriched terms cov-ered 77 non-redundant genes, including 17 in moduleTurquoise, 9 in Brown, 46 in Blue and 5 in yellow(Table 1, Additional file 11: Table S8).
In Turquoise, two GO (BP) terms (GO:0015979 andGO:0009765) and two MapMan sub-bins (1.3.4 and 1.1.1.1)were enriched, which are all related to photosynthesis(Table 1, Additional file 11: Table S8). However, GO:0009765 and sub-bin 1.1.1.1 had the same five membergenes. Notably, M800352, a member in GO:0015979, isone of the 18 MSAGs (Fig. 5a, Table 1, Additional file11: Table S8).In Brown, three GO (BP) terms and one MapMan sub-
bin 10.5.3 (cell wall leucine-rich repeat family protein) wereenriched (Table 1, Additional file 11: Table S8). The threeGO terms were highly related as the four member genes inGO:0051258 (protein polymerization) and GO:0007017(microtubule-based process) were identical and were alsoamong the six member genes in GO:0007018 (micro-tubule-based movement). M192830, a common member
(A) (B)
(C)
Fig. 8 Regulator genes and their assigned tight clusters. a Regulator M190273 (upper panel) and Cluster 1 (mid panel) of 48 genes. The expressionof genes is color coded from low (dark blue) through high (bright yellow). Each row stands for a gene (listed on the right) and each column for asample named at the bottom (see the legend in Fig. 1 for keys). The regulator is assigned based on the hierarchical tree on top, which indicateshow samples were clustered together with the red vertical lines. The short red vertical line in the sample list shows where the two primary cladesdiverge while the short green vertical line marks where the secondary clades depart within a primary clade. The genotype names in red indicatethey are not in agreement with one of the two primary clusters Ma_ or mama. b Regulator M525602 and Cluster 22 of 13 genes. c RegulatorM319170 and Cluster 0 of 20 genes. Elements in (b) and (c) and their contents, formats and messages are the same as those in (a)
Bai et al. BMC Genomics (2015) 16:612 Page 10 of 16
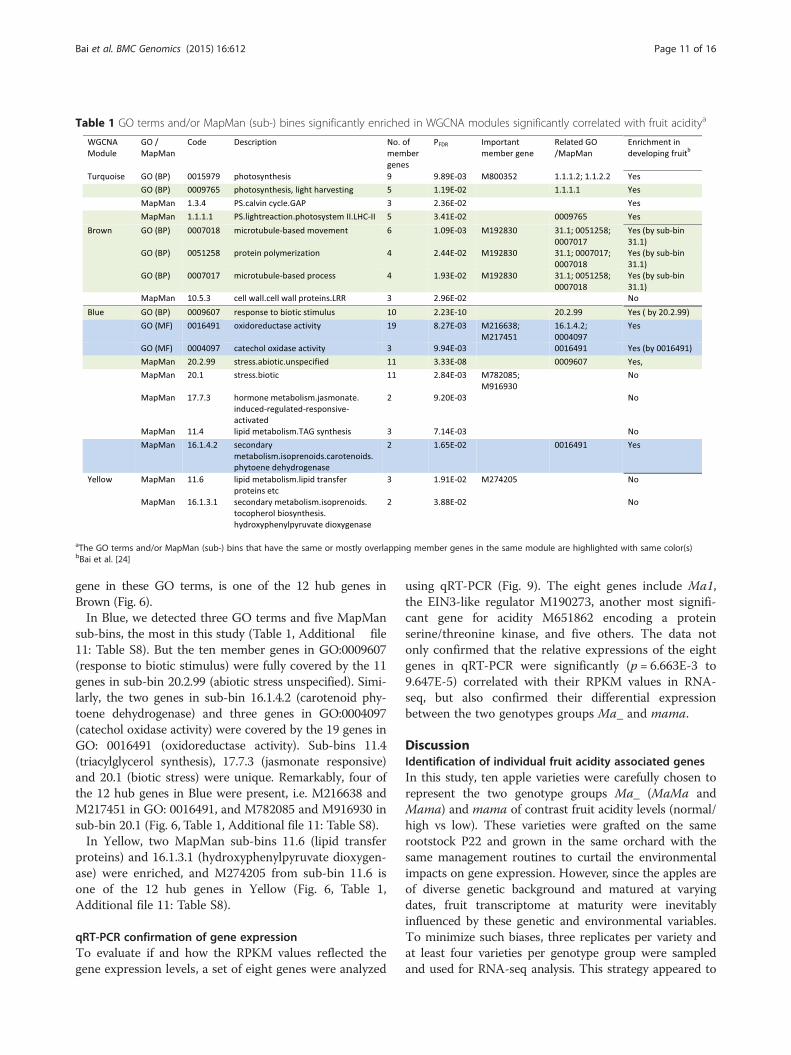
gene in these GO terms, is one of the 12 hub genes inBrown (Fig. 6).In Blue, we detected three GO terms and five MapMan
sub-bins, the most in this study (Table 1, Additional file11: Table S8). But the ten member genes in GO:0009607(response to biotic stimulus) were fully covered by the 11genes in sub-bin 20.2.99 (abiotic stress unspecified). Simi-larly, the two genes in sub-bin 16.1.4.2 (carotenoid phy-toene dehydrogenase) and three genes in GO:0004097(catechol oxidase activity) were covered by the 19 genes inGO: 0016491 (oxidoreductase activity). Sub-bins 11.4(triacylglycerol synthesis), 17.7.3 (jasmonate responsive)and 20.1 (biotic stress) were unique. Remarkably, four ofthe 12 hub genes in Blue were present, i.e. M216638 andM217451 in GO: 0016491, and M782085 and M916930 insub-bin 20.1 (Fig. 6, Table 1, Additional file 11: Table S8).In Yellow, two MapMan sub-bins 11.6 (lipid transfer
proteins) and 16.1.3.1 (hydroxyphenylpyruvate dioxygen-ase) were enriched, and M274205 from sub-bin 11.6 isone of the 12 hub genes in Yellow (Fig. 6, Table 1,Additional file 11: Table S8).
qRT-PCR confirmation of gene expressionTo evaluate if and how the RPKM values reflected thegene expression levels, a set of eight genes were analyzed
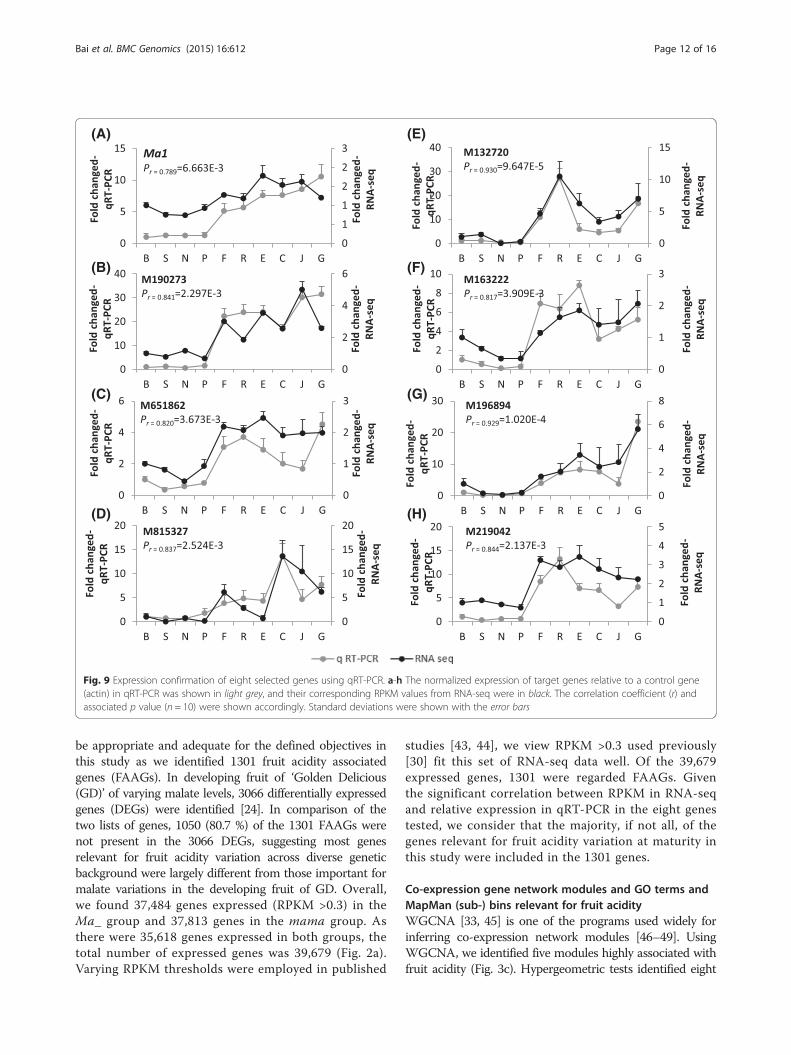
using qRT-PCR (Fig. 9). The eight genes include Ma1,the EIN3-like regulator M190273, another most signifi-cant gene for acidity M651862 encoding a proteinserine/threonine kinase, and five others. The data notonly confirmed that the relative expressions of the eightgenes in qRT-PCR were significantly (p = 6.663E-3 to9.647E-5) correlated with their RPKM values in RNA-seq, but also confirmed their differential expressionbetween the two genotypes groups Ma_ and mama.
DiscussionIdentification of individual fruit acidity associated genesIn this study, ten apple varieties were carefully chosen torepresent the two genotype groups Ma_ (MaMa andMama) and mama of contrast fruit acidity levels (normal/high vs low). These varieties were grafted on the samerootstock P22 and grown in the same orchard with thesame management routines to curtail the environmentalimpacts on gene expression. However, since the apples areof diverse genetic background and matured at varyingdates, fruit transcriptome at maturity were inevitablyinfluenced by these genetic and environmental variables.To minimize such biases, three replicates per variety andat least four varieties per genotype group were sampledand used for RNA-seq analysis. This strategy appeared to
Table 1 GO terms and/or MapMan (sub-) bines significantly enriched in WGCNA modules significantly correlated with fruit aciditya
aThe GO terms and/or MapMan (sub-) bins that have the same or mostly overlapping member genes in the same module are highlighted with same color(s)bBai et al. [24]
Bai et al. BMC Genomics (2015) 16:612 Page 11 of 16
be appropriate and adequate for the defined objectives inthis study as we identified 1301 fruit acidity associatedgenes (FAAGs). In developing fruit of ‘Golden Delicious(GD)’ of varying malate levels, 3066 differentially expressedgenes (DEGs) were identified [24]. In comparison of thetwo lists of genes, 1050 (80.7 %) of the 1301 FAAGs werenot present in the 3066 DEGs, suggesting most genesrelevant for fruit acidity variation across diverse geneticbackground were largely different from those important formalate variations in the developing fruit of GD. Overall,we found 37,484 genes expressed (RPKM >0.3) in theMa_ group and 37,813 genes in the mama group. Asthere were 35,618 genes expressed in both groups, thetotal number of expressed genes was 39,679 (Fig. 2a).Varying RPKM thresholds were employed in published
studies [43, 44], we view RPKM >0.3 used previously[30] fit this set of RNA-seq data well. Of the 39,679expressed genes, 1301 were regarded FAAGs. Giventhe significant correlation between RPKM in RNA-seqand relative expression in qRT-PCR in the eight genestested, we consider that the majority, if not all, of thegenes relevant for fruit acidity variation at maturity inthis study were included in the 1301 genes.
Co-expression gene network modules and GO terms andMapMan (sub-) bins relevant for fruit acidityWGCNA [33, 45] is one of the programs used widely forinferring co-expression network modules [46–49]. UsingWGCNA, we identified five modules highly associated withfruit acidity (Fig. 3c). Hypergeometric tests identified eight
(A) (E)
(B) (F)
(C) (G)
(D) (H)
Fig. 9 Expression confirmation of eight selected genes using qRT-PCR. a-h The normalized expression of target genes relative to a control gene(actin) in qRT-PCR was shown in light grey, and their corresponding RPKM values from RNA-seq were in black. The correlation coefficient (r) andassociated p value (n = 10) were shown accordingly. Standard deviations were shown with the error bars
Bai et al. BMC Genomics (2015) 16:612 Page 12 of 16
GO terms and ten MapMan (sub-) bins that were enrichedin four of the five modules (Table 1, Additional file 11:Table S8).In the most significant module Turquoise that in-
cludes Ma1, the two enriched GO terms and two Map-Man sub-bins are all related to photosynthesis (Table 1,Additional file 11: Table S8). In the developing fruit,the two GO terms and the two MapMan sub-bins werealso enriched [24], and 11 (64.7 %) of the 17 membergenes in the four enriched terms were identified in bothstudies (Table 1, Additional file 11: Table S8). Thissuggested that fruit photosynthesis could likely be apart of the mechanism for the contrast malate levelsbetween the two genotype groups at maturity. It wasproposed that the relative more active photosynthesisin young fruit may facilitate malate biosynthesis,thereby contributing to higher malate levels in youngfruit than in maturing fruit [24]. However, chloroplastsare only present in the hypodermal green tissues and theinner perivascular tissues in mature apple fruit, and are es-sentially absent in parenchyma cells that constitute themajor portion of flesh [50, 51]. How enhanced photosyn-thesis activities in a fraction of cells would lead to increasedoverall malate levels in fruit remains to be understood.In module Brown, the enrichment of MapMan sub-bin
10.5.3 (cell wall leucine-rich repeat family protein) wasunique to this study. However, the three enriched GOterms (GO:0007018, GO:0051258 and GO:0007017)were essentially a reflection of MapMan sub-bin 31.1(cell organization) (Table 1, Additional file 11: Table S8),which was enriched in negative malate dependent man-ner in developing fruit [24]. In module Blue, the enrich-ment of MapMan sub-bins 11.4 (triacylglycerol synthesis),17.7.3 (jasmonate responsive) and 20.1 (biotic stress) wereidentified in this study only. But GO:0016491 (oxidore-ductase activity), and MapMan sub-bins 20.2.99 (abioticstress unspecified) and 16.1.4.2 (carotenoid phytoenedehydrogenases) were also enriched in developing fruit[24]. In module Yellow, the enrichment of two MapMansub-bins 11.6 (lipid transfer proteins) and 16.1.3.1 (hydro-xyphenylpyruvate dioxygenases) was unique in thesediverse mature fruit.Overall, 12 enriched terms (covering 53 of the 77 genes),
including four from Turquoise (17 genes), three fromBrown (6 genes), and five from Blue (30 genes), were alsoenriched in developing fruit of ‘Golden Delicious’ [24],whereas the remainder six terms (covering 24 of the 77genes) were enriched specifically in this study (Table 1,Additional file 11: Table S8). This suggested that commonand unique processes relevant for malate variations in boththe diverse mature fruit and the developing fruit of ‘GoldenDelicious’ exist. However, 27 of the 30 genes in Blue and allof the six genes in Brown were not found to be relevant indeveloping fruit although 11 of the 17 genes related to
photosynthesis in Turquoise were (Table 1, Additional file11: Table S8), suggesting the common processes may oper-ate but most likely with their unique gene sets.
Transcriptional regulation of fruit acidity mediated byMa1In an ongoing survey of the USDA Malus repository atGeneva, New York, we identified 40 diverse apple acces-sions of genotype ma1ma1 using marker CAPS1455 thatcan detect the stop codon leading SNP in ma1 [10] andfound that each of them had fruit pH >4.0 (Xu, unpub-lished data), a typical low fruit acidity characteristic ingenotype group mama. These data, together with theprevious studies [4, 10, 11], suggested us that Ma1, amember of the ALMT1 gene family [52], is the geneticdeterminant underlying the Ma locus controlling aciditylevels in mature apple fruit although the functional geneticcomplementation data are not available.Ma1 is thought to exert its effect on fruit acidity by both
the truncation leading mutation and expression levels,where the mutation plays greater role [10]. In this study,Ma1 showed not only high gene significance for malate(Fig. 5a), but also high intramodular connectivity in mod-ule Turquoise (Figs. 6, 7), further supporting this notion.However, in our previous effort to understand the devel-opmental regulation of malate levels in the developingfruit of ‘Golden Delicious’, Ma1 was not present in themajor co-expression gene network due to its less signifi-cant (p = 0.03) correlation with malate although theinvolvement of Ma1 was clear [24]. This is likely causedby the fact that the study focused on developing fruit of asingle variety (‘Golden Delicious’) of genotype Mama thathad malate levels equivalent to the normal to high acidityrange during fruit development, i.e. the truncation muta-tion effect of Ma1 for low acidity in genotype groupmama was absent.The current models accounting for the ALMT1
mediated plant tolerance to soil aluminum toxicity inArabidopsis and rice comprise several common ele-ments [53, 54]. These elements include environmentalstimuli (Al3+/H+), a receptor (unknown) on the plasmamembrane that interacts with Al3+/H+ to initiate asignal transduction pathway (unknown), transcriptionfactors (STOP1 in Arabidopsis and ART1 in rice, bothof which are C2H2 zinc finger transcription factors, i.e.TFs), protein kinase (unknown) activating the TFs byphosphorylation, and responsive genes ALMT1, ABCtransporters (ASL1, ASL3, STAR1) and others [53, 54].In the developing fruit of GD, several groups of genesfunctionally similar to these elements were co-enriched orco-suppressed in a malate dependent manner, including14 C2H2 transcriptional factors, 27 protein kinases, and 23receptor kinases for signaling [24]. In addition, G105811,one of 14 C2H2 transcription factors, was annotated as a
Bai et al. BMC Genomics (2015) 16:612 Page 13 of 16
STOP1-like protein by Mercator [40]. These had led to aspeculation that a similar transcriptional regulation modelfor malate in developing fruit may exist although ALMT1targets plasma membrane [24].In this study, some of these functionally similar com-
ponents were also identified. For example, within the18 MSAGs, we see M525602 encoding a leucine-richrepeat (LLR) transmembrane receptor protein kinasefor signaling, M651862 a protein serine/threonine kin-ase, M282275 an ABC transporter, and of cause Ma1an ALMT1 like malate transporter (Fig. 5a). Interest-ingly, Lemon-Tree based regulator analysis identifiedthe LLR receptor kinase encoding gene M525602 as aregulator of Cluster 22 of 13 genes (Fig. 8b). Moreover,M250124, the most intramodular connected gene inmodule Turquoise (Fig. 6), encodes a protein kinase.These data suggested that the ALMT1 mediated planttolerance models somewhat be plausible for the tran-scriptional regulation of fruit acidity. However, thisstudy identified only one C2H2 zinc finger TF (M302279)in the 1301 FAAGs assigned to module Red not highlycorrelated with acidity. There is no evidence for C2H2 zincfinger TFs being part of the transcriptional regulation ofMa1 mediated fruit acidity.Identification of regulator M190273 by Lemon-Tree may
have suggested an emerging mechanism for fruit acidityregulatory network mediated by Ma1. Again, M190273 isone of the MSAGs (Fig. 5a) as well as a highly connectedgene in module Turquoise (Fig. 7). Lemon-Tree assignedM190273 as a regulator to six clusters of 183 genes in total,including Cluster 1 containing Ma1 (Fig. 8a), Cluster 40containing G104764 and M345601 (Additional file 9: FigureS2C), and Cluster 21 containing M651862 (Additional file9: Figure S2D), which are all among the 18 MSAGs (Fig. 5a).Although G104764 and M345601 are of unknown function,M651862 was speculated as a possible protein kinase com-ponent in the ALMT1 model aforementioned. Anotherrelevant observation is that samples in these six clusterswere all clustered alongside the line between the two geno-type groups Ma_ and mama, a pattern not observed forany other regulators, suggesting M190273 is likely a criticalregulator for fruit acidity. M190273 shows some sequencesimilarity to EIN3-like genes, which are transcription fac-tors important in ethylene response and signal transductionin plant [55, 56]. Previous studies documented that the rootgrowth inhibition by aluminum stress is mediated by ethyl-ene in bean [57], Lotus japonicus [58], and Arabidopsis is[59]. A more recent study reported that aluminum-induced malate efflux from wheat roots and tobaccocells transformed with TaALMT1 was negatively regu-lated by ethylene although the molecular mechanismsremain unknown [60]. These reports hint that it ispossible for M190273 to be a regulator of malate inapple fruit.
M319170, one of the 12 hub genes in module Turquoise(Fig. 6), is a regulator assigned to Cluster 0 containingM225641, one of the 18 MSAGs (Fig. 5a). M319170encodes a CaM binding protein similar to AtIQD2involved in calcium (Ca2+) signaling [61]. M140330, an-other hub gene of module Turquoise (Fig. 6), encodes aprotein similar to CaM-like3 (CML3) of role in calciumsignaling [62]. Among the 18 MSAGs (Fig. 5a), M834327encodes a calcium regulated channel similar to AtCNGC20. It has been demonstrated that AtCNGC20 is localizedto tonoplast [63] as well as plasma membrane [64], and tointeract with all CaM isoforms through its IQ domain[64]. In a study investigating carbohydrate metabolism intwo apple genotypes that sharply differ in malate accumu-lation in a way similar to those between the two genotypegroups Ma_ and mama found that calcium contents weresignificant higher in high acid fruit than in low acid fruit[65]. These observations suggested Ca2+ signaling mightalso be an important direction for better understandingthe regulation of malate levels in mature apple fruit. Inter-estingly, Ca2+ signals have also been considered one of thepossible signal transduction pathways for aluminum toler-ance lately [54].
ConclusionsThe most relevant finding of this study is the identifi-cation of a weighted gene co-expression networkanalysis (WGCNA) module (Turquoise) of 336 genesthat not only encompasses Ma1 but also shows thehighest modular correlation with acidity in maturefruit of diverse genetic background. Based on Lemon-Tree algorisms, MDP0000190273, which putatively en-codes an EIN3-like transcriptional factor, is likely themost important regulator of Ma1 and its mediatedgene network. The two gene ontology biologicalprocess terms (GO:0015979 and GO:0009765) and twoMapMap sub-bins (1.3.4 and 1.1.1.1) that were signifi-cantly enriched in module Turquoise implicated thatphotosynthesis related pathways are likely essential foracidity. Overall this study for the first time providesnot only important insight into the Ma1-mediatedgene network controlling acidity in mature apple fruitof diverse genetic background, but also relevant cluesfor future biological validation, including the three pu-tative regulators, MDP0000190273, MDP0000319170and MDP0000140330.
Supporting dataThe data sets supporting the results of this article areavailable in the NCBI Sequence Read Archive (SRA)repository (http://www.ncbi.nlm.nih.gov/Traces/sra/) under accession SRX673837.
Bai et al. BMC Genomics (2015) 16:612 Page 14 of 16
Additional files
Additional file 1: Table S1. Fruit harvest date and weight.(DOCX 29 kb)
Additional file 2: Table S2. Overview of RNA-seq reads mapping.(DOCX 31 kb)
Additional file 3: Table S3. List of primers used in qRT-PCR.(DOCX 29 kb)
Additional file 4: Table S4. List of the 1301 FAAGs and their RPKMvalues and assignment in WGCNA modules. (XLSX 550 kb)
Additional file 5: Figure S1. Analysis of modules Black, Brown, Blueand Yellow. (A) Module eigengene values across the 29 samples,including 17 in Ma_ on left and 12 in mama on right. Samples arerepresented by the combination of a letter (abbreviated cultivar name)and a number (replicate) (see legends in Fig. 1, 4 for keys). (B) Correlationbetween module membership (MM) and gene significance (GS) formalate. (PPTX 75 kb)
Additional file 6: Table S5. List of the most significant acidity genes(MSAGs). (DOCX 31 kb)
Additional file 7: Table S6. List of intramodular hub genes in moduleshighly associated with acidity. (XLSX 26 kb)
Additional file 8: Table S7. Regulator genes identified by Lemon-Tree.(DOCX 31 kb)
Additional file 9: Figure S2. Regulator M190273 and its other fiveassigned tight clusters. Elements and their contents, formats andmessages are same as those noted in Fig. 8a. (A) Cluster 8 of 31 genes.(B) Cluster 9 of 28 genes. (C) Cluster 40 of 55 genes. (D) Cluster 21 of 11genes. (E) Cluster 45 of 10 genes. (PPTX 238 kb)
Additional file 10: Figure S3. Other regulators from modulesTurquoise and Brown and their assigned tight clusters. Elements andtheir contents, formats and messages are same as those noted in Fig. 8a.(A) Regulator M239684 and Cluster 41 of 68 genes. (B) RegulatorM239684 and Cluster 5 of 14 genes. (C) Regulator M239684 and Cluster 7of 14 genes. (D) Regulator M753318 and Cluster 23 of 11 genes. (E)Regulator M753318 and Cluster 32 of 11 genes. (F) Regulator M175481and Cluster 2 of 16 genes. (G) Regulator M134341 and Cluster 42 of 12genes. (PPTX 213 kb)
Additional file 11: Table S8. Enriched gene ontology (GO) terms andMapMan (sub)-bins in WGCNA modules. (XLSX 16 kb)
AbbreviationsALMT1: Aluminum-activated Malate Transporter1; DEGs: Differentiallyexpressed genes; FAAGs: Fruit acidity associated genes; FDR: False discoveryrate; GD: Golden Delicious; Ma1: Malic acid1; MSAGs: Most significant aciditygenes; QTL: Quantities trait locus; RNA-seq: mRNA sequencing; RPKM: Readsper kilobase of exon model per million mapped reads; TA: Titratable acidity.
Competing interestsThe authors declare that they have no competing interests.
Authors’ contributionsYB and LD carried out fruit sampling, acidity and metabolite evaluation, RNAisolation and RNA-seq library construction and qPCR validation of RNA-Seq. LCand GZ participated in the design and coordination of the study. KX conceivedthe study. YB and KX analyzed the data and wrote the manuscript. All authorsread and approved the final manuscript.
AcknowledgementsWe thank Dr. Herb Aldwinckle for providing the fruit samples used in this studyand Dr. Zhangjun Fei for helpful discussions in RNA-seq data analyses. Thiswork was supported in part by the Agriculture and Food Research Initiativecompetitive grant no. 2014-67013-21660 of the USDA National Institute ofFood and Agriculture (NIFA).
Author details1Horticulture Section, School of Integrative Plant Science, Cornell University,New York State Agricultural Experiment Station, Geneva, NY 14456, USA.
2Horticulture Section, School of Integrative Plant Science, Cornell University,Ithaca, NY 14853, USA. 3USDA-ARS, Plant Genetic resource and Grape GeneticResearch Units, Geneva, NY 14456, USA.
Received: 21 March 2015 Accepted: 5 August 2015
References1. Zhang YZ, Li PM, Cheng LL. Developmental changes of carbohydrates,
organic acids, amino acids, and phenolic compounds in ‘Honeycrisp’ appleflesh. Food Chem. 2010;123(4):1013–8.
2. Yamaki S. Isolation of vacuoles from immature apple fruit flesh andcompartmentation of sugars, organic acids, phenolic compounds andamino acids. Plant Cell Physiol. 1984;25(1):151–66.
3. Hulme AC, Wooltorton LSC. The organic acid metabolism of apple fruits:changes in individual acids during growth on the tree. J Sci Food Agr.1957;8:117–22.
4. Xu K, Wang A, Brown S. Genetic characterization of the Ma locus with pHand titratable acidity in apple. Mol Breeding. 2012;30(2):899–912.
5. Maliepaard C, Alston FH, van Arkel G, Brown LM, Chevreau E, Dunemann F,et al. Aligning male and female linkage maps of apple (Malus pumila Mill)using multi-allelic markers. Theor Appl Genet. 1998;97(1–2):60–73.
6. Kenis K, Keulemans J, Davey M. Identification and stability of QTLs for fruitquality traits in apple. Tree Genet Genomes. 2008;4(4):647–61.
7. Liebhard R, Kellerhals M, Pfammatter W, Jertmini M, Gessler C. Mappingquantitative physiological traits in apple (Malus x domestica Borkh). PlantMol Biol. 2003;52(3):511–26.
8. Zhang Q, Ma B, Li H, Chang Y, Han Y, Li J, et al. Identification,characterization, and utilization of genome-wide simple sequence repeatsto identify a QTL for acidity in apple. BMC Genomics. 2012;13(1):537.
9. Kumar S, Chagne D, Bink MCAM, Volz RK, Whitworth C, Carlisle C. Genomicselection for fruit quality traits in apple (Malus x domestica Borkh). PLoSOne. 2012;7(5):e36674.
10. Bai Y, Dougherty L, Li M, Fazio G, Cheng L, Xu K. A natural mutation-ledtruncation in one of the two aluminum-activated malate transporter-likegenes at the Ma locus is associated with low fruit acidity in apple. MolGenet Genomics. 2012;287(8):663–78.
11. Khan S, Beekwilder J, Schaart J, Mumm R, Soriano J, Jacobsen E, et al.Differences in acidity of apples are probably mainly caused by a malic acidtransporter gene on LG16. Tree Genet Genomes. 2013;9:475–87.
12. Mortazavi A, Williams BA, McCue K, Schaeffer L, Wold B. Mapping andquantifying mammalian transcriptomes by RNA-Seq. Nat Methods.2008;5(7):621–8.
13. Wilhelm BT, Landry JR. RNA-Seq-quantitative measurement of expressionthrough massively parallel RNA-sequencing. Methods. 2009;48(3):249–57.
14. Lister R, O’Malley RC, Tonti-Filippini J, Gregory BD, Berry CC, Millar AH, et al.Highly integrated single-base resolution maps of the epigenome inArabidopsis. Cell. 2008;133(3):523–36.
15. Zenoni S, Ferrarini A, Giacomelli E, Xumerle L, Fasoli M, Malerba G, et al.Characterization of transcriptional complexity during berry development inVitis vinifera using RNA-Seq. Plant Physiol. 2010;152(4):1787–95.
16. Li P, Ponnala L, Gandotra N, Wang L, Si Y, Tausta SL, et al. Thedevelopmental dynamics of the maize leaf transcriptome. Nat Genet.2010;42(12):1060–7.
17. Zhang G, Guo G, Hu X, Zhang Y, Li Q, Li R, et al. Deep RNA sequencing atsingle base-pair resolution reveals high complexity of the ricetranscriptome. Genome Res. 2010;20(5):646–54.
18. Krost C, Petersen R, Lokan S, Brauksiepe B, Braun P, Schmidt E. Evaluation ofthe hormonal state of columnar apple trees (Malus x domestica) based onhigh throughput gene expression studies. Plant Mol Biol. 2013;81(3):211–20.
19. Krost C, Petersen R, Schmidt ER. The transcriptomes of columnar andstandard type apple trees (Malus x domestica)–a comparative study. Gene.2012;498(2):223–30.
20. Zhang Y, Zhu J, Dai H. Characterization of transcriptional differencesbetween columnar and standard apple trees using RNA-Seq. Plant Mol BiolReport. 2012;30(4):957–65.
21. Gapper NE, Rudell DR, Giovannoni JJ, Watkins CB. Biomarker developmentfor external CO2 injury prediction in apples through exploration of bothtranscriptome and DNA methylation changes. AoB Plants. 2013;5.
22. Xia R, Zhu H, An Y-Q, Beers E, Liu Z. Apple miRNAs and tasiRNAs with novelregulatory networks. Genome Biol. 2012;13(6):R47.
Bai et al. BMC Genomics (2015) 16:612 Page 15 of 16
23. Otto D, Petersen R, Brauksiepe B, Braun P, Schmidt E. The columnarmutation (“Co gene”) of apple (Malus × domestica) is associated with anintegration of a Gypsy-like retrotransposon. Mol Breeding. 2014;33:863–80.
24. Bai Y, Dougherty L, Cheng L, Xu K. A co-expression gene networkassociated with developmental regulation of apple fruit acidity. Mol GenetGenomics. 2015;290(4):1247–63.
25. Bai Y, Dougherty L, Xu K. Towards an improved apple referencetranscriptome using RNA-seq. Mol Genet Genomics. 2014;289(3):427–38.
26. Jung S, Ficklin SP, Lee T, Cheng C-H, Blenda A, Zheng P, et al. The GenomeDatabase for Rosaceae (GDR): year 10 update. Nucleic Acids Res.2014;42(D1):D1237–44.
27. Blanpied GD, Silsby KJ. Predicting harvest date windows for apples. In:Information bulletin 221. Ithaca, NY, USA: Cornell Cooperative Extension,Cornell University; 1992.
28. Langmead B, Trapnell C, Pop M, Salzberg SL. Ultrafast and memory-efficientalignment of short DNA sequences to the human genome. Genome Biol.2009;10(3):R25.
29. Quast C, Pruesse E, Yilmaz P, Gerken J, Schweer T, Yarza P, et al. The SILVAribosomal RNA gene database project: improved data processing and web-basedtools. Nucleic Acids Res. 2013;41(Database issue):D590–6.
30. Kang C, Darwish O, Geretz A, Shahan R, Alkharouf N, Liu Z. Genome-scaletranscriptomic insights into early-stage fruit development in woodlandstrawberry Fragaria vesca. Plant Cell. 2013;25(6):1960–78.
31. Baggerly KA, Deng L, Morris JS, Aldaz CM. Differential expression in SAGE:accounting for normal between-library variation. Bioinformatics.2003;19(12):1477–83.
32. Benjamini Y, Hochberg Y. Controlling the false discovery rate–a practicaland powerful approach to multiple testing. J R Stat Soc Ser B-Methodol.1995;57(1):289–300.
33. Langfelder P, Horvath S. WGCNA: an R package for weighted correlationnetwork analysis. BMC Bioinformatics. 2008;9(1):559.
34. Saito R, Smoot ME, Ono K, Ruscheinski J, Wang P-L, Lotia S, et al. A travelguide to Cytoscape plugins. Nat Meth. 2012;9(11):1069–76.
35. Assenov Y, Ramírez F, Schelhorn S-E, Lengauer T, Albrecht M. Computingtopological parameters of biological networks. Bioinformatics.2008;24(2):282–4.
36. Bonnet E, Calzone L, Michoel T. Integrative multi-omics module networkinference with Lemon-Tree. arXiv preprint. 2014;arXiv:14080472.
37. Joshi A, De Smet R, Marchal K, Van de Peer Y, Michoel T. Module networksrevisited: computational assessment and prioritization of model predictions.Bioinformatics. 2009;25(4):490–6.
38. Joshi A, Van de Peer Y, Michoel T. Analysis of a Gibbs sampler method formodel-based clustering of gene expression data. Bioinformatics.2008;24(2):176–83.
39. Thimm O, Blasing O, Gibon Y, Nagel A, Meyer S, Kruger P, et al. MAPMAN: auser-driven tool to display genomics data sets onto diagrams of metabolicpathways and other biological processes. Plant J. 2004;37(6):914–39.
40. Lohse M, Nagel A, Herter T, May P, Schroda M, Zrenner R, et al. Mercator: afast and simple web server for genome scale functional annotation of plantsequence data. Plant Cell Environ. 2014;37:1250–8.
41. Götz S, García-Gómez JM, Terol J, Williams TD, Nagaraj SH, Nueda MJ, et al.High-throughput functional annotation and data mining with the Blast2GOsuite. Nucleic Acids Res. 2008;36(10):3420–35.
42. Falcon S, Gentleman R. Using GOstats to test gene lists for GO termassociation. Bioinformatics. 2007;23(2):257–8.
43. Kellner R, Bhattacharyya A, Poppe S, Hsu TY, Brem RB, Stukenbrock EH.Expression profiling of the wheat pathogen Zymoseptoria tritici revealsgenomic patterns of transcription and host-specific regulatory programs.Genome Biol Evol. 2014;6(6):1353–65.
44. Bagnaresi P, Biselli C, Orrù L, Urso S, Crispino L, Abbruscato P, et al.Comparative transcriptome profiling of the early response to Magnaportheoryzae in durable resistant vs susceptible rice (Oryza sativa L.) genotypes.PLoS One. 2012;7(12):e51609.
45. Zhang B, Horvath S. A general framework for weighted gene co-expressionnetwork analysis. Stat Appl Genet Mol. 2005;4(1):17.
46. Wang YXR, Huang H. Review on statistical methods for gene networkreconstruction using expression data. J Theor Biol. 2014;362:53–61.
47. Kogelman LJ, Cirera S, Zhernakova DV, Fredholm M, Franke L, KadarmideenHN. Identification of co-expression gene networks, regulatory genes andpathways for obesity based on adipose tissue RNA sequencing in a porcinemodel. BMC Med Genomics. 2014;7(1):57.
48. Hollender CA, Kang C, Darwish O, Geretz A, Matthews BF, Slovin J, et al.Floral transcriptomes in woodland strawberry uncover developingreceptacle and anther gene networks. Plant Physiol. 2014;165(3):1062–75.
49. Miller JA, Ding S-L, Sunkin SM, Smith KA, Ng L, Szafer A, et al. Transcriptionallandscape of the prenatal human brain. Nature. 2014;508(7495):199–206.
50. Phan CT. All-granal chloroplasts of apple-fruit. In: Sybesma C, editor.Advances in photosynthesis research vol. 3. Netherlands: Springer; 1984.p. 63–6.
51. Blanke MM, Lenz F. Fruit photosynthesis. Plant Cell Environ. 1989;12(1):31–46.52. Barbier-Brygoo H, De Angeli A, Filleur S, Frachisse J-M, Gambale F, Thomine S,
et al. Anion channels/transporters in plants: from molecular bases to regulatorynetworks. Annu Rev Plant Biol. 2011;62(1):25–51.
53. Delhaize E, Ma JF, Ryan PR. Transcriptional regulation of aluminiumtolerance genes. Trends Plant Sci. 2012;17:341–8.
54. Liu J, Piñeros MA, Kochian LV. The role of aluminum sensing and signalingin plant aluminum resistance. J Integr Plant Biol. 2014;56(3):221–30.
55. Chao QM, Rothenberg M, Solano R, Roman G, Terzaghi W, Ecker JR.Activation of the ethylene gas response pathway in Arabidopsis by thenuclear protein ETHYLENE-INSENSITIVE3 and related proteins. Cell.1997;89(7):1133–44.
56. Stepanova AN, Alonso JM. Ethylene signaling and response: where differentregulatory modules meet. Curr Opin Plant Biol. 2009;12(5):548–55.
57. Massot N, Nicander B, Barcelo J, Poschenrieder C, Tillberg E. A rapid increasein cytokinin levels and enhanced ethylene evolution precede Al3+ −inducedinhibition of root growth in bean seedlings (Phaseolus vulgaris L). PlantGrowth Regul. 2002;37(2):105–12.
58. Sun P, Tian Q-Y, Zhao M-G, Dai X-Y, Huang J-H, Li L-H, et al. Aluminum-induced ethylene production is associated with inhibition of rootelongation in Lotus japonicus L. Plant Cell Physiol. 2007;48(8):1229–35.
59. Sun P, Tian Q-Y, Chen J, Zhang W-H. Aluminium-induced inhibition of rootelongation in Arabidopsis is mediated by ethylene and auxin. J Exp Bot.2010;61(2):347–56.
60. Tian Q, Zhang X, Ramesh S, Gilliham M, Tyerman SD, Zhang W-H. Ethylenenegatively regulates aluminium-induced malate efflux from wheat roots andtobacco cells transformed with TaALMT1. J Exp Bot. 2014;65(9):2415–26.
61. Abel S, Bürstenbinder K, Müller J. The emerging function of IQD proteins asscaffolds in cellular signaling and trafficking. Plant Signal Behav. 2013;8(6),e24369.
62. McCormack E, Tsai Y-C, Braam J. Handling calcium signaling: ArabidopsisCaMs and CMLs. Trends Plant Sci. 2005;10(8):383–9.
63. Yuen CCY, Christopher DA. The group IV-A cyclic nucleotide-gatedchannels, CNGC19 and CNGC20, localize to the vacuole membrane inArabidopsis thaliana. AoB Plants. 2013;5.
64. Fischer C, Kugler A, Hoth S, Dietrich P. An IQ domain mediates theinteraction with calmodulin in a plant cyclic nucleotide-gated channel.Plant Cell Physiol. 2013;54(4):573–84.
65. Beruter J. Carbohydrate metabolism in two apple genotypes that differ inmalate accumulation. J Plant Physiol. 2004;161(9):1011–29.
Submit your next manuscript to BioMed Centraland take full advantage of:
• Convenient online submission
• Thorough peer review
• No space constraints or color figure charges
• Immediate publication on acceptance
• Inclusion in PubMed, CAS, Scopus and Google Scholar
• Research which is freely available for redistribution
Submit your manuscript at www.biomedcentral.com/submit
Bai et al. BMC Genomics (2015) 16:612 Page 16 of 16