Embed Size (px)
Citation preview

Core Value Unconventional Gas
Production and Water Resources: Lessons
from the U.S.
Brisbane, Sydney
& Canberra, Australia
February 27 – March 1, 2012
Mark K. Boling
Executive Vice President & General Counsel
The Promise of Natural Gas
• The Environment
• The Economy
• Energy Security
• The Economy
• The Environment
• Energy Security
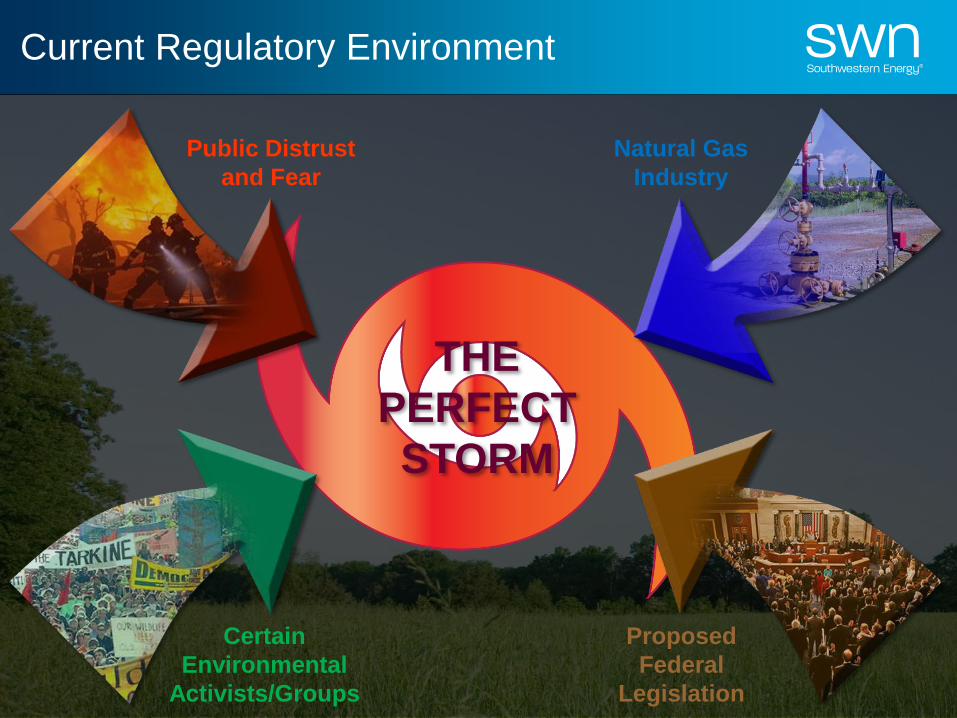
Current Regulatory Environment
Public Distrust
and Fear
Natural Gas
Industry
Certain
Environmental
Activists/Groups
Proposed
Federal
Legislation
THE
PERFECT
STORM
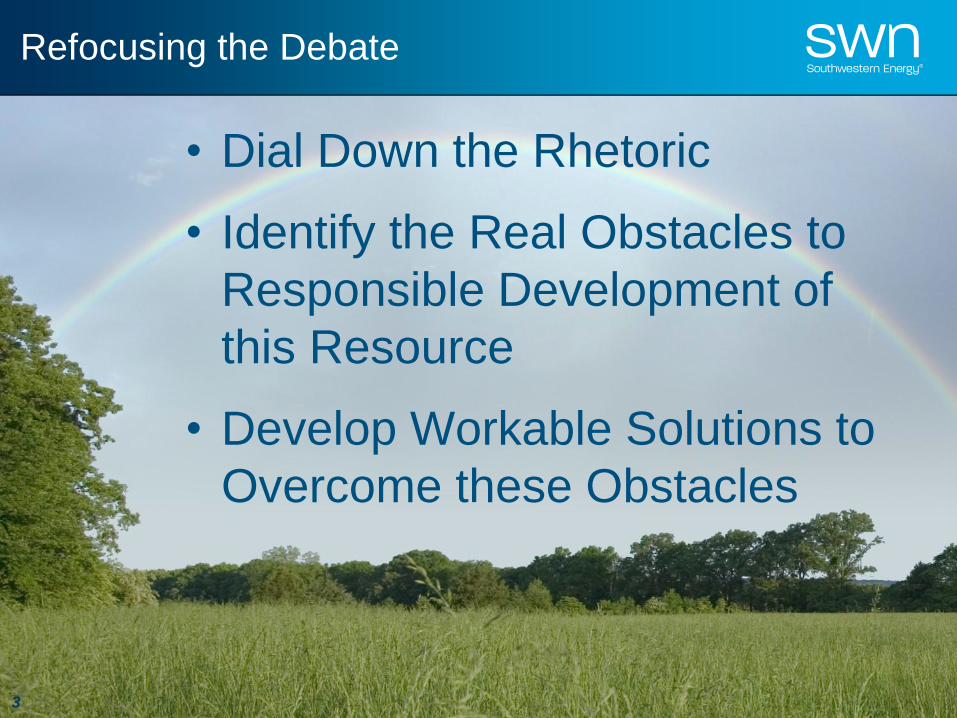
Refocusing the Debate
• Dial Down the Rhetoric
• Identify the Real Obstacles to
Responsible Development of
this Resource
• Develop Workable Solutions to
Overcome these Obstacles
3
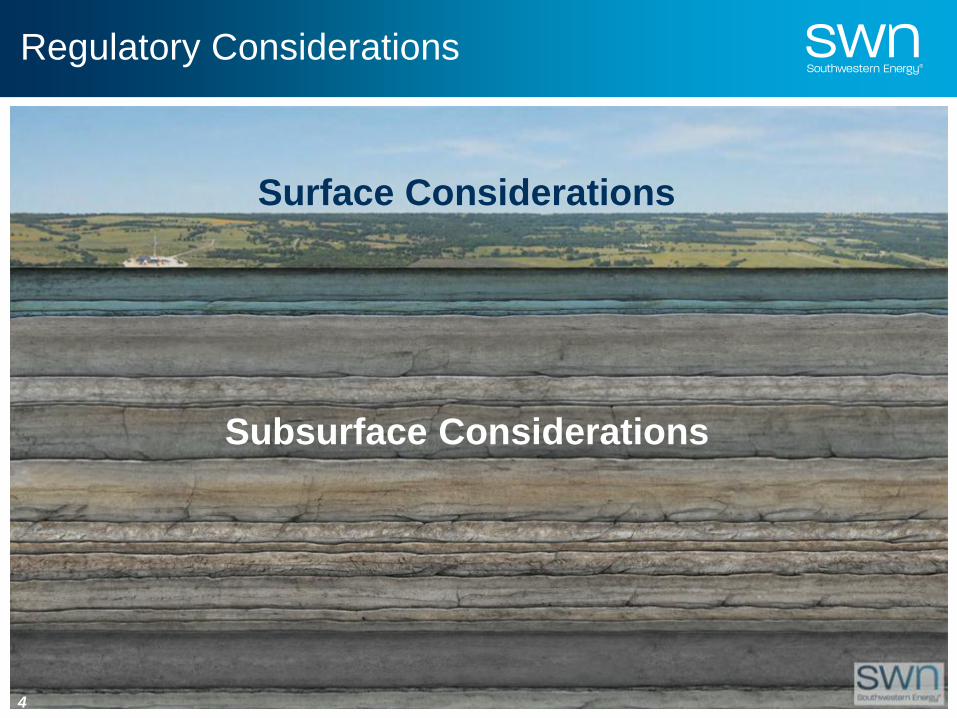
Regulatory Considerations
Surface Considerations
Subsurface Considerations
4
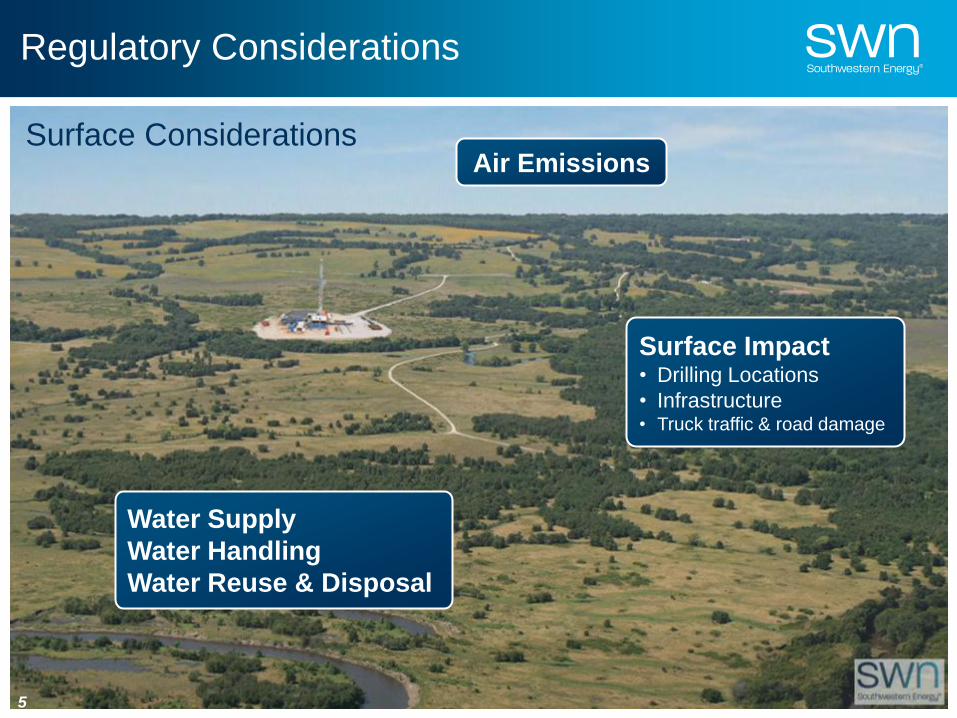
Regulatory Considerations
5
Air Emissions
Water Supply
Water Handling
Water Reuse & Disposal
Surface Considerations
Surface Impact • Drilling Locations
• Infrastructure • Truck traffic & road damage
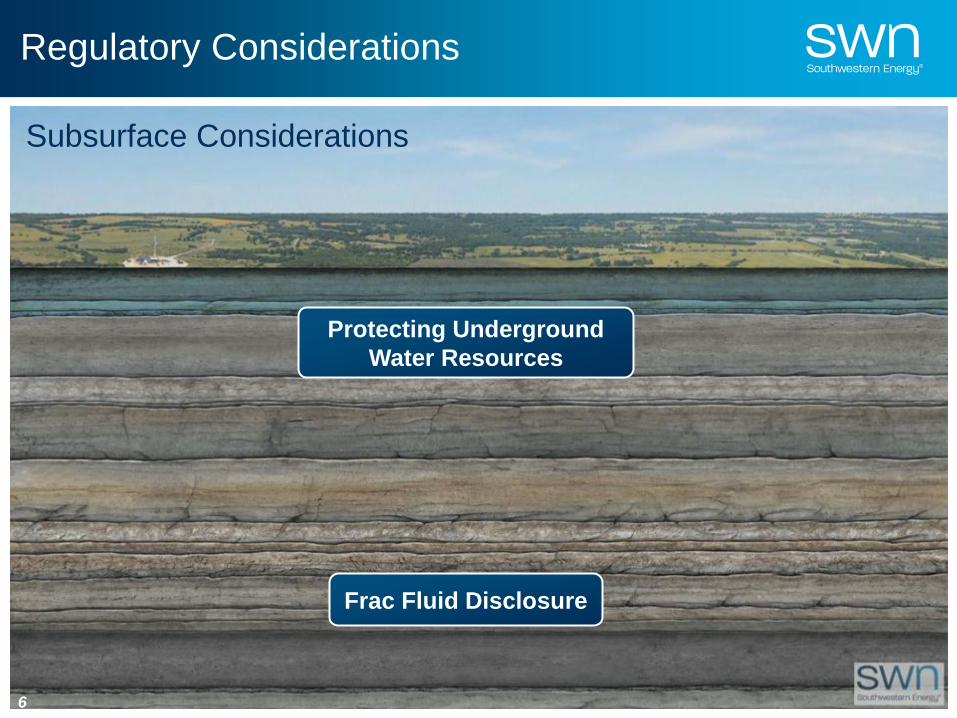
Regulatory Considerations
Protecting Underground
Water Resources
Frac Fluid Disclosure
Subsurface Considerations
6
7
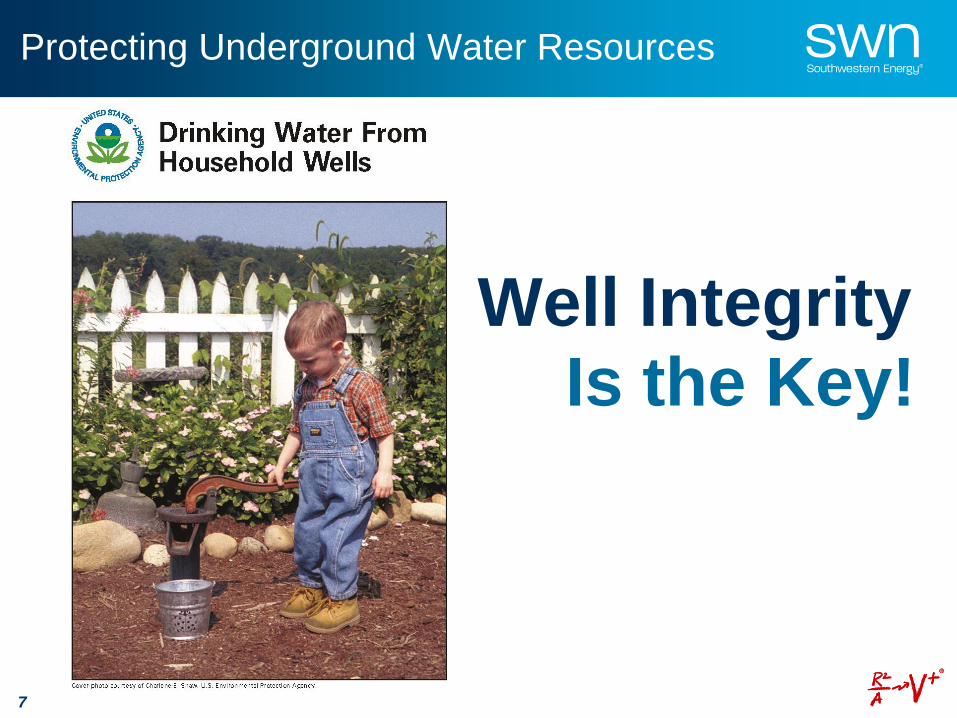
Protecting Underground Water Resources
Well Integrity
Is the Key!
8
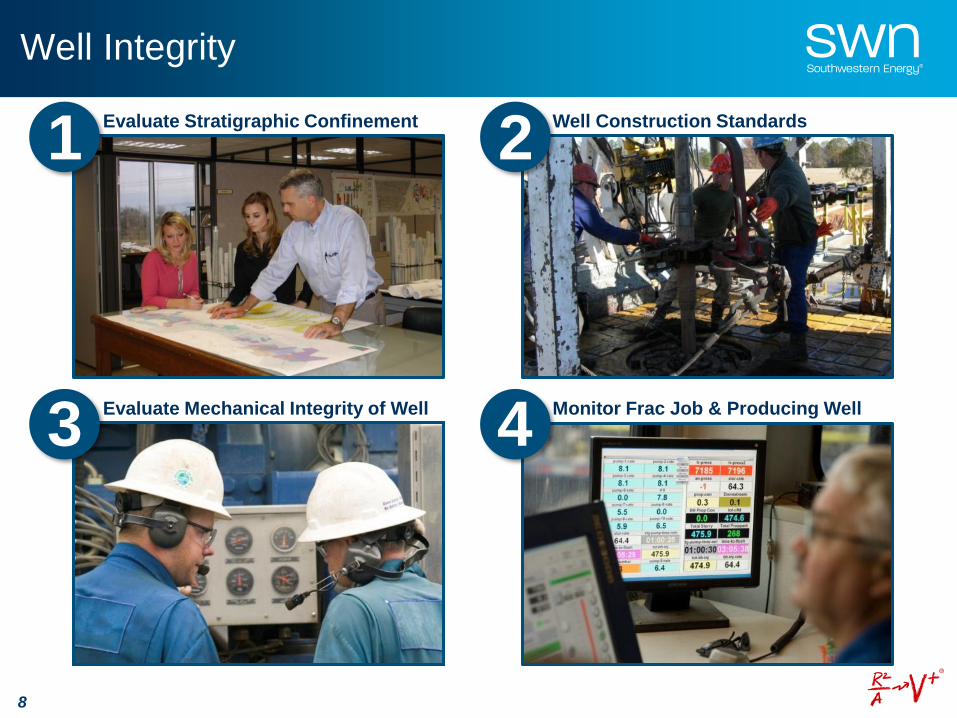
Well Integrity
Well Construction Standards
2 Evaluate Stratigraphic Confinement
1
Evaluate Mechanical Integrity of Well
3 Monitor Frac Job & Producing Well
4
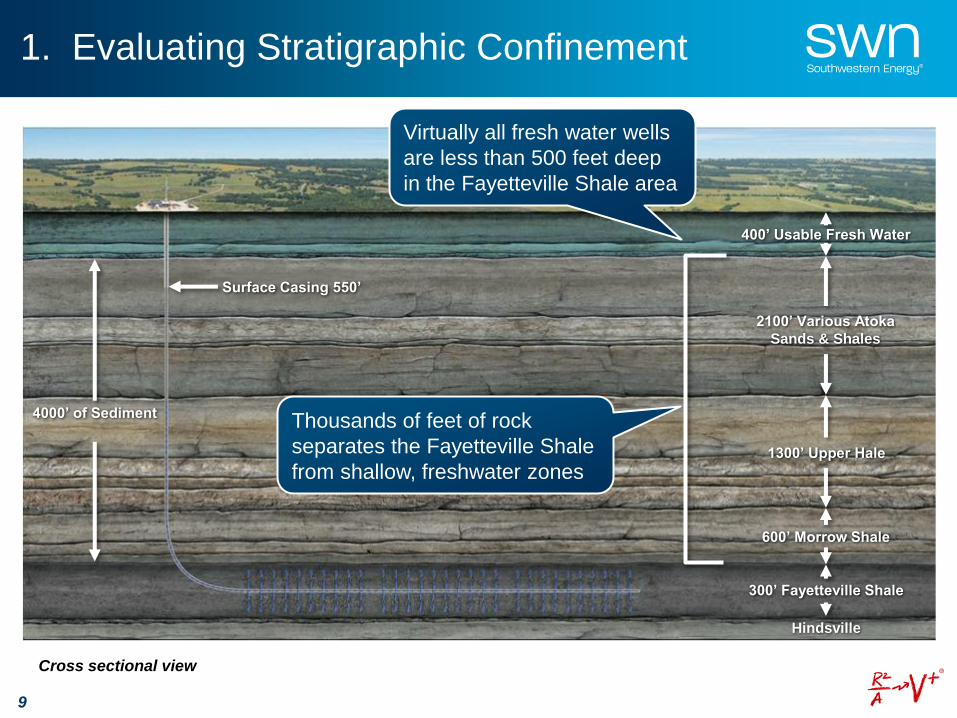
4000’ of Sediment
Surface Casing 550’
400’ Usable Fresh Water
2100’ Various Atoka
Sands & Shales
1300’ Upper Hale
600’ Morrow Shale
Hindsville
300’ Fayetteville Shale
9
Cross sectional view
1. Evaluating Stratigraphic Confinement
Virtually all fresh water wells
are less than 500 feet deep
in the Fayetteville Shale area
Thousands of feet of rock
separates the Fayetteville Shale
from shallow, freshwater zones
Cross sectional view
Evaluating Stratigraphic Confinement
10
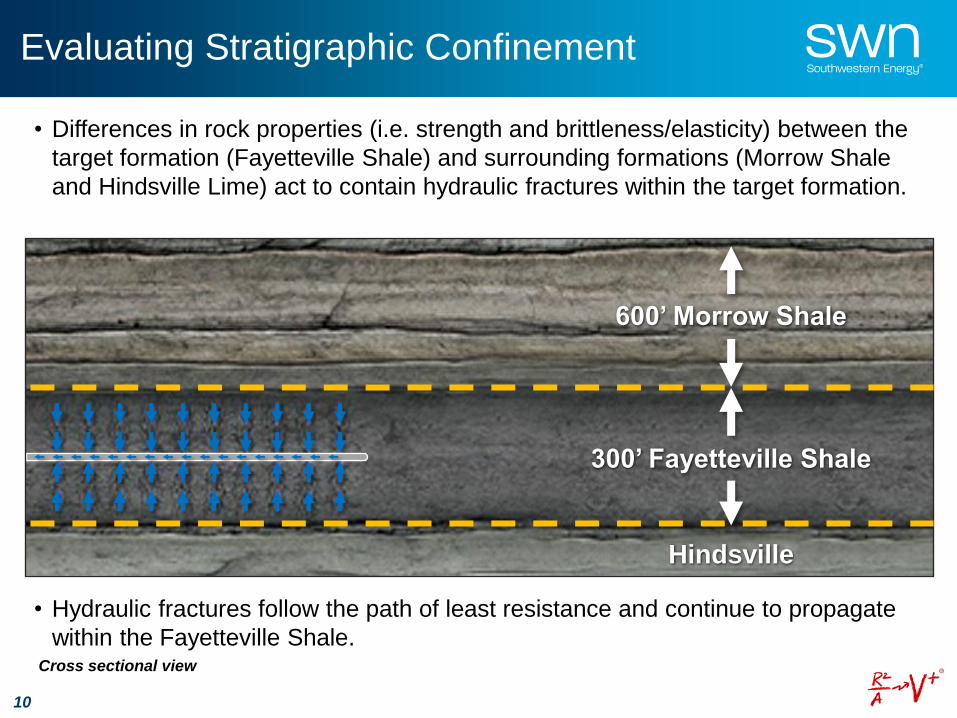
• Differences in rock properties (i.e. strength and brittleness/elasticity) between the
target formation (Fayetteville Shale) and surrounding formations (Morrow Shale
and Hindsville Lime) act to contain hydraulic fractures within the target formation.
• Hydraulic fractures follow the path of least resistance and continue to propagate
within the Fayetteville Shale.
600’ Morrow Shale
300’ Fayetteville Shale
Hindsville
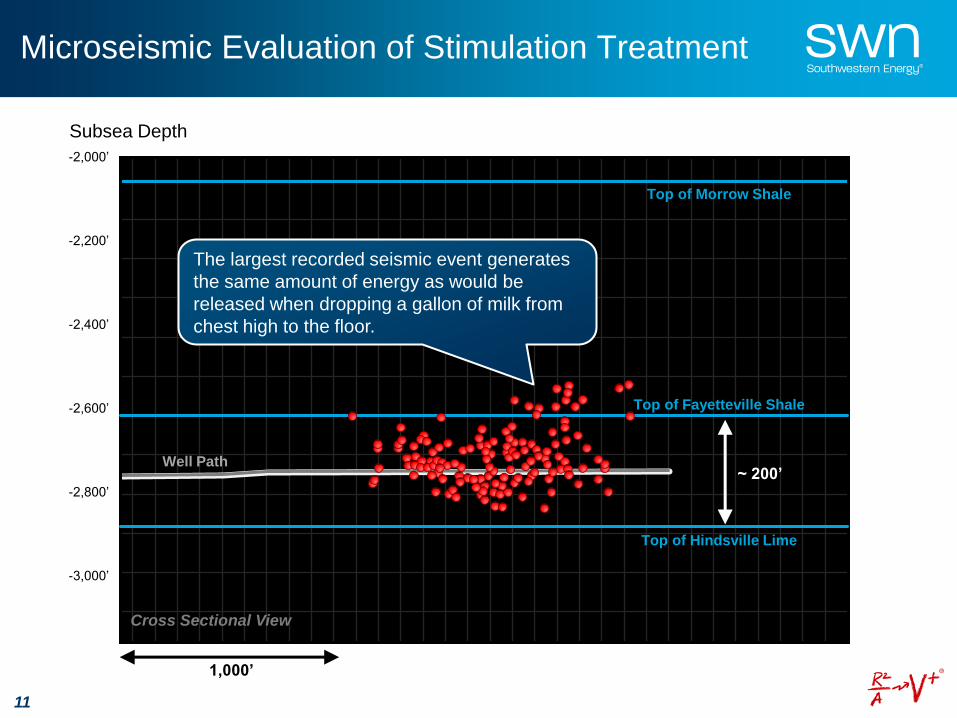
Microseismic Evaluation of Stimulation Treatment
11
Cross Sectional View
1,000’
Subsea Depth
-2,000’
-3,000’
-2,200’
-2,800’
-2,600’
-2,400’
Top of Morrow Shale
Well Path
The largest recorded seismic event generates
the same amount of energy as would be
released when dropping a gallon of milk from
chest high to the floor.
Top of Hindsville Lime
Top of Fayetteville Shale
~ 200’
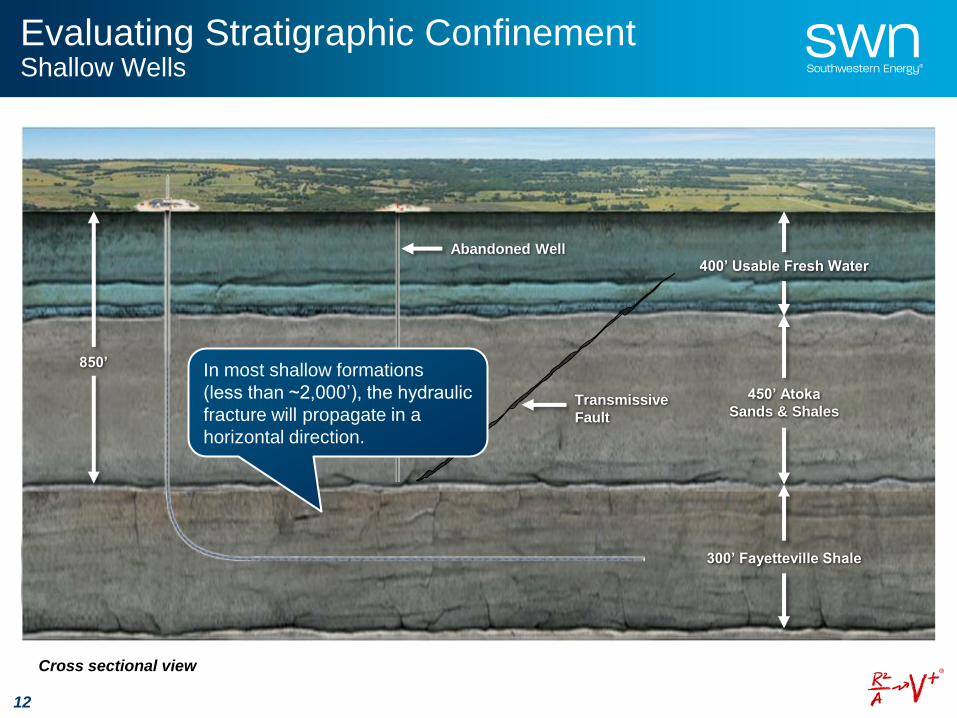
Evaluating Stratigraphic Confinement Shallow Wells
12
850’
400’ Usable Fresh Water
300’ Fayetteville Shale
450’ Atoka
Sands & Shales
Abandoned Well
Transmissive
Fault
In most shallow formations
(less than ~2,000’), the hydraulic
fracture will propagate in a
horizontal direction.
Cross sectional view
4000’
of Sediment
Surface Casing 550’
13
Cross sectional view
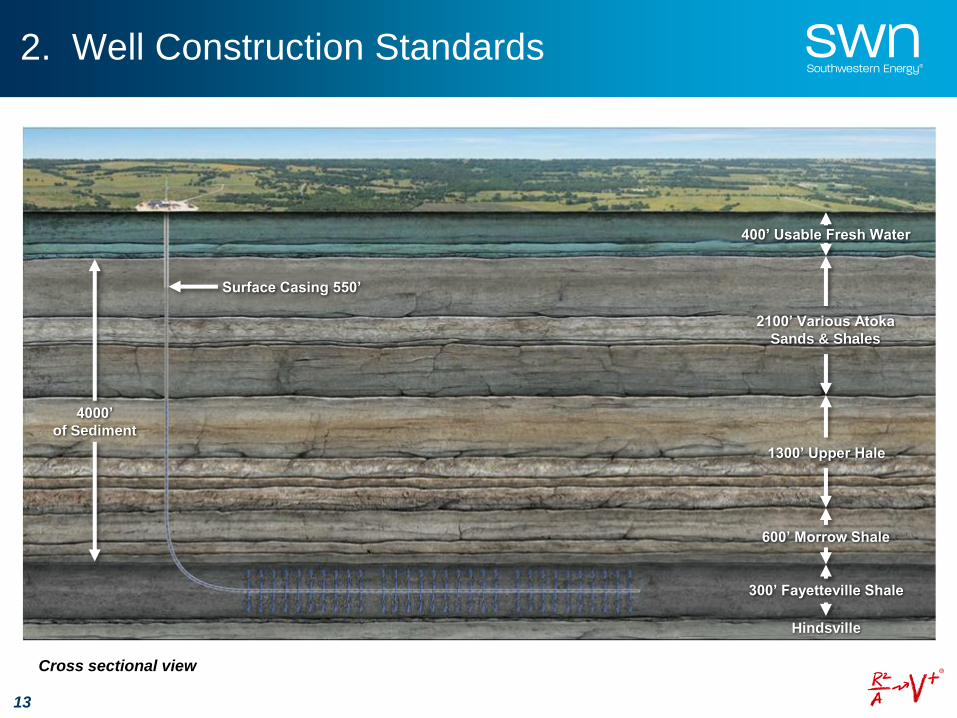
2. Well Construction Standards
400’ Usable Fresh Water
2100’ Various Atoka
Sands & Shales
1300’ Upper Hale
600’ Morrow Shale
Hindsville
300’ Fayetteville Shale
4000’
of Sediment
Surface Casing 550’
Cross sectional view
400’ Usable Fresh Water
2100’ Various Atoka
Sands & Shales
1300’ Upper Hale
600’ Morrow Shale
Hindsville
300’ Fayetteville Shale
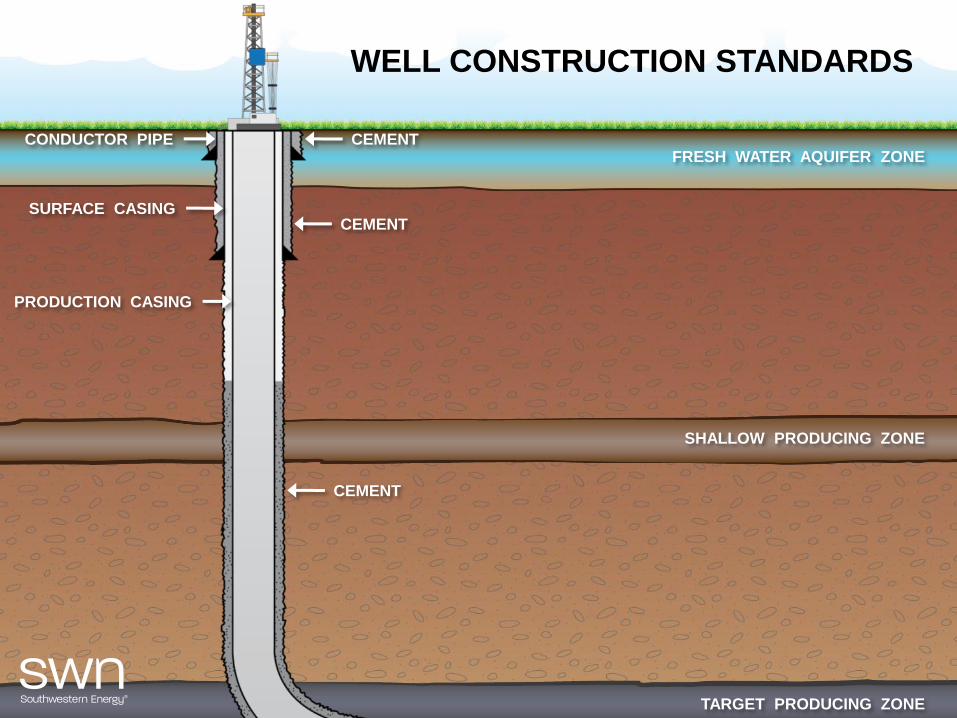
FRESH WATER AQUIFER ZONE
SHALLOW PRODUCING ZONE
WELL CONSTRUCTION STANDARDS
TARGET PRODUCING ZONE
CONDUCTOR PIPE
SURFACE CASING
PRODUCTION CASING
CEMENT
CEMENT
CEMENT
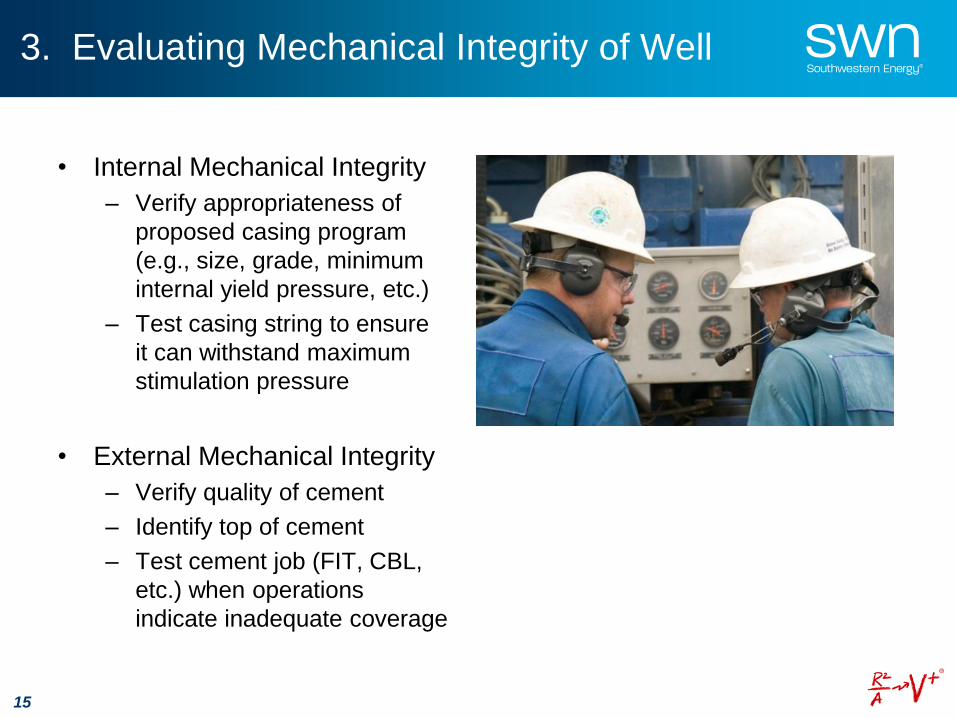
3. Evaluating Mechanical Integrity of Well
• Internal Mechanical Integrity
– Verify appropriateness of
proposed casing program
(e.g., size, grade, minimum
internal yield pressure, etc.)
– Test casing string to ensure
it can withstand maximum
stimulation pressure
• External Mechanical Integrity
– Verify quality of cement
– Identify top of cement
– Test cement job (FIT, CBL,
etc.) when operations
indicate inadequate coverage
15
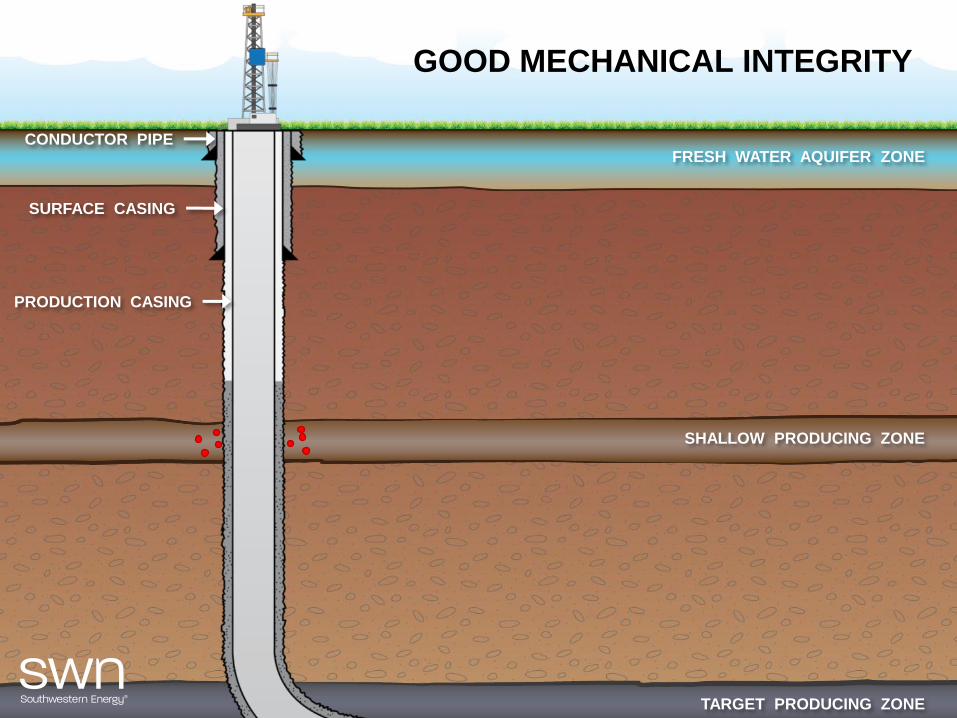
FRESH WATER AQUIFER ZONE
SHALLOW PRODUCING ZONE
CONDUCTOR PIPE
SURFACE CASING
PRODUCTION CASING
TARGET PRODUCING ZONE
GOOD MECHANICAL INTEGRITY
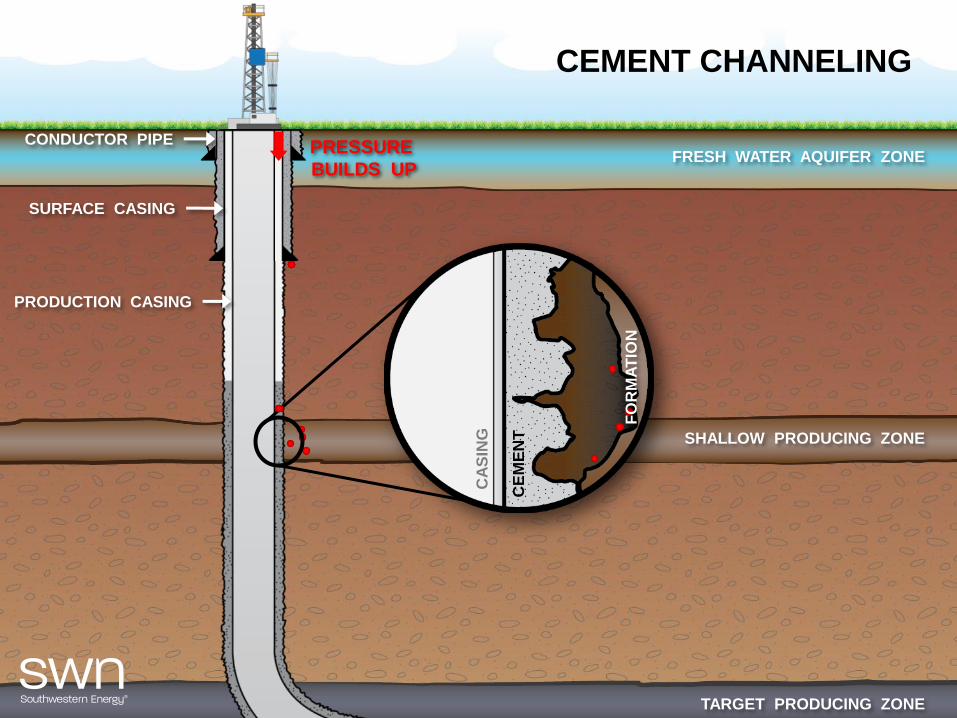
CEMENT CHANNELING
PRESSURE
BUILDS UP
CONDUCTOR PIPE
SURFACE CASING
PRODUCTION CASING
FRESH WATER AQUIFER ZONE
SHALLOW PRODUCING ZONE
TARGET PRODUCING ZONE
CA
SIN
G
CE
ME
NT
FO
RM
AT
ION
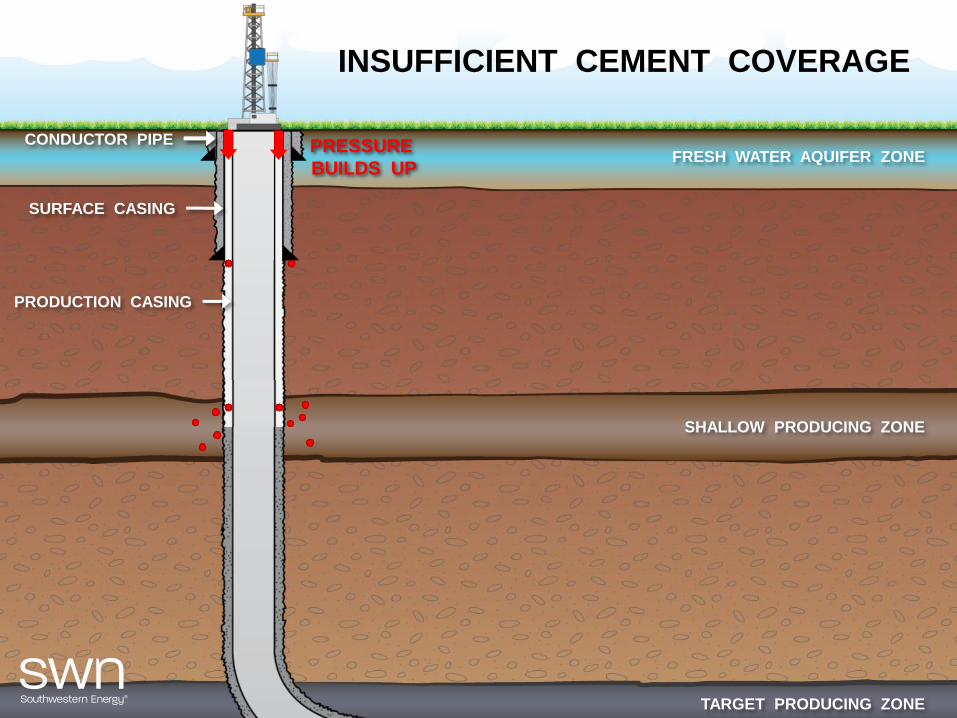
FRESH WATER AQUIFER ZONE
SHALLOW PRODUCING ZONE
TARGET PRODUCING ZONE
INSUFFICIENT CEMENT COVERAGE
PRESSURE
BUILDS UP
CONDUCTOR PIPE
SURFACE CASING
PRODUCTION CASING
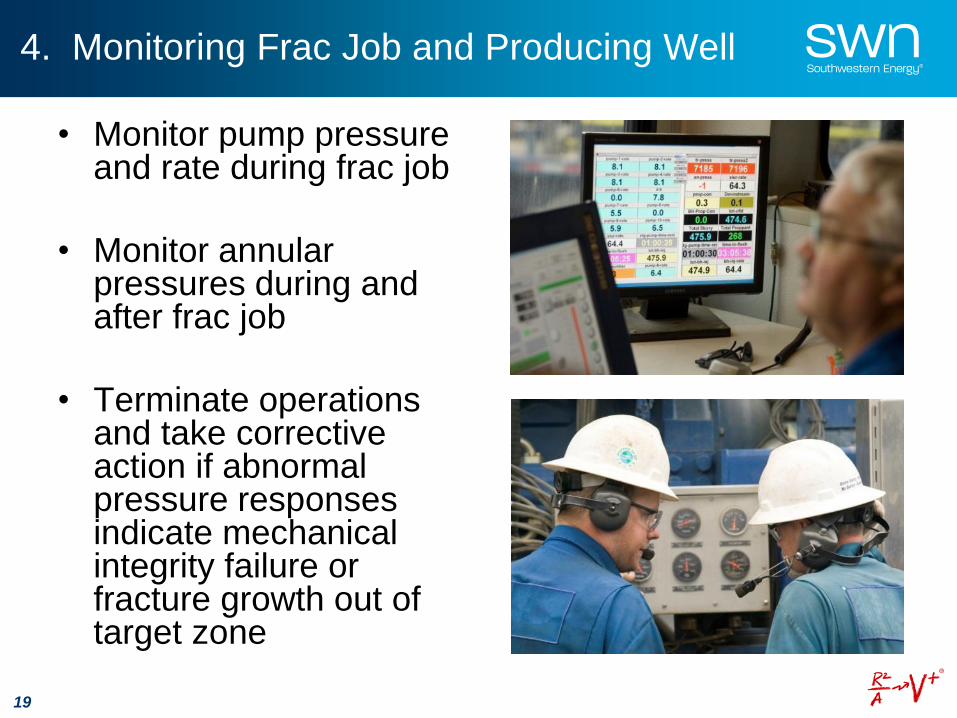
4. Monitoring Frac Job and Producing Well
19
• Monitor pump pressure and rate during frac job
• Monitor annular pressures during and after frac job
• Terminate operations and take corrective action if abnormal pressure responses indicate mechanical integrity failure or fracture growth out of target zone
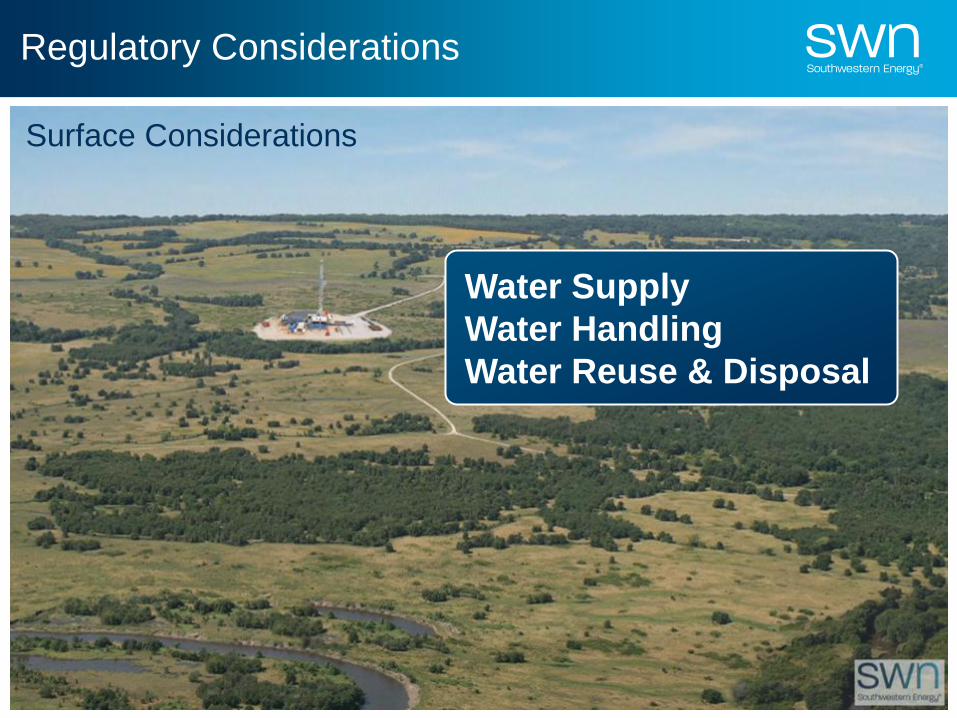
Regulatory Considerations
20
Air Emissions Surface Considerations
Surface Impact • Drilling Locations
• Infrastructure • Truck traffic & road damage
Water Supply
Water Handling
Water Reuse & Disposal
Surface Considerations
Water Supply
Water Handling
Water Reuse & Disposal
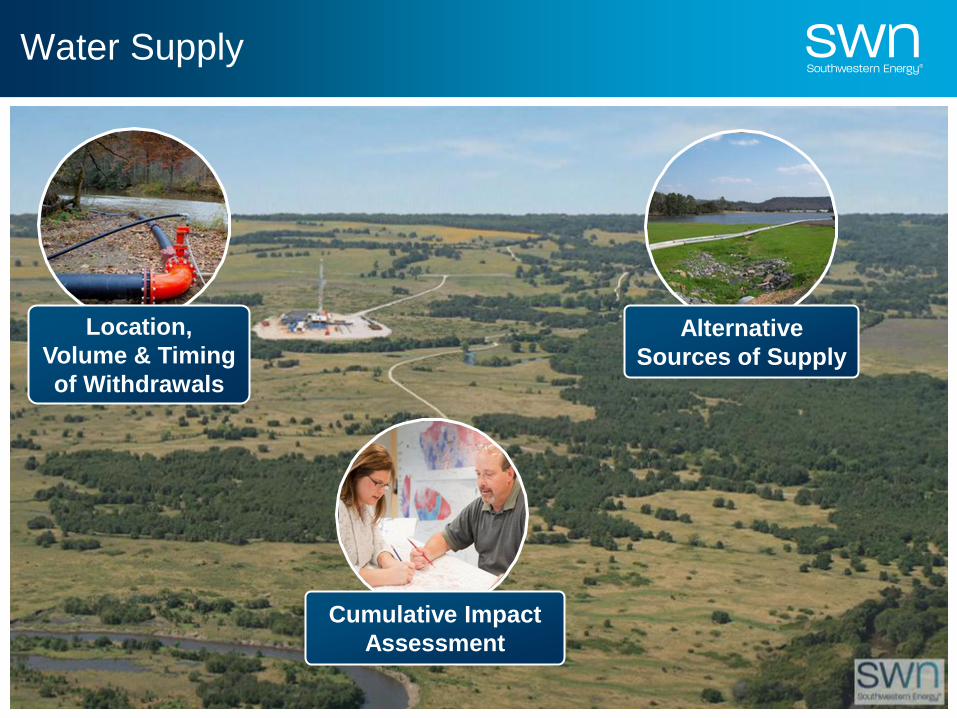
Water Supply
21
Location,
Volume & Timing
of Withdrawals
Cumulative Impact
Assessment
Alternative
Sources of Supply
Water Handling
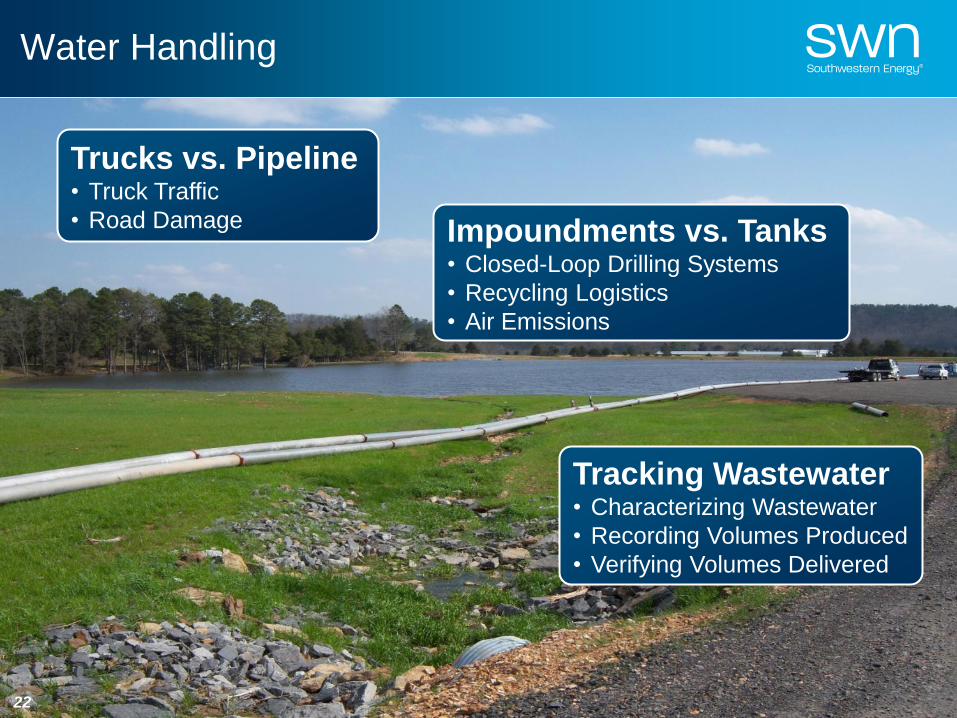
22
Trucks vs. Pipeline • Truck Traffic
• Road Damage Impoundments vs. Tanks • Closed-Loop Drilling Systems
• Recycling Logistics
• Air Emissions
Tracking Wastewater • Characterizing Wastewater
• Recording Volumes Produced
• Verifying Volumes Delivered
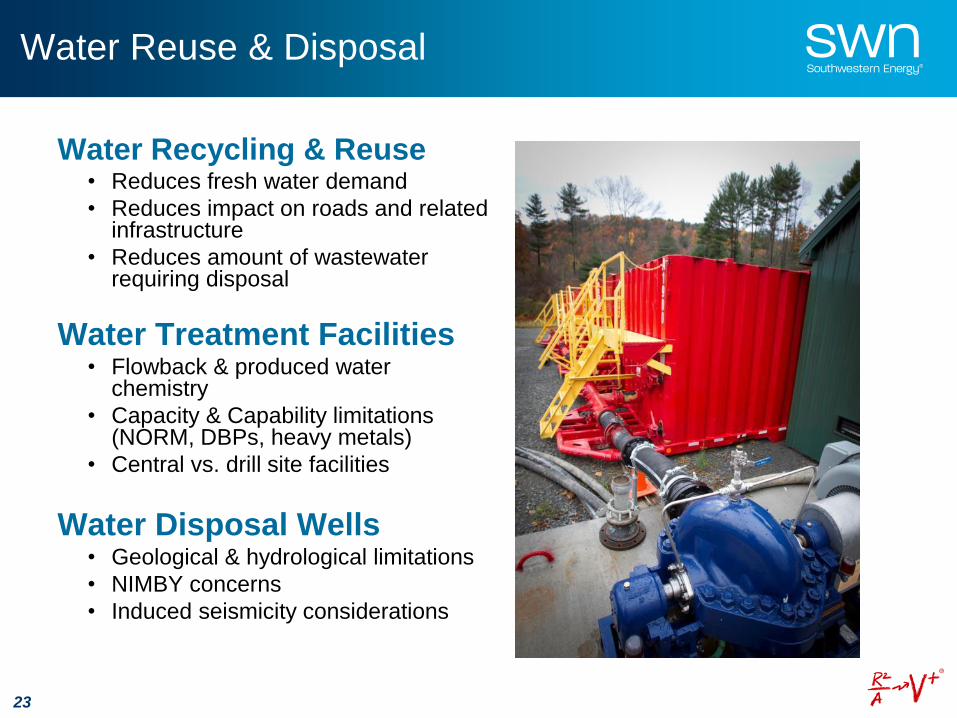
Water Reuse & Disposal
Water Recycling & Reuse • Reduces fresh water demand
• Reduces impact on roads and related infrastructure
• Reduces amount of wastewater requiring disposal
Water Treatment Facilities • Flowback & produced water
chemistry
• Capacity & Capability limitations (NORM, DBPs, heavy metals)
• Central vs. drill site facilities
Water Disposal Wells • Geological & hydrological limitations
• NIMBY concerns
• Induced seismicity considerations
23
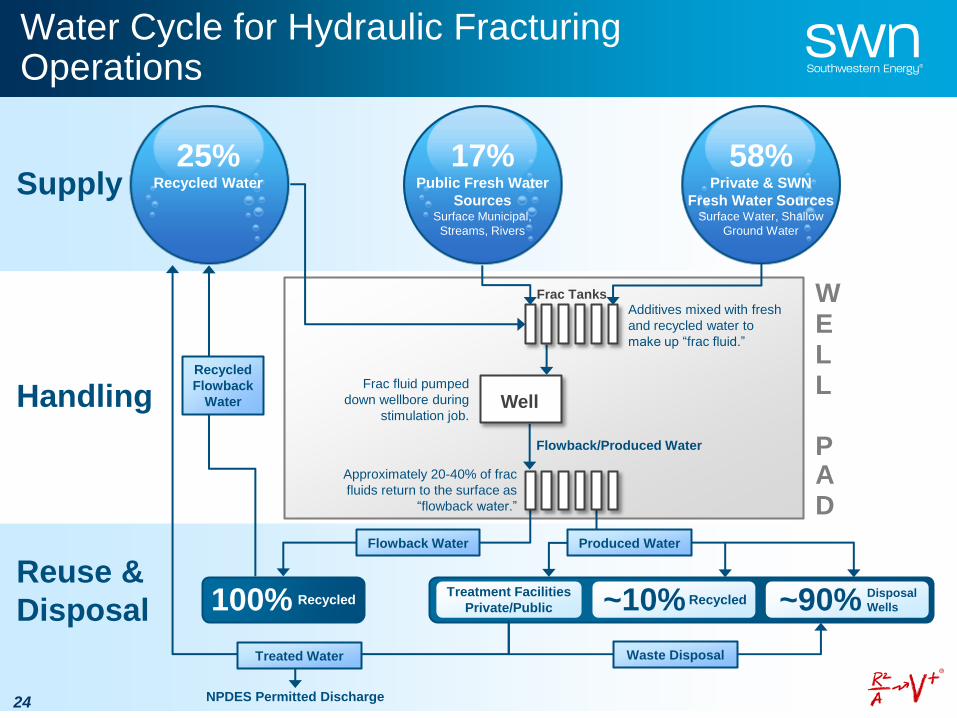
Recycled
Flowback
Water
Frac Tanks WELL PAD
Frac fluid pumped
down wellbore during
stimulation job.
Additives mixed with fresh
and recycled water to
make up “frac fluid.”
Approximately 20-40% of frac
fluids return to the surface as
“flowback water.”
Flowback/Produced Water
24
58% Private & SWN
Fresh Water Sources Surface Water, Shallow
Ground Water
17% Public Fresh Water
Sources Surface Municipal,
Streams, Rivers
25% Recycled Water
Well
100% Recycled
Flowback Water
Supply
Handling
Reuse &
Disposal
Treated Water
Produced Water
~10% Recycled ~90% Disposal
Wells
Treatment Facilities
Private/Public
Water Cycle for Hydraulic Fracturing Operations
Waste Disposal
NPDES Permitted Discharge
Core Value Unconventional Gas
Production and Water Resources: Lessons
from the U.S.
Brisbane, Sydney
& Canberra, Australia
February 27 – March 1, 2012
Mark K. Boling
Executive Vice President & General Counsel