Embed Size (px)
Citation preview

1
Unconditional Government Social Cash Transfer in Africa
Does Not Increase Fertility
Tia Palermo, Sudhanshu Handa, Amber Peterman, Leah Prencipe, David Seidenfeld on behalf of the Zambia CGP Evaluation Team
Office of Research Working Paper
WP-2015-09 | September 2015

2
INNOCENTI WORKING PAPERS
UNICEF Office of Research Working Papers are intended to disseminate initial research contributions
within the programme of work, addressing social, economic and institutional aspects of the realization
of the human rights of children.
The findings, interpretations and conclusions expressed in this paper are those of the authors and do
not necessarily reflect the policies or views of UNICEF.
This paper has been peer reviewed both externally and within UNICEF.
The text has not been edited to official publications standards and UNICEF accepts no responsibility for
errors.
Extracts from this publication may be freely reproduced with due acknowledgement. Requests to
utilize larger portions or the full publication should be addressed to the Communication Unit at
For readers wishing to cite this document we suggest the following form:
Palermo, T., Handa, S., Peterman, A., Prencipe, L., Seidenfeld, D. for Zambia CGP Evaluation Team
(2015). Unconditional Government Social Cash Transfer in Africa Does not Increase Fertility, Innocenti
Working Paper No.2015-09, UNICEF Office of Research, Florence.
© 2015 United Nations Children’s Fund (UNICEF)
ISSN: 1014-7837

3
THE UNICEF OFFICE OF RESEARCH
In 1988 the United Nations Children’s Fund (UNICEF) established a research centre to support its
advocacy for children worldwide and to identify and research current and future areas of UNICEF’s
work. The prime objectives of the Office of Research are to improve international understanding of
issues relating to children’s rights and to help facilitate full implementation of the Convention on the
Rights of the Child in developing, middle-income and industrialized countries.
The Office aims to set out a comprehensive framework for research and knowledge within the
organization, in support of its global programmes and policies. Through strengthening research
partnerships with leading academic institutions and development networks in both the North and
South, the Office seeks to leverage additional resources and influence in support of efforts towards
policy reform in favour of children.
Publications produced by the Office are contributions to a global debate on children and child rights
issues and include a wide range of opinions. For that reason, some publications may not necessarily
reflect UNICEF policies or approaches on some topics. The views expressed are those of the authors
and/or editors and are published in order to stimulate further dialogue on child rights.
The Office collaborates with its host institution in Florence, the Istituto degli Innocenti, in selected
areas of work. Core funding is provided by the Government of Italy, while financial support for specific
projects is also provided by other governments, international institutions and private sources,
including UNICEF National Committees.
Extracts from this publication may be freely reproduced with due acknowledgement. Requests to
translate the publication in its entirety should be addressed to: Communications Unit,
For further information and to download or order this and other publications, please visit the website
at www.unicef-irc.org.
Correspondence should be addressed to:
UNICEF Office of Research - Innocenti
Piazza SS. Annunziata, 12
50122 Florence, Italy
Tel: (+39) 055 20 330
Fax: (+39) 055 2033 220
www.unicef-irc.org
@UNICEFInnocenti
facebook.com/UnicefOfficeofResearchInnocenti

4
UNCONDITIONAL GOVERNMENT SOCIAL CASH TRANSFER IN AFRICA DOES NOT INCREASE FERTILITY Tia Palermo* a, Sudhanshu Handaa c, Amber Petermana, Leah Prencipea, David Seidenfeldb on behalf of the Zambia CGP Evaluation Teamd
a UNICEF Office of Research – Innocenti, Florence b American Institutes for Research (AIR), Washington DC c Department of Public Policy, University of North Carolina at Chapel Hill d The Child Grant impact evaluation was commissioned by the Government of Zambia (GRZ) through the Ministry of Community Development, Mother and Child Health to the American Institutes of Research and the University of North Carolina at Chapel Hill, and funded by a consortium of donors including DFID, UNICEF, Irish Aid, and the Government of Finland. The results that appear in this article are the culmination of over four years of intellectual, technical, financial and operational efforts of a large and dedicated team, all of whom made important contributions that led to the success of the evaluation. The corresponding authors for this article are Sudhanshu Handa ([email protected]; [email protected];), Tia Palermo ([email protected]), Amber Peterman ([email protected]), Leah Prencipe ([email protected]), and David Seidenfeld ([email protected]). The members of the evaluation team, listed by affiliation and then alphabetically within affiliation are: American Institutes of Research (Juan Bonilla, Rosa Castro Zarzur, Leah Prencipe, Dan Sherman, David Seidenfeld); UNICEF-Zambia (Charlotte Harland Scott, Paul Quarles van Ufford); Government of Zambia (Vandras Luyha, Stanfield Michelo, Manzunzu Zulu); DFID-Zambia (Kelley Toole); Palm Associates (Alefa Banda, Chiluba Goma, Liseteli Ndiyoi, Gelson Tembo, NathanTembo); University of North Carolina (Sudhanshu Handa); UNICEF Office of Research-Innocenti (Sudhanshu Handa, Tia Palermo, Amber Peterman, Leah Prencipe).
Abstract: Among policymakers, a common perception surrounding the effects of cash transfer
programmes, particularly unconditional programmes targeted to families with children, induces
increased fertility. We evaluate the Zambian Child Grant Programme, a large-scale government
unconditional cash transfer targeted to families with a child under the age of three and examine impacts
on fertility and household composition. The evaluation was a cluster randomized control trial, with data
collected over four years from 2010 to 2014. Our results indicate there are no programme impacts on
overall fertility. In addition, among young women under 25 years and among women who have access
to family planning, fertility actually decreased and use of modern contraceptives increased, respectively.
Our results contribute to a small evidence base demonstrating that there are no unintended incentives
related to fertility due to cash transfers.
Keywords: Fertility, unconditional cash transfers, Zambia, Africa
Acknowledgements: We are grateful to Molly Rosenberg and Guy Stecklov for helpful comments. The
Child Grant impact evaluation was commissioned by the Government of Zambia (GRZ) through the
Ministry of Community Development, Mother and Child Health to the American Institutes of Research
and the University of North Carolina at Chapel Hill and funded by a consortium of donors including DFID,
UNICEF, Irish Aid, and the Government of Finland. Palermo, Handa, and Peterman received additional
funding from the Swedish International Development Cooperation to the UNICEF Office of Research -
Innocenti for analysis of the data and drafting of the manuscript.
5
TABLE OF CONTENTS
1. Introduction 6 2. Background 7 2.1 Economic theory and fertility decisions 7 2.2 Existing evidence on cash transfers and fertility 10 2.3 Impacts on fertility-related behaviours of adolescents in SCT households 11 2.4 Study aims and hypotheses 11 3. Data and Methodology 12 4. Results 16 4.1 Summary statistics 16 4.2 Programme impacts on fertility outcomes 17 4.3 Programme impacts on contraceptive use 17 4.4 Programme impacts on household composition 17 5. Discussion and Conclusion 18
References 21 Tables and Appendices 25
6
1. INTRODUCTION
Among policymakers, a common perception surrounding welfare programmes, and unconditional cash
transfers (UCTs) in particular, is that transfers targeted to households with young children will
incentivize families to have more children (Goldblatt, 2003; Hochfeld & Plagerson, 2011; Holmqvist,
2011; Richter, 2009). Unintended incentives are a possibility when cash payments are given with the
qualifying condition of having an infant or pregnant woman in the household. Even when the targeting
formula is complex and does not solely link eligibility with young children, the mere perception that
transfers are given to households with young children may be an incentive for current recipients to
have additional children in an effort to maintain eligibility, or for non-beneficiaries to qualify for future
payments. These concerns are particularly relevant in poor countries with high fertility where transfers
may be a significant proportion of household monthly consumption.
A recent review from the World Bank documents the extraordinary rise of cash transfer programmes,
both conditional and unconditional, in the developing world (World Bank, 2015). Such programmes are
more established in Latin America and the Caribbean where they tend to be conditional, while in sub-
Saharan Africa, programmes are much newer and, with the exception of the richest southern African
countries, not yet taken to scale. Interestingly, the largest programme on the continent is South
Africa’s Child Support Grant, an unconditional cash transfer programme targeted to poor households
with children. This is precisely the kind of programme that would generate objections based on fertility
fears, and such concerns were indeed raised in the debate around its introduction (Lund 2008).
In Africa, one of the key barriers to the scale-up of unconditional cash transfer programmes is the
notion held by politicians, and even the general public, that such programmes will induce the poor to
have more children. The hard evidence on this question is scanty. There are only two published studies
based on experimental designs which address the issue (Stecklov, Winters, Todd, & Regalia, 2007;
Todd, Winters, & Stecklov, 2012). Stecklov et al. (2007) examined the fertility impacts of three Latin
American conditional cash transfers (CCTs): the Honduran Programmea de Asignación Familiar [Family
Assistance Programme (PRAF)]; the Nicaraguan Red de Protección Social (RPS) [Social Protection
Network] programme; and Mexico’s PROGRESA (later called Oportunidades). They find an increase in
the probability of a birth in PRAF which they conclude is linked to the fact that the size of the transfer
could be increased immediately by the birth of a child (a loophole which was subsequently closed).
There were no fertility effects of the Nicaraguan RPS or Mexican PROGRESA programmes, where the
value of transfers was not immediately affected by the addition of a child. Todd et al. (2012) further
examined the Nicaraguan RPS programme and found that it increased birth spacing, a short-run
indicator of fertility. The evidence from Africa is based on two unpublished working papers which
together assess the fertility impacts of the Kenya Cash Transfer for Orphans and Vulnerable Children,
the Malawi Social Cash Transfer Programme (Stecklov & Winters, 2011), and the South African Child
Support Grant (Rosenberg et al., 2015). None of these studies shows any significant positive impact of

7
the unconditional cash transfer programmes on fertility. In the case of Kenya the transfer is flat and
independent of family size, while in South Africa1 and Malawi there is a family cap on the transfer size.
The current study uses evaluation data from the Zambian Child Grant Programme (CGP), a large-scale
UCT targeted to households with a child under the age of five at programme initiation and evaluates
the impact of transfers on fertility and child-fostering decisions. The overall goal of the CGP is to
reduce extreme poverty and break the intergenerational transmission of poverty. The CGP was
geographically targeted; a flat monthly cash transfer of approximately USD12 (irrespective of family
size) is provided to all qualifying households in programme areas, with no additional eligibility criteria.
While influencing fertility is not a goal of the CGP programme, ex-ante expected impacts of a UCT on
fertility are ambiguous.
The programme may decrease fertility through the ‘quality-quantity’ trade-off, or increase
childbearing in order to maintain eligibility in the programme. In the current study, using data from a
large multi-site social experiment, we examine the impacts of the CGP on 1) fertility and contraceptive
use at the woman-level; 2) count of children aged zero to four years at the household-level; and 3)
heterogeneous impacts on these outcomes by woman’s age and whether or not the woman is the
intended transfer recipient. The evaluation is a social experiment with data collected at baseline in
2010 and subsequently after 24, 36 and 48 months in 2012, 2013 and 2014. Our results indicate there
are no programme impacts on overall fertility, and these findings are robust to a number of different
specifications and sensitivity analyses. In addition, among young women under 25 years old, fertility
actually decreased. The results contribute to the small literature that rigorously documents the fertility
impacts of unconditional cash transfer programmes in developing countries. The remainder of this
paper is organized as follows: Section 2 presents the theoretical framework and reviews existing
empirical evidence; Section 3 describes the programme, data, and analysis methodology; Section 4
summarizes results; and Section 5 concludes.
2. BACKGROUND
2.1 Economic theory and fertility decisions
In traditional economic models of fertility, couples maximize their utility which, subject to budget
constraints, they derive from consuming goods (including children) and leisure time, and in doing so
make a quantity versus quality trade-off when deciding how many children to have (Becker, 1960;
Becker & Lewis, 1974). In this model, children are consumption goods that provide utility to parents
(the couple), as well as production goods insofar as they provide monetary income through various
forms of labour. Relative preferences of the couple, influenced by religion, age and other cultural
factors, determine the shape of the indifference curves. Quality of children in this framework refers to
inputs related to children’s care such as where to send a child to school, spending on health care and
other investment decisions. As children are considered normal goods, increases in income lead to an
increase in the average amount spent on each child, and Becker hypothesized that the quantity
1 In the South African CSG, there is no cap on biological children and a cap after six non-biological children.
8
elasticity of children demanded is small compared to the quality elasticity (Becker, 1960). This means
that increases in income will induce greater investments in children (quality) than increases in quantity
of children. Further, he hypothesized that declines in child mortality would induce corresponding
declines in births.
Sub-Saharan Africa (SSA) was the last region globally to begin to experience an onset of the fertility
transition, however the pace of fertility decline has continued to be slower than that in Asia and Latin
America during the 1970s and has even stalled in some countries that have a total fertility rate (TFR) of
approximately five (Bongaarts & Casterline, 2013). In an earlier study, Bongaarts hypothesized that
poorly performing economies, rising mortality, and lower priorities assigned to family planning
programmes over the period studied (1992-2004) contributed to an apparent stagnation in the fertility
decline in the late 1990s and early 2000s (Bongaarts, 2008). Given these contributing factors, as well as
the aforementioned perceptions of policymakers regarding fertility incentives of targeted anti-poverty
programmes, it is important to examine how large-scale poverty-targeted social protection
programmes impact fertility decisions at the household level.
Todd et al. (2012) argue that Becker’s framework is useful for examining broader shifts in fertility
occurring in demographic transitions, but is less useful in examining short-term fertility outcomes. At
the couple level, fertility decisions are made sequentially and are subject to inherent uncertainty
(Namboodiri, 1972), biological supply (Easterlin, 1975), and dependent on risks that households face
(Cain, 1981). A study from Indonesia suggests that, in the face of risks, children may be a means to
smooth consumption (i.e., a negative income shock may cause households to shift from quality to
quantity of children (Kim & Prskawetz, 2010)). To this end, social cash transfers (SCTs) may impact
fertility as couples respond to changes in their economic or social situation by updating their goals for
quality and quantity of children (i.e., an income effect) (Todd et al., 2012). Relatedly, period-specific
decisions, such as whether to use contraceptives, determine births and these short-run decisions can
be altered by perceptions of a link between transfer and presence of children in the household
(Stecklov et al., 2007; Todd et al., 2012).
Transfers received by the household alter the cost of having children, and these costs vary based on
eligibility requirements (i.e., attendance at health visits and other requirements in CCTs which require
additional transportation and/or time costs and eligibility based on number of children in the
household in both CCTs and UCTs). Stecklov and colleagues (2007) identify the following as the three
key factors which influence the impact of an UCT on fertility: 1) the transfer amount, 2) the manner in
which the UCT alters absolute and relative costs associated with having and investing in children, and
3) influence of the programme on supply-side factors (Stecklov et al., 2007). A key assumption in their
theoretical framework is that UCT programmes may incentivize increased fertility if they influence
total income and the design of the UCT is such that “there is a greater emphasis on reducing the costs
associated with the quantity of children relative to the costs of reducing quality” (p130).
Indeed, improvements in the health and education of children as a result of UCT programmes are
evidence of increases in the “quality” of children, in Becker’s terminology. Preferences for children
may also vary over time and are subject to constraints related to fecundity, mother’s time and the

9
costs of having children (child care, schooling, etc.). Bor (2013) argues that poorer individuals may
partake in greater risks of pregnancy related to unprotected sex, given that the costs of childbearing
are borne in the future, and existing evidence that those living closest to subsistence level may have
shorter time horizons as short-term needs compete with long-term planning (Lawrance, 1991).
Given the lack of supply-side components of most UCTs in Africa (both conditions related to health and
schooling but also a lack of simultaneous investments in health and education infrastructure), the third
key factor (supply-side) in the framework of Stecklov et al. is less important in the African context as
regards being a mediator (i.e., along the causal pathway) of programme impacts. That is to say, in the
Latin American context, where services were generally available and benefits were conditional upon
school attendance and health check-ups, the programmes’ impacts on health and schooling outcomes
was probably mediated through increased access to services. We argue that in the African context,
supply-side factors can moderate programme impacts, and indeed a previous study of Zambia’s CGP
found positive impacts in communities where health facilities were available (but no overall impacts
on skilled attendance at birth) (Handa, Peterman, & Kenya OVC-CT Evaluation Team, 2015), whereas in
Latin America, services were more widespread and thus less likely to moderate impacts. Specifically,
the supply of contraceptives (including condoms) and other family planning services such as
counselling and access to information are important moderators of potential programme impacts.
In addition to preferences regarding total number of children desired, SCTs may influence the timing of
childbearing by encouraging longer birth intervals, which has positive impacts on newborn, child, and
maternal health (Rafalitnanana & Westoff, 2000; Rutstein, 2005). Birth spacing may increase due to
increased contraceptive use (described above) or through increases in exclusive breastfeeding (if
programmes impact infant feeding practices), which leads to lactational amenorrhea, particularly
during the first six months post-partum (Vekemans, 1997). Previous research has demonstrated
impacts of SCTs on infant and young child feeding practices (Macours, Schady, & Vakis, 2012), but to
our knowledge none have examined impacts on exclusive breastfeeding. It is possible that CCTs in
Latin America would be more likely to influence breastfeeding practices as compared to typical UCTs in
Africa, given complementary components of the programme including health and nutrition
information sessions. In addition, since breastfeeding is widespread in Africa, there is less variation and
opportunity for programme impact.
Finally, if SCTs increase the ability of women to avail themselves of existing health services (through
increased ability to afford transport and service-related costs), then they may increase women’s and
couples’ ability to achieve desired family size. Use of modern contraceptives not only helps couples
achieve ideal family sizes, but also has broad, positive impacts on perinatal outcomes, child survival,
and maternal health (Ahmed, Li, Liu, & Tsui, 2012; Cleland, Conde-Agudelo, Peterson, Ross, & Tsui,
2012). In Zambia over one in four women (28%) aged 35 years or over reported having more children
than their ideal (Upadhyay & Karasek, 2012), and approximately 35% of all pregnancies are unintended
in Africa (Sedgh, Singh, & Hussain, 2014). According to Demographic and Health Survey (DHS) data
from 2007, the ideal number of children was 5.1 and 5.7 among women and their partners,
respectively, in Zambia (Upadhyay & Karasek, 2012). By 2013, the ideal number of children was 4.7 as
reported by women compared to 5.0 among men (Central Statistical Office (CSO) et al., 2014).
10
Therefore, irrespective of other pathways, there exists an opportunity of an ‘income effect,’ whereby if
income constrains use of contraceptives, women may increase their use of family planning due to the
transfer programme.
2.2 Existing evidence on cash transfers and fertility
Given the critical importance of the early childhood environment in determining nutritional and
educational outcomes (Dewey & Begum, 2011; Leroy, Ruel, Habicht, & Frongillo, 2014), SCT
programme often target households with very young children. In various settings, this has led to
concern that such programmes will incentivize more childbearing (Richter, 2009; Wilcox, Robbennolt,
O'Keeffe, & Pynchon, 1996). However, studies from Kenya, Malawi, and South Africa (UCTs), as well as
in Mexico and Nicaragua (CCTs) have found no impacts of SCTs on fertility (Rosenberg et al., 2015;
Stecklov & Winters, 2011; Stecklov et al., 2007; Todd et al., 2012). Only two studies to date have
suggested a positive link between an SCT (both CCTs) and fertility. These include a study examining the
PRAF in Honduras, which led to a two to four percentage point increase in the probability of a birth
over the two-year period examined (Stecklov et al., 2007), and a study using non-experimental data to
compare households who were enrolled early (1997/1998) in Oportunidades in Mexico (called
PROGRESA at the time) versus those enrolled later (2004 or later), finding a five per-cent increase in
fertility over pre-programme levels (Arenas, Parker, Rubalcalva, & Teruel, 2015). In the Honduran
programme, the amount of the transfer could be increased post-enrolment by the addition of a
pregnant woman or new child (for a brief period until this loophole was closed), and thus the
behavioural link is stronger.
The Mexican study utilized a somewhat selected sample (i.e., only non-indigenous women living in
rural communities with low and medium levels of community poverty) in order to construct a
reasonable comparison group, and this may decrease generalizability of the findings, particularly if
cash transfers are targeted in communities with high levels of poverty, where dynamics surrounding
fertility decisions as well as access to contraception may be different. Further, during the course of
Brazil’s Bolsa Familia programme, a conditional cash transfer programme launched in 2003 which by
2015 covered approximately 14 million households (50 million individuals) (Falcão Silva, 2015), or
approximately 25% of the Brazilian population, total fertility rates dropped from 2.35 in 2000 to 1.90 in
2010 nationally according to census data. Larger decreases were found among the poorest
households, including a decrease from 5.10 to 3.56 among those with monthly per capita household
income less than 70 reales, and from 3.47 to 3.64 among those with monthly per capita household
incomes of 70-140 reales (Ministry of Social Development and Fight against Hunger, 2012). This
suggests that a national social cash transfer covering a quarter of the population did not reverse
downward fertility trends; however, the causal relationship cannot be identified, as no experimental
study was conducted to examine fertility impacts.
An evaluation of South Africa’s Child Support Grant (CSG) – the most similar to the programme
examined in our analysis due to its unconditional nature and targeting criteria based on presence of a
child in the household (target age ranges differ and the CSG is means-tested) – found that receipt of
the SCT did not increase pregnancy rates, and, in fact, recipients had lower second pregnancy rates
11
than non-recipients (Hazard rate=0.72; 95% CI: 0.65, 0.79) (Rosenberg et al., 2015). Existing
evaluations of impacts of the CSG on adult women’s fertility lacked a randomized experimental design
due to the fact that the programme has been scaled up for a long period of time (though eligibility
criteria have changed), and the aforementioned study used quasi-experimental matching methods to
evaluate programme impacts, namely inverse probability weighting and marginal structural models. In
other countries in the region, evaluations of Kenya’s Cash Transfer for Orphans and Vulnerable
Children (CT-OVC) and Malawi’s Social Cash Transfer Scheme (SCT) using experimental cluster
randomized designs found no impacts on childbearing as measured by presence in the household of
children aged 0-17 years (surveys did not ask women directly about fertility as it was unrelated to
programme objectives) using difference-in-differences (DD) estimators and propensity score matching
(Stecklov & Winters, 2011). Furthermore, one of the aforementioned studies also examined
contraceptive use, and did find (somewhat mixed) evidence to suggest that SCTs increased
contraceptive use in Mexico and Nicaragua (Stecklov et al., 2007).
2.3 Impacts on fertility-related behaviours of adolescents in SCT households
Finally, it is worth noting that SCTs may impact overall fertility by delaying sexual debut and marriage
of adolescents in SCT households. A growing body of evidence has recently demonstrated this
potential both for CCTs and UCTs across Latin America and sub-Saharan Africa (Gulemetova-Swan,
2009; McQueston, Silverman, & Glassman, 2013; Stecklov et al., 2007). Kenya’s CT-OVC led to delayed
sexual debut and first pregnancy, but no delays in marriage among young people aged up to 25 years
(Handa, Halpern, Pettifor, & Thirumurthy, 2014; Handa, Peterman, et al., 2015), and South Africa’s CSG
was found to be protective against sexual debut and pregnancy among females (Bor, 2013; Heinrich,
Hoddinott, & Samson, 2015; Heinrich et al., 2012). Further, an evaluation of a scale-up of the Malawi
SCT found that among poorer households (defined at baseline), but not in the overall sample, the
programme reduced the probability of pregnancy by 4 percentage points among females aged 13 to 19
at baseline (Malawi SCT Evaluation Team, 2015). Finally, a smaller pilot cash transfer programme (with
conditional and unconditional treatment arms) in Malawi (Zomba Cash Transfer Programmeme), which
distributed cash transfers to female adolescents and their households, found that the transfers led to
decreases in marriage, pregnancy, and sexual debut, however these findings varied by group examined
(in-school versus drop-outs at baseline – findings were driven by the latter group), as well as the
unconditional versus conditional transfers; impacts on reduced marriage and pregnancy were only
found in the UCT treatment arms (Baird, Chirwa, McIntosh, & Ozler, 2010; Baird, McIntosh, & Özler,
2011).
2.4 Study aims and hypothesis
In the current study, we test whether a large, government-run UCT in Zambia targeted to families with
young children increased childbearing over a four-year period. We hypothesize that women may
increase their childbearing in response to receiving cash benefits if they believe that eligibility is
determined by maintaining very young children in the household or if they believe the transfer
amounts may increase with more children. This increase in childbearing could be either a quantum
effect (i.e., women increase the total number of children demanded) or a tempo effect, whereby

12
women shorten birth intervals. Furthermore, women who do not yet have children but are living in
households receiving cash may initiate childbearing in an effort to secure their own cash benefits.
3. DATA AND METHODOLOGY
3.1 Description of the Child Grant Programme (CGP)
In 2010, the Zambian Ministry of Community Development, Mother and Child Health started
implementing the CGP, with the goals of reducing extreme poverty and breaking the inter-generational
cycle of poverty. Specific objectives of the programme included supplementing household income,
increasing school attendance, reducing under-five mortality and morbidity, increasing household asset
ownership, and increasing the number of households having a second meal per day (Seidenfeld,
Handa, Prencipe, Tembo, & Sherman, 2011). The CGP was implemented in three districts (Kalabo,
Shangombo, and Kaputa) with high rates of mortality, morbidity, stunting and wasting among children
aged zero to three years. Households with a child aged zero to five years at programme initiation were
targeted for the programme, and transfers were distributed bi-monthly to the primary female adult in
the household caring for a child in the targeted age range. The transfer was a fixed monthly sum of
approximately USD 12 (paid bimonthly) irrespective of household size, an amount deemed sufficient to
purchase one meal a day for everyone in the household for one month. Households “age-out” or
graduate from the programme after the index child turns five. Officially, a CGP household would re-
qualify when the index child has a sibling under age five years. However, in practice this was not
applied consistently, and very few families re-qualified this way.
Further, relatively few children turned 5 between end-2010 (start of programme) and end 2013.
Graduation began in earnest in 2014 and then the government decided to stop any enrolment into the
CGP. Graduation continues in 2015 but without new enrolments into the CGP, which is gradually being
phased out. To date, findings from a rigorous impact evaluation of the programme have demonstrated
strong impacts on consumption, food security, asset ownership, school attendance, agricultural
production, and non-farm enterprise (Handa, Lawlor, Seidenfeld, & Zambia CGP Evaluation Team,
2015; Zambia CGP Evaluation Team, 2014).
3.2 Data
An impact evaluation using an experimental design accompanied the CGP programme in order to
understand impacts on the target population and provide evidence for future design and expansion of
the programme. The evaluation was a collaboration between the University of North Carolina at
Chapel Hill and American Institutes for Research (AIR) as part of the Transfer Project. The evaluation
design took advantage of the government’s planned roll-out of the programme, and the unit of
randomization (cluster) was the lowest level of programme administration, the Community Welfare
Assistance Committee (CWAC). In total, 90 CWACs were randomly assigned, half (45) to treatment
(starting programme in December 2010) and half (45) to comparison (however, delayed entry, which
was intended to begin at the end of 2013, was delayed until 2015, when the CGP underwent a
reorganization including consolidation with another SCT in Zambia as well as changes to the targeting
formulas). In October to November 2010, a baseline survey among a random sample of 2,515

13
beneficiary and non-beneficiary households was carried out, and follow-up surveys were conducted in
October to November 2012 (24 month); June to July 2013 (30 month), October to November 2013 (36
month), and October to November 2014 (48 month).
The 2,515 households at baseline provided an evaluation sample of 14,565 individuals (4,793 children
aged five and under). The sample size was chosen to detect hypothesized effects for child
anthropometry outcomes among children under five years of age, accounting for attrition and non-
response rates. Household, community, and health facility questionnaires were administered at
baseline, and follow-up household and community questionnaires were administered at 24, 30, 36,
and 48 months. Household-level surveys were conducted with one main respondent (the intended
CGP recipient) and included detailed modules on socioeconomic status, wealth and production
activities, early childhood development, women’s empowerment, and anthropometry for all children
under five years. Further, information on women’s fertility history was collected for all women aged 12
to 49 years residing in the household at 24, 36 months, and 48 months, as reported by the main
respondent. Additionally, at the 36 and 48 month follow-up surveys, information on current use of
modern contraceptives was collected for the main survey respondent (one woman per household).
Community-level (all waves) and health facility (baseline only) surveys were implemented to measure
supply of health, education and other services and infrastructure.
Approximately 95 per cent of households in the sample fall below the extreme poverty line, compared
to 85 per cent of households in the sample districts as reported in the 2010 Living Conditions and
Monitoring Survey. Median household size was five individuals, and the transfer amount represented
approximately 27 per cent of household monthly expenditures at baseline (Seidenfeld et al., 2011).
In the 24-month follow-up a module on programme operational performance was administered.
Respondents were asked about their perceptions of programme qualifying characteristics and
continued receipt of the transfer. Approximately 64 per cent of respondents in both treatment and
control households combined correctly identified eligibility criteria for the CGP (i.e., caring for a child
under the age of five years; results not shown). Therefore, we can assume that around two-thirds of
the sample is aware that having a young child in the household is the main reason they are receiving
the transfer. Among recipients, there was some mixed understanding of the cash transfer rules
(conditions) related to continuing support; however the percentage of respondents recognizing there
are no conditions was 87% after 24 months, 82% after 36 months, and 72% after 48 months. Among
those who thought there were rules, the most commonly cited were maintaining adequate nutrition
for children and clothing them cleanly and appropriately (Zambia CGP Evaluation Team, 2015).
Information collected at baseline from the health facilities highlighted the extremely weak health
services available in these communities. Only six per cent of the facilities have electricity, less than 10
per cent have clean water, and only one-quarter have a laboratory for testing. With respect to staffing,
only 10 per cent of facilities have a registered nurse, and no facility had a full-time medical doctor.
Furthermore, drug availability was low, with oral rehydration salts (ORS) available in only 45 per cent
of facilities (Seidenfeld et al., 2011).

14
Ethical review of this study was obtained by AIR in Washington, DC and the University of Zambia’s
Research Ethics Committee, and informed consent was obtained from all study participants.
Questionnaires and reports for the CGP are available on the Transfer Project website
(http://www.cpc.unc.edu/projects/transfer).
3.3 Measures
Our primary outcome for analysis is total fertility, or total number of children ever born to a woman.
Main respondents reported on this outcome for all women in the household aged 12 to 49 years
through a series of questions, including how many children born to the woman currently live in the
household, how many children born to the woman currently live elsewhere, and how many have died.
Additional questions assessed our secondary outcomes, including whether the woman is currently
pregnant and has she had a pregnancy that miscarried, was aborted, or ended in stillbirth. We examine
this combined outcome (miscarriage/abortion/stillbirth) as it may be an indicator of pregnancy
intentions (however unrealized). For example, if women are actively trying to get pregnant to
maintain, increase, or obtain cash benefits, we may see an increase in miscarriage and stillbirth as
pregnancies increase overall.
The hypothesized impacts on abortion are ambiguous because cash may increase access to facilities
where abortions can be obtained, or they may also increase access to contraception, thus decreasing
the need for abortions. We are unable to examine these outcomes separately, as they were asked in
combination in the questionnaire, due to the sensitive nature of and stigma surrounding miscarriage,
abortion, and stillbirth. Finally, we created a variable indicating ever been pregnant if the answer to
any of these questions was ‘yes’ or if total fertility was reported as greater than zero. Responses to the
question of miscarriage, abortion, or stillbirth may suffer from under-reporting due to the sensitive
nature of this topic, but we have no reason to believe under-reporting would have systematically
differed between treatment and control households. Finally, in 36 and 48 month follow-up surveys,
main respondents were asked about their current modern contraceptive use; this information is not
available for other females in the household.
We use additional individual- and household-level characteristics as measured at baseline in our
analysis. These include highest educational attainment (in years), marital status (never married,
separated or divorced, married or co-habiting), log of household size (continuous), district (Kaputa,
Shangombo, and Kalabo), log of distance to nearest food market (kilometres), and contemporaneous
prices for a basket of commonly-used goods (maize, rice, beans, oil, sugar, salt, toilet soap).
3.4 Methodology
The key evaluation challenge for examining fertility outcomes is that complete fertility information was
not collected at baseline. Thus, rather than implementing a DD approach, we rely on the successful
randomization of the programme and conduct cross-sectional analysis only. Findings from the baseline
evaluation report indicate successful randomization (Zambia CGP Evaluation Team, 2011). Attrition
analyses were also conducted to examine general attrition and selective attrition based on individual-
and household-level characteristics at baseline.

15
To examine the total number of children ever born alive, we used Poisson regression models given the
count distribution of number of births, which are non-negative and right skewed. The Poisson model is
specified as follows (Verbeek, 2008):
(1) 𝑃{𝑦𝑖 = 𝑦|𝑥𝑖} =𝑒−𝜆𝑖𝜆𝑖
𝑦
𝑦!
where 𝑦𝑖 indicates number of live births at for individual i and 𝜆𝑖= exp{𝑋𝛽}, X is a vector of covariates,
and 𝛽is a vector of parameters to be estimated. The same control variables for equation (2) were used
in these models.
Next, we examined differences cross-sectionally between women of reproductive age residing in
control and treatment households at 24, 36 and 48 months with respect to the following fertility-
related outcomes using multivariate linear probability models: 1) currently pregnant, 2) ever been
pregnant, and 3) ever had pregnancy ending in miscarriage/abortion/still birth. These models were
specified as follows:
(2) 𝑌𝑖 = 𝛽0 + 𝛽1𝑇𝑅𝐸𝐴𝑇 + 𝑋𝛽 + 𝜀𝑖
where 𝑌𝑖 is the outcome of interest for woman i, TREAT is a binary indicator equal to 1 if the woman
lives in a treatment household and equal to zero otherwise, X is a vector of covariates, 𝛽is a vector of
parameters to be estimated, and 𝜀𝑖 is the error term. Controls used in these models included woman’s
current age, highest educational attainment at baseline, marital status at baseline, log of household
size at baseline, district, log of distance to nearest food market at baseline, and a basket of
contemporaneous prices (maize, rice, beans, oil, sugar, salt, toilet soap). We use control characteristics
measured at baseline to account for the possibility that the programme impacted background
characteristics. Although we collected fertility information for women aged 12 to 49, we limit our
analysis to women aged 15 to 49, both for comparability of fertility outcomes with existing studies and
Demographic and Health Surveys (DHS), and because fertility of girls 12 to 14 is a relatively rare event
in our sample.
Next, among main respondents in the household surveys, we examined current use of modern
contraception at the 36 and 48-month follow-up waves using linear probability models (contraception
information was not collected before 36 months). We conduct several robustness checks, including
running our analysis separately on target beneficiary women and other non-beneficiary women in both
treatment and control households (average ages were 30 and 20, respectively, at the 24-month follow-
up), as well as among women aged 24 years and under at each wave. The former is to test if impacts
vary based on whether or not the specific woman in question is receiving cash directly versus an
overall income effect within the household. The latter is to test if younger women aged 15 to 24 have
differential impacts, which are likely to be a result primarily of delaying first births.
Finally, as a robustness check, we built a household-level panel with variables indicating the total
number of children in each household aged 0-1 years and 2-4 years. We also created these variables
sex-segregated. We conducted difference-in-difference analyses using Poisson models for each of the

16
aforementioned indicators. Household-level controls used in these models included baseline values for
main respondent’s current age, highest educational attainment at baseline, marital status at baseline,
log household size, district, log of distance to nearest food market and a basket of contemporaneous
prices.
4. RESULTS
4.1 Summary statistics
Individual-level attrition analysis by wave are presented in Appendix 1. Panel A indicates that, in the
24-month panel, there is no evidence of selective attrition. Panels B and C indicate that there is some
evidence of selective attrition based on highest school grade attained. Treatment women lost to
follow-up had higher levels of education at baseline (3.4 years v. 2.6 among control).
Summary characteristics of women in our analysis sample are presented in Table 1. The average age of
women studied was 28, ranging from 15 to 49 years. Approximately 60 (59) per cent of treatment
(control) women were married, and 28 (27) per cent of treatment (control) women were never
married at baseline. We see statistically significant differences at baseline for being separated or
divorced (approximately 12 and 15 per cent of women in treatment and control households were
separated or divorced; p<0.05) and highest school grade attained (3.4 years among control women
and 3.8 years among treatment women; p<0.05).
Table 2 presents means of fertility and related outcomes over the three waves examined. Columns 1
through 4 are for the overall sample for analysis, by treatment arm, and Columns 5 through 8 refer to
the sub-sample of main respondents (intended recipients). Given that each wave was a cross-sectional
analysis, girls younger than 15 years subsequently “aged into” the sample analysed across waves, and
since the relative number of young women is larger compared to older women (so more were aging in
than aging out), the sample size grew over time (from 2,669 in the 24-month survey to 3,025 in the 48-
month survey). This also means that lifetime experience of some means (such as currently and ever
pregnant) decreased over time since girls of 15 to 17 have often not started childbearing. At 24
months, average total number of children ever born to women in our sample was 3.24 in the sample
(3.32 among control women and 3.15 among treatment women; p>0.10). Among control and
treatment women, respectively, means were 3.24 and 3.13 at 36 months (p>0.10) and 3.31 and 3.28 at
48 months (p>0.10). By 24 and 36 month follow-ups, treatment women were four and three
percentage points less likely to have ever been pregnant (p<0.05), but this difference was no longer
significant at 48 months. At 24 and 48 months, treatment women reported being less likely to have
had an abortion, miscarriage or stillbirth (3 and 2 percentage points, respectively; p<0.05). As
expected, Columns 5 through 8 indicate that total fertility among beneficiaries is higher than the
means for all women in the full sample (3.98 and 3.91 among control and treatment women,
respectively, at 24 months; means at 36 months were 4.14 and 4.16, respectively and at 48 months
were 4.28 and 4.37, respectively; p>0.10 for all waves). At 36 months, 39 per cent of control and 37
per cent of treatment women were using a modern method of contraception (p>0.10), and this rose to
51 and 54 per cent, respectively, at 48 months (p>0.10). These dramatic increases in a short period

17
were mirrored in national statistics estimated from population-based DHS, though our estimates are
slightly higher than reported levels of contraceptive use from DHS in the provinces studied.2
4.2 Programme impacts on fertility outcomes
In multivariate Poisson regression models, we find no positive programme impacts at any wave on
total number of births to women (Table 3, Column 1). These findings are robust to additional analyses,
including among main respondents only (Column 5) and other women in treatment and control
households (Appendix 2).3 Table 4 (Column 1) indicates that the programme had a negative impact
(p<.10) on fertility among women aged under 25 years at 36 months (young women in treatment
households had 10 per cent fewer births [exp(-0.107)=0.90] compared to those in control households,
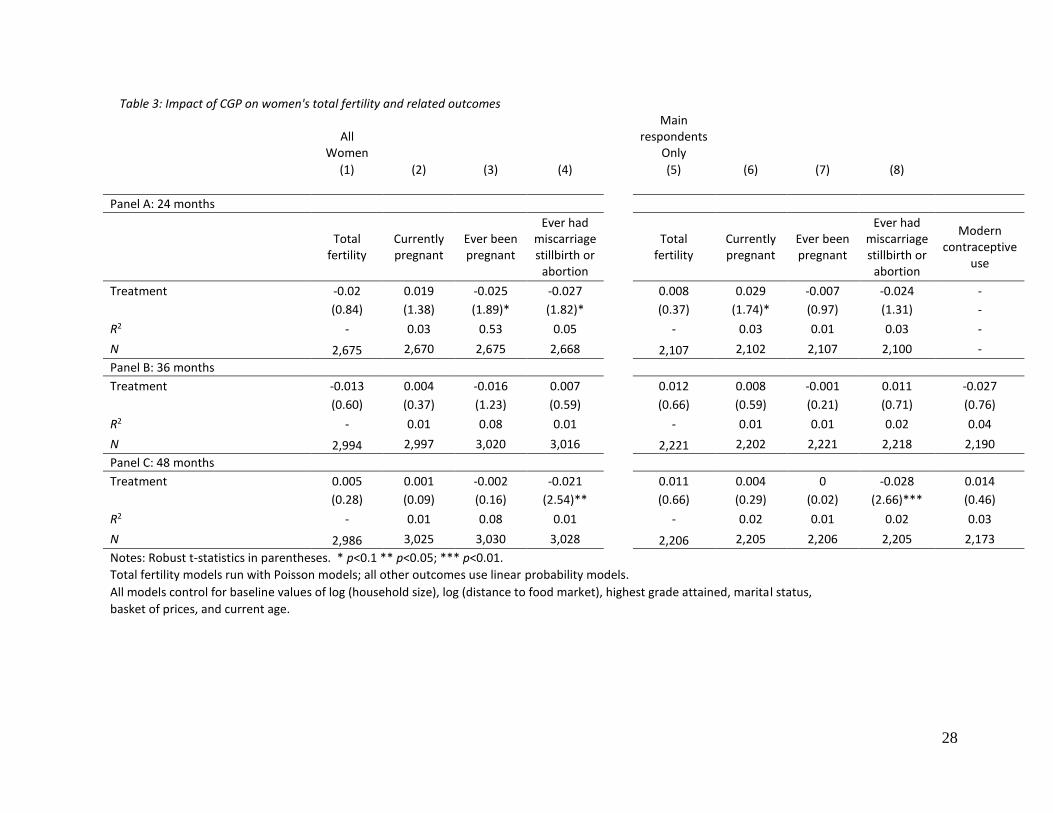
however impacts were not significant at 24 or 48 months. Table 3 shows there are negative
programme impacts on ever having been pregnant at 24 months (treatment women were 2.5
percentage points less likely to have ever been pregnant; p<.10) and on ever having had an
abortion/miscarriage/stillbirth at 24 and 48 months (�̂�=-0.027, p<.10 at 24 months; �̂�=-0.021, p<.05 at
48 months) using linear probability models among the full sample.
Table 3 (Column 6) indicates that among beneficiary women, treatment equated with 2.9 percentage
points more likely to be pregnant at the 24-month follow-up than control women, however this finding
was only marginally significant (p<0.10) and disappeared at later waves. The only other significant
impact among main respondents was a negative effect on the probability of having ever had a
miscarriage/stillbirth/abortion at 48 months (p<.001). Among other non-beneficiary women in
treatment households, at 24 months, women were 2.5 percentage points less likely to have had a
miscarriage/abortion/stillbirth (p<0.05), however this impact also disappeared at later waves
(Appendix 2).
4.3 Programme impacts on contraceptive use
Next we turn to an analysis of contraceptive use, a proximate determinant of fertility (Table 3, Column
9). By 48 months, contraceptive use had increased dramatically among both groups in our sample
(from 37 to 54 per cent among treatment women and from 39 to 51 per cent among control women;
Table 2, Columns 6 and 7), and this is in line with overall increases in contraceptive use at the national
level. We find no programme impacts on modern contraceptive use at 36 or 48 months.
4.4 Programme impacts on household composition
Household-level attrition analyses are presented in Appendix 3. Across 24-, 36- and 48-month follow-
up there is no evidence of selective attrition based on individual- and household-level characteristics,
with the exception of baseline household size, as compared between treatment and control
households which attrited by 48 months (p<.05; control households that attrited were larger at
2 According to DHS conducted in 2007 and in 2003, in provinces where study districts were located, modern contraceptive use among currently married/co-habiting women increased from 16.9 to 32.5% in Northern Province and from 23 to 31.7% in Western Province. Nationally, modern contraceptive prevalence rates (CPR) increased from 32.7% in 2007 to 45% in 2013 among currently married/co-habiting women. 3Sample sizes for fertility-related outcomes differ due to missing values for currently pregnant and ever had miscarriage, stillbirth, abortion. We calculated ever pregnant based on whether any of the fertility information was provided.

18
baseline than treatment households that attrited). There was no evidence of selective attrition based
on this indicator at 24- or 36-month follow-up waves.
Appendix 4 presents summary statistics for the number of children aged 0 to 4 years living in
households by treatment arm (Panel A). Panels B and C present these statistics disaggregated by
gender. The mean number of children aged 0 to 1 decreases over time, as expected. The average
number of children aged 0 to 4 years at baseline was 1.92 and 1.88 in control and treatment
households, respectively, and 1.55 at 48 months in both treatment and control households.
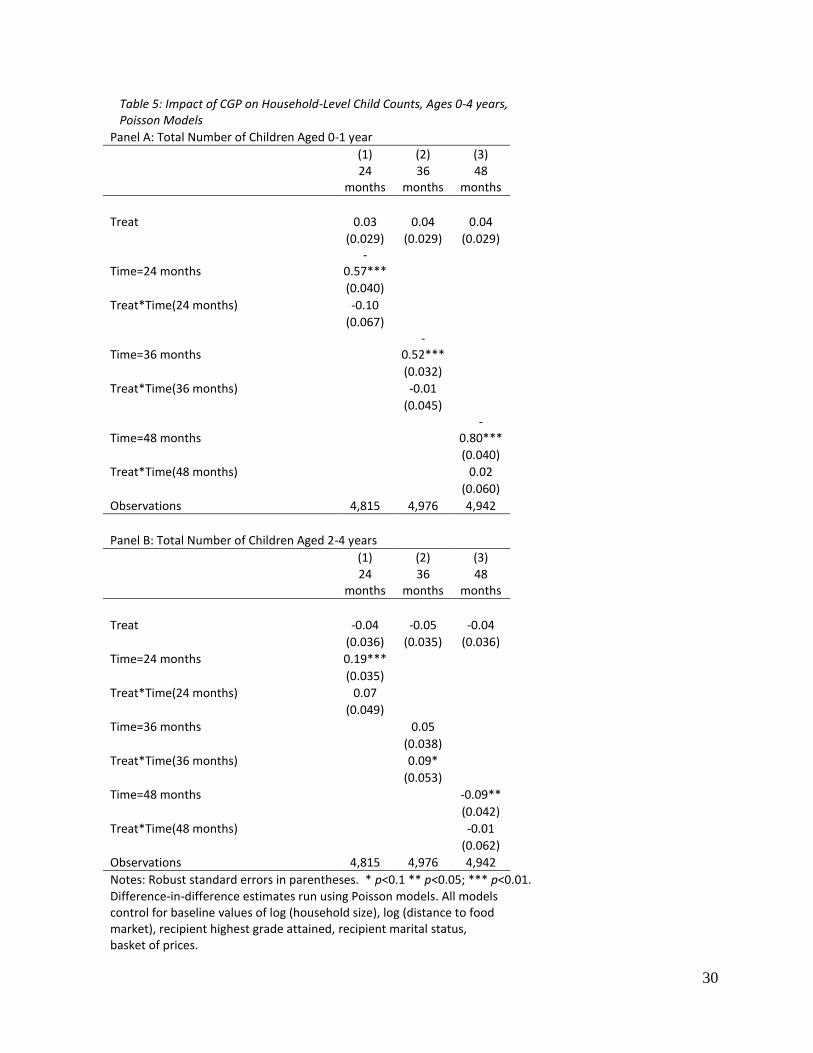
Table 5 (Panels A and B) presents DD estimates from our household-level analysis of total number of
children aged 0 to 4 years living in the household using Poisson regression models. The programme
had no impact on total number of children aged 0 to 1 years living in treatment households at any of
the waves examined as (Table 5, Panel A). This is consistent with our findings above that the
programme had no impact on fertility in the individual-women level analyses. Panel B (Column 2)
indicates that the programme had a marginally significant, positive impact on the total number of
children aged two to four years living in the households at the 36-month wave (�̂�=0.09, SE=0.053); this
translates to approximately 9 per cent more children in this age group in treatment households [exp(-
0.0.0751)=1.09]. There were no significant impacts on number of children aged 2 to 4 years in
households at 24 or 48 months (Columns 2 and 3).
We also replicated this analysis on sex-disaggregated variables and found a marginally significant
positive impact on the number of female children aged 2 to 4 years living in the households at 24
months (�̂�=0.13, SE=0.072; Appendix 5, Panel B, Column 1) and a positive impact at 36 months
(�̂�=0.18, SE=0.082; Appendix 5, Panel B, Column 2). There were no programme impacts on the
number of boys in this age group, nor were there any significant impacts on number of children of
either gender aged 0 to 1 year.
Finally, when examining total count of orphans aged 0 to 4 years in households, we found no
programme impacts on total number of orphans living in households. However, total orphan counts
(aged 0 to 4 years) in these households were very low (0.13 total per household; results not presented;
available upon request).
5. DISCUSSION AND CONCLUSION
SCTs are rapidly expanding across Africa as an important tool in governments’ social protection
strategies. Positive impacts on a range of outcomes have been demonstrated, however countries
continue to struggle with targeting and other design decisions. A critical barrier to scaling up
programmes is policymakers’ fears that SCTs may create unintended incentives to increase
childbearing, in settings where poverty and fertility are high. In this study we have demonstrated,
using a large-sample social experiment that an SCT targeted to households with children under the age
of three had no impacts on fertility over a four-year period. We have further shown that supply side
factors are also important in the materialization of impacts of transfers, which may stimulate demand.
Among young women under 25 years, fertility actually decreased after 24 months. This is the first
study to evaluate fertility impacts of a UCT as reported from fertility histories of individual women in in

19
Africa using an experimental design. Existing studies have used either household roster information,
thus missing out on children who may have died or been stillborn (Kenya and Malawi), or were
conducted using non-experimental methods (South Africa).
From a theoretical perspective, our results suggest the income effect on the demand for quantity of
children is counterbalanced by other factors, including ability to achieve smaller ideal family sizes or
increases in investments (quality) in existing children. Income shocks such as SCTs may increase
demand for quality of children, or alternatively it may allow women to achieve their existing
preferences for fewer children, and both may induce couples to increase contraceptive use. However,
if supply constraints are binding (i.e., there is no availability of family planning at facilities or existence
of staffed facilities), then programme impacts may be limited in reaching their full potential. As a
nation, Zambia appears to have made great strides in addressing unmet need for contraception. Use of
modern contraceptive methods has increased dramatically in Zambia over the past seven years, and
thus changes in contraceptive use may be largely unrelated to the programme and instead attributed
to factors at a national level. According to the Zambian DHS, modern contraceptive use among women
aged 15 to 49 increased in the study areas, from 16.9 to 32.5 per cent in Northern Province and 23 to
31.7 per cent in Western Province in 2007 and 2013/2014, respectively (Central Statistical Office (CSO),
Ministry of Health (MOH), Tropical Diseases Research Centre (TDRC), University of Zambia, & Inc.,
2009; Central Statistical Office (CSO) et al., 2014).
From a policy perspective, our findings are important because they demonstrate that a social
protection programme targeted to families with young children does not create the unintended
consequence of increased fertility. Investment in early childhood is critical, as this period is a key
development window, where chronic stressors (including poverty) can induce significant biological
changes with implications for individuals’ future trajectories (Danese & McEwen, 2012). Further,
increasing evidence shows the importance of early environment on the development of adolescent
and adult cognitive and non-cognitive skills, the former of which is a strong determinant of wages,
schooling, and social and economic success, while the latter also directly impacts wages and schooling,
but also impacts teenage pregnancy, smoking, crime and other aspects of social and economic life
(Heckman, 2007).
Our findings are consistent with existing literature from Kenya, Malawi, South Africa, Mexico, and
Nicaragua, which also found that SCTs did not increase fertility (Rosenberg et al., 2015; Stecklov &
Winters, 2011; Stecklov et al., 2007). Robustness checks found no programme impacts on the overall
number of children aged 0 to 4 in these households.
A limitation to our study is that we do not have complete fertility information as reported by women
at baseline. This prohibits the use of DD models in our fertility related analysis. However, we do have
information at all waves on number of children in the households based on the rosters, and we have
replicated our analysis at the individual- and household-levels and the two analysis approaches show
consistent results. Another limitation is that our fertility histories for all women aged 12 to 49 years
was reported by one main (female) respondent in the household. The fertility information for women
not directly reporting their own histories may be less reliable than for the main respondents. However,

20
these concerns are assuaged by the fact that we found consistent results between both groups when
examined separately, and that this is a common practice for large household surveys collecting a roster
of fertility information. A limitation to our analysis of contraceptive use is that we only ask one
question about current contraceptive use (“Are you currently using any method to limit or space your
births?”) and record response to which type of method the respondent is currently using, if applicable.
DHS and other surveys focused on reproductive health may use more comprehensive modules to
assess contraceptive use, first asking about knowledge of methods and then prompting for use of a
variety of types. Additionally, our information about community-level access is based on data
collected from facilities at baseline.
In conclusion, we have demonstrated that a large-scale government UCT programme targeted to
households with young children in a high poverty and high fertility setting does not increase fertility.
These findings should assuage the fears of policymakers who want to invest in this key development
window for children but fear unintended consequences as a result of the programme. This conclusion
is based on mean differences comparing groups of a randomized treatment and comparison women.
Therefore, it is still possible that there are individual women who hold the belief that they must have
additional children to maintain or gain eligibility; however, on a population level, there is no evidence
of this dynamic after four years of programme implementation. A key issue in the manifestation of
unintended incentives within programmes may be linked to programme enrolment and extension
rules, as well as overall programme sensitization efforts. If beneficiaries know the objectives and rules
around programme qualification – particularly if these are fixed at enrolment without the possibility to
increase benefits by subsequently increasing number of children in the household, programmes may
be more able to protect against unintended incentives. Future research should examine longer-term
impacts in various settings, including potential protection effects of the programme among adolescent
first pregnancy and transition to adulthood in beneficiary households.
21
REFERENCES
Ahmed, S., Li, Q., Liu, L., & Tsui, A. O. (2012). Maternal deaths averted by contraceptive use: an analysis of 172 countries. The Lancet, 380(9837), 111-125.
Arenas, E., Parker, S. W., Rubalcalva, L. N., & Teruel, G. M. (2015). Do Conditional Cash Transfer Programs Affect Fertility and Marriage? Long Term Impacts of a Mexican Cash Transfer Program. Paper presented at the Population Association of America Annual Meeting, San Diego, CA.
Baird, S., Chirwa, E., McIntosh, C., & Ozler, B. (2010). The short-term impacts of a schooling conditional cash transfer program on the sexual behavior of young women. Health Econ, 19 Suppl, 55-68.
Baird, S., McIntosh, C., & Özler, B. (2011). Cash or condition? Evidence from a cash transfer experiment. The Quarterly Journal of Economics, qjr032.
Becker, G. S. (1960). An economic analysis of fertility Demographic and economic change in developed countries (pp. 209-240): Columbia University Press.
Becker, G. S., & Lewis, H. G. (1974). On the interaction between the quantity and quality of children. Journal of Political Economy, 81(2), S279-S288.
Bongaarts, J. (2008). Fertility transitions in developing countries: Progress or stagnation? Studies in family planning, 39(2), 105-110.
Bongaarts, J., & Casterline, J. (2013). Fertility Transition: Is sub‐Saharan Africa Different? Population and development review, 38(s1), 153-168.
Bor, J. (2013). Cash Transfers and Teen Preganancy in South Africa: evidence from a natural experiment. Boston, MA: Boston University.
Cain, M. (1981). Risk and insurance: Perspectives on fertility and agrarian change in India and Bangladesh. Population and development review, 435-474.
Central Statistical Office (CSO), Ministry of Health (MOH), Tropical Diseases Research Centre (TDRC), University of Zambia, & Inc., M. I. (2009). Zambia Demographic and Health Survey 2007. Calverton, MD, USA: CSO and Macro International Inc.
Central Statistical Office (CSO), Ministry of Health (MOH), Tropical Diseases Research Centre (TDRC), University Teaching Hospital-Virology Laboratory, University of Zambia, & ICF International. (2014). Zambia Demographic and Heallth Survey 2013-2014. Calverton, MD, USA: CSO and ICF Macro,.
Cleland, J., Conde-Agudelo, A., Peterson, H., Ross, J., & Tsui, A. (2012). Contraception and health. The Lancet, 380(9837), 149-156.
Danese, A., & McEwen, B. S. (2012). Adverse childhood experiences, allostasis, allostatic load, and age-related disease. Physiology & behavior, 106(1), 29-39.
Dewey, K. G., & Begum, K. (2011). Long‐term consequences of stunting in early life. Maternal & Child Nutrition, 7(s3), 5-18.
Easterlin, R. A. (1975). An economic framework for fertility analysis. Studies in family planning, 54-63.

22
Falcão Silva, T. (2015, 24 June). [Email on Brazil's Bolsa Familia from Secretaria Extraordinária para Superação da Extrema Pobreza, Ministério do Desenvolvimento Social e Combate à Fome].
Goldblatt, B. (2003). Teen pregnancy and abuse of the Child Support Grant. Addressing the myths and stereotypes. Agenda, 17(56), 79-83.
Gulemetova-Swan, M. (2009). Evaluating the impact of conditional cash transfer programs on adolescent decisions about marriage and fertility: the case of oportunidades.
Handa, S., Halpern, C. T., Pettifor, A., & Thirumurthy, H. (2014). The government of Kenya's cash transfer program reduces the risk of sexual debut among young people age 15-25. PLoS One, 9(1), e85473-e85473.
Handa, S., Lawlor, K., Seidenfeld, D., & Zambia CGP Evaluation Team. (2015). Cash Transfers and Climate-resilient Development: Evidence from Zambia’s Child Grant Programme. Innocenti Working Papers 2015-03 Florence, Italy: UNICEF Office of Research - Innocenti.
Handa, S., Peterman, A., & Kenya OVC-CT Evaluation Team. (2015). Impact of the Kenya Cash Transfer for Orphans and Vulnerable Children on Early Pregnancy and Marriage of Adolescent Girls. . UNICEF Office of Research - Innocenti. Florence, Italy.
Heckman, J. J. (2007). The economics, technology, and neuroscience of human capability formation. Proceedings of the national Academy of Sciences, 104(33), 13250-13255.
Heinrich, C., Hoddinott, J., & Samson, M. (2015). Reducing Adolescent Risky Behaviors in a High-Risk Context: The Effects of Unconditional Cash Transfers in South AFrica.
Heinrich, C., Hoddinott, J., Samson, M., Mac Quene, K., van Nikerk, I., & Renaud, B. (2012). THe South African Child Support Grant Impact Assessment. South Africa: Department of Social Development, South African Social Security Agency, UNICEF.
Hochfeld, T., & Plagerson, S. (2011). The social construction of the cash transfer mother in Soweto, South Africa: the emergence of social stigma? : Johannesburg: Centre for Social Development in Africa.
Holmqvist, G. (2011). Fertility impact of high-coverage public pensions in sub-Saharan Africa. Global Social Policy, 11(2-3), 152-174.
Kim, J., & Prskawetz, A. (2010). External shocks, household consumption and fertility in Indonesia. Population research and policy review, 29(4), 503-526.
Lawrance, E. C. (1991). Poverty and the rate of time preference: evidence from panel data. Journal of Political Economy, 54-77.
Leroy, J. L., Ruel, M., Habicht, J.-P., & Frongillo, E. A. (2014). Linear growth deficit continues to accumulate beyond the first 1000 days in low-and middle-income countries: global evidence from 51 national surveys. The Journal of nutrition, 144(9), 1460-1466.
Macours, K., Schady, N., & Vakis, R. (2012). Cash transfers, behavioral changes, and cognitive development in early childhood: Evidence from a randomized experiment. American Economic Journal: Applied Economics, 4(2), 247-273.
23
Malawi SCT Evaluation Team. (2015). Malawi Social Cash Transfer Programme Midline Impact Evaluation Report: Carolina Population Center; UNICEF Office of Research; Centre for Social Research, University of Malawi.
McQueston, K., Silverman, R., & Glassman, A. (2013). The Efficacy of Interventions to Reduce Adolescent Childbearing in Low‐and Middle‐Income Countries: A Systematic Review. Studies in family planning, 44(4), 369-388.
Ministry of Social Development and Fight against Hunger. (2012). Evolution of Fertility Rates by Region and per capita Household Income between 2000 and 2010. Technical Note No. 067/2012/GAB/SAGI/MDS.
Namboodiri, N. K. (1972). Some observations on the economic framework for fertility analysis. Population Studies, 26(2), 185-206.
Rafalitnanana, H., & Westoff, C. F. (2000). Potential Effects on Fertility and Child Health and Survival of Birth‐spacing Preferences in Sub‐Saharan Africa. Studies in family planning, 31(2), 99-110.
Richter, M. (2009). Bread, baby shoes or blusher? Myths about social grants and'lazy'young mothers. SAMJ: South African Medical Journal, 99(2), 94-94.
Rosenberg, M., Pettifor, A., Nguyen, N., Westreich, D., Bor, J., Barnighausen, T., . . . Kahn, K. (2015). Relationship between receipt of a social protection grant for a child and second pregnancy rates among South African women.
Rutstein, S. O. (2005). Effects of preceding birth intervals on neonatal, infant and under-five years mortality and nutritional status in developing countries: evidence from the demographic and health surveys. International Journal of Gynecology & Obstetrics, 89, S7-S24.
Sedgh, G., Singh, S., & Hussain, R. (2014). Intended and unintended pregnancies worldwide in 2012 and recent trends. Studies in family planning, 45(3), 301-314.
Seidenfeld, D., Handa, S., Prencipe, L., Tembo, G., & Sherman, D. (2011). Zambia's Child Grant Program: Baseline Report. Washington, DC: American Institutes for Research.
Stecklov, G., & Winters, P. (2011). Do Cash Transfers Impact Childbearing and Childrearing? Experimental Evidence from Sub-Saharan Africa. Working Paper.
Stecklov, G., Winters, P., Todd, J., & Regalia, F. (2007). Unintended effects of poverty programmes on childbearing in less developed countries: experimental evidence from Latin America. Population Studies, 61(2), 125-140.
Todd, J. E., Winters, P., & Stecklov, G. (2012). Evaluating the impact of conditional cash transfer programs on fertility: the case of the Red de Protección Social in Nicaragua. Journal of Population Economics, 25(1), 267-290.
Upadhyay, U. D., & Karasek, D. (2012). Women's empowerment and ideal family size: An examination of DHS empowerment measures in sub-Saharan Africa. International perspectives on sexual and reproductive health, 78-89.
Vekemans, M. (1997). Postpartum contraception: the lactational amenorrhea method. European J. of Contraception and Reproductive Healthcare, 2(2), 105-111.

24
Verbeek, M. (2008). A guide to modern econometrics: John Wiley & Sons.
Wilcox, B. L., Robbennolt, J. K., O'Keeffe, J. E., & Pynchon, M. E. (1996). Teen nonmarital childbearing and welfare: The gap between research and political discourse. Journal of Social Issues, 52(3), 71-90.
World Bank. (2015). The State of Social Safety Nets 2015 doi:10.1596/978-1-4648-0543-1. Washington, DC: World Bank.
Zambia CGP Evaluation Team. (2011). Zambia's Child Grant Program: Baseline Report. Washington, DC: American Institutes for Research.
Zambia CGP Evaluation Team. (2014). Zambia's Child Grant Program: 30-Month Impact Results. Washington, DC: American Institutes for Research.
Zambia CGP Evaluation Team. (2015). Zambia's Child Grant Program: 48 Month Impact Report. Washington, DC: American Institutes for Research.

25
Table 1.Baseline individual- and community-level characteristics by CGP treatment
(1) (2) (3) (4)
All Control Treatment Difference
Age in years 28.2 28.28 28.11 -0.17
(0.17) (0.26) (0.21) (0.33)
Highest grade attained (baseline) 3.62 3.4 3.83 0.42***
(0.13) (0.19) (0.18) (0.26)
Divorced/separated/widowed (baseline) 0.13 0.15 0.12 -0.03**
(0.01) (0.01) (0.01) (0.02)
Never married (baseline) 0.27 0.27 0.28 0.02
(0.02) (0.02) (0.02) (0.03)
Married/co-habiting (baseline) 0.59 0.59 0.6 0.01
(0.02) (0.03) (0.03) (0.04)
Log (household size) at baseline 1.9 1.89 1.91 0.02
(0.01) (0.02) (0.02) (0.03)
Shangombo District 0.28 0.29 0.28 -0.01
(0.04) (0.06) (0.06) (0.09)
Kaputa District 0.28 0.28 0.28 0
(0.04) (0.06) (0.06) (0.09)
log (distance to food market) at baseline 2.23 2.39 2.08 -0.31
(0.13) (0.18) (0.18) (0.25)
N 2,675 1,326 1,349
Standard errors in parenthesis. * p<0.1 ** p<0.05; *** p<0.01

26
Table 2. Means, women's fertility outcomes by CGP treatment status
(1) (2) (3) (4) (5) (6) (7) (8)
Panel A: 24-month All Women Main Respondents only
All Control Treatment Difference All Control Treatment Difference
Currently pregnant 0.11 0.11 0.12 0.01 0.14 0.13 0.14 0.02
(0.01) (0.01) (0.01) (0.02) (0.01) (0.01) (0.01) (0.01)
Ever pregnant 0.83 0.85 0.81 -0.04** 0.99 0.99 0.98 -0.01**
(0.01) (0.01) (0.01) (0.02) (0.00) (0.00) (0.01) (0.01)
Ever miscarried, aborted, had stillbirth 0.12 0.14 0.1 -0.04***
0.15 0.16 0.13 -0.04**
(0.01) (0.01) (0.01) (0.02) (0.01) (0.02) (0.01) (0.02)
Total #children ever born alive 3.24 3.32 3.15 -0.16 3.94 3.98 3.91 -0.07
(0.06) (0.09) (0.07) (0.11) (0.07) (0.09) (0.10) (0.09)
Currently using modern contraceptive - - - -
- - - -
N 2,669 1,324 1,345 2,096 1,054 1,042
Panel B: 36-month All Women Main Respondents only
All Control Treatment Difference All Control Treatment Difference
Currently pregnant 0.07 0.08 0.07 0.00 0.09 0.09 0.10 0.00
(0.00) (0.01) (0.01) (0.01) (0.01) (0.01) (0.01) (0.01)
Ever pregnant 0.8 0.82 0.78 -0.03** 1.00 1.00 1.00 0.00
(0.01) (0.01) (0.01) (0.01) (0.00) (0.00) (0.00) (0.00)
Ever miscarried, aborted, had stillbirth 0.06 0.06 0.05 0.00
0.07 0.07 0.07 0
(0.01) (0.01) (0.01) (0.01) (0.01) (0.01) (0.01) (0.01)
Total #children ever born alive 3.19 3.24 3.13 -0.1 4.15 4.14 4.16 0.03
(0.06) (0.07) (0.09) (0.09) (0.07) (0.09) (0.10) (0.09)
Currently using modern contraceptive - - - -
0.38 0.39 0.37 -0.02
(0.02) (0.02) (0.03) (0.02)
N 2,993 1,491 1,502 2,171 1,103 1,068
27
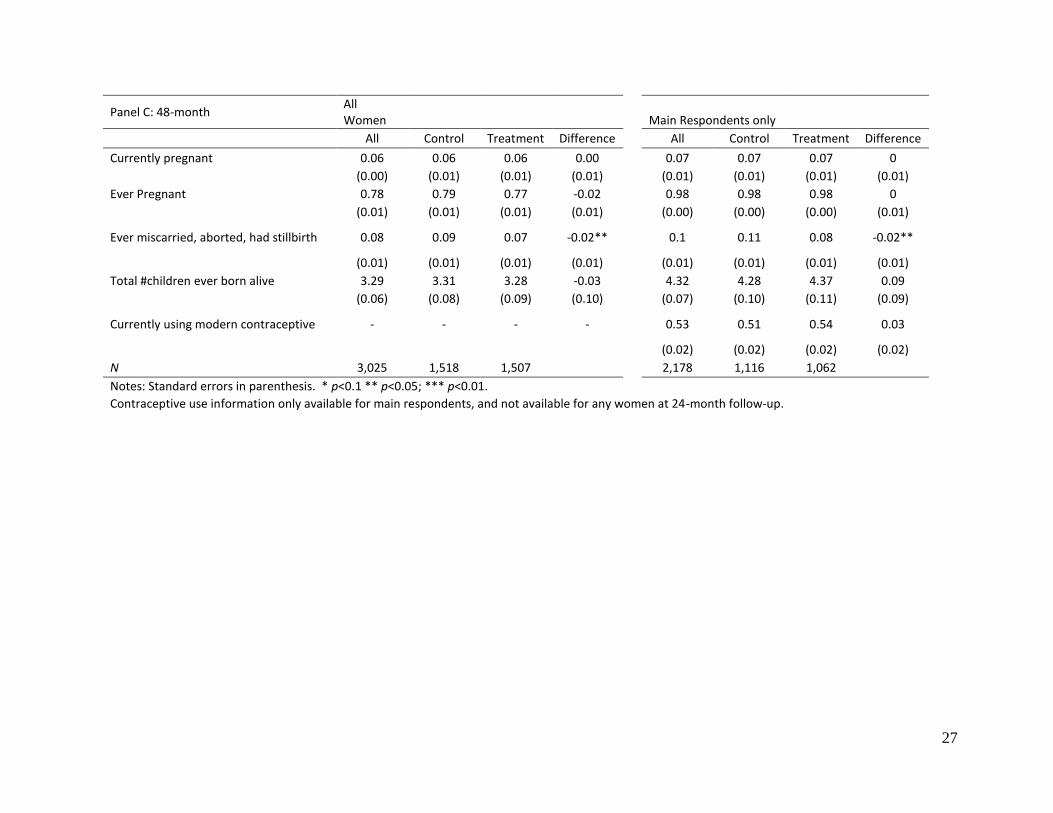
Panel C: 48-month All Women Main Respondents only
All Control Treatment Difference All Control Treatment Difference
Currently pregnant 0.06 0.06 0.06 0.00 0.07 0.07 0.07 0
(0.00) (0.01) (0.01) (0.01) (0.01) (0.01) (0.01) (0.01)
Ever Pregnant 0.78 0.79 0.77 -0.02 0.98 0.98 0.98 0
(0.01) (0.01) (0.01) (0.01) (0.00) (0.00) (0.00) (0.01)
Ever miscarried, aborted, had stillbirth 0.08 0.09 0.07 -0.02**
0.1 0.11 0.08 -0.02**
(0.01) (0.01) (0.01) (0.01) (0.01) (0.01) (0.01) (0.01)
Total #children ever born alive 3.29 3.31 3.28 -0.03 4.32 4.28 4.37 0.09
(0.06) (0.08) (0.09) (0.10) (0.07) (0.10) (0.11) (0.09)
Currently using modern contraceptive - - - -
0.53 0.51 0.54 0.03
(0.02) (0.02) (0.02) (0.02)
N 3,025 1,518 1,507 2,178 1,116 1,062
Notes: Standard errors in parenthesis. * p<0.1 ** p<0.05; *** p<0.01.
Contraceptive use information only available for main respondents, and not available for any women at 24-month follow-up.
28
Table 3: Impact of CGP on women's total fertility and related outcomes
All Women
Main respondents
Only
(1) (2) (3) (4) (5) (6) (7) (8)
Panel A: 24 months
Total
fertility Currently pregnant
Ever been pregnant
Ever had miscarriage stillbirth or
abortion
Total
fertility Currently pregnant
Ever been pregnant
Ever had miscarriage stillbirth or
abortion
Modern contraceptive
use
Treatment -0.02 0.019 -0.025 -0.027 0.008 0.029 -0.007 -0.024 -
(0.84) (1.38) (1.89)* (1.82)* (0.37) (1.74)* (0.97) (1.31) -
R2 - 0.03 0.53 0.05 - 0.03 0.01 0.03 -
N 2,675 2,670 2,675 2,668 2,107 2,102 2,107 2,100 -
Panel B: 36 months
Treatment -0.013 0.004 -0.016 0.007 0.012 0.008 -0.001 0.011 -0.027
(0.60) (0.37) (1.23) (0.59) (0.66) (0.59) (0.21) (0.71) (0.76)
R2 - 0.01 0.08 0.01 - 0.01 0.01 0.02 0.04
N 2,994 2,997 3,020 3,016 2,221 2,202 2,221 2,218 2,190
Panel C: 48 months
Treatment 0.005 0.001 -0.002 -0.021 0.011 0.004 0 -0.028 0.014
(0.28) (0.09) (0.16) (2.54)** (0.66) (0.29) (0.02) (2.66)*** (0.46)
R2 - 0.01 0.08 0.01 - 0.02 0.01 0.02 0.03
N 2,986 3,025 3,030 3,028 2,206 2,205 2,206 2,205 2,173
Notes: Robust t-statistics in parentheses. * p<0.1 ** p<0.05; *** p<0.01.
Total fertility models run with Poisson models; all other outcomes use linear probability models.
All models control for baseline values of log (household size), log (distance to food market), highest grade attained, marital status,
basket of prices, and current age.

29
Table 4: Impact of CGP on women's total fertility and related outcomes, Women Aged <25 years
Panel A: 24 months
(1) (2) (3) (4)
Total
fertility Currently pregnant
Ever been pregnant
Ever had miscarriage stillbirth or
abortion
Treatment -0.09 0.024 -0.02 -0.021
(1.31) (1.17) (0.63) (1.38)
R2 - 0.03 0.34 0.02
N 1,003 1,005 1,006 1,004
Panel B: 36 months
Treatment -0.107 0.009 0.006 0.011
(1.86)* (0.68) (0.22) (1.06)
R2 - 0.03 0.26 0.02
N 1,083 1,092 1,106 1,104
Panel C: 48 months
Treatment -0.049 -0.013 0.011 0.012
(0.59) (0.96) (0.41) (1.19)
R2 0.02 0.26 0.03
N 1,002 1,026 1,029 1,028
Notes: Robust t-statistics in parentheses. * p<0.1 ** p<0.05; *** p<0.01.
Total fertility models run with Poisson models; all other outcomes use linear probability models. All models control for baseline values of log (household size), log (distance to food market), highest grade attained, marital status, basket of prices, and current age.
30
Table 5: Impact of CGP on Household-Level Child Counts, Ages 0-4 years, Poisson Models
Panel A: Total Number of Children Aged 0-1 year
(1) (2) (3)
24
months 36
months 48
months
Treat 0.03 0.04 0.04
(0.029) (0.029) (0.029)
Time=24 months -
0.57***
(0.040)
Treat*Time(24 months) -0.10
(0.067)
Time=36 months -
0.52***
(0.032)
Treat*Time(36 months) -0.01
(0.045)
Time=48 months -
0.80***
(0.040)
Treat*Time(48 months) 0.02
(0.060)
Observations 4,815 4,976 4,942
Panel B: Total Number of Children Aged 2-4 years
(1) (2) (3)
24
months 36
months 48
months
Treat -0.04 -0.05 -0.04
(0.036) (0.035) (0.036)
Time=24 months 0.19***
(0.035)
Treat*Time(24 months) 0.07
(0.049)
Time=36 months 0.05
(0.038)
Treat*Time(36 months) 0.09*
(0.053)
Time=48 months -0.09**
(0.042)
Treat*Time(48 months) -0.01
(0.062)
Observations 4,815 4,976 4,942
Notes: Robust standard errors in parentheses. * p<0.1 ** p<0.05; *** p<0.01.
Difference-in-difference estimates run using Poisson models. All models control for baseline values of log (household size), log (distance to food market), recipient highest grade attained, recipient marital status, basket of prices.
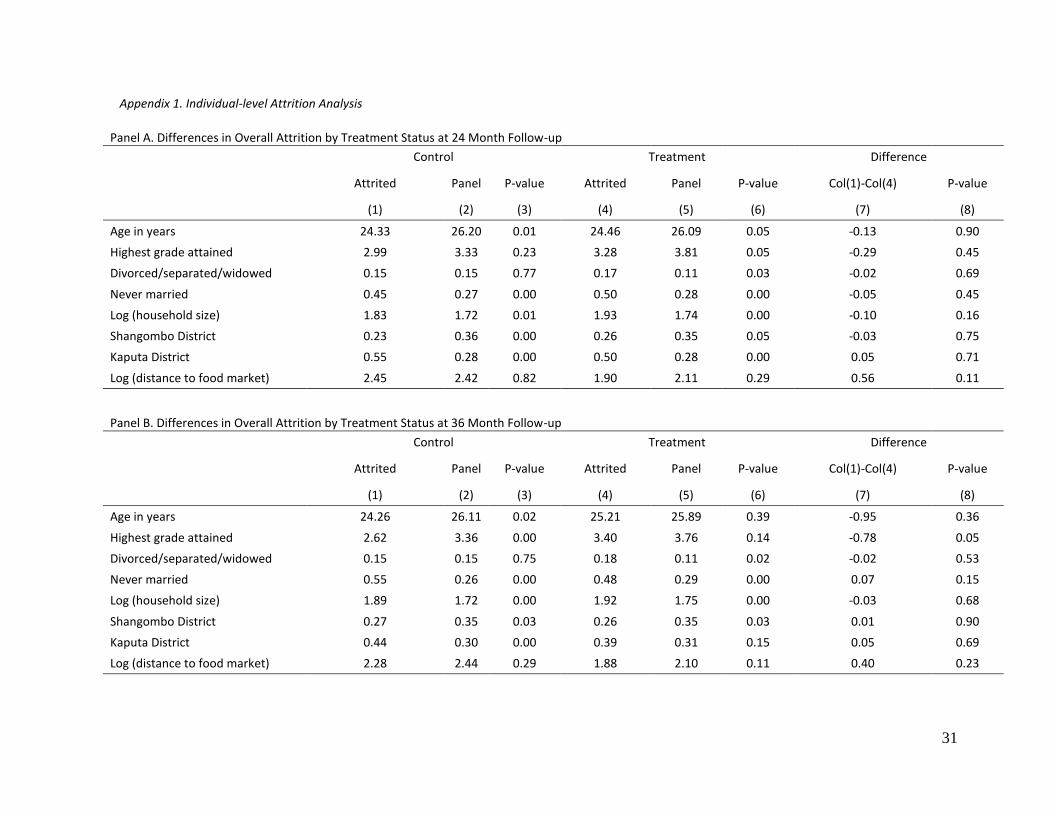
31
Appendix 1. Individual-level Attrition Analysis
Panel A. Differences in Overall Attrition by Treatment Status at 24 Month Follow-up
Control Treatment Difference
Attrited Panel P-value Attrited Panel P-value Col(1)-Col(4) P-value
(1) (2) (3) (4) (5) (6) (7) (8)
Age in years 24.33 26.20 0.01 24.46 26.09 0.05 -0.13 0.90
Highest grade attained 2.99 3.33 0.23 3.28 3.81 0.05 -0.29 0.45
Divorced/separated/widowed 0.15 0.15 0.77 0.17 0.11 0.03 -0.02 0.69
Never married 0.45 0.27 0.00 0.50 0.28 0.00 -0.05 0.45
Log (household size) 1.83 1.72 0.01 1.93 1.74 0.00 -0.10 0.16
Shangombo District 0.23 0.36 0.00 0.26 0.35 0.05 -0.03 0.75
Kaputa District 0.55 0.28 0.00 0.50 0.28 0.00 0.05 0.71
Log (distance to food market) 2.45 2.42 0.82 1.90 2.11 0.29 0.56 0.11
Panel B. Differences in Overall Attrition by Treatment Status at 36 Month Follow-up
Control Treatment Difference
Attrited Panel P-value Attrited Panel P-value Col(1)-Col(4) P-value
(1) (2) (3) (4) (5) (6) (7) (8)
Age in years 24.26 26.11 0.02 25.21 25.89 0.39 -0.95 0.36
Highest grade attained 2.62 3.36 0.00 3.40 3.76 0.14 -0.78 0.05
Divorced/separated/widowed 0.15 0.15 0.75 0.18 0.11 0.02 -0.02 0.53
Never married 0.55 0.26 0.00 0.48 0.29 0.00 0.07 0.15
Log (household size) 1.89 1.72 0.00 1.92 1.75 0.00 -0.03 0.68
Shangombo District 0.27 0.35 0.03 0.26 0.35 0.03 0.01 0.90
Kaputa District 0.44 0.30 0.00 0.39 0.31 0.15 0.05 0.69
Log (distance to food market) 2.28 2.44 0.29 1.88 2.10 0.11 0.40 0.23

32
Panel C. Differences in Overall Attrition by Treatment Status at 48 Month Follow-up
Control Treatment Difference
Attrited Panel P-value Attrited Panel P-value Col(1)-Col(4) P-value
(1) (2) (3) (4) (5) (6) (7) (8)
Age in years 25.11 26.06 0.24 25.22 25.93 0.28 -0.11 0.91
Highest grade attained 2.64 3.40 0.00 3.40 3.79 0.11 -0.76 0.04
Divorced/separated/widowed 0.15 0.15 0.97 0.16 0.11 0.11 -0.01 0.80
Never married 0.53 0.25 0.00 0.52 0.27 0.00 0.01 0.88
Log (household size) 1.92 1.70 0.00 1.93 1.74 0.00 -0.01 0.86
Shangombo District 0.36 0.34 0.58 0.32 0.34 0.64 0.04 0.73
Kaputa District 0.36 0.31 0.34 0.39 0.30 0.16 -0.04 0.77
Log (distance to food market) 2.19 2.47 0.02 1.82 2.13 0.06 0.36 0.25
P-values are reported from Wald tests on the equality of means of Treatment and Control for each variable.
Standard errors are clustered at the community level.
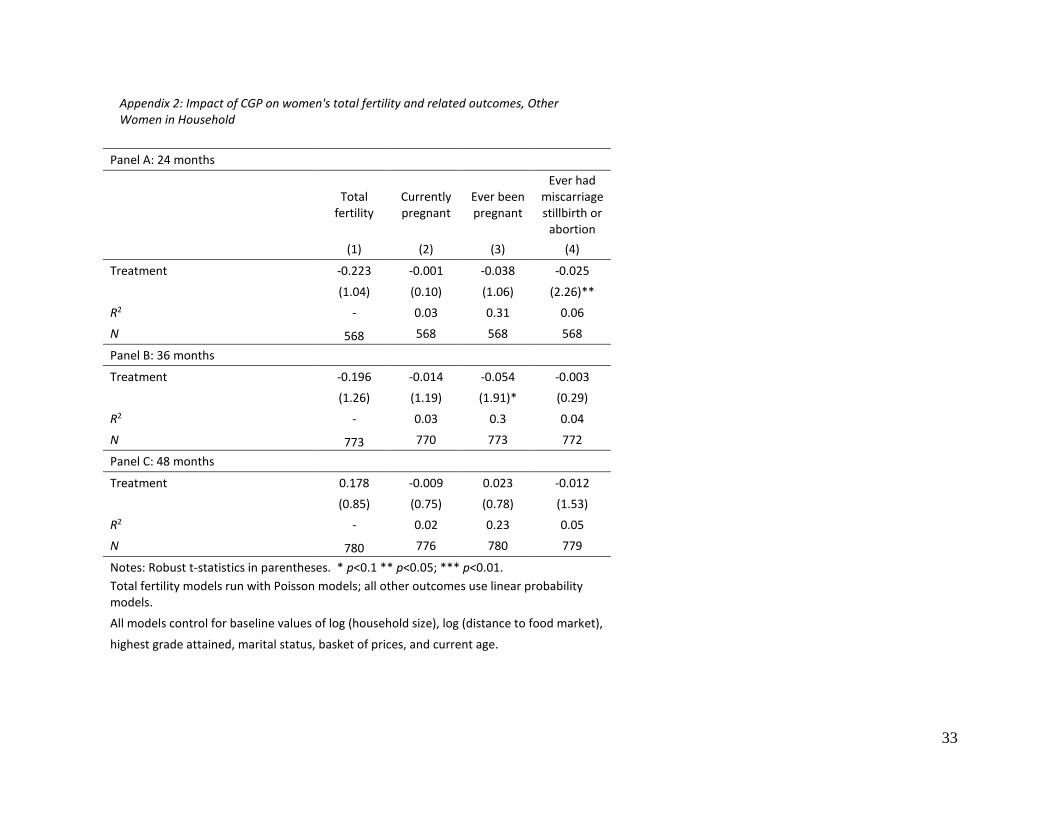
33
Appendix 2: Impact of CGP on women's total fertility and related outcomes, Other Women in Household
Panel A: 24 months
Total
fertility Currently pregnant
Ever been pregnant
Ever had miscarriage stillbirth or
abortion
(1) (2) (3) (4)
Treatment -0.223 -0.001 -0.038 -0.025
(1.04) (0.10) (1.06) (2.26)**
R2 - 0.03 0.31 0.06
N 568 568 568 568
Panel B: 36 months
Treatment -0.196 -0.014 -0.054 -0.003
(1.26) (1.19) (1.91)* (0.29)
R2 - 0.03 0.3 0.04
N 773 770 773 772
Panel C: 48 months
Treatment 0.178 -0.009 0.023 -0.012
(0.85) (0.75) (0.78) (1.53)
R2 - 0.02 0.23 0.05
N 780 776 780 779
Notes: Robust t-statistics in parentheses. * p<0.1 ** p<0.05; *** p<0.01.
Total fertility models run with Poisson models; all other outcomes use linear probability models.
All models control for baseline values of log (household size), log (distance to food market),
highest grade attained, marital status, basket of prices, and current age.
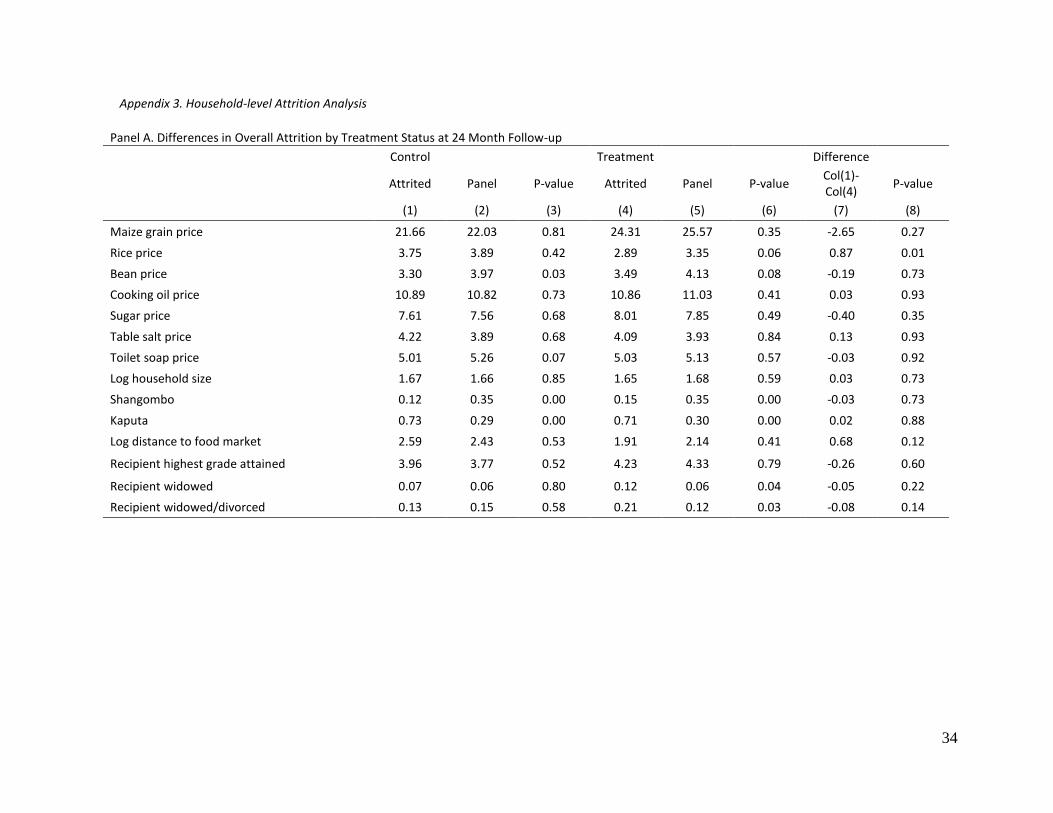
34
Appendix 3. Household-level Attrition Analysis
Panel A. Differences in Overall Attrition by Treatment Status at 24 Month Follow-up
Control Treatment Difference
Attrited Panel P-value Attrited Panel P-value Col(1)-Col(4)
P-value
(1) (2) (3) (4) (5) (6) (7) (8)
Maize grain price 21.66 22.03 0.81 24.31 25.57 0.35 -2.65 0.27
Rice price 3.75 3.89 0.42 2.89 3.35 0.06 0.87 0.01
Bean price 3.30 3.97 0.03 3.49 4.13 0.08 -0.19 0.73
Cooking oil price 10.89 10.82 0.73 10.86 11.03 0.41 0.03 0.93
Sugar price 7.61 7.56 0.68 8.01 7.85 0.49 -0.40 0.35
Table salt price 4.22 3.89 0.68 4.09 3.93 0.84 0.13 0.93
Toilet soap price 5.01 5.26 0.07 5.03 5.13 0.57 -0.03 0.92
Log household size 1.67 1.66 0.85 1.65 1.68 0.59 0.03 0.73
Shangombo 0.12 0.35 0.00 0.15 0.35 0.00 -0.03 0.73
Kaputa 0.73 0.29 0.00 0.71 0.30 0.00 0.02 0.88
Log distance to food market 2.59 2.43 0.53 1.91 2.14 0.41 0.68 0.12
Recipient highest grade attained 3.96 3.77 0.52 4.23 4.33 0.79 -0.26 0.60
Recipient widowed 0.07 0.06 0.80 0.12 0.06 0.04 -0.05 0.22
Recipient widowed/divorced 0.13 0.15 0.58 0.21 0.12 0.03 -0.08 0.14
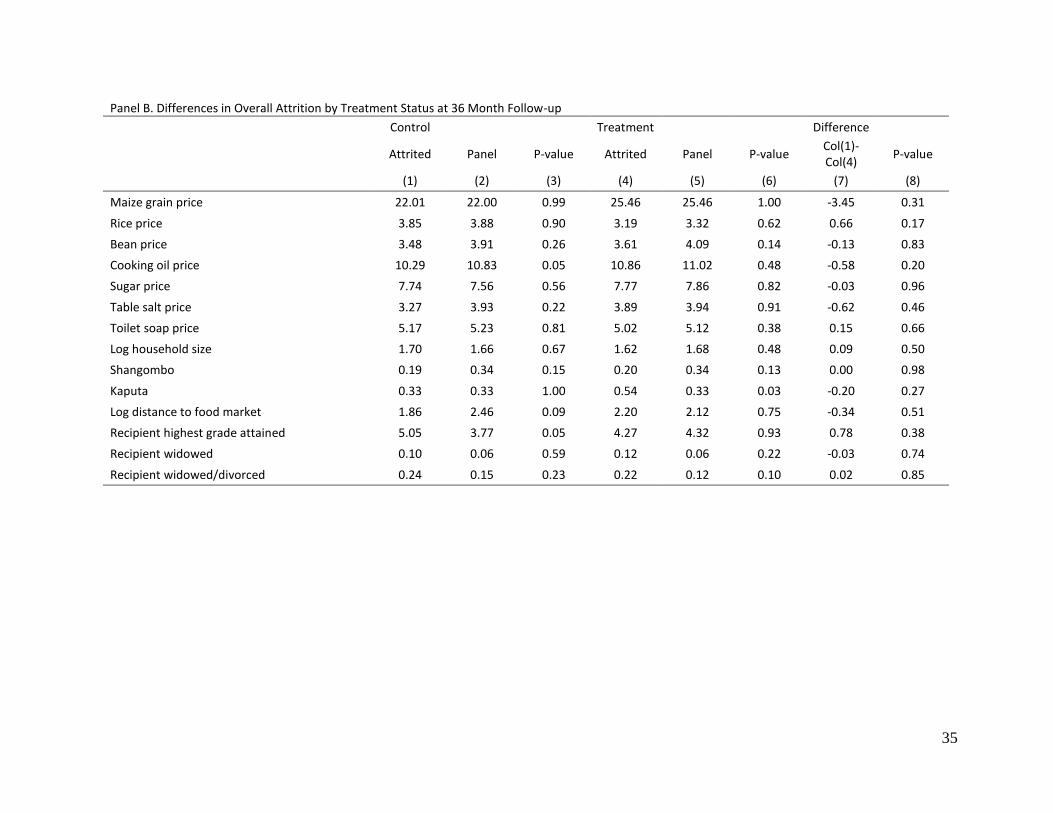
35
Panel B. Differences in Overall Attrition by Treatment Status at 36 Month Follow-up
Control Treatment Difference
Attrited Panel P-value Attrited Panel P-value Col(1)-Col(4)
P-value
(1) (2) (3) (4) (5) (6) (7) (8)
Maize grain price 22.01 22.00 0.99 25.46 25.46 1.00 -3.45 0.31
Rice price 3.85 3.88 0.90 3.19 3.32 0.62 0.66 0.17
Bean price 3.48 3.91 0.26 3.61 4.09 0.14 -0.13 0.83
Cooking oil price 10.29 10.83 0.05 10.86 11.02 0.48 -0.58 0.20
Sugar price 7.74 7.56 0.56 7.77 7.86 0.82 -0.03 0.96
Table salt price 3.27 3.93 0.22 3.89 3.94 0.91 -0.62 0.46
Toilet soap price 5.17 5.23 0.81 5.02 5.12 0.38 0.15 0.66
Log household size 1.70 1.66 0.67 1.62 1.68 0.48 0.09 0.50
Shangombo 0.19 0.34 0.15 0.20 0.34 0.13 0.00 0.98
Kaputa 0.33 0.33 1.00 0.54 0.33 0.03 -0.20 0.27
Log distance to food market 1.86 2.46 0.09 2.20 2.12 0.75 -0.34 0.51
Recipient highest grade attained 5.05 3.77 0.05 4.27 4.32 0.93 0.78 0.38
Recipient widowed 0.10 0.06 0.59 0.12 0.06 0.22 -0.03 0.74
Recipient widowed/divorced 0.24 0.15 0.23 0.22 0.12 0.10 0.02 0.85
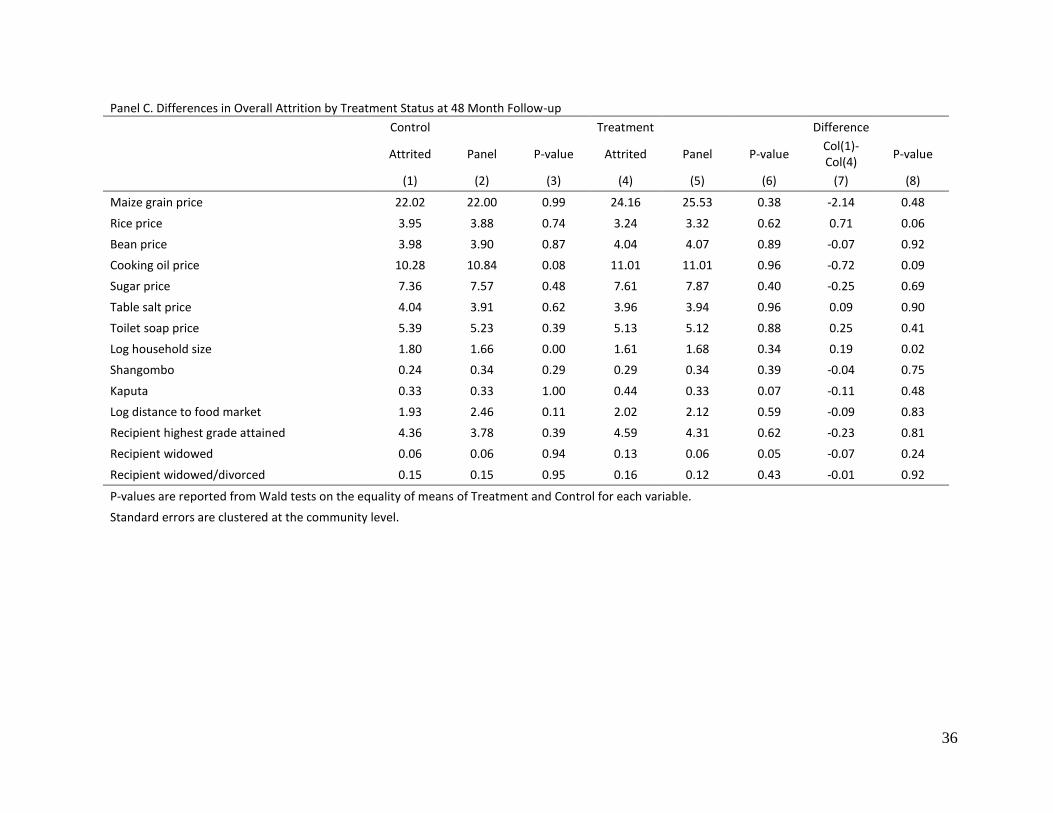
36
Panel C. Differences in Overall Attrition by Treatment Status at 48 Month Follow-up
Control Treatment Difference
Attrited Panel P-value Attrited Panel P-value Col(1)-Col(4)
P-value
(1) (2) (3) (4) (5) (6) (7) (8)
Maize grain price 22.02 22.00 0.99 24.16 25.53 0.38 -2.14 0.48
Rice price 3.95 3.88 0.74 3.24 3.32 0.62 0.71 0.06
Bean price 3.98 3.90 0.87 4.04 4.07 0.89 -0.07 0.92
Cooking oil price 10.28 10.84 0.08 11.01 11.01 0.96 -0.72 0.09
Sugar price 7.36 7.57 0.48 7.61 7.87 0.40 -0.25 0.69
Table salt price 4.04 3.91 0.62 3.96 3.94 0.96 0.09 0.90
Toilet soap price 5.39 5.23 0.39 5.13 5.12 0.88 0.25 0.41
Log household size 1.80 1.66 0.00 1.61 1.68 0.34 0.19 0.02
Shangombo 0.24 0.34 0.29 0.29 0.34 0.39 -0.04 0.75
Kaputa 0.33 0.33 1.00 0.44 0.33 0.07 -0.11 0.48
Log distance to food market 1.93 2.46 0.11 2.02 2.12 0.59 -0.09 0.83
Recipient highest grade attained 4.36 3.78 0.39 4.59 4.31 0.62 -0.23 0.81
Recipient widowed 0.06 0.06 0.94 0.13 0.06 0.05 -0.07 0.24
Recipient widowed/divorced 0.15 0.15 0.95 0.16 0.12 0.43 -0.01 0.92
P-values are reported from Wald tests on the equality of means of Treatment and Control for each variable.
Standard errors are clustered at the community level.

37
Appendix 4. Summary Statistics Total Number of Children Living in Household, by Wave and Treatment Status
Panel A: All children
Baseline 24 months 36 months 48 months
(1) (2) (3) (4) (5) (6) (7) (8)
Control Treatment Control Treatment Control Treatment Control Treatment
0-1 years 0.76 0.79 0.43 0.40 0.45 0.46 0.34 0.36
2-4 years 0.93 0.89 1.13 1.15 0.98 1.02 0.85 0.80
Total 0-4 years 1.92 1.88 1.84 1.82 1.80 1.84 1.55 1.55
Panel B: Female Children
Baseline 24 months 36 months 48 months
Control Treatment Control Treatment Control Treatment Control Treatment
0-1 years 0.37 0.42 0.19 0.19 0.20 0.23 0.16 0.18
2-4 years 0.47 0.44 0.55 0.58 0.47 0.53 0.40 0.42
Total 0-4 years 0.94 0.97 0.89 0.92 0.85 0.93 0.74 0.80
Panel B: Male Children
Baseline 24 months 36 months 48 months
Control Treatment Control Treatment Control Treatment Control Treatment
0-1 years 0.37 0.36 0.23 0.21 0.25 0.23 0.18 0.18
2-4 years 0.45 0.43 0.56 0.55 0.49 0.48 0.45 0.39
Total 0-4 years 0.95 0.89 0.92 0.88 0.93 0.89 0.81 0.76

38
Appendix 5: Impact of CGP on Household-Level Child Counts, Ages 0-4 years, By Gender, Poisson Models
Panel A: Total Number of Children Aged 0-1 year
Females Males
(1) (2) (3) (4) (5) (6)
24
months 36
months 48
months 24
months 36
months 48
months
Treat 0.12** 0.13** 0.15*** -0.04 -0.05 -0.06
(0.051) (0.051) (0.051) (0.060) (0.061) (0.060)
Time=24 months -
0.63*** -
0.48***
(0.078) (0.065)
Treat*Time(24 months) -0.13 -0.07
(0.113) (0.100)
Time=36 months -
0.62*** -
0.42***
(0.077) (0.062)
Treat*Time(36 months) 0.01 -0.03
(0.101) (0.081)
Time=48 months -
0.84*** -
0.73***
(0.081) (0.073)
Treat*Time(48 months) -0.00 0.04
(0.104) (0.101)
Observations 4,815 4,976 4,942 4,815 4,976 4,942
Panel B: Total Number of Children Aged 2-4 years
Females Males
(1) (2) (3) (4) (5) (6)
24
months 36
months 48
months 24
months 36
months 48
months
Treat -0.03 -0.04 -0.06 -0.05 -0.05 -0.02
(0.057) (0.056) (0.057) (0.048) (0.048) (0.050)
Time=24 months 0.15*** 0.22***
(0.046) (0.043)
Treat*Time(24 months) 0.13* 0.02
(0.072) (0.059)
Time=36 months 0.00 0.10*
(0.049) (0.055)
Treat*Time(36 months) 0.18** 0.00
(0.082) (0.073)
Time=48 months -
0.18*** 0.02
(0.050) (0.055)
Treat*Time(48 months) 0.12 -0.13
(0.087) (0.089)
Observations 4,815 4,976 4,942 4,815 4,976 4,942
Notes: Robust standard errors in parentheses. * p<0.1 ** p<0.05; *** p<0.01. Difference-in-difference estimates run using Poisson models. All models control for baseline values of log (household size), log (distance to food market), recipient highest grade attained, recipient marital status, basket of prices.