Embed Size (px)
Citation preview
UNCLASSIFIED
AD NUMBER
LIMITATION CHANGESTO:
FROM:
AUTHORITY
THIS PAGE IS UNCLASSIFIED
AD903107
Approved for public release; distribution isunlimited.
Distribution authorized to U.S. Gov't. agenciesonly; Test and Evaluation; APR 1972. Otherrequests shall be referred to Army AviationSystem Test Activity, Edwards AFB, CA 93523.
AVSCOM ltr, 12 Nov 1973
CO o a <
^
AD RDTE PROJECT NO. AVSCOM PROJECT NO. 70-03 USAASTA PROJECT NO. 70-03
ARMY PRELIMINARY EVALUATION II
PRODUCTION OV-1D (MOHAWK)
PERFORMANCE ADDENDUM
FINAL REPORT
GEORGE M. YAMAKAWA PROJECT ENGINEER
KARL H. BRAUER D 1 LT, CE US ARMY
ASSISTANT ENGINEER
WILLIAM A. GRAHAM, JR. LTC, TC
US ARMY PROJECT OFFICER/PILOT
JOHN C. HENDERSON MAJ, TC
US ARMY PROJECT PILOT
APRIL 1972
Distribution limited to US Government agencies only; test and evaluation, April 1972. Other requests for this document must be referred to the Commanding General, AVSCOM, ATTN: AMSAV-EF, PO Box 209, St. Louis, Missouri 63166.
US ARMY AVIATION SYSTEMS TEST ACTIVITY EDWARDS AIR FORCE BASE, CALIFORNIA 93523
DISCLAIMER NOTICE
'Flip rindiiip;s of this report are not to be construed as an offirial Department of the Army position unless so designated by other authorized documents.
RKPRODUCTION LIMITATIONS
Reproduction of this document in whole or in part is prohibited except with permission obtained through the Commanding Ceneral, AVSCOM, ATTN: AMSAV KF, PO Box 209, St. Louis, Missouri 63166. DDC is authorized to reproduce the document for United States Government purposes.
DISPOSITION INSTRUCTIONS
Destroy this report when it is no longer needed. Do not return it to the originator.
nun NAMES
The use of trade names in Ibis report does not constitute an official endorsement or approval of the use of the commercial hardware and software.
RDTE PROJECT NO AVSCOM PROJECT NO. 7(H)3 USAASTA PROJECT NO. 7(H)3
ARMY PRELIMINARY EVALUATION II
PRODUCTION OV-1D (MOHAWK)
PERFORMANCE ADDENDUM
FINAL REPORT
GEORGE M. YAMAKAWA PROJECT ENGINEER
KARL H. BRAUER II I LT, CE
US ARMY ASSISTANT ENGINEER
WILLIAM A. GRAHAM, JR. LTC. TC
US ARMY PROJECT OFFICER/PILOT
JOHN C. HENDERSON MAJ. TC
US ARMY PROJECT PILOT
APRIL 1972
Distribution limited to US Government agencies only; test and evaluation, April 1972. Other requests for this document must be referred to the Commanding General, AVSCOM, ATTN: AMSAV-EF, PO Box 209, St. Louis, Missouri 63166.
US ARMY AVIATION SYSTEMS TEST ACTIVITY EDWARDS AIR FORCE BASE, CALIFORNIA 93523
iii
T ri» -XT—^=5=
J
ABSTRACT
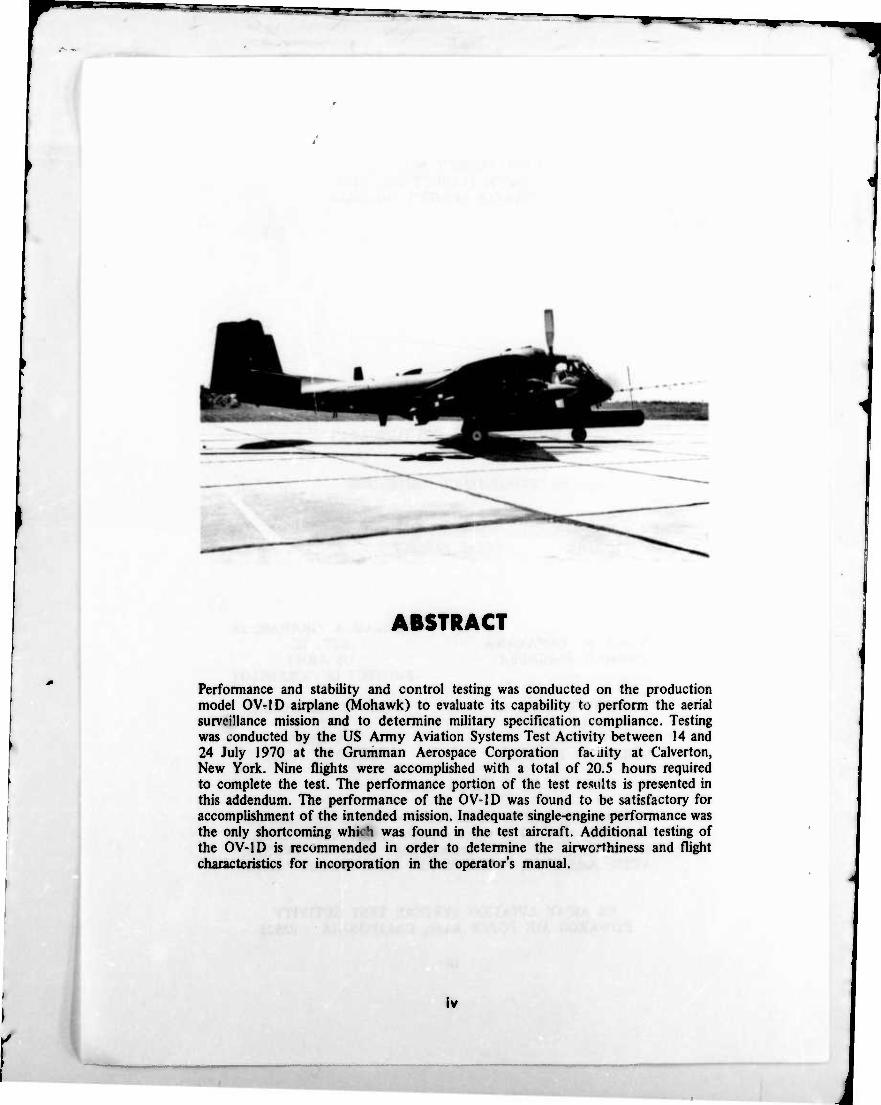
Performance and stability and control testing was conducted on the production model OV-1D airplane (Mohawk) to evaluate its capability to perform the aerial surveillance mission and to determine military specification compliance. Testing was conducted by the US Army Aviation Systems Test Activity between 14 and 24 July 1970 at the Grumman Aerospace Corporation fav.aity at Calverton, New York. Nine flights were accompUshed with a total of 20.5 hours required to complete the test. The performance portion of the test results is presented in this addendum. The performance of the OV-1D was found to be satisfactory for accomplishment of the intended mission. Inadequate single-engine performance was the only shortcoming whkh was found in the test aircraft. Additional testing of the OV-1D is recommended in order to determine the airworthiness and flight characteristics for incorporation in the operator's manual.
j
■1- 1«^
TABLE OF CONTENTS
Page
INTRODUCTION
Iku kproiind . .
Tost Objectives Description . . . Scope of Test. , IM et hods of Test Chronology . . ,
i RESULTS AND DISCUSSION
Stability and Control Performance
General Drag Discrepancy Dual-Rngine Level Flight Performance Single-Engine Performance Takeoff and Landing 1 Stall Performance i
CONCLUSIONS
General " Shortcoming Affecting Mission AccompUsbment <3
RKCOMMKNDATIONS M
J
i»i r>ii
Pag*
APPFNDIXES 15
I. References , 15 II. Instrumentation 16 III. Data Reduction Procedures IB IV. Drag Investigation 23 V. Test Data 31
DISTRIBUTION
VI
J
INTRODUCTION
BACKGROUND
1. The OV-ID airplane is a growth version of the OV-I model manufactured for the US Army by the Grumman Aerospace Corporation (GAC), Bethpage, New York. Four preproduction aircraft were used during contractor flight testing to evaluate the performance, flying qualities, structural integrity, and electronic compatibility of the new electronic surveillance mission equipment. Army Preliminary !• valuation I (APF I) was completed on the preproduction OV-ID airplane by the US Army Aviation Systems Test Activity (USAASTA) in May 1969 (ref I. app I). The evaluation of the production OV-ID airplane (APE II) was directed by the US Army Aviation Systems Command (AVSCOM) in Test Request No. 70-03 (ref 2).
TKST OBJRCTIVRS
2. The following test objectives were outlined in the test directive:
a. To quantitatively and qualitatively evaluate the airplane's performance and handling qualities, and to verify compliance with the requirements of the military specification. VIIL-F-8785(ASG), Amendment 2 (ref 3, app I) and the detail specification (ref 4).
b. To determine if the shortcomings reported in the preproduction APE had been adequately corrected.
c. To evaluate performance data provided by GAC. .
DKSCRIPTION
3. A production OV-ID airplane, serial number 68-16990, was tested during APE II. The OV-ID is a two-place, triple-vertical-stabilizer, mid-wing, twin-engine, turboprop airplane. The airplane is powered by two Lycoming T53-L-701 turbine engines, each rated at 1,400 shaft horsepower (shp) with Hamilton Standard 53C5I-27 three-bladed propellers. Martin-Baker ejection seats are provided for the crew. The missions of the OV-ID include visual, photographic, infrared (IR), and side-looking airborne radar (SLAR) surveillance. A detailed description of both the airplane and its mission equipment is contained in reference 4, appendix I.
4. The test instrumentation which was installed in the airplane is listed in appendix II and included a photopanel, an airborne tape system, and telemetry. Calibrated engines were installed on the aircraft for the evaluation.
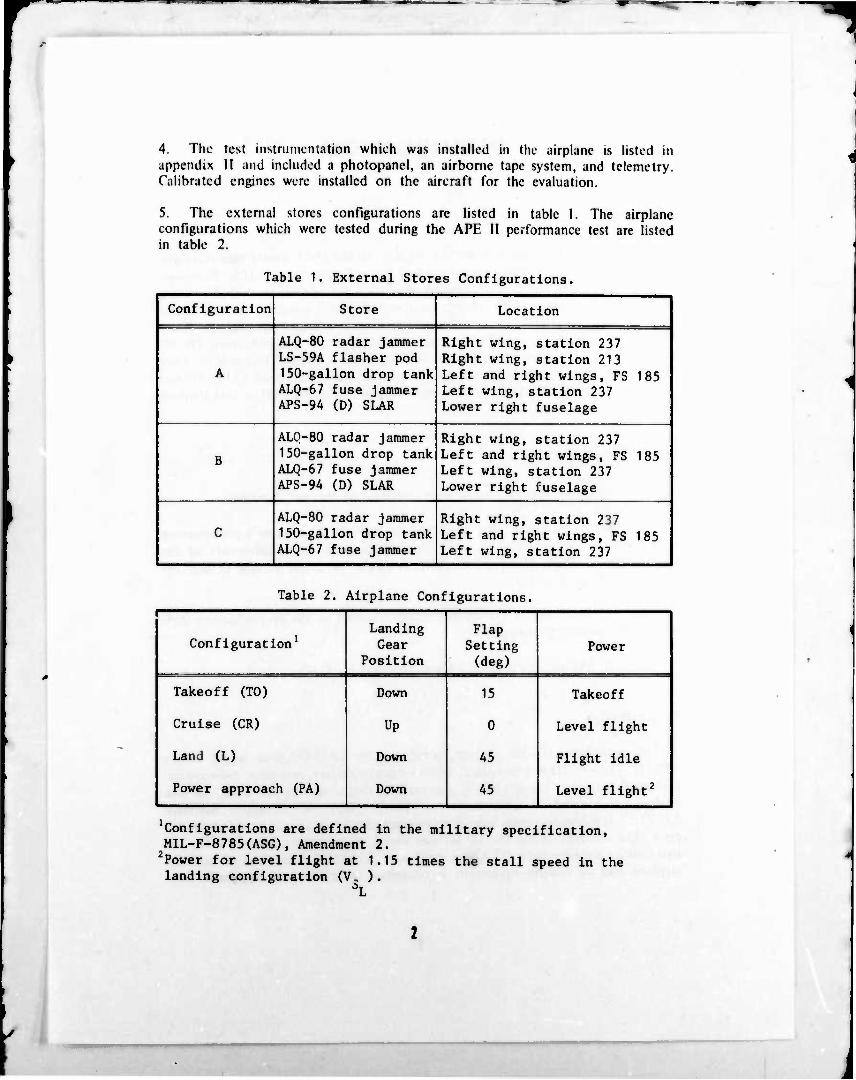
5. The external stores configurations are listed in table I. The airplane configurations which were tested during the APE II performance test are listed in table 2.
Table 1. External Stores Configurations.
Configuration Store Location
A
ALQ-80 radar jammer LS-59A flasher pod 150-gallon drop tank ALQ-67 fuse jammer APS-94 (D) SLAR
Right wing, station 237 Right wing, station 213 Left and right wings, FS 185 Left wing, station 237 Lower right fuselage
B
ALO-80 radar jammer 150-gallon drop tank ALQ-67 fuse jammer APS-94 (D) SLAR
Right wing, station 237 Left and right wings, FS 185 Left wing, station 237 Lower right fuselage
C
■
ALQ-80 radar jammer 150-gallon drop tank ALQ-67 fuse jammer
Right wing, station 237 Left and right wings, FS 185 l Left wing, station 237 j
Table 2. Airplane Configurations,
Configuration1 Landing Gear
Position
Flap Setting (deg)
Power j
Takeoff (TO)
Cruise (CR)
Land (L)
Power approach (PA)
Down
Up
Down
Down
15
0
45
45
Takeoff
Level flight '
Flight idle 1
Level flight2
'Configurations are defined in the military specification, MIL-F-8785(ASG), Amendment 2.
2Power for level flight at 1.15 times the stall speed in the landing configuration (V, ).
SCOPF. OF TKST
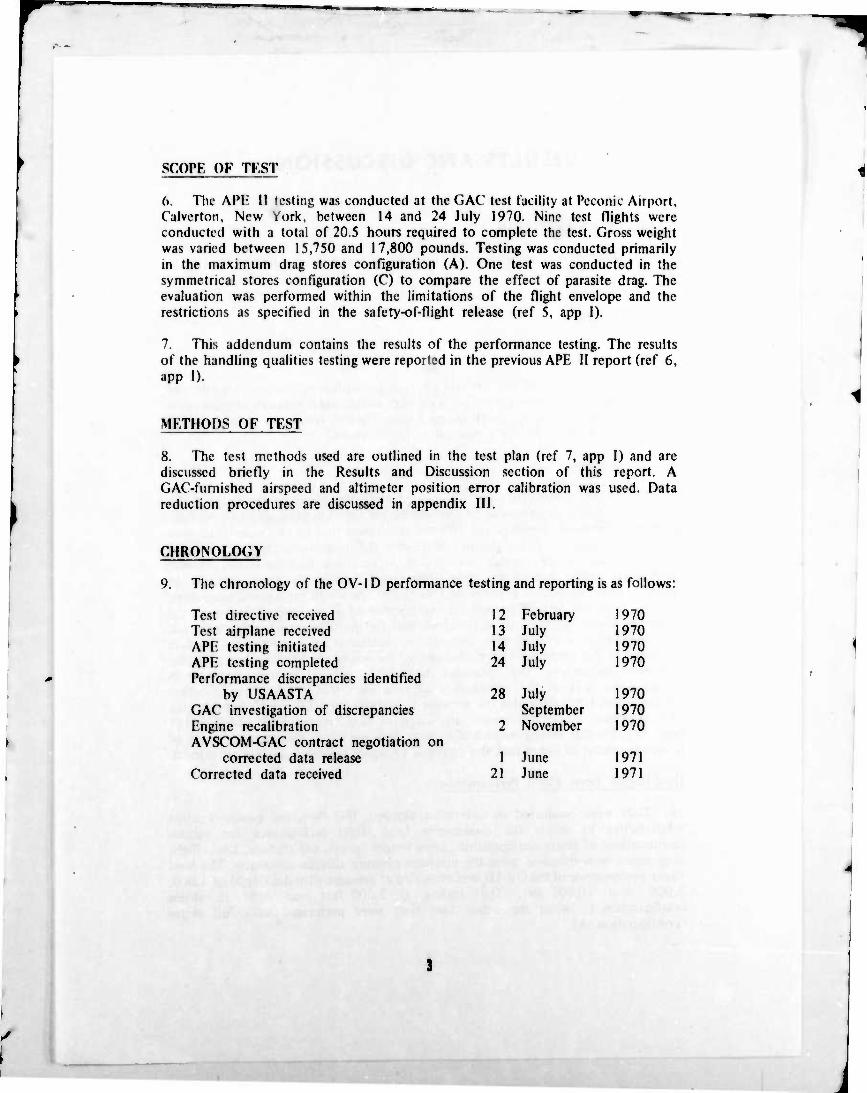
6. Tlu1 APH II testing was conducteil at the GAC test facility at Peconic Airport. Calverton. New Vork, between 14 and 24 July 1970. Nine test flights were conductcil with a total of 20.5 hours required to complete the test. Gross weight was varied between 15,750 and 17,800 pounds. Testing was conducted primarily in the maximum drag stores configuration (A). One test was conducted in the symmetrical stores configuration (C) to compare the effect of parasite drag. The evaluation was performed within the limitations of the flight envelope and the restrictions as specified in the safety-of-flight release (ref 5, app I).
7. This addendum contains the results of the performance testing. The results of the handling qualities testing were reported in the previous APE II report (ref 6, app I).
MFTHODS OF TEST
8. The test methods used are outlined in the test plan (ref 7, app I) and are discussed briefly in the Results and Discussion section of this report. A GAC-fumished airspeed and altimeter position error calibration was used. Data reduction procedures are discussed in appendix III.
CHRONOLOGY
9. The chronology of the OV-i D performance testing and reporting is as follows:
Test directive received Test airplane received APE testing initiated APE testing completed Performance discrepancies identified
by USAASTA GAC investigation of discrepancies Engine recalibration AVSCOM-GAC contract negotiation on
corrected data release Corrected data received
12 February 1970 13 July 1970 14 July 1970 24 July 1970
28 July 1970 September 1970
2 November 1970
1 June 1971 21 June 1971
RESULTS AND DISCUSSION
STABILITY AND C01NTROL
10. The stability and control section of this report was published previously (ref 6, app I).
PRRFORMANCR
Gernral
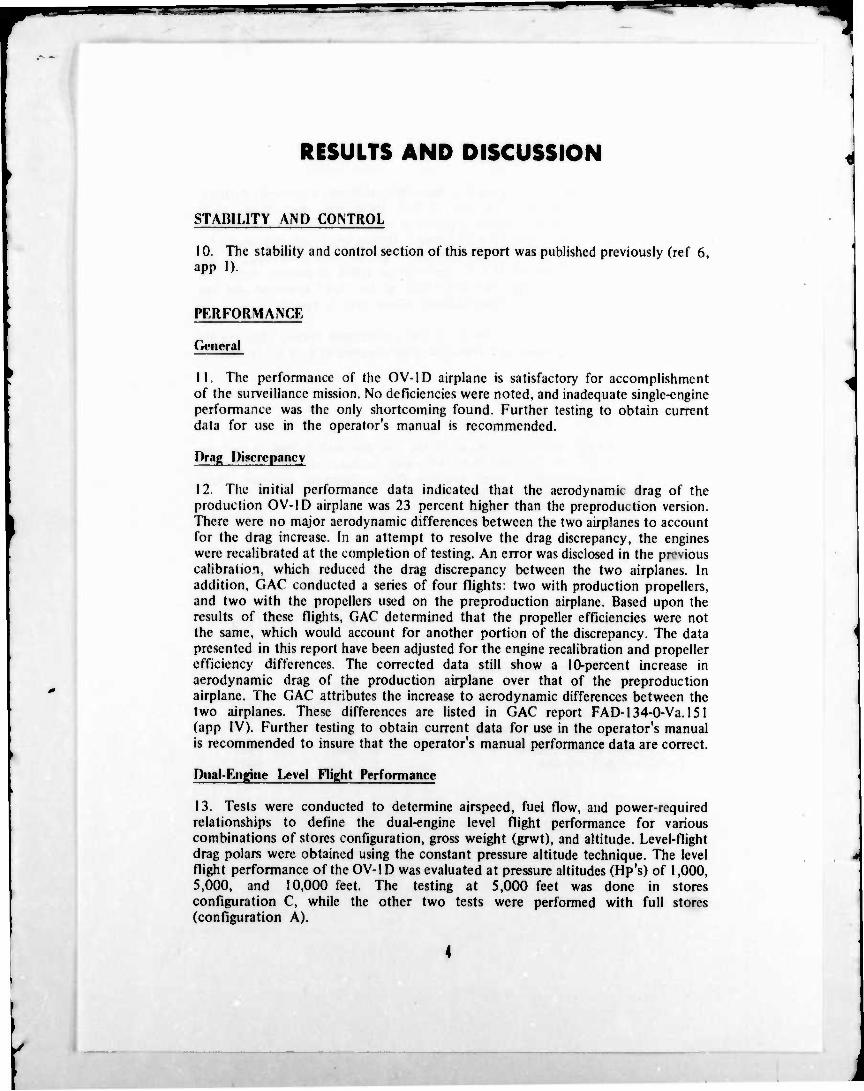
11. The performance of the OV-ID airplane is satisfactory for accomplishment of the surveillance mission. No deficiencies were noted, and inadequate single-engine performance was the only shortcoming found. Further testing to obtain current data for use in the operator's manual is recommended.
Drag DJBcrppancy
12. The initial performance data indicated that the aerodynamic drag of the production OV-ID airplane was 23 percent higher than the preproduction version. There were no major aerodynamic differences between the two airplanes to account for the drag increase. In an attempt to resolve the drag discrepancy, the engines were recalibrated at the completion of testing. An error was disclosed in the previous calibration, which reduced the drag discrepancy between the two airplanes. In addition, GAC conducted a series of four flights; two with production propellers, and two with the propellers used on the preproduction airplane. Based upon the results of these flights. GAC determined that the propeller efficiencies were not the same, which would account for another portion of the discrepancy. The data presented in this report have been adjusted for the engine recalibration and propeller efficiency differences. The corrected data still show a 10-percent increase in aerodynamic drag of the production airplane over that of the preproduction airplane. The GAC attributes the increase to aerodynamic differences between the two airplanes. These differences are listed in GAC report FAD-l34-0-Va.l51 (app IV). Further testing to obtain current data for use in the operator's manual is recommended to insure that the operator's manual performance data are correct.
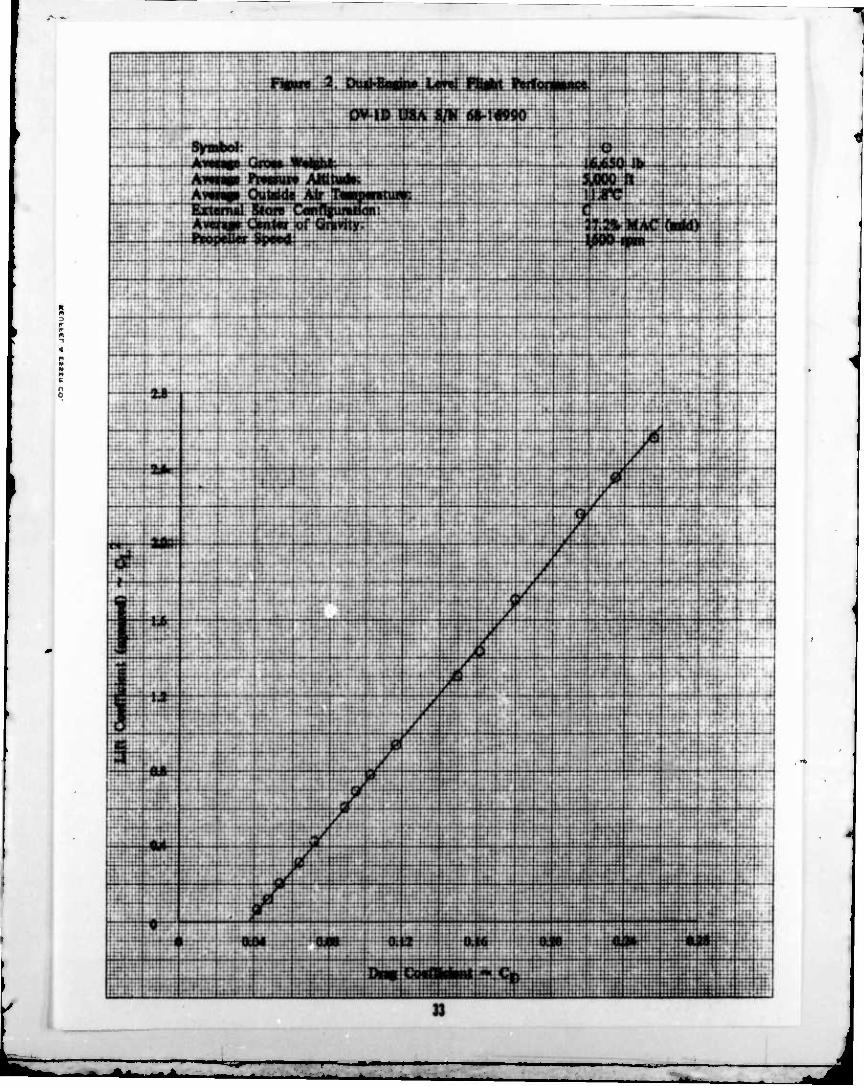
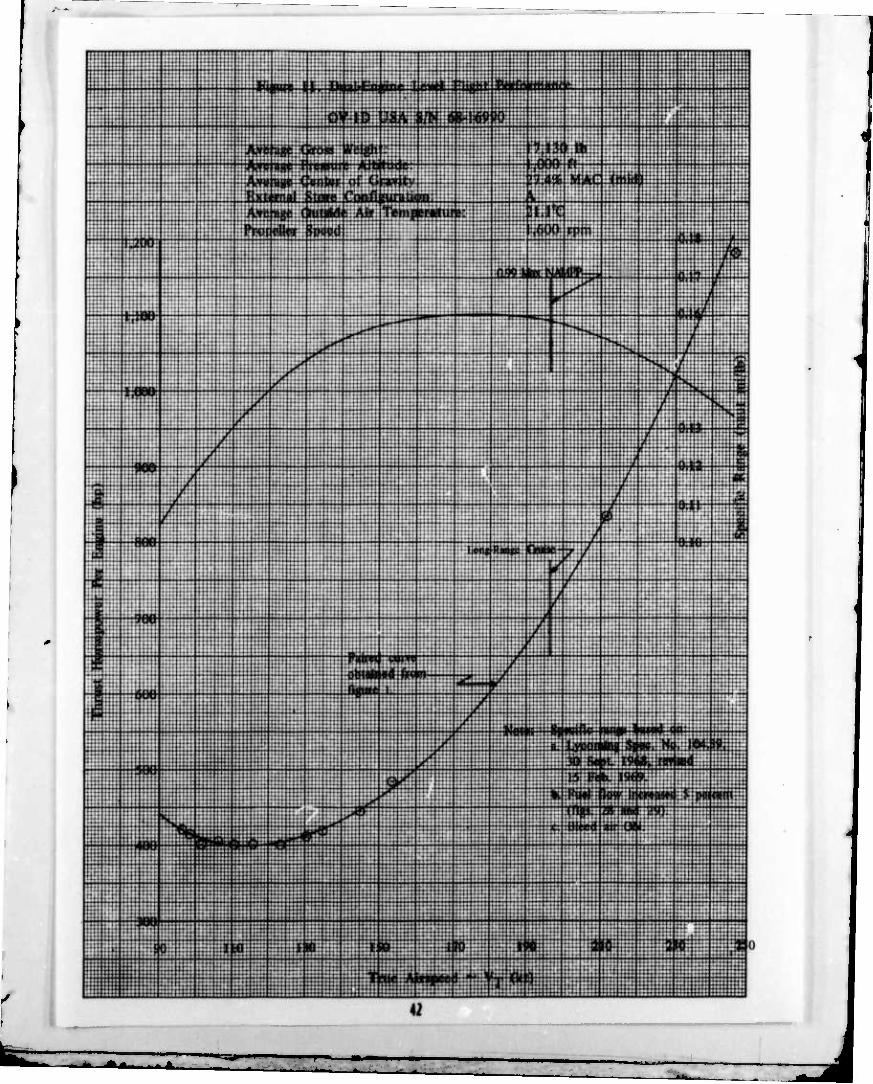
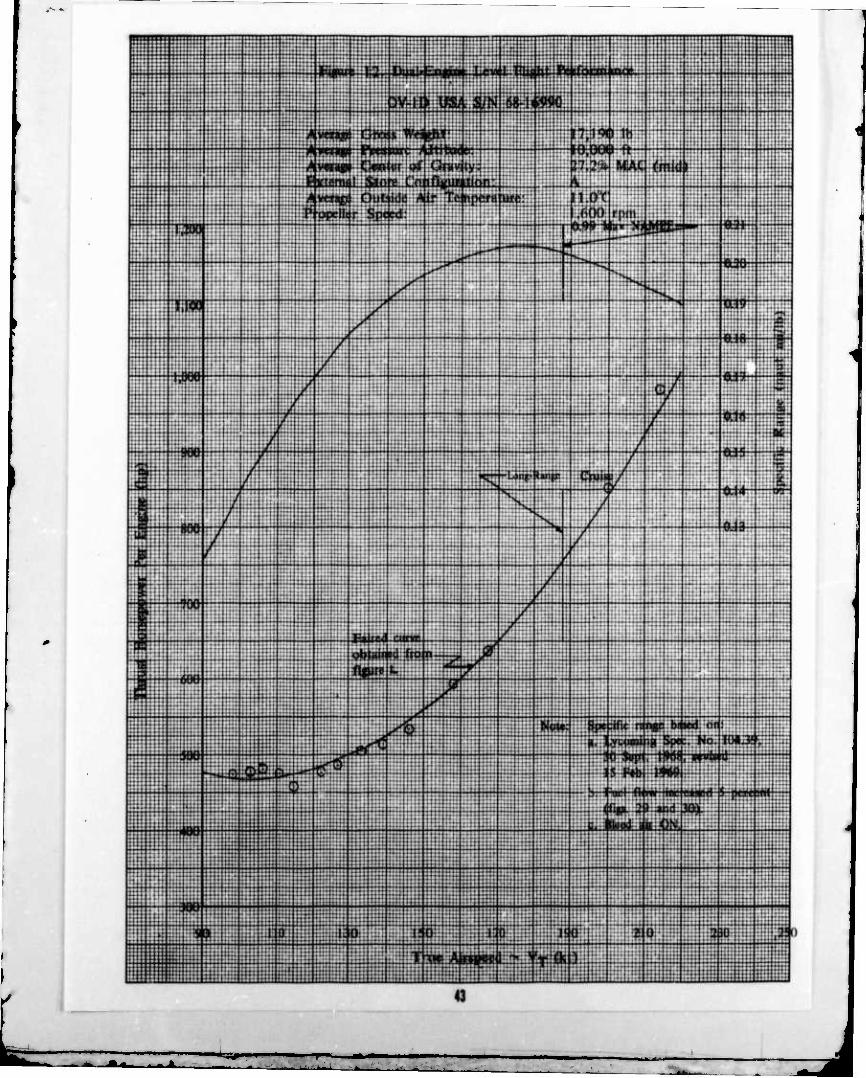
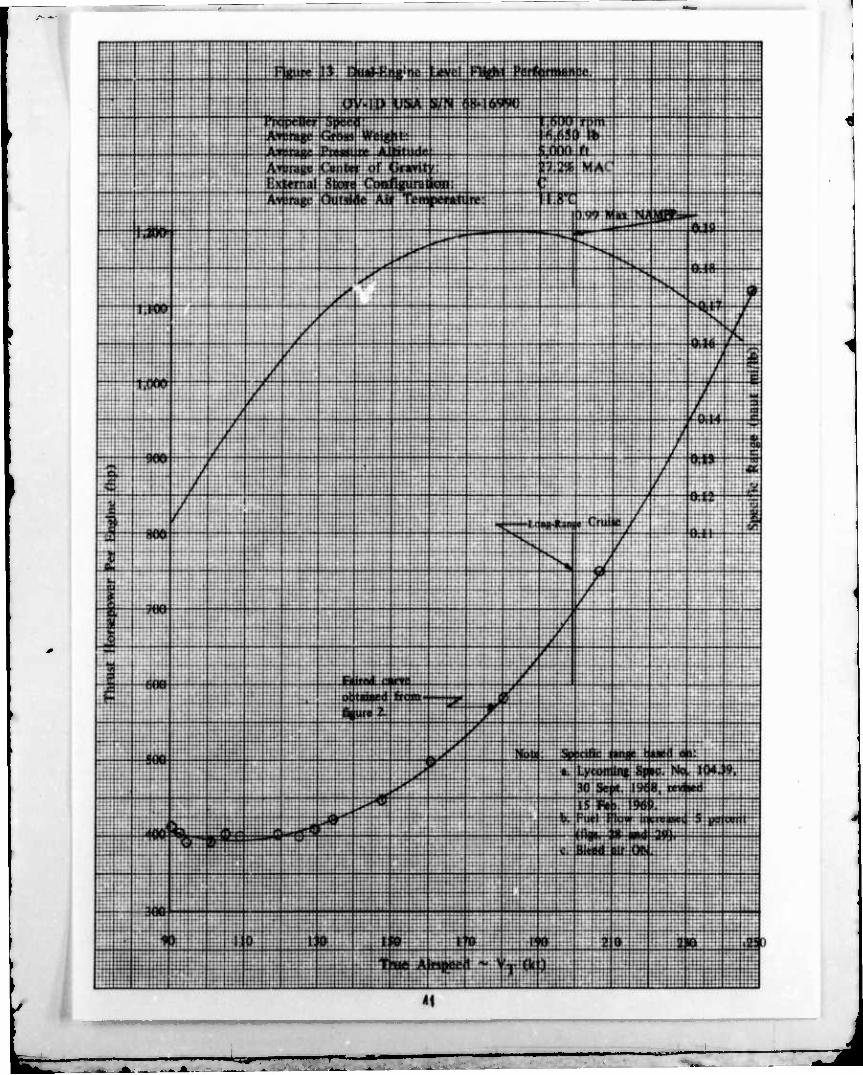
Diial-Fiiigine Level Flight Performance
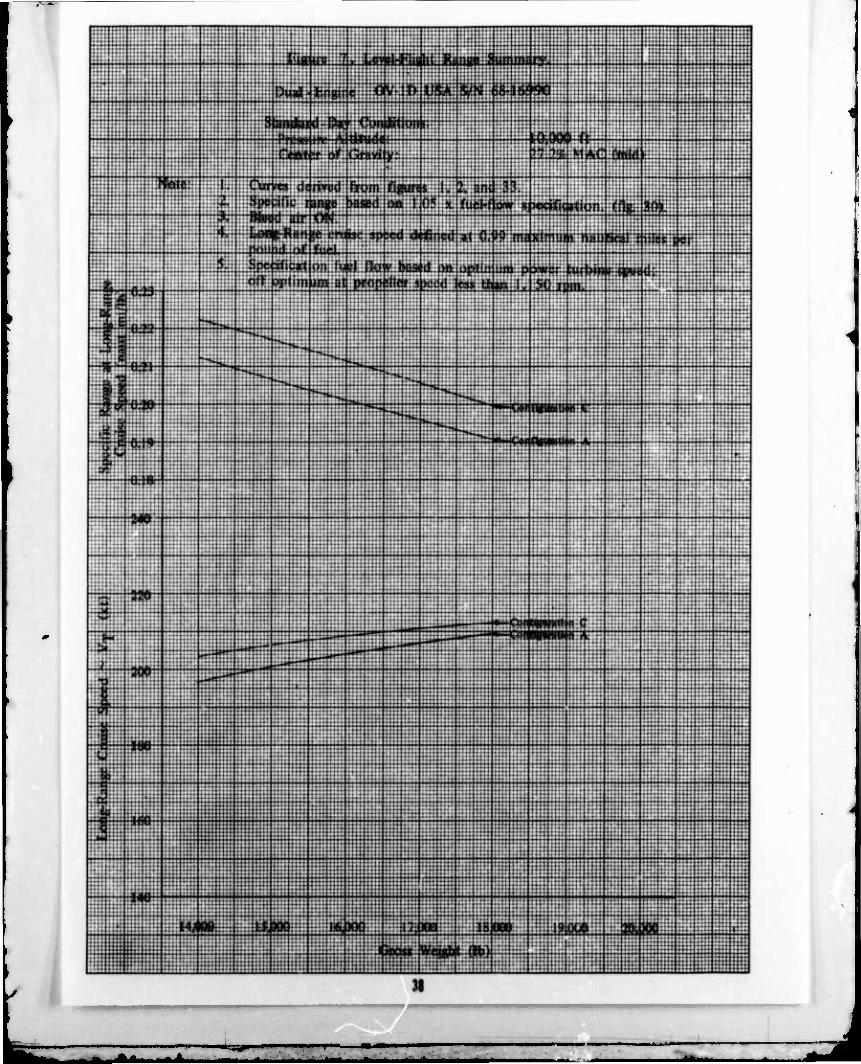
13. Tests were conducted to determine airspeed, fuel flow, and power-required relationships to define the dual-engine level flight performance for various combinations of stores configuration, gross weight (grwt), and altitude. Level-flight drag polars were obtained using the constant pressure altitude technique. The level flight performance of the OV-ID was evaluated at pressure altitudes (Hp's) of 1,000, 5,000, and 10,000 feet. The testing at 5,000 feet was done in stores configuration C, while the other two tests were performed with full stores (configuration A).
4
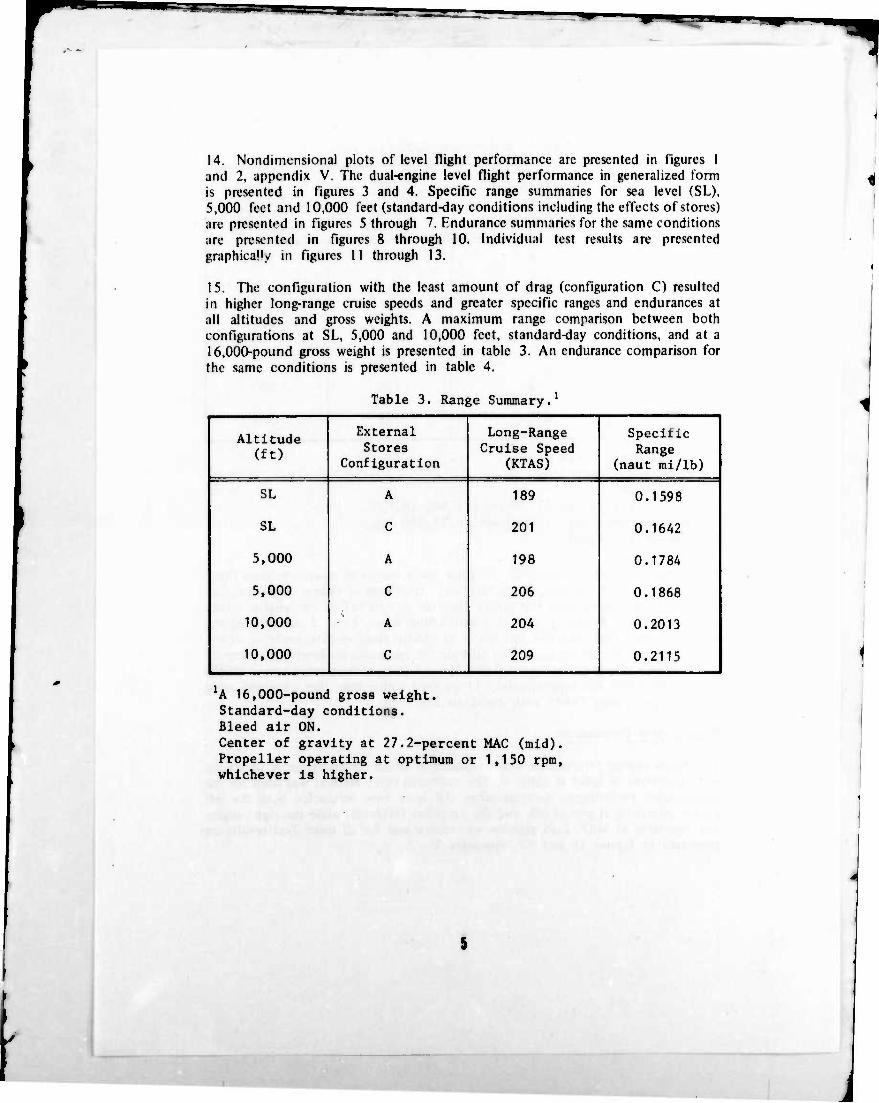
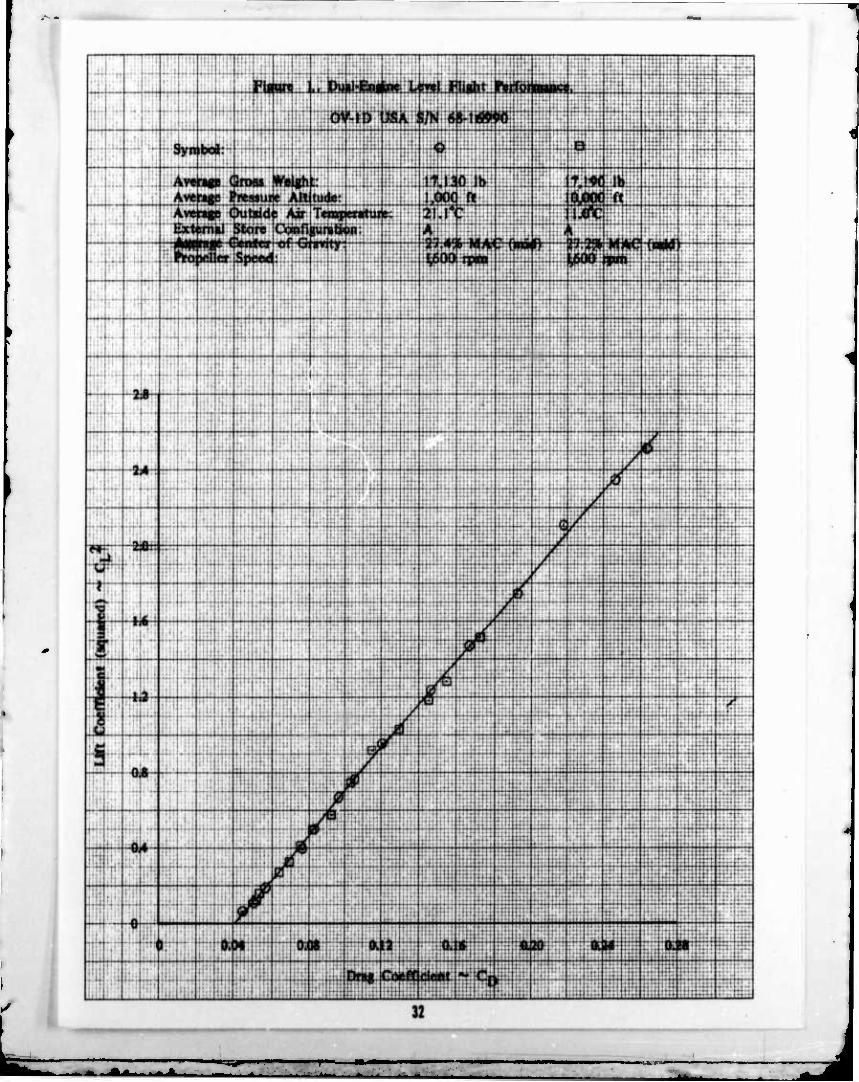
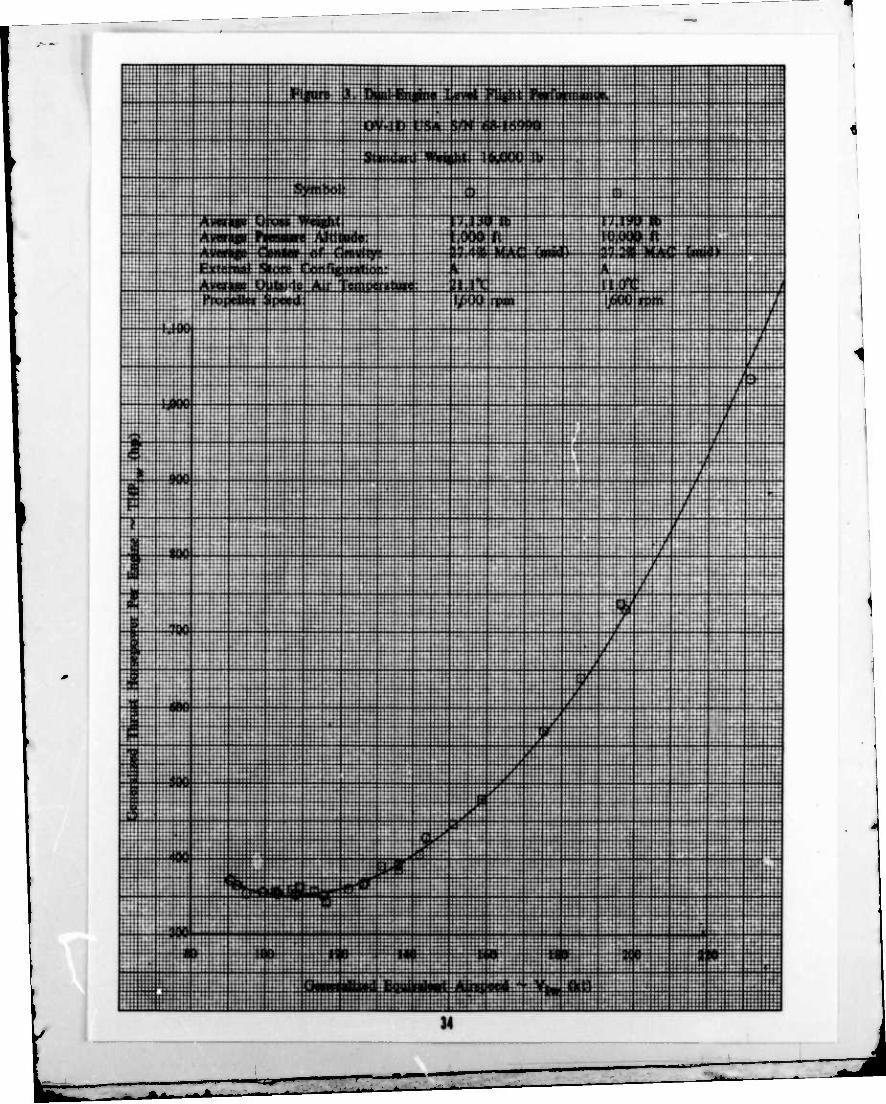
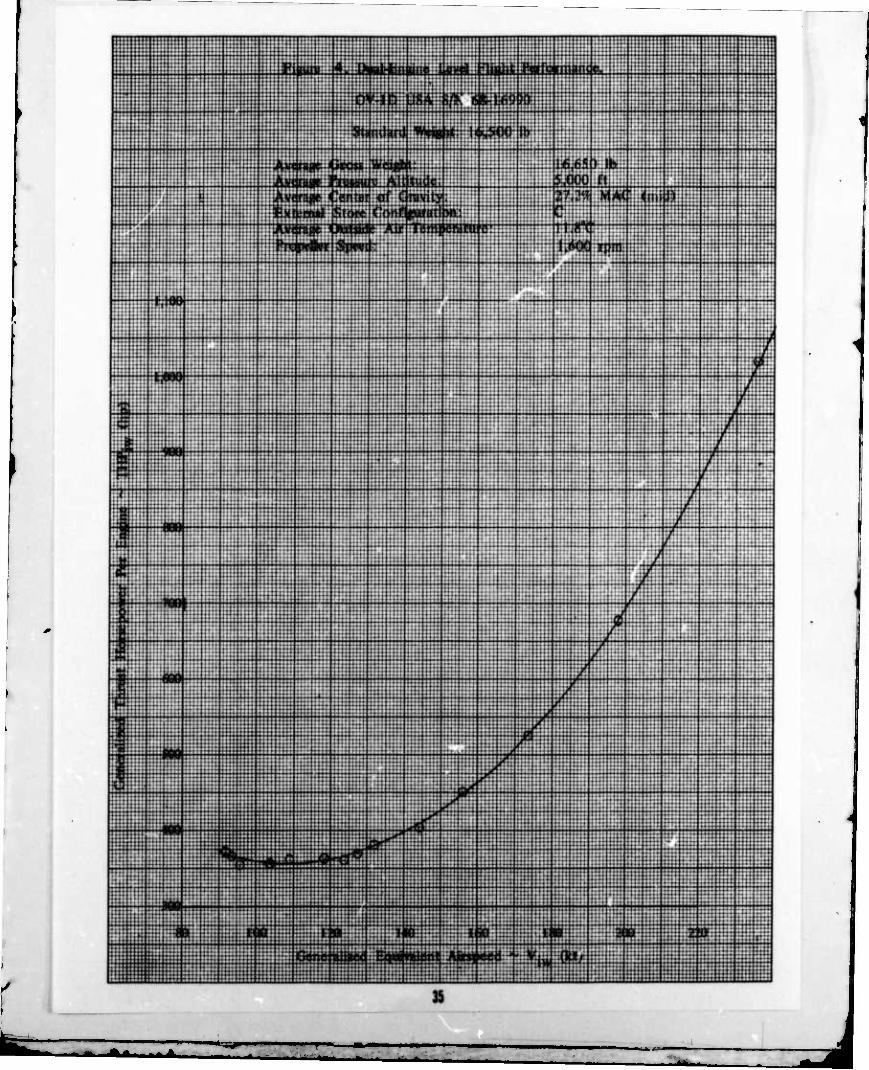
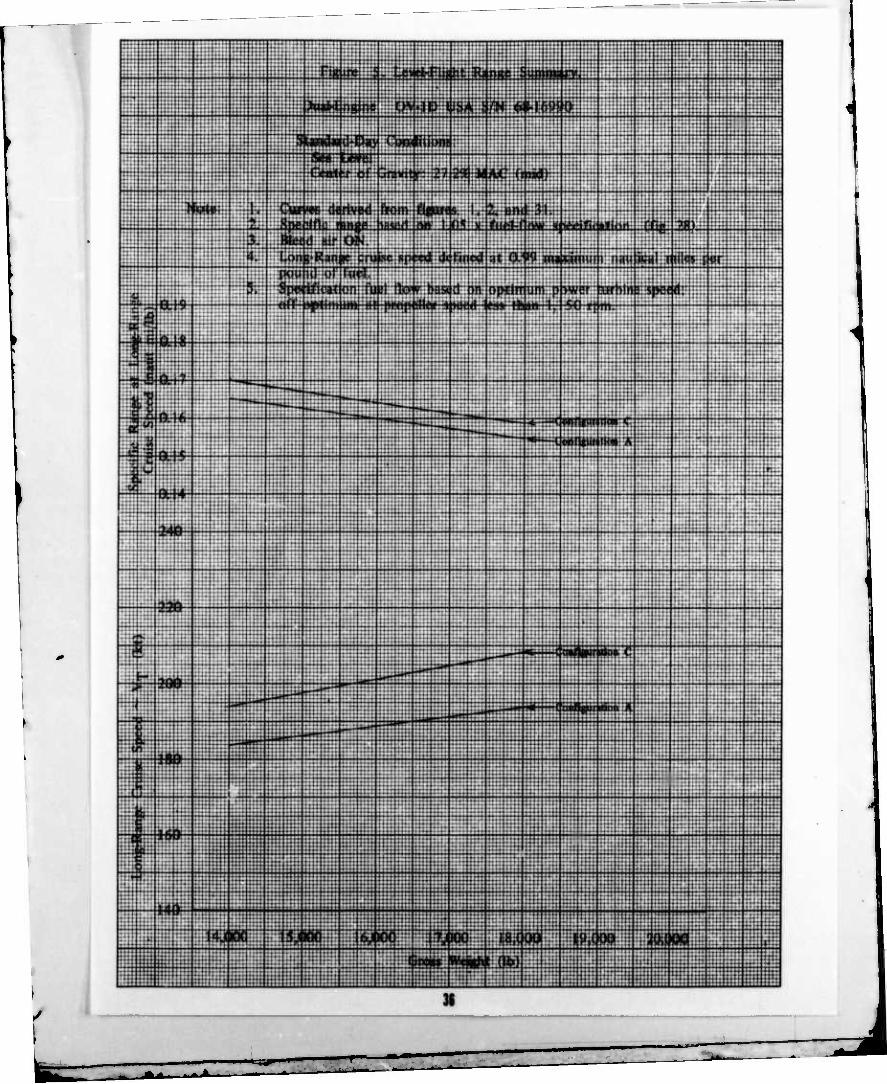
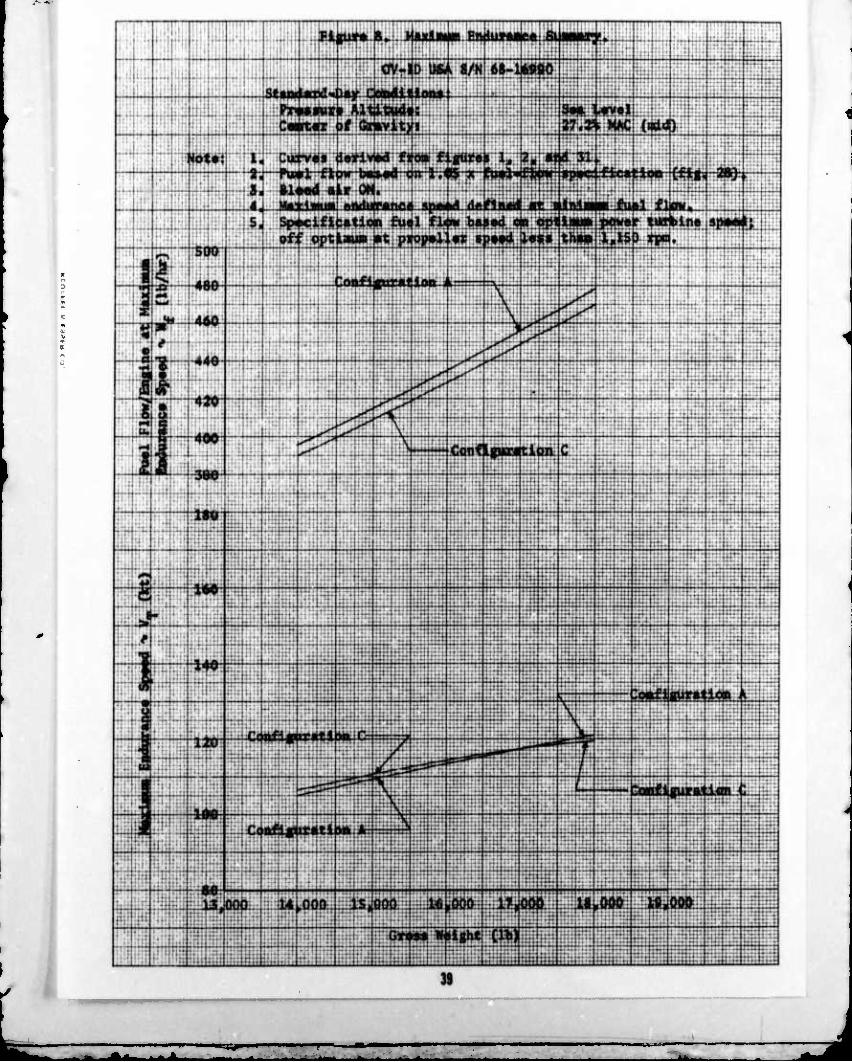
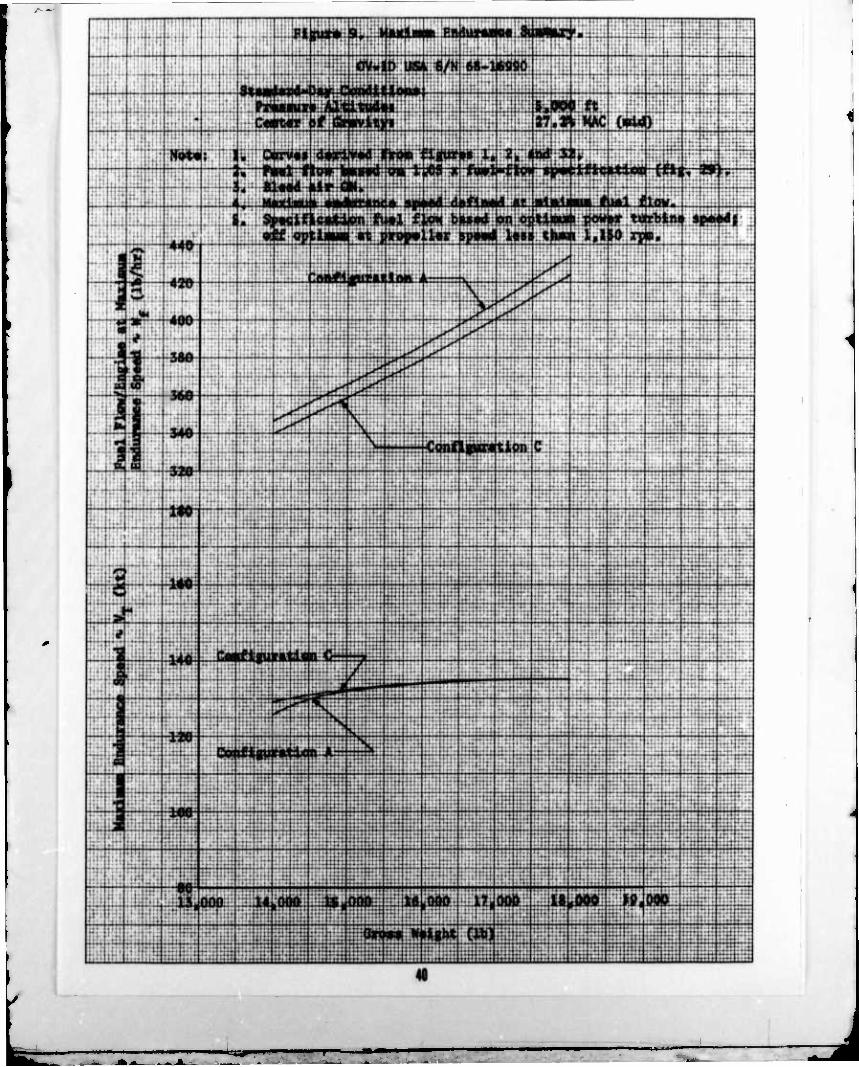
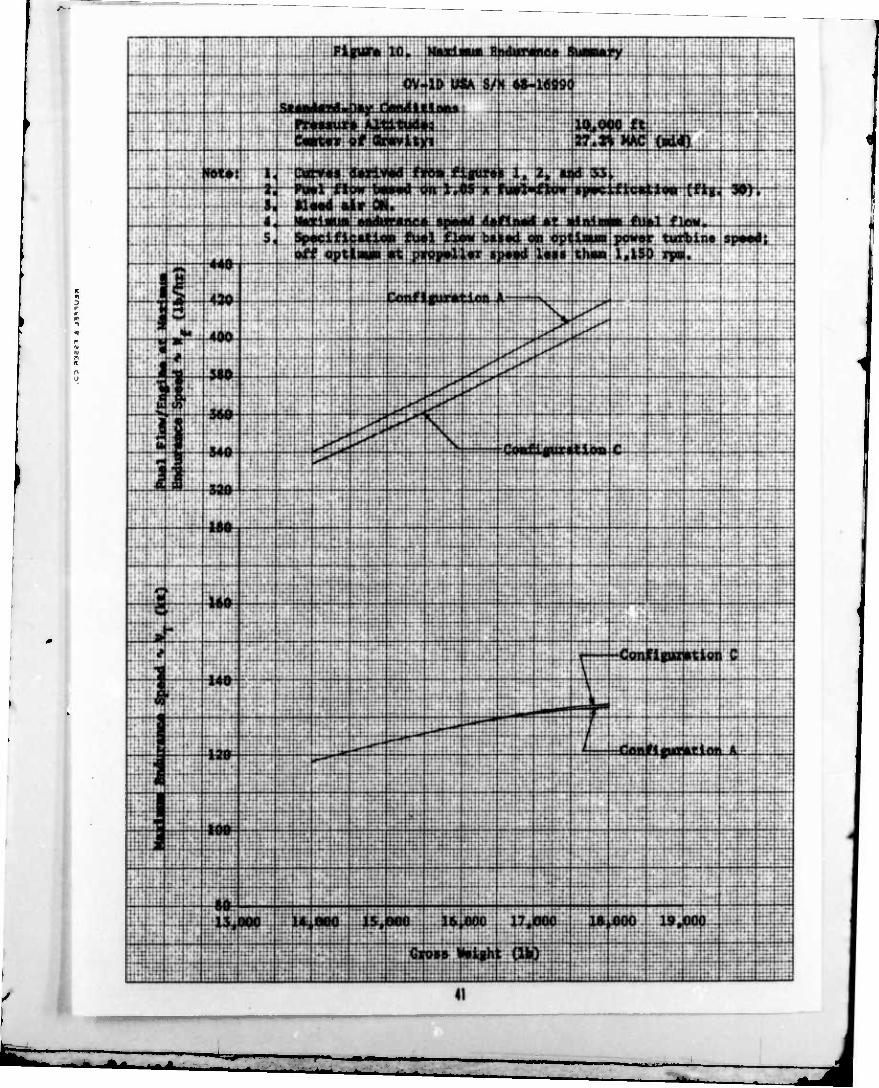
14. Nondimensional plots of level flight performance are presented in figures 1 and 2, appendix V. The dual-engine level flight performance in generalized form is presented in figures 3 and 4. Specific range summaries for sea level (SL), 5,000 feet and 10,000 feet (standard-day conditions including the effects of stores) are prcscntt'd in figures 5 through 7. Endurance summaries for the same conditions are pa-scnted in figures 8 through 10. Individual test results are presented graphical'y in figures 11 through 13.
15. The configuration with the least amount of drag (configuration C) resulted in higher long-range cruise speeds and greater specific ranges and endurances at all altitudes and gross weights. A maximum range comparison between both configurations at SL, 5,000 and 10,000 feet, standard-day conditions, and at a 16,000-pound gross weight is presented in table 3. An endurance comparison for the same conditions is presented in table 4.
Table 3. Range Summary.1
Altitude (ft)
External Stores
Configuration
Long-Range Cruise Speed
(KTAS)
Specific Range
(naut mi/lb)
| SL A 189 0.1598
1 SL C 201 0.1642 j
5,000 A 198 0.1784
I 5,000 C 206 0.1868
! 10,000 A 204 0.2013 j
j 10,000 C 209 0.2115 j
'A 16,000-pound gross weight. Standard-day conditions. Bleed air ON. Center of gravity at 27.2-percent MAC (mid). Propeller operating at optimum or 1,150 rpm, whichever is higher.
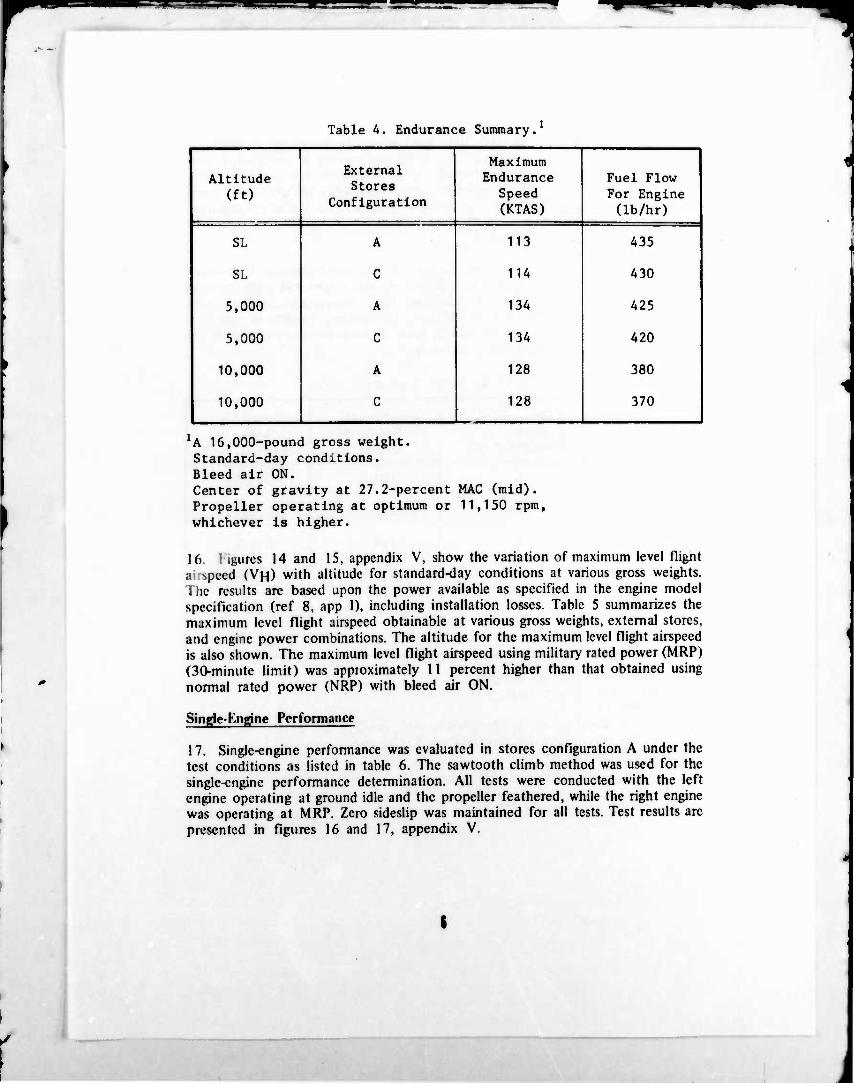
Table 4. Endurance Summary.1
Altitude (ft)
External Stores
Configuration
Maximum Endurance
Speed (KTAS)
Fuel Flow For Engine
(Ib/hr)
SL
SL
5,000
5,000
10,000
10,000
A
c
A
c
A
C
113
114
134
134
128
128
435
430
425
420
380
370
lA 16,000-pound gross weight. Standard-day conditions. Bleed air ON. Center of gravity at 27.2-percent MAC (mid). Propeller operating at optimum or 11,150 rpm, whichever is higher.
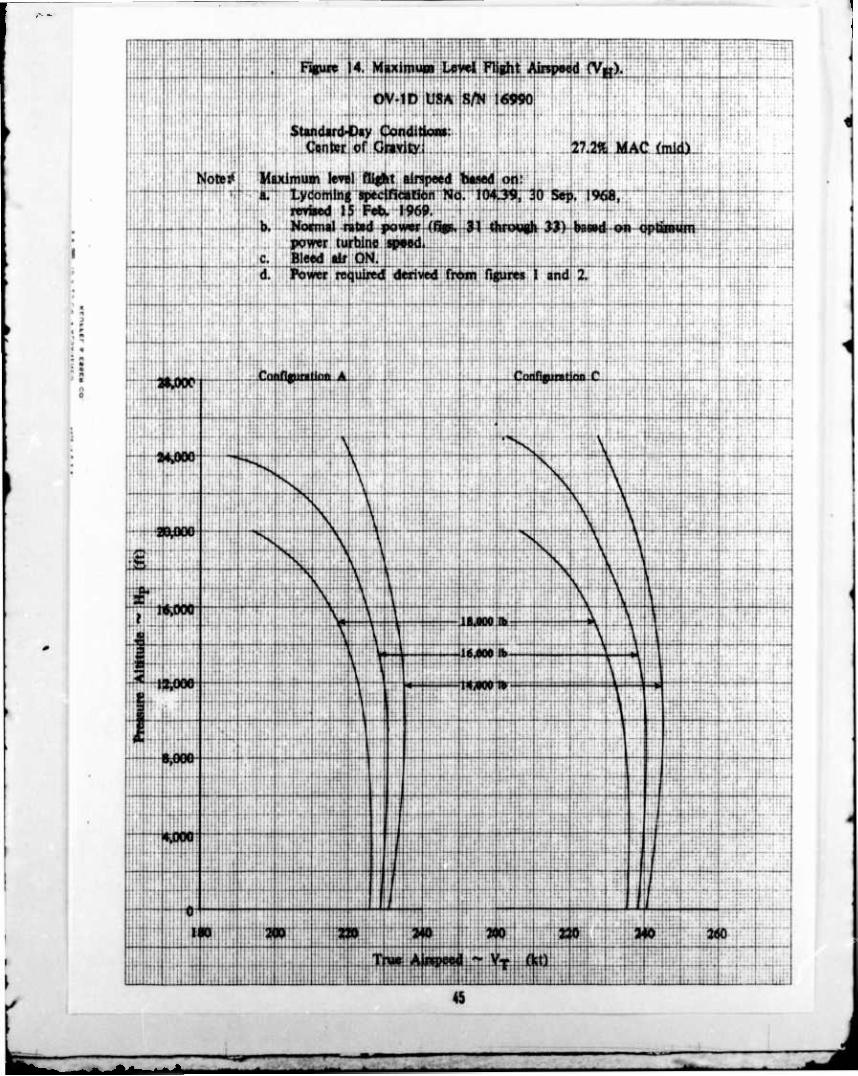
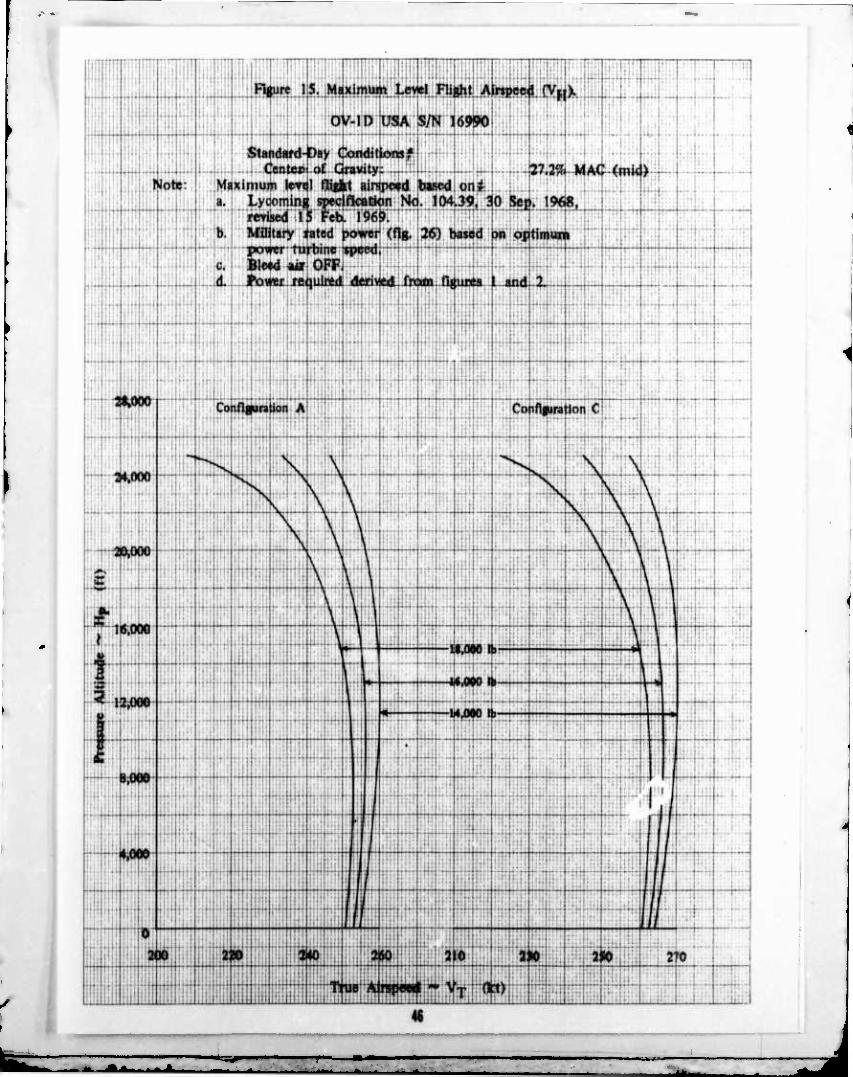
16. 1 igures 14 and 15, appendix V, show the variation of maximum level flignt a ^peed (VH) with altitude for standard-day conditions at various gross weights. 1 he results are based upon the power available as specified in the engine model specification (ref 8, app 1), including installation losses. Table 5 summarizes the maximum level flight airspeed obtainable at various gross weights, external stores, and engine power combinations. The altitude for the maximum level flight airspeed is also shown. The maximum level flight airspeed using military rated power (MRP) (30-minute limit) was approximately 11 percent higher than that obtained using normal rated power (NRP) with bleed air ON.
Single-Kngine Performance
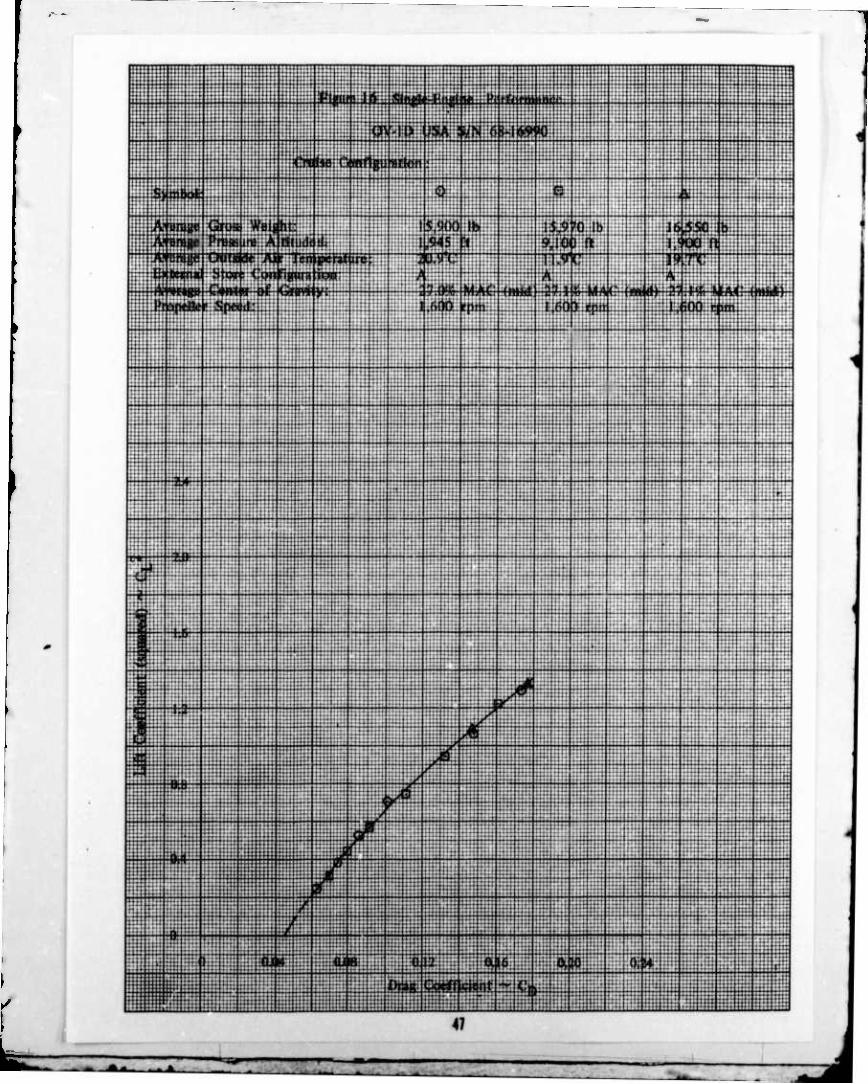
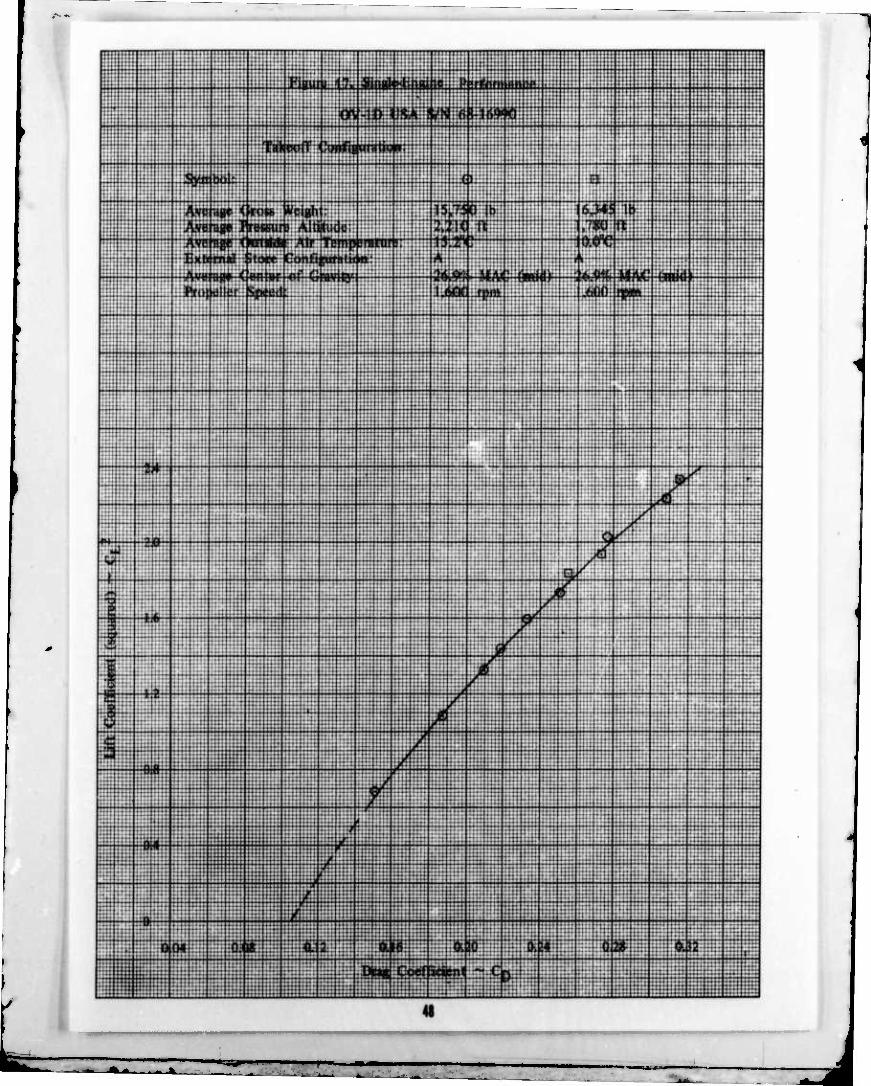
17. Single-engine performance was evaluated in stores configuration A under the test conditions as listed in table 6. The sawtooth climb method was used for the single-engine performance determination. All tests were conducted with the left engine operating at ground idle and the propeller feathered, while the right engine was operating at MRP. Zero sideslip was maintained for all tests. Test results are presented in figures 16 and 17, appendix V.
■■
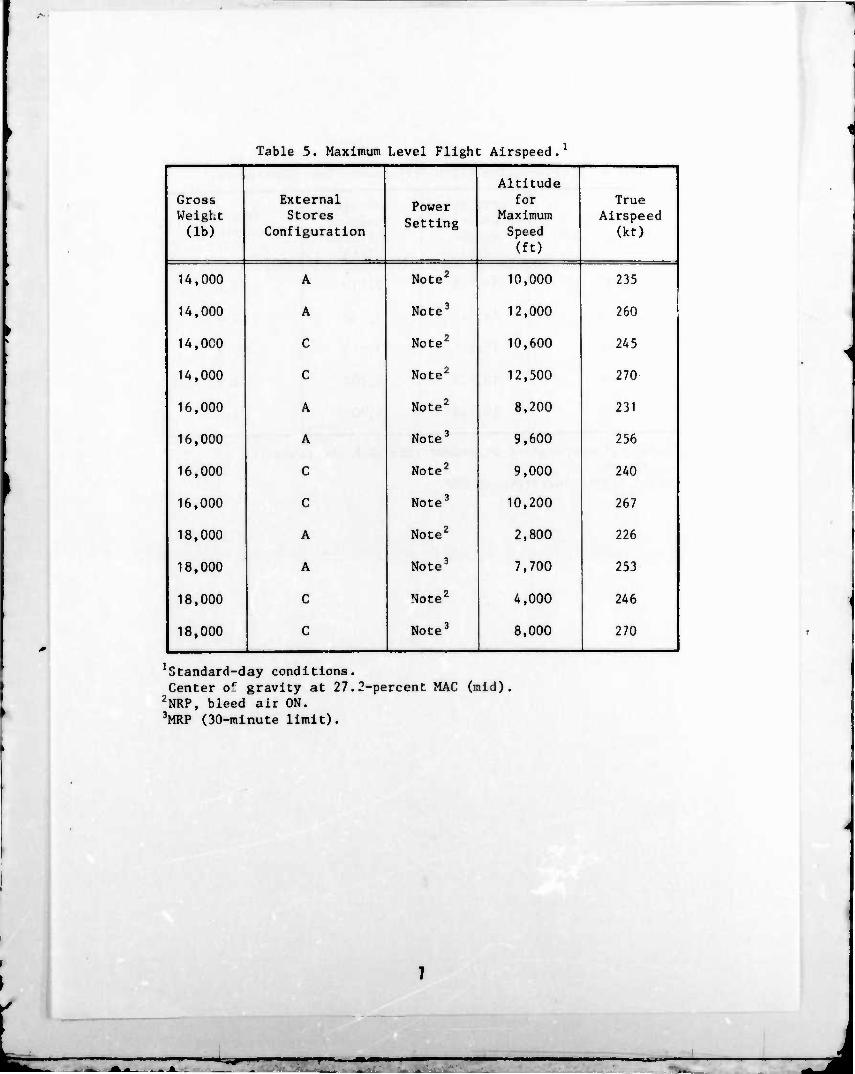
Table 5. Maximum Level Flight : Airspeed.1
Altitude Gross i External
Power Setting
for True j Weight
1 (lb) Stores
Configuration Maximum Speed
Airspeed 1 (kt) i
(ft)
14,000 A Note2 10,000 235
14,000 A Note3 12,000 260
14,000 C Note2 10,600 245
14,000 C Note2 12,500 270
16,000 A Note2 8,200 231
16,000 A Note3 9,600 256
16,000 C Note2 9,000 240
16,000 C Note3 10,200 267 j
18,000 A Note2 2,800 226 j
18,000 A Note3 7,700 253 \
18,000 i c Note2 4,000 246
18,000 C Note3 8,000 270 |
Standard-day conditions. Center or gravity at 27.2-percent MAC (mid).
?NRP, bleed air ON. 3MRP (30-minute limit).
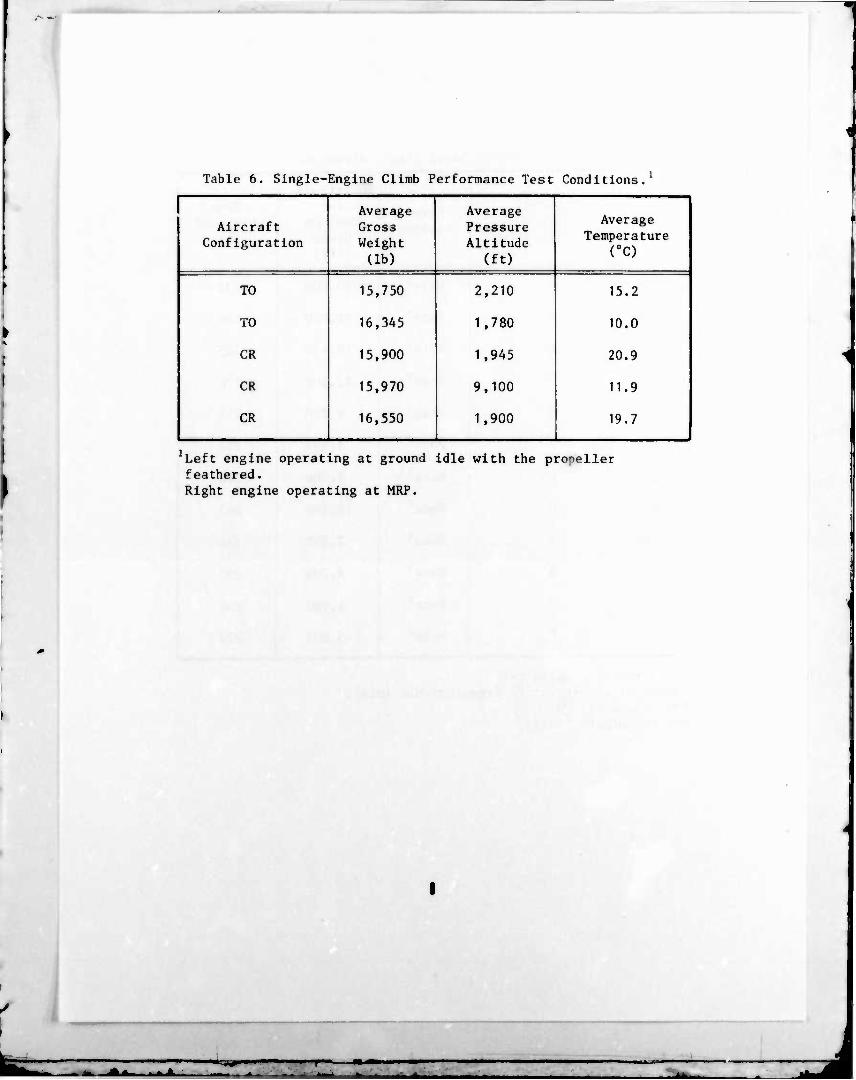
Table 6. Single-Engine Climb Performance Test Conditions.1
Aircraft S Configuration
Average Gross Weight (lb)
Average Pressure Altitude
(ft)
Average Temperature i
rc) i
' TO
TO
CR
CR
CR
15,750
16,345
15,900
15,970
16,550
2,210
1,780
1,945
9,100
1,900
15.2
10.0 I1
20.9
11.9 :
19.7 |
^eft engine operating at ground idle with the propeller feathered. Right engine operating at MRP.
.*▲.
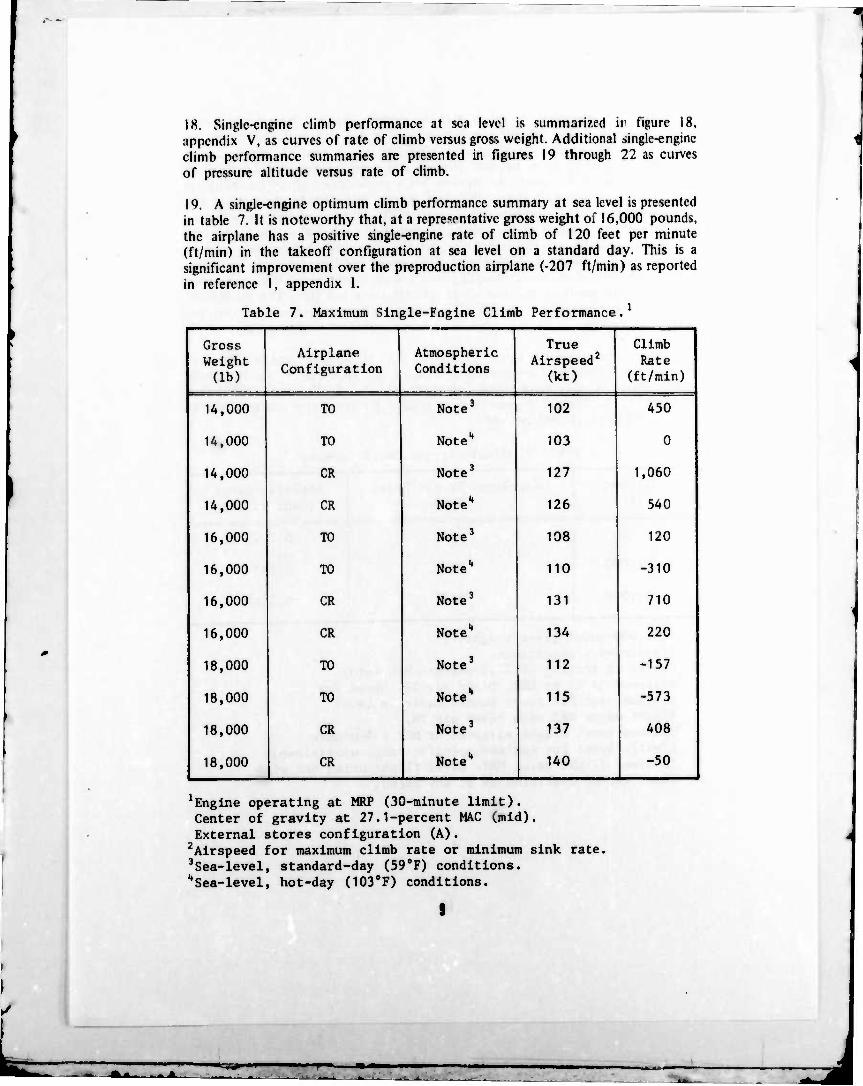
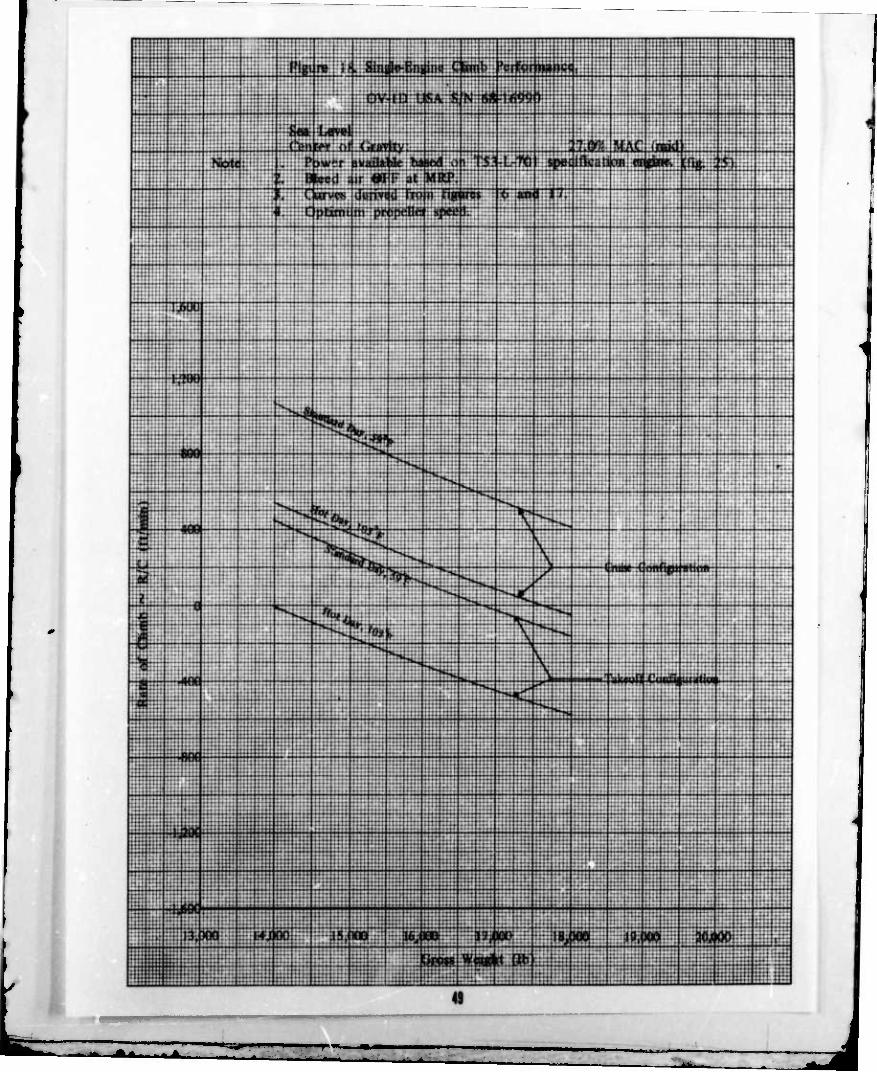
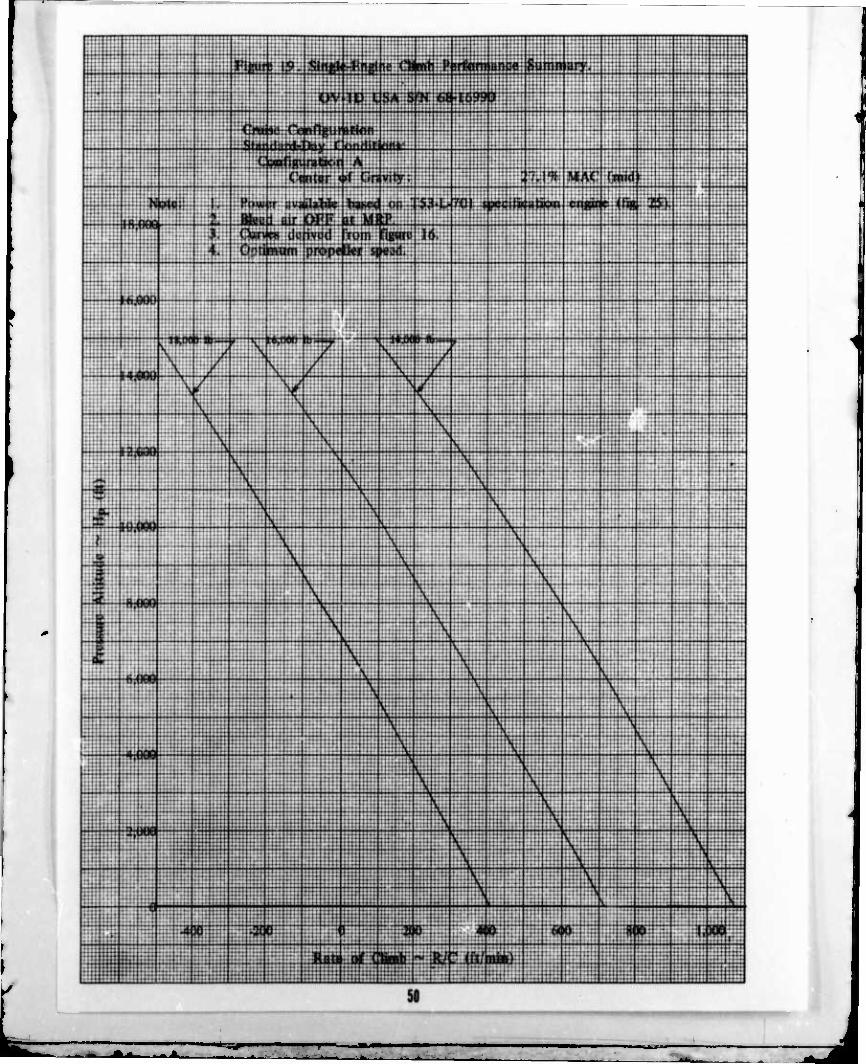
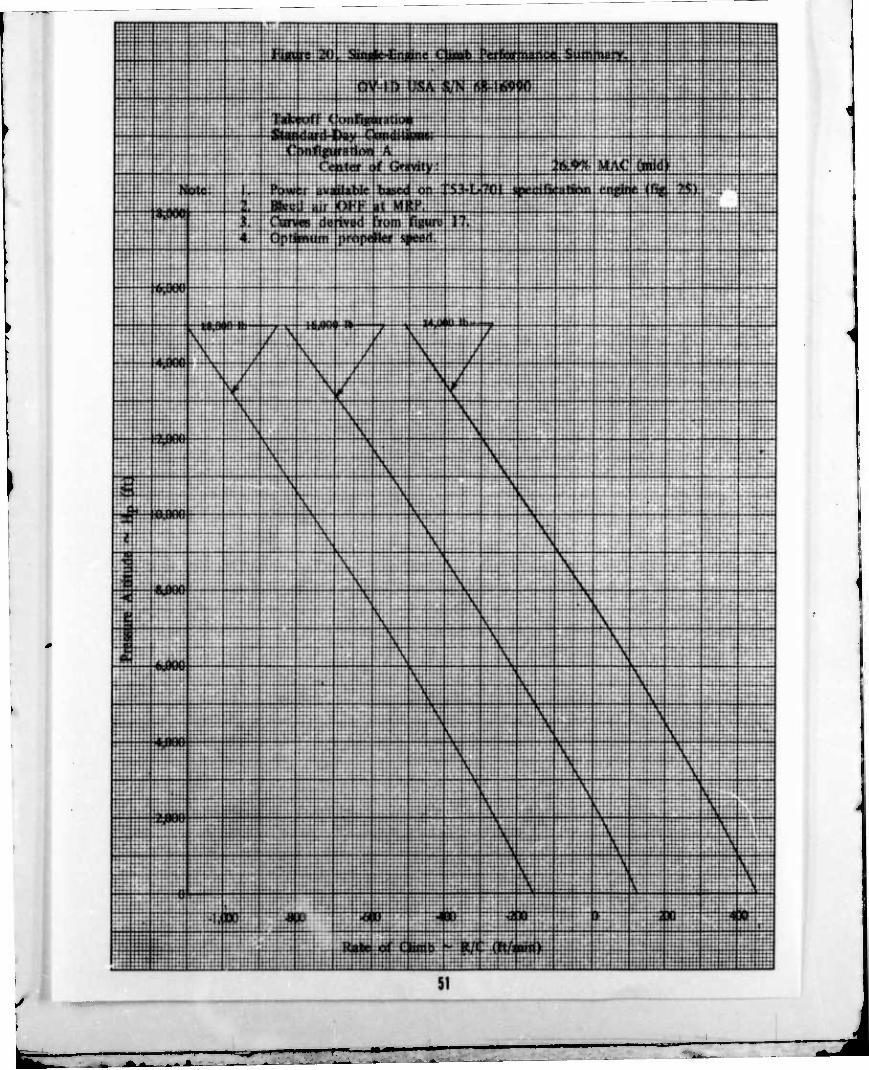
18. Single-engine climb performance at sea level is summarized ir figure 18, appendix V, as curves of rate of climb versus gross weight. Additional single-engine climb performance summaries are presented in figures 19 through 22 as curves of pressure altitude versus rate of climb.
19. A single-engine optimum climb performance summary at sea level is presented in table 7. It is noteworthy that, at a representative gross weight of 16,000 pounds, the airplane has a positive single-engine rate of climb of 120 feet per minute (ft/min) in the takeoff configuration at sea level on a standard day. This is a significant improvement over the preproduction airplane (-207 ft/min) as reported in reference 1, appendix I.
Table 7. Maximum Single-Engine Climb Performance i
j Gross 1 Weight ! (lb)
Airplane Configuration
Atmospheric Conditions
True J Airspeed2
(kt)
Climb j Rate j
(ft/min)
lA.OOO TO Note3 102 450 |
' 14,000 TO Note" 103 o j
U.OOO CR Note3 127 1,060 I
1 14,000 CR Note" 126 540 |
1 16,000 TO Note3 108 120 j
j 16,000 TO Note1* 110 -310 !
1 16,000 CR Note3 131 710 |
j 16,000 CR Note" 134 220 j
18,000 TO Note3 112 -157
18,000 \ TO Note" 115 -573 1
1 18,000 CR i Note3 137 408 j
18,000 CR Note" 140 -50
Engine operating at MRP (30-minute limit). Center of gravity at 27.1-percent MAC (mid). External stores configuration (A).
2Airspeed for maximum climb rate or minimum sink rate, 3Sea-level, standard-day (590F) conditions. "Sea-level, hot-day (103oF) conditions.
U_
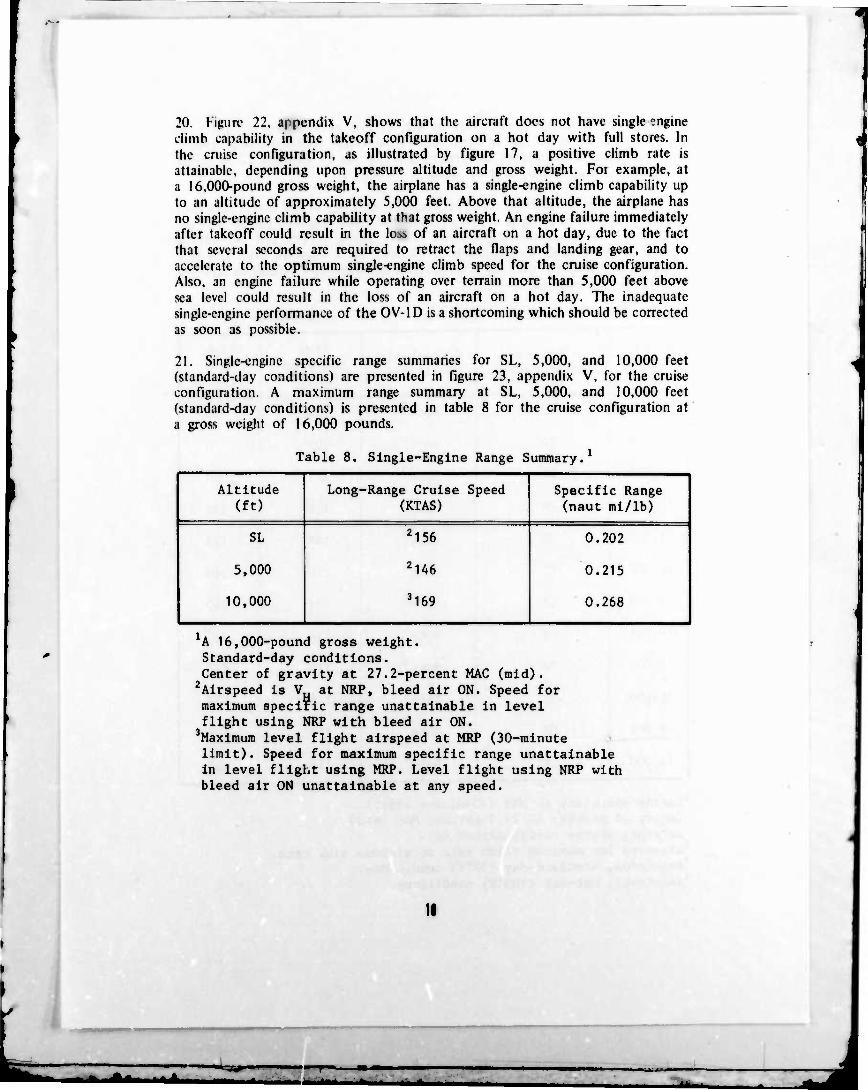
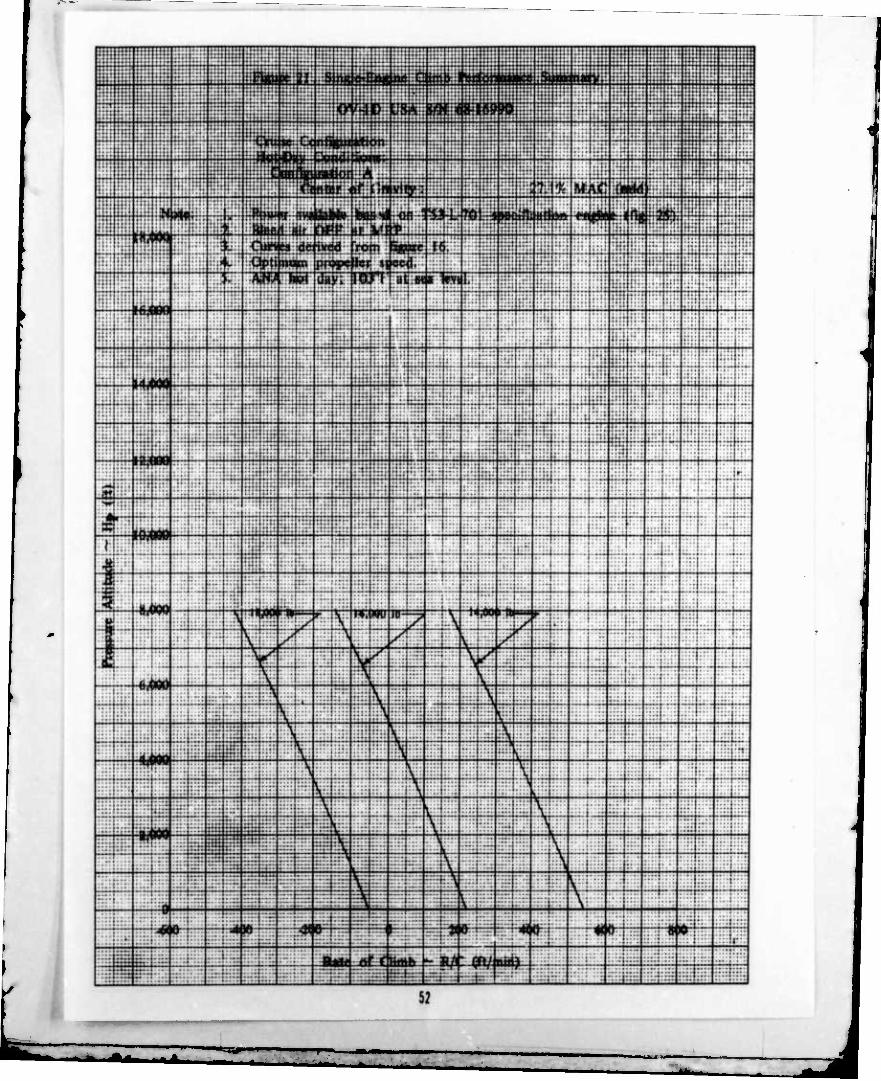
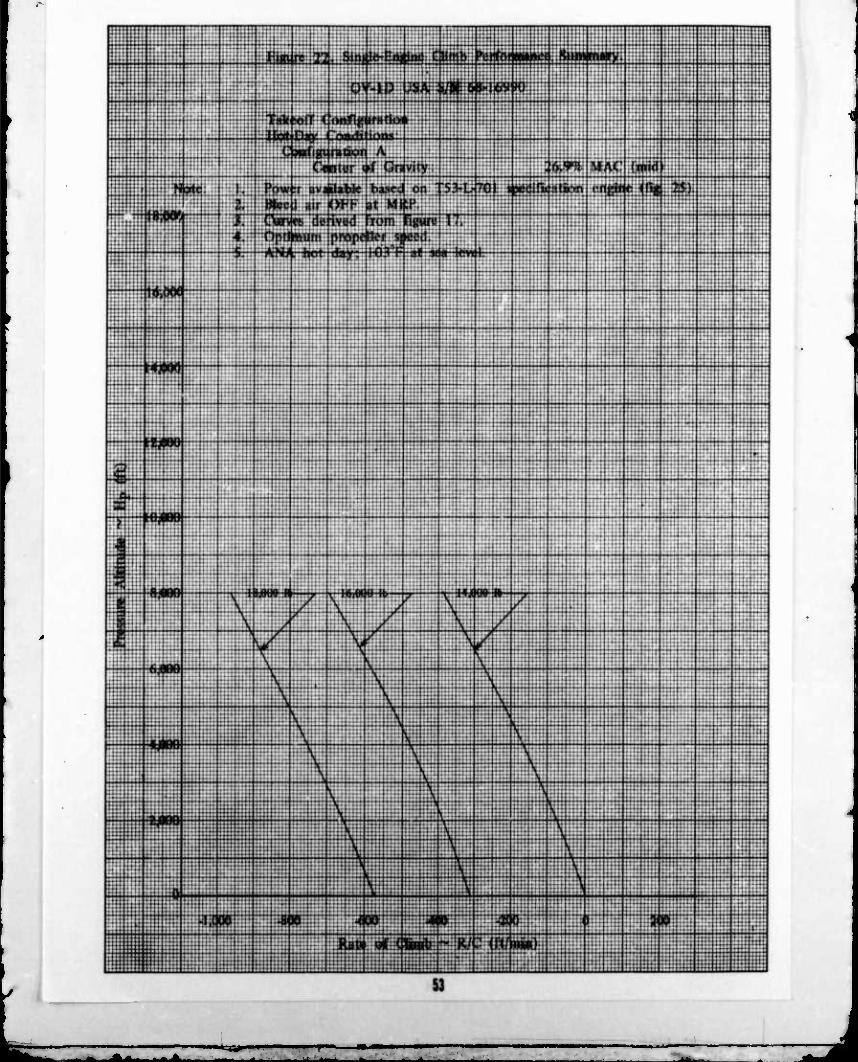
20. FigiiR" 22, appendix V, shows that the aircraft does not have single ?ngine climb capability in the takeoff configuration on a hot day with full stores. In the cruise configuration, as illustrated by figure 17, a positive climb rate is attainable, depending upon pressure altitude and gross weight. Foi example, at a 16,000-pound gross weight, the airplane has a single-engine climb capability up to an altitude of approximately 5,000 feet. Above that altitude, the airplane has no single-engine climb capability at that gross weight. An engine failure immediately after takeoff could result in the los^ of an aircraft on a hot day, due to the fact that several seconds are required to retract the flaps and landing gear, and to accelerate to the optimum single-engine climb speed for the cruise configuration. Also, an engine failure while operating over terrain more than 5,000 feet above sea level could result in the loss of an aircraft on a hot day. The inadequate single-engine performance of the OV-ID is a shortcoming which should be corrected as soon as possible.
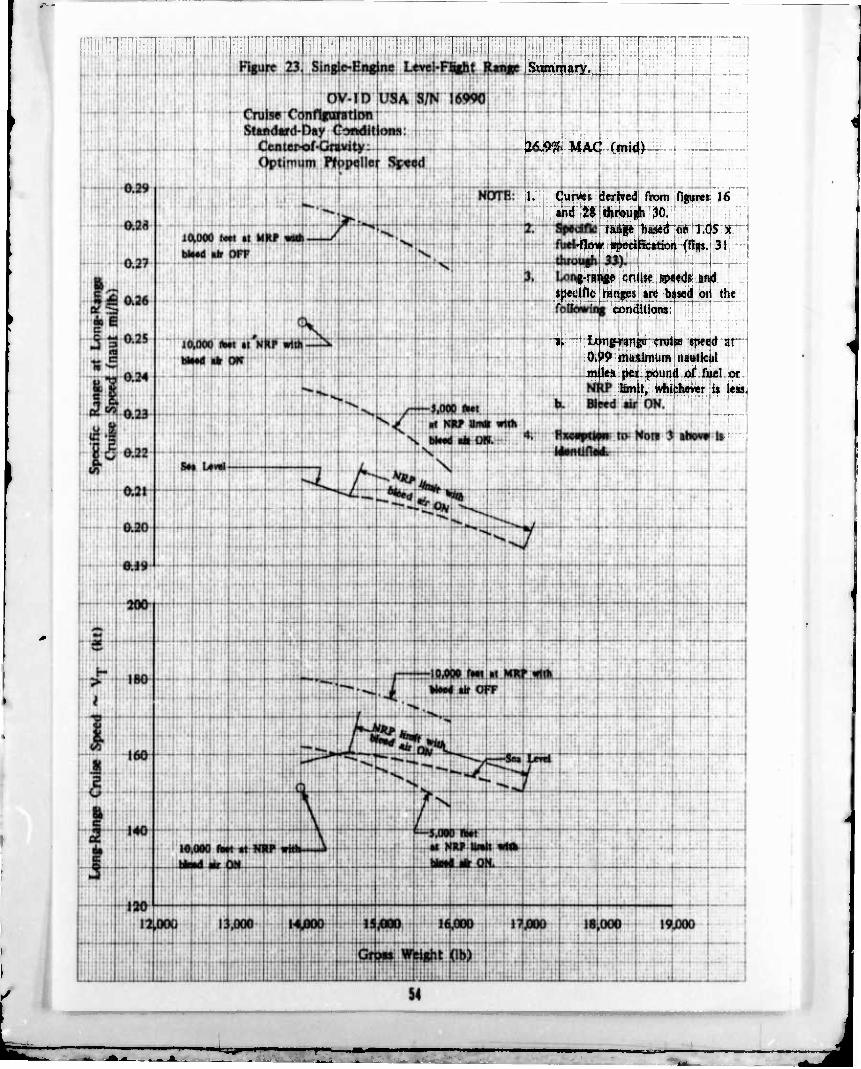
21. Single-engine specific range summaries for SL, 5,000, and 10,000 feet (standard-day conditions) are presented in figure 23, appendix V, for the cruise configuration. A maximum range summary at SL. 5,000, and 10,000 feet (standard-day conditions) is presented in table 8 for the cruise configuration at a gross weight of 16,000 pounds.
Table 8. Single-Engine Range S ununary.
} Altitude
1 (ft) Long-Range Cruise Speed
(KTAS) Specific Range j (naut mi/lb)
SL 2156 0.202 1
1 5,000 2U6 0.213
10,000 3169 0.268
'A 16,000-pound gross weight. Standard-day conditions. Center of gravity at 27.2-percent MAC (mid).
2Alrspeed is V at NRP, bleed air ON. Speed for maximum speciric range unattainable in level flight using NRP with bleed air ON.
3Maximum level flight airspeed at MRP (30-minute limit). Speed for maximum specific range unattainable in level flight using MRP. Level flight using NRP with bleed air ON unattainable at any speed.
II
- *"- --" — ^M*
Takeoff and Landing
22. Takeoff and landing distances at different airspeeds were determined by using a Fairchild Flight Analyzer. These distances were corrected to SL, standard-day conditions.
23. The shortest takeoff distance at a 17,800-pound gross weight was achieved at a takeoff airspeed of 89 knots true airspeed (KTAS). At this airspeed, 1,398 feet were required for liftoff, and an additional 510 feet were required to clear a 50-foot obstacle. To achieve the takeoff attitude, it was n.-cessary for the pilot to depress the nose-gear shock strut by moving the control stick forward at approximately 3 knots below the rotation speed vo use the rebound from the shock strut to aid rotation as the control stick was pulled aft. Once the rotational takeoff attitude was achieved, it was necessary for the pilot to move the control stick forward in order to prevent overrotation. Although the airplane was controlled easily at 89 KTAS, the use of the nose strut rebound technique to achieve takeoff attitude is not presently recommended as an operational procedure.
24. The shortest landing distance at a 16,000-pound gross weight was achieved at an approach airspeed of 95 KTAS, with a landing sink rate of approximately 600 ft/min. Full reverse thrust was applied immedi. ^i> after touchdown and held until the aircraft came to a stop. Additionally, braking was used after the ground speed had decreased to approximately 30 knots. Using this landing technique, the ground roll was 700 feet. An additional 750 feet were required from the point where a 50-foot obstacle was cleared to touchdown.
■
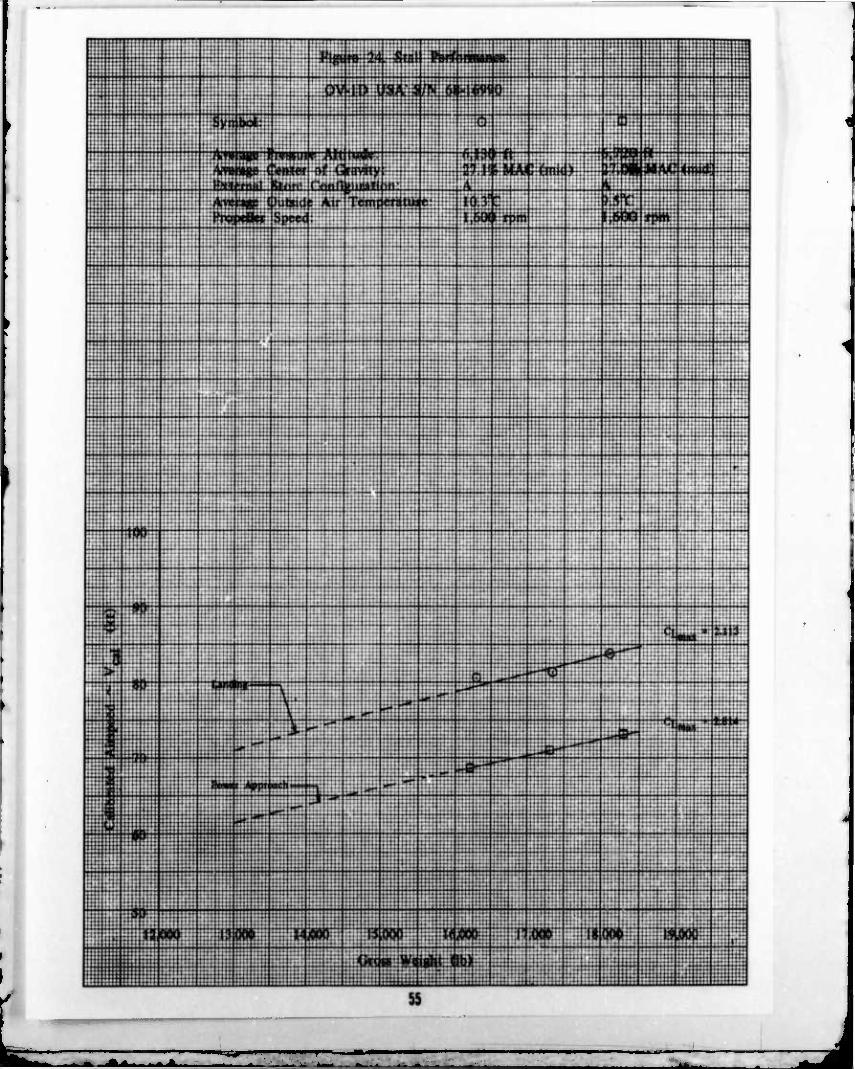
Stall Performance
25. Stall performance tests were conducted to determine the stall speed in stores configuration A in the power approach and landing configurations. The aircraft was decelerated at approximately 1 knot per second until the stall occurred. These tests were conducted at an average pressure altitude of 6,425 feet and at the mid eg loading. The variation in stall speed versus gross weight is shown in figure 24, appendix V.
26. At a representative gross weight of 16,000 pounds, the OV-1D stall speed in the landing configuration was 79 knots calib.ated airspeed (KCAS) and was 68 KCAS in the power approach configuration. The stall speed decreased approximately 2.5 knots for each 1,000-pound decrease in gross weight in the landing configuration, and 2.1 knots per 1,000 pounds in the power approach configuration.
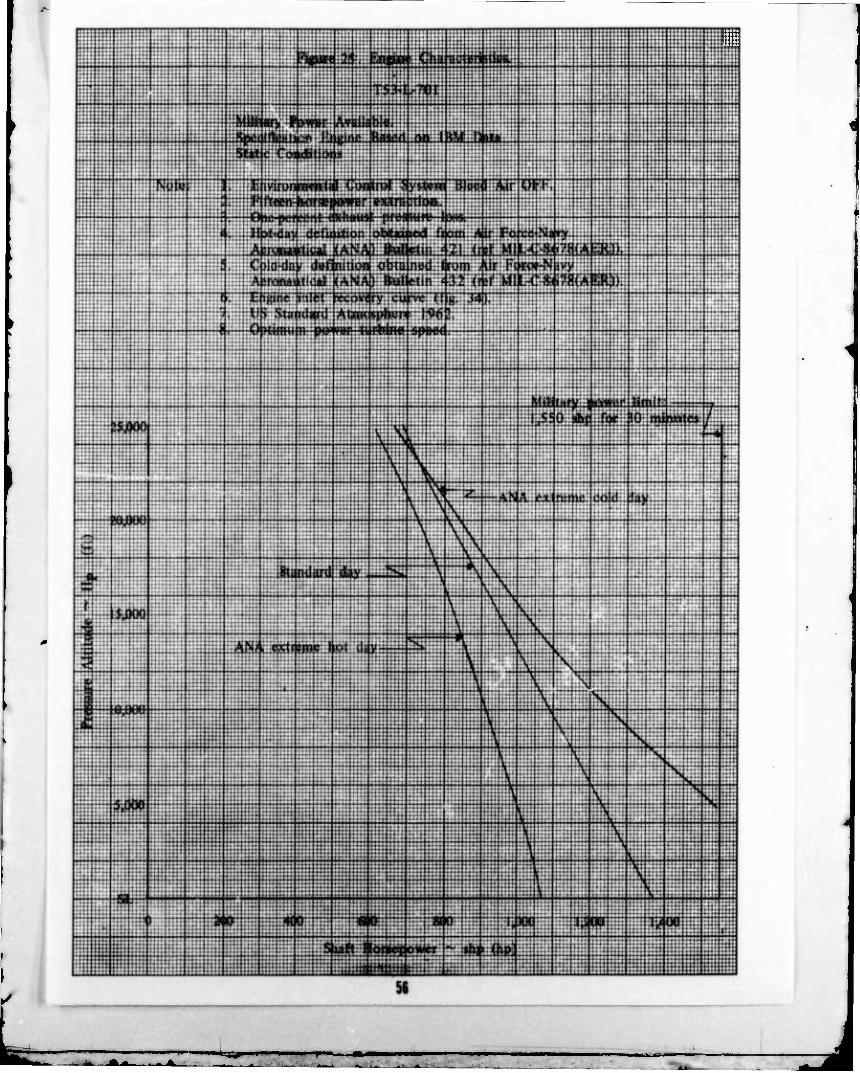
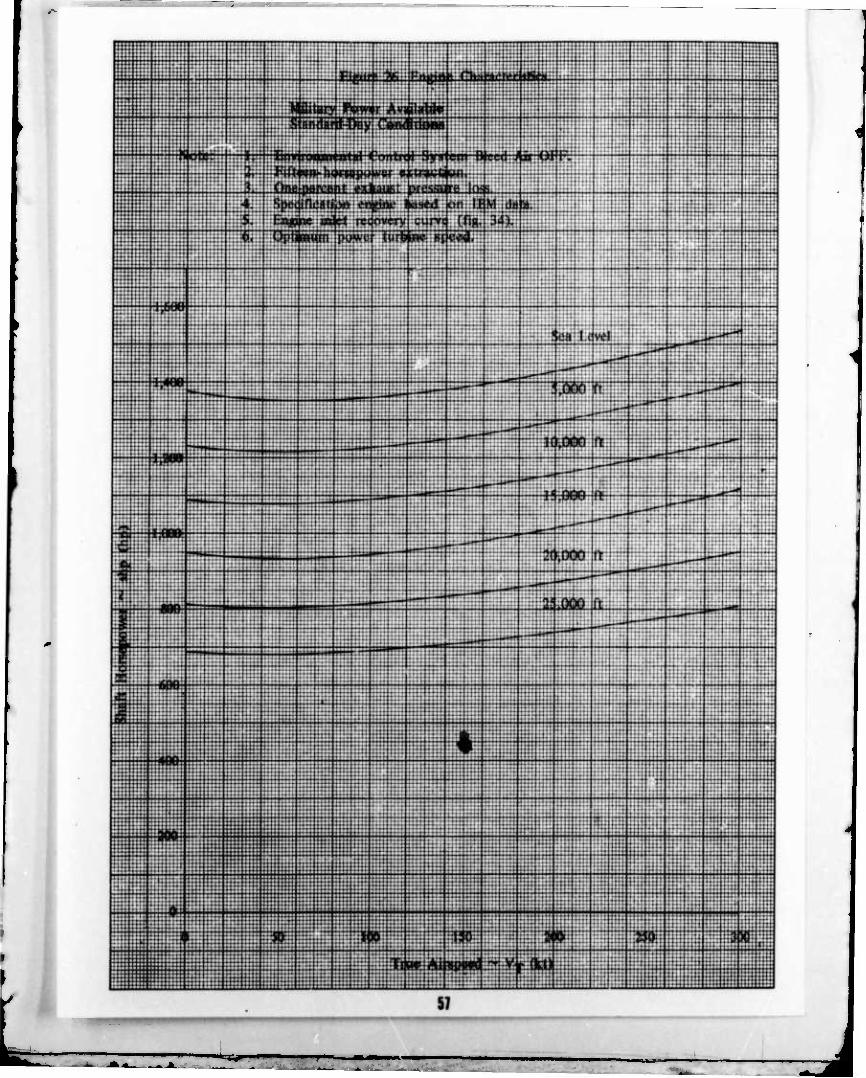
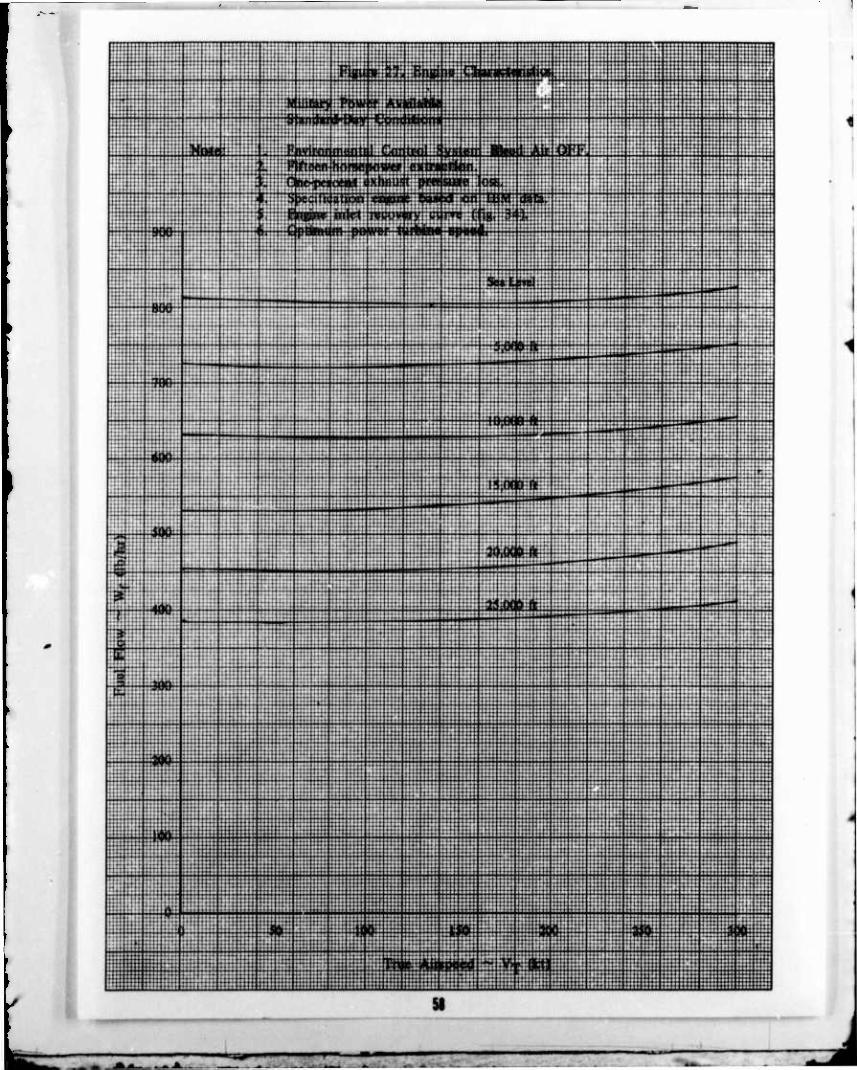
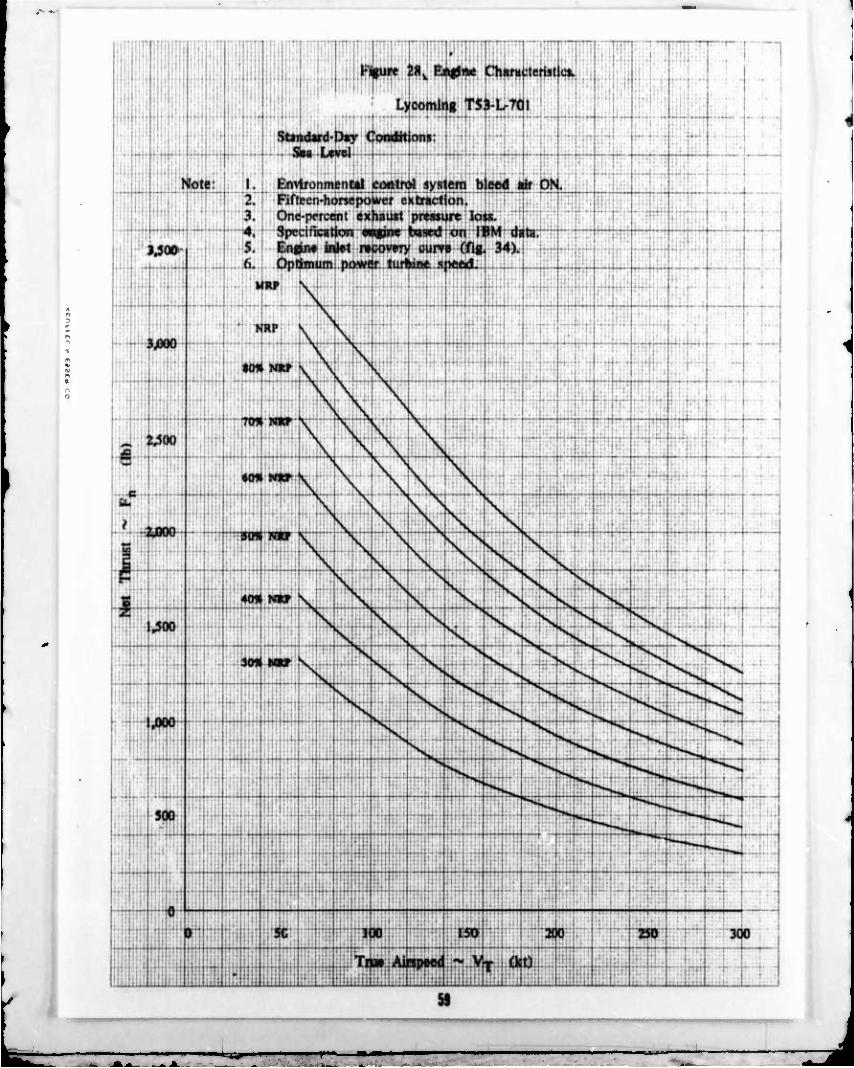
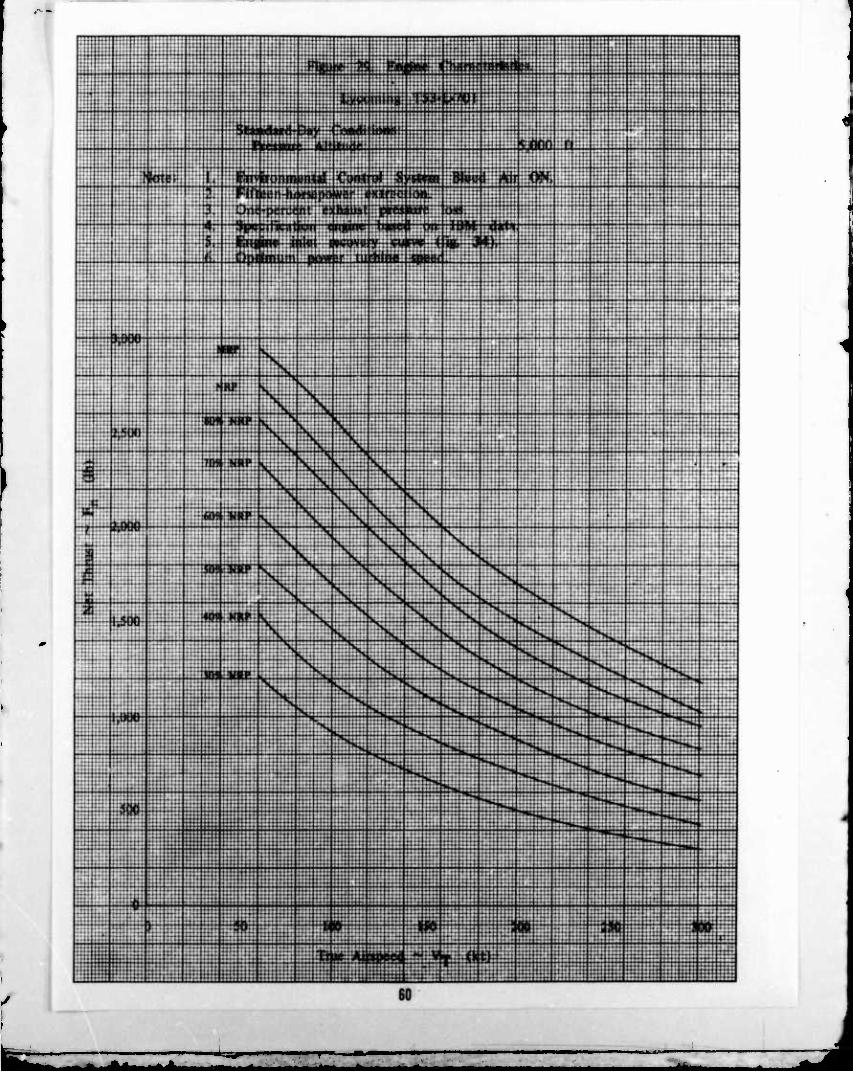
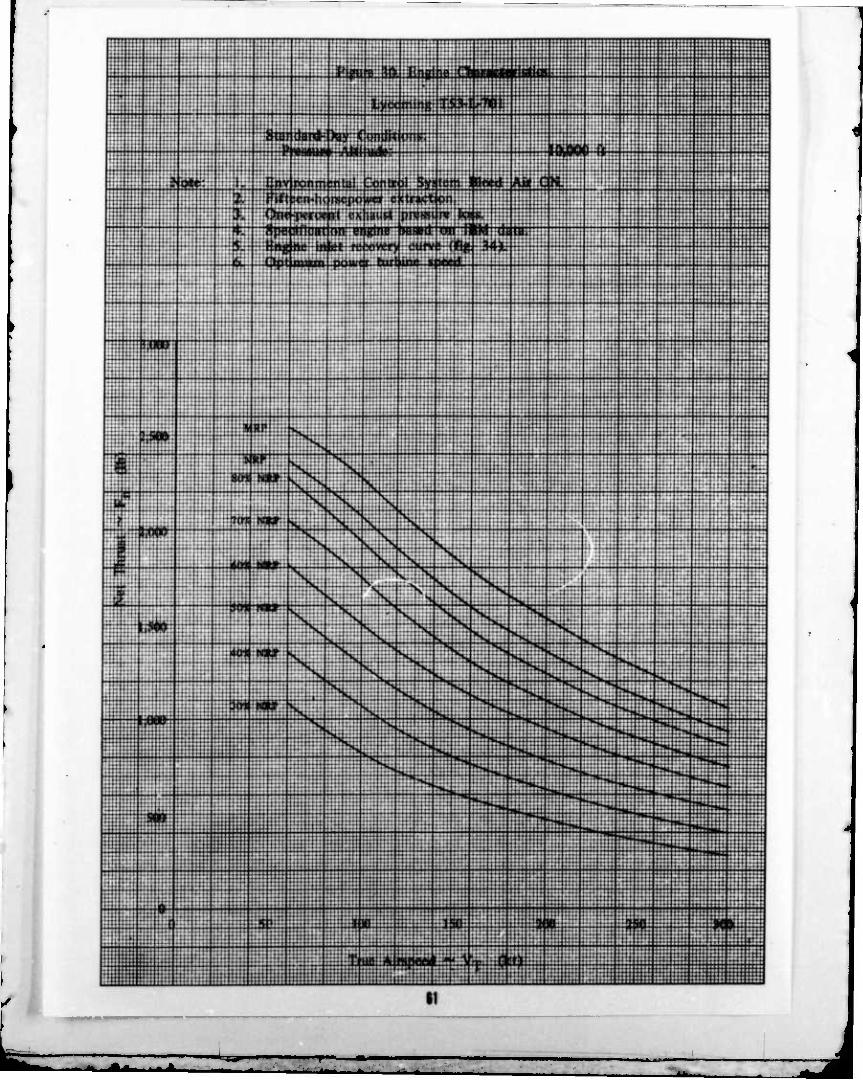
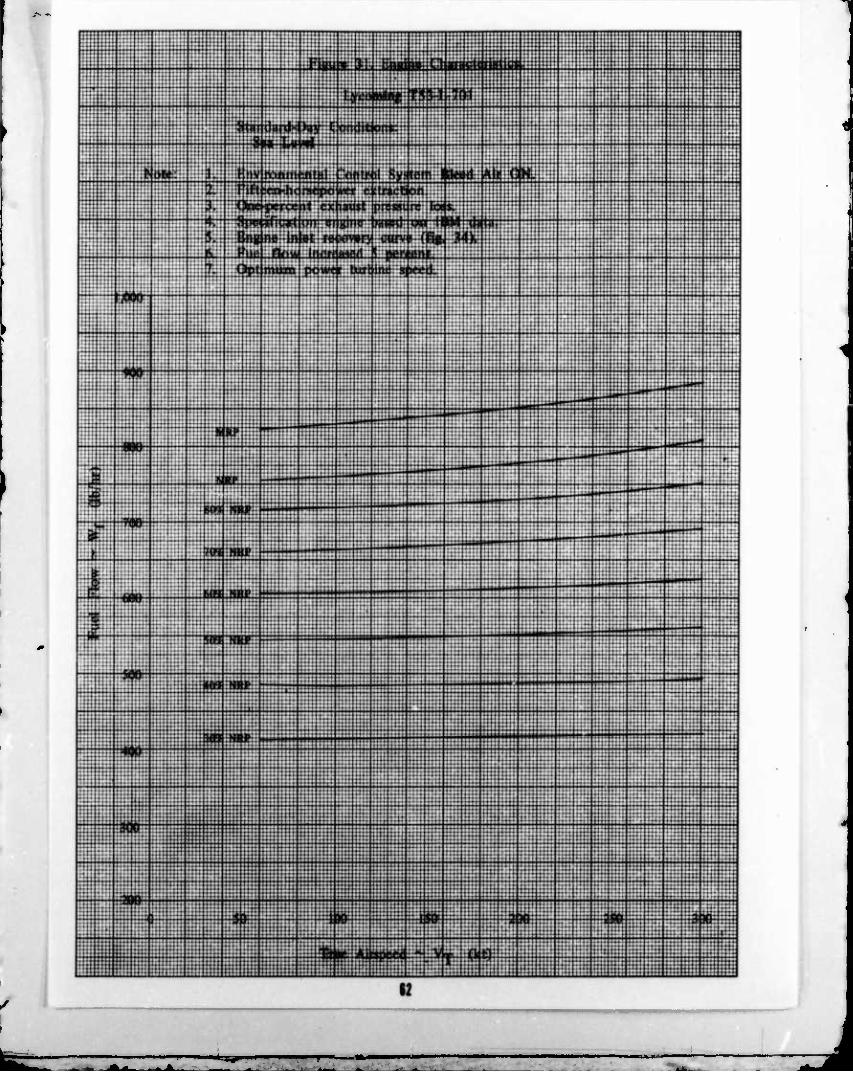
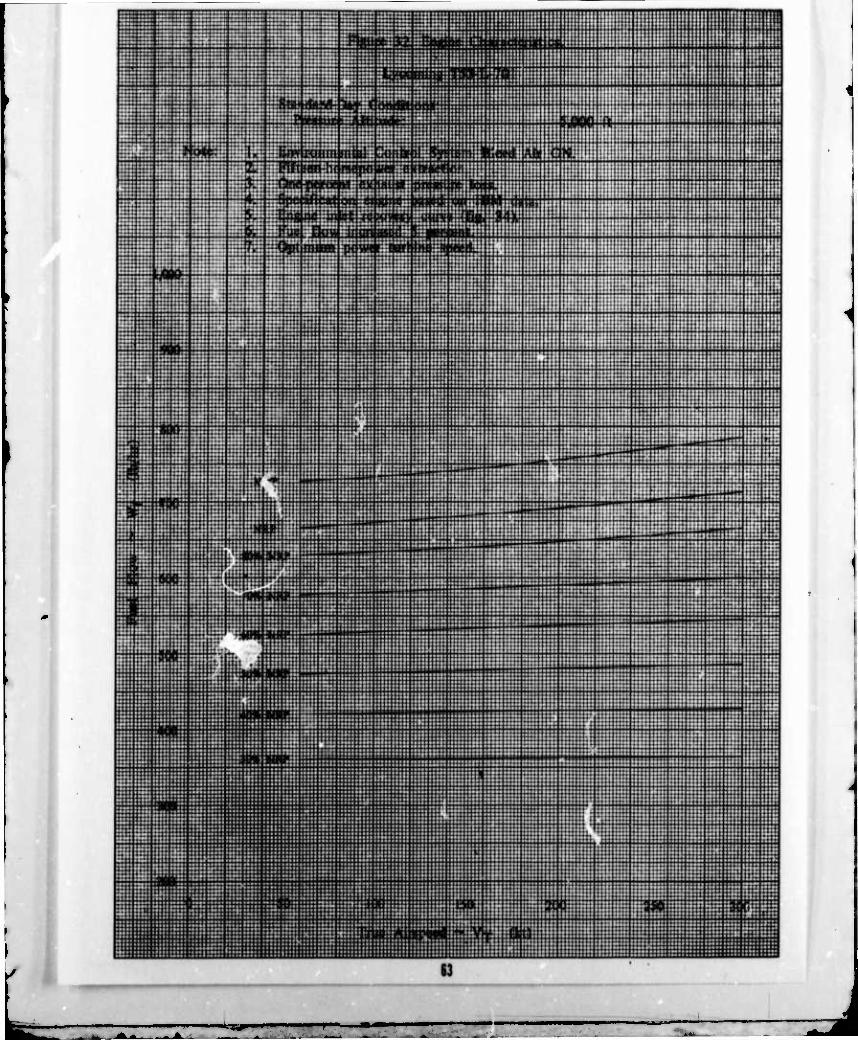
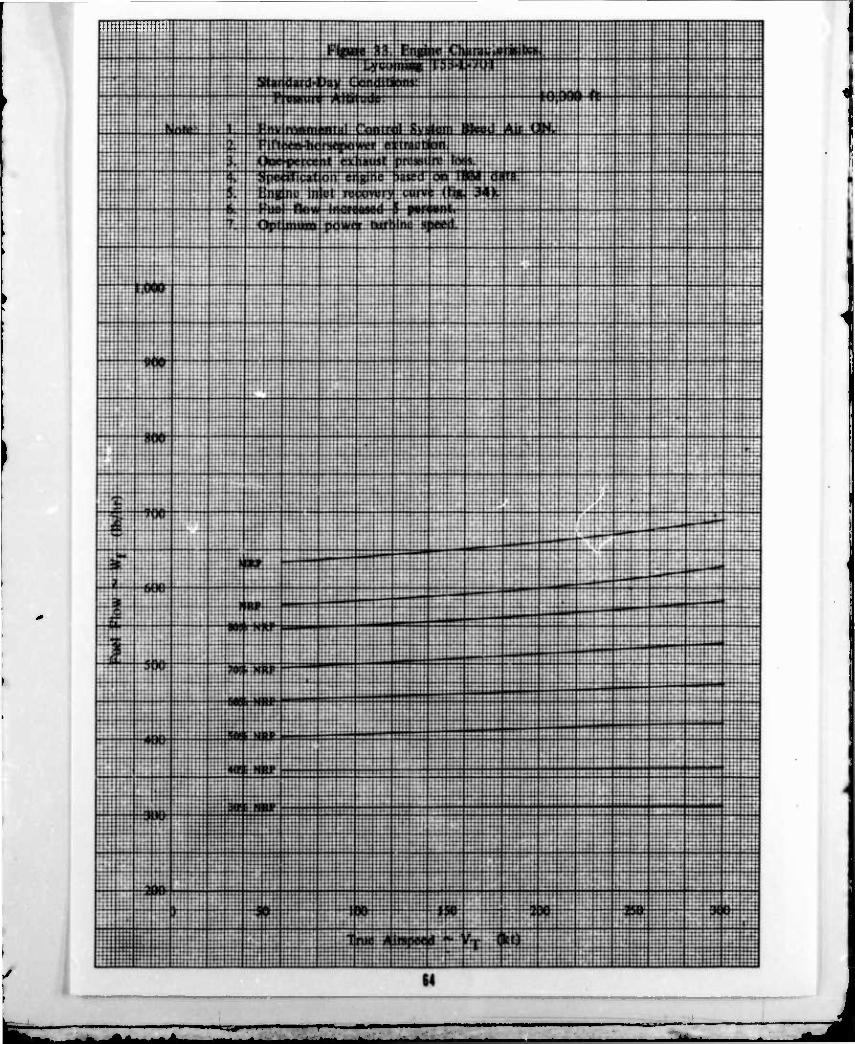
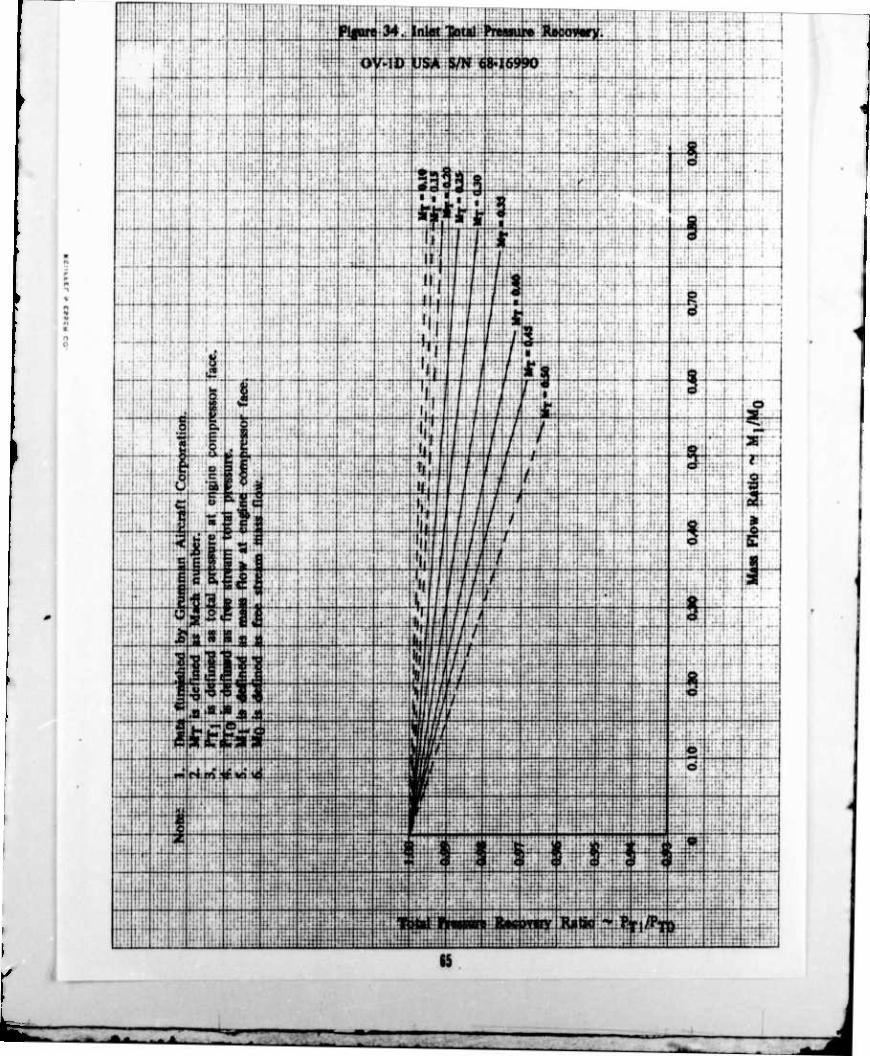
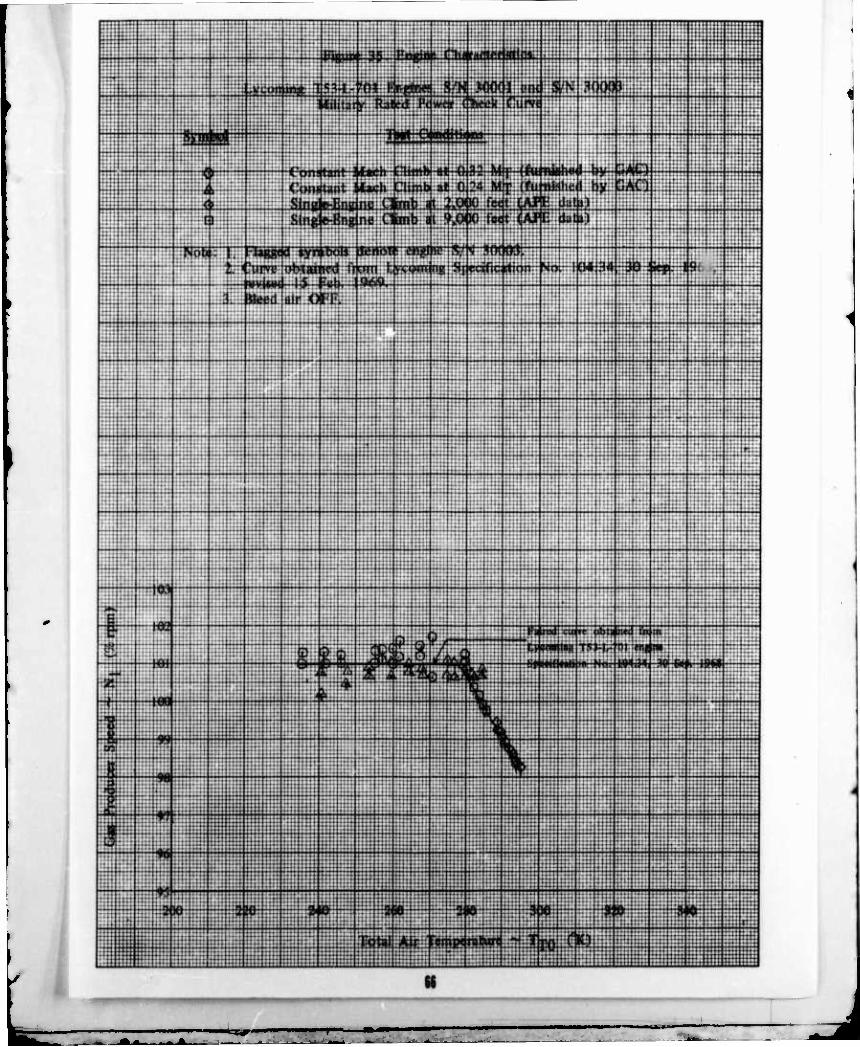
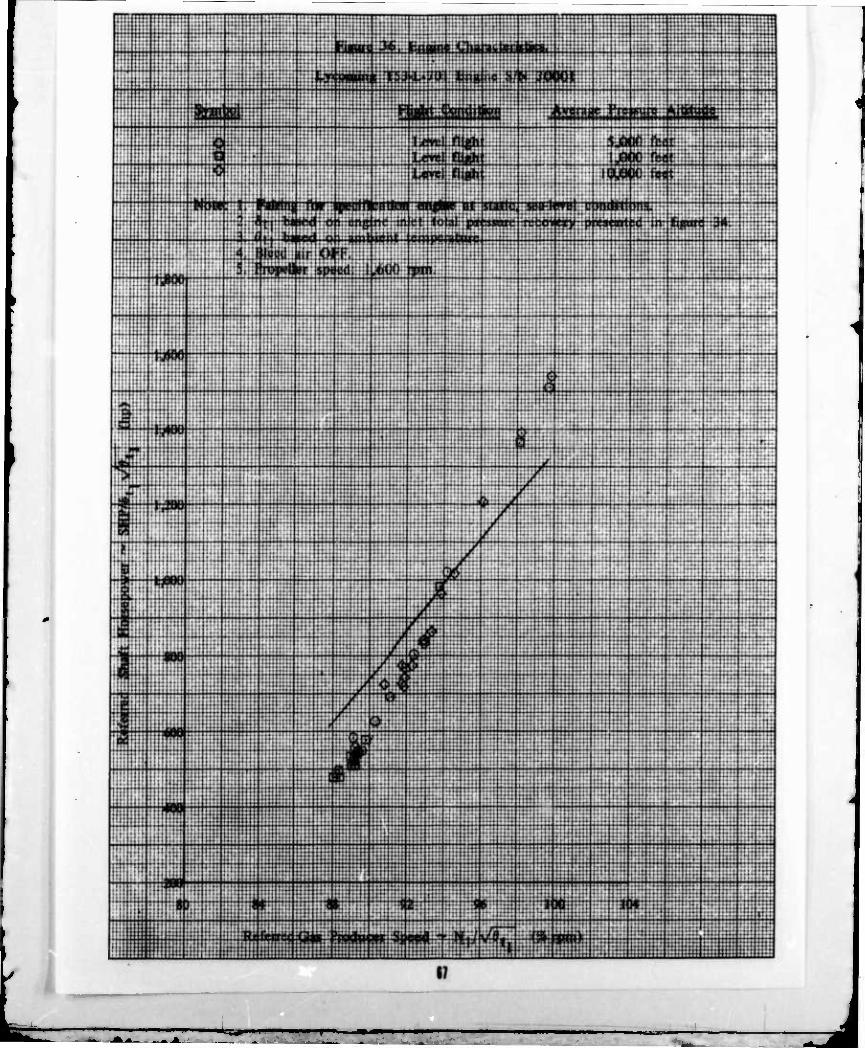
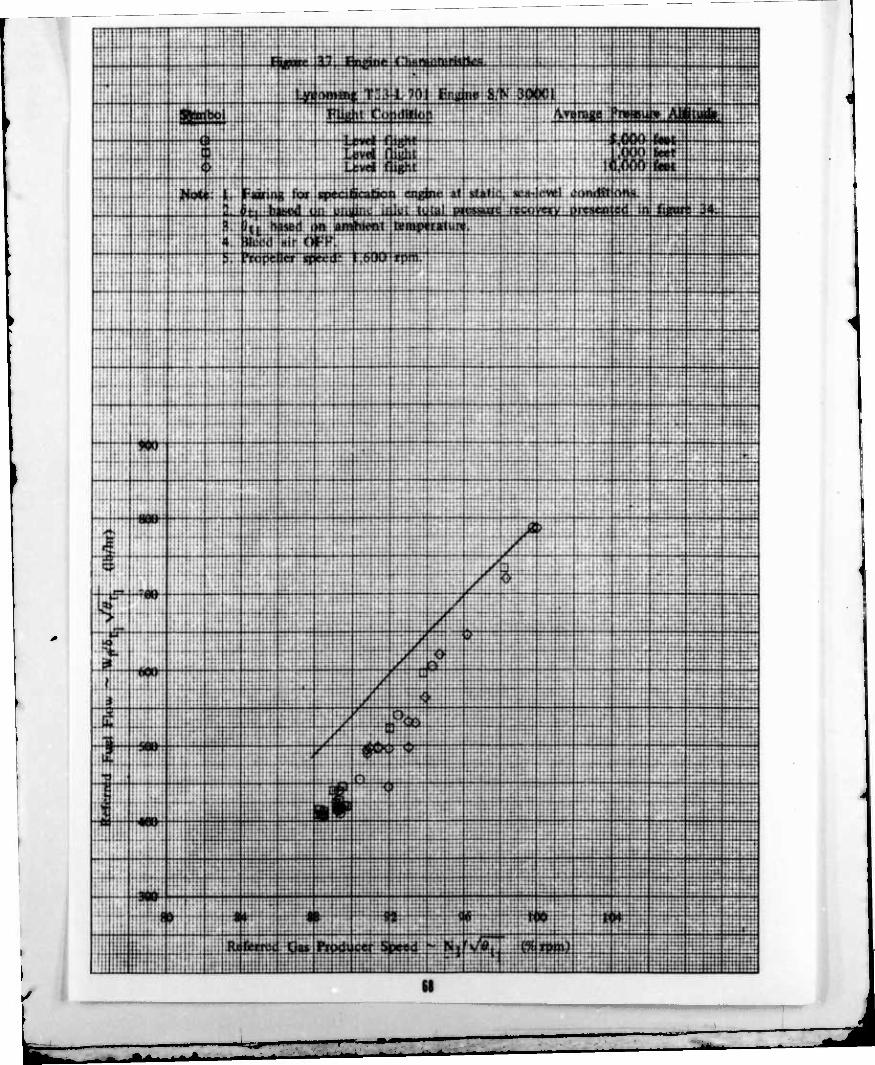
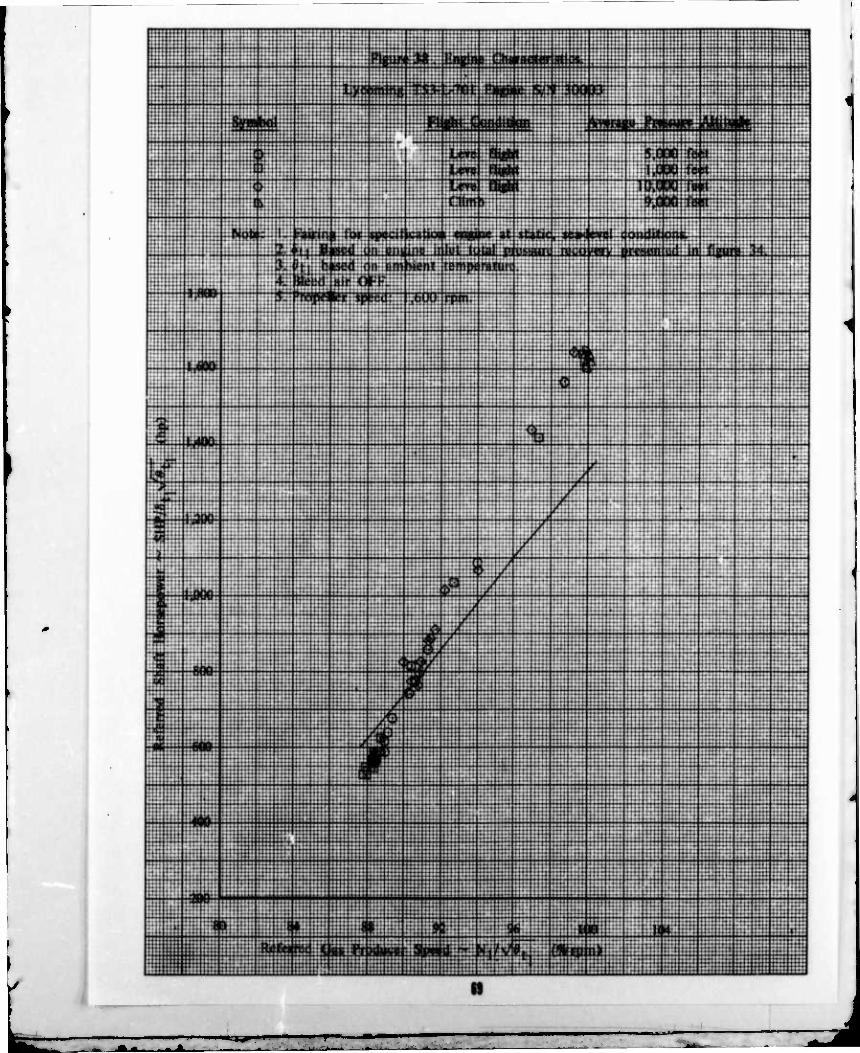
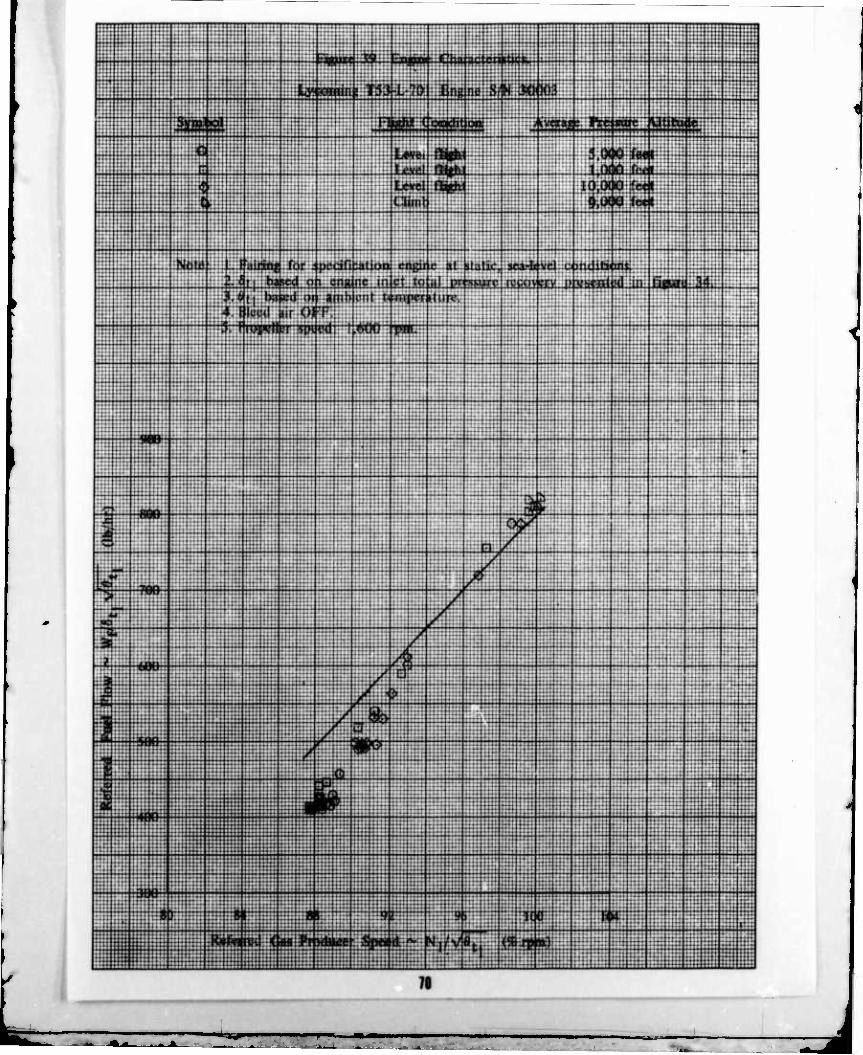
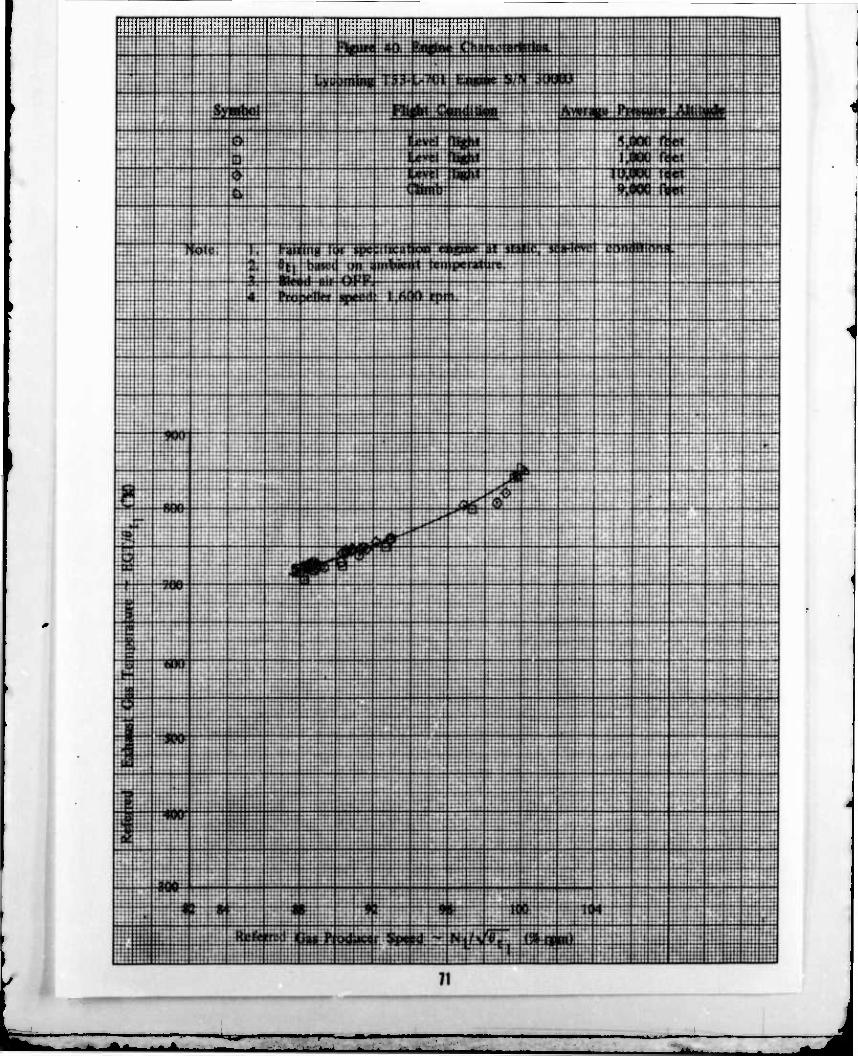
27. The shaft horsepower available and fuel-flow rate of a specification engine, including all installation losses, are illustrated in figures 25 through 27, appendix V. Figures 28 through 30 illustrate the variation of net thrust with airspeed for an installed specification engine (propeller efficiency and installation losses included) for various power settings. The variation of fuel flow with airspeed is illustrated in figures 31 through 33 for various power settings. Figure 34
11
.*•*
presents the engine inlet pressure recovery data which were furnished by the airframe manufacturer. Figures 35 through 41 show the performance of the installed test engines.
12
=**■
CONCLUSIONS
GENERAL
28. The following conclusions were reached upon completion of the performance tests of the OV-1D airplane:
a. The performance of the OV-1D airplane is satisfactory for accomplishment of the surveillance mission.
b. One performance shortcoming was identified during the evaluation.
SHORTCOMING AFFECTING MISSION ACCOMPLISHMENT
29. Inadequate single-engine performance is a shortcoming, correction of which is desirable for improved aircraft operation (para 20).
- A' - M
RECOMMENDATIONS
30. The inadequate single-engine performance of the OV-1D should be corrected
as soon as possible (para 29).
31. Further testing should be conducted on the OV-1D in order to produce current
data for the operator's manual (para 12).
u
•
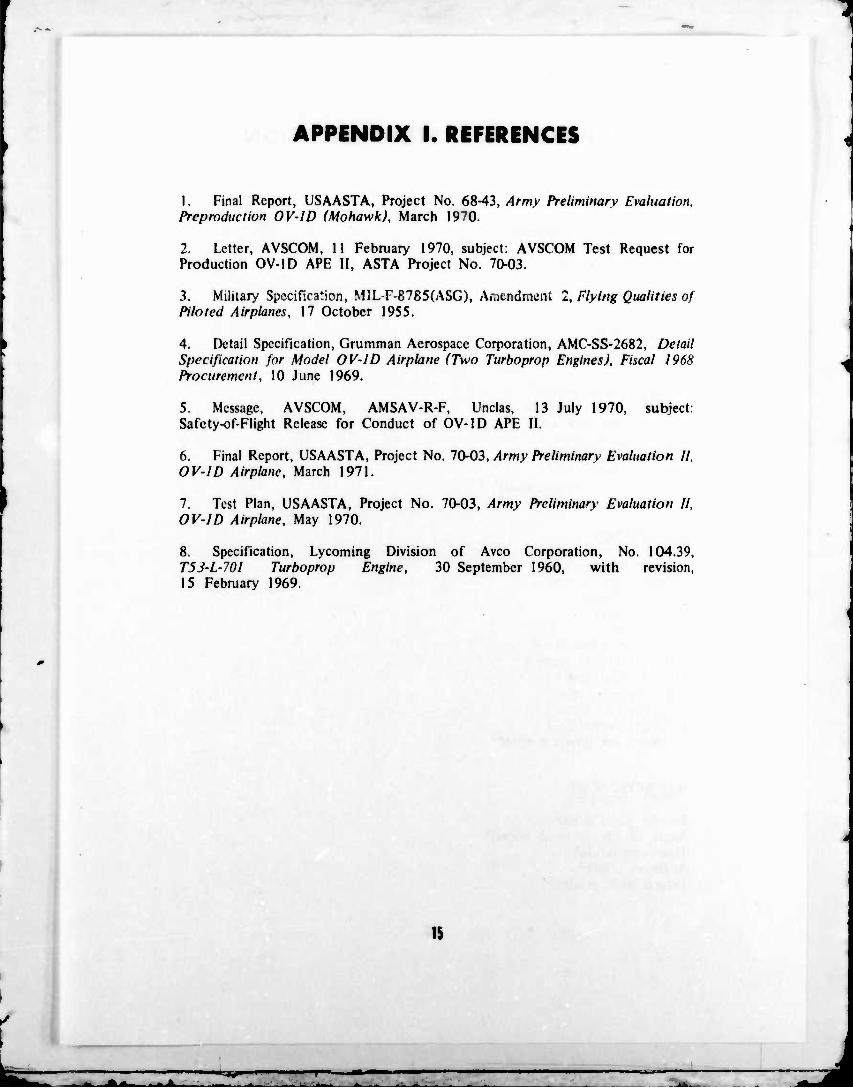
APPENDIX I. REFERENCES
1. Final Report, USAASTA, Project No. 6S-43, Army Preliminary Evaluation. Prcproduction 0V-1D (Mohawk), March 1970.
2. Letter, AVSCOM, 11 February 1970, subject: AVSCOM Test Request for Production OV-1D APE II, ASIA Project No. 70-03.
I. Military Specification, MIL-F-8785(ASG), Amendment 2, Flying Qualities of Piloted Airplanes, 17 October 1955.
4. Detail Specification, Grumman Aerospace Corporation, AMC-SS-2682, Detail Specification for Model OV-ID Airplane (Two Turboprop Engines), Fiscal 1968 Procurement, 10 June 1969.
5. Message, AVSCOM, AMSAV-R-F, Unclas, 13 July 1970, subject: Safety-of-Flight Release for Conduct of OV-ID APE II.
6. Final Report, USAASTA, Project No. 70-03, Army Preliminary Evaluation 11. OV-ID Airplane, March 1971.
7. Test Plan, USAASTA, Project No. 70-03, Army Preliminary Evaluation II, OV-ID Airplane, May 1970.
8. Specification, Lycoming Division of Avco Corporation, No. 104.39, T5J-L-70I Turboprop Engine, 30 September 1960, with revision, 15 February 1969.
15
■N»
I^lll I III II ^
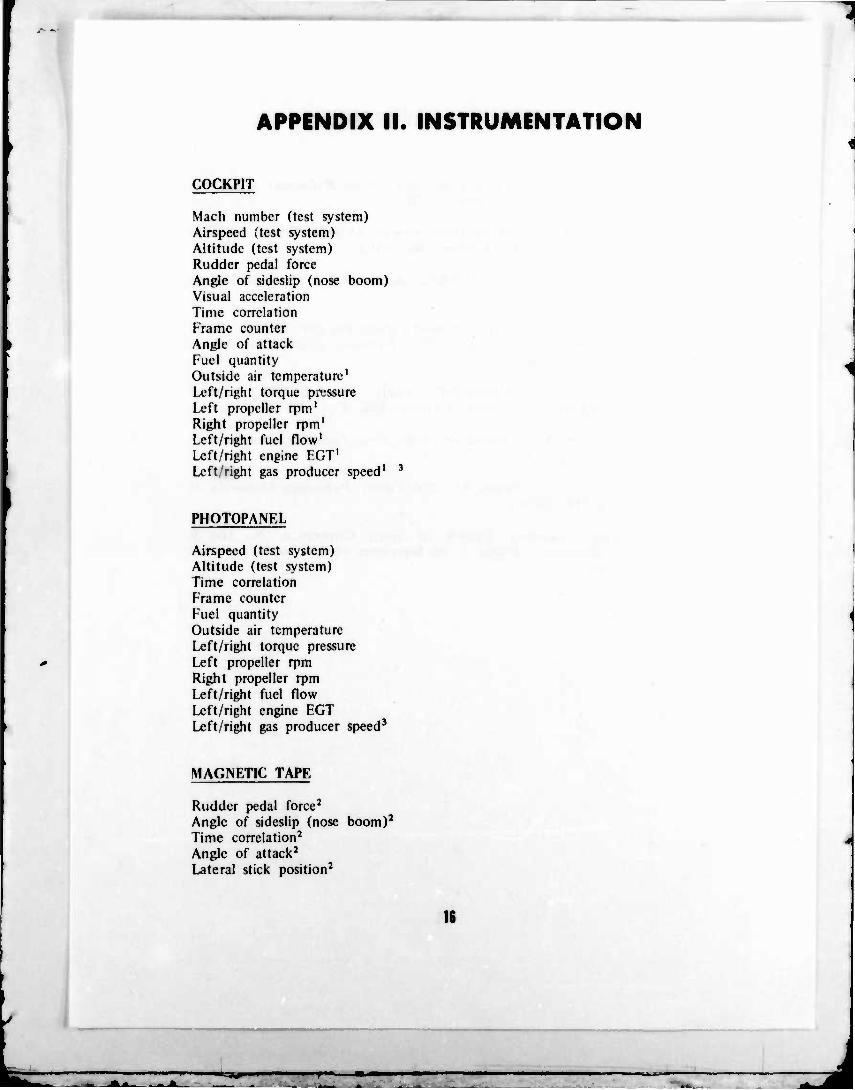
APPENDIX II. INSTRUMENTATION
COCKPIT
Mach number (test system) Airspeed (test system) Altitude (test system) Rudder pedal force Angle of sideslip (nose boom) Visual acceleration Time correlation Frame counter Angle of attack Fuel quantity Outside air temperature1
Left/right torque pressure Left propeller rpm1
Right propeller rpm1
Left/right fuel flow1
Left/right engine EGT1
Left/right gas producer speed' 3
PHOTOPANEL
Airspeed (test system) Altitude (test system) Time correlation Frame counter Fuel quantity Outside air temperature Left/right torque pressure Left propeller rpm Right propeller rpm Left/right fuel flow Left/right engine EGT Left/right gas producer speed3
MAGNETIC TAPE
Rudder pedal force2
Angle of sideslip (nose boom)2
Time correlation2
Angle of attack2
Lateral stick position2
'*=**•
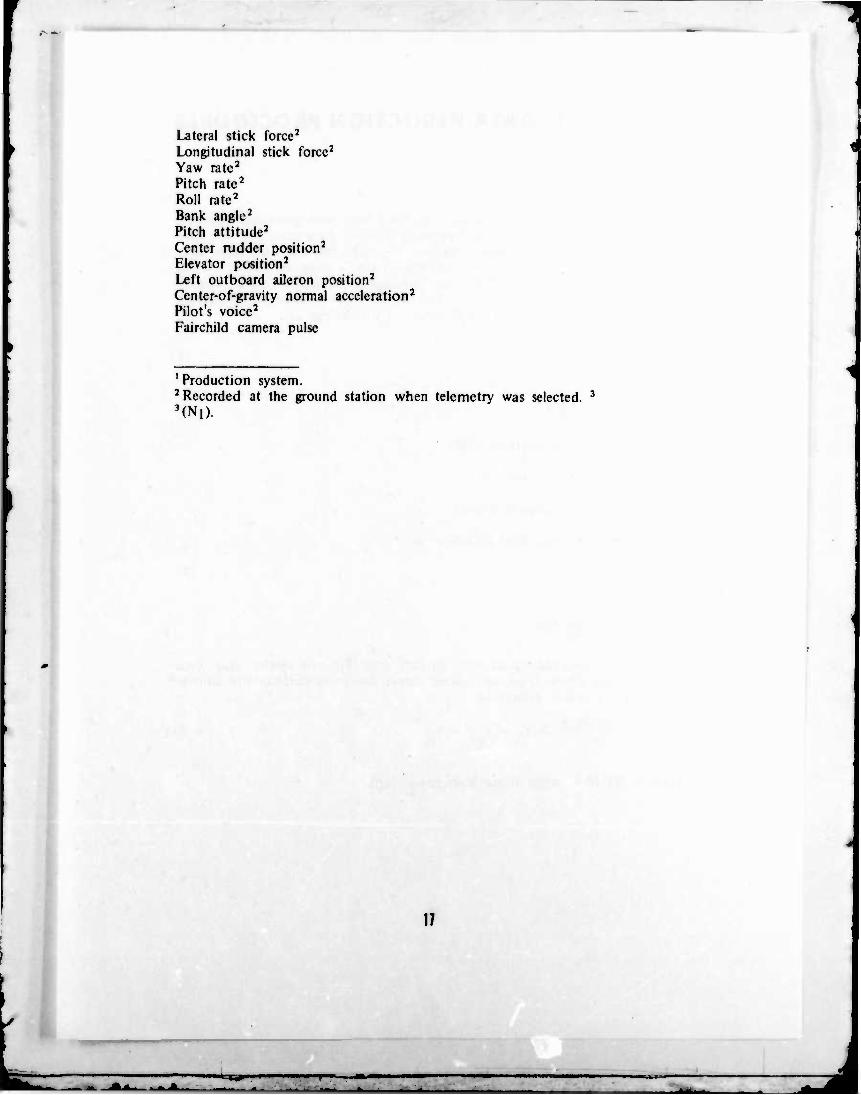
Lateral stick force2
Longitudinal stick force2
Yaw rate2
Pitch rate2
Roll rate2
Bank angle2
Pitch attitude2
Center rudder position2
Elevator position2
Left outboard aileron position2
Center-of-gravity normal acceleration2
Pilot's voice2
Fairchild camera pulse
1 Production system. 2 Recorded at the ground station when telemetry was selected. 3
'(Ni).
17
- -*"-
•-
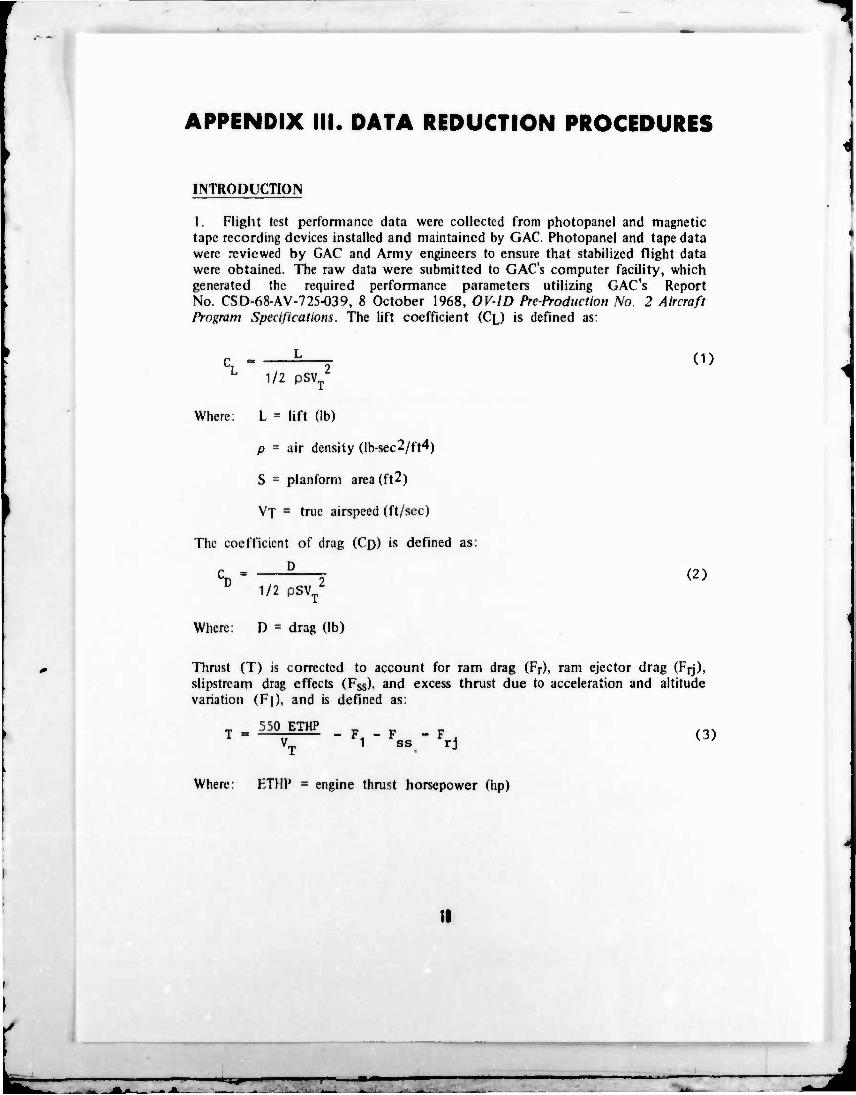
APPENDIX III. DATA REDUCTION PROCEDURES
INTRODUCTION
I. Flight test performance data were collected from photopanel and magnetic tape recording devices installed and maintained by GAC. Photopanel and tape data were reviewed by GAC and Army engineers to ensure that stabilized flight data were obtained. The raw data were submitted to GAC's computer facility, which generated the required performance parameters utilizing GAC's Report No. CSD-68-AV-725-039, 8 October 1968, OVID Pre-Production No. 2 Aircraft Program Specifications. The lift coefficient (CL) is defined as:
C 1/2 pSVT
2 (1)
Where: L ■ lift (lb)
p = air density (Ib-sec2/ft4)
S = planform area(ft2)
Vj = true airspeed (ft/sec)
The coefficient of drag (CD) is defined as:
D 1/2 PSV/
Where: D = drag (lb)
Thrust (T) is corrected to account for ram drag (Fr), ram ejector drag (Frj), slipstream drag effects (Fss). and excess thrust due to acceleration and altitude variation (F]), and is defined as:
I = ^Ilff " F - F - * (3) VT 1 ss rj
Where: ETHP = engine thrust horsepower (hp)
———————
■•:»*
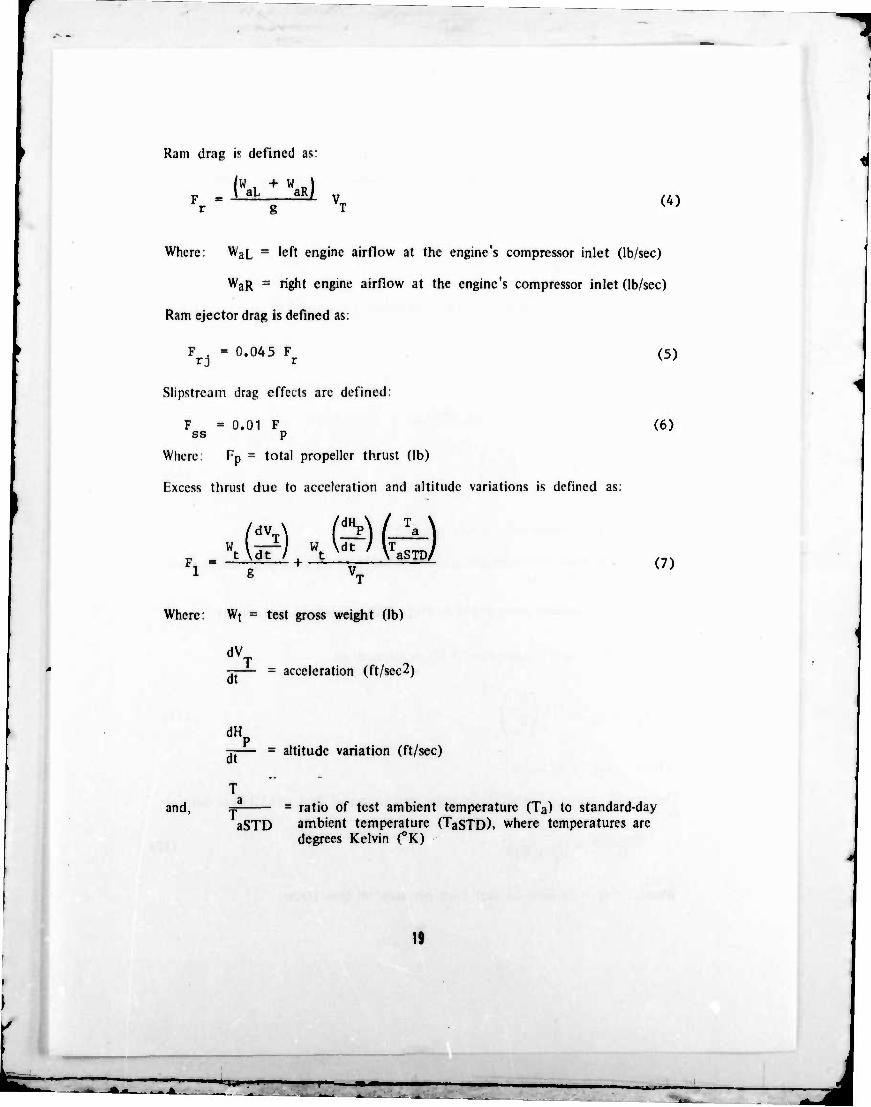
Ram drag ii defined as:
, (WaL + WaR) (4)
Where: WaL = left engine airflow at the engine's compressor inlet (lb/sec)
WaR = right engine airflow at the engine's compressor inlet (lb/sec)
Ram ejector drag is defined as:
F . = 0.045 F rj r
Slipstream drag effects are defined:
F = 0.01 F ss p
(5)
(6)
Where: Fp = total propeller thrust (lb)
Excess thrust due to acceleration and altitude variations is defined as:
- (?) - so fey t \dt / . t x \ aSTD/ i g vT
Where: Wt = test gross weight (lb)
dV_
(7)
T _ dt
= acceleration (ft/sec2) r
and,
dH.
dt
aSTD
= altitude variation (ft/sec)
= ratio of test ambient temperature (Ta) to standard-day ambient temperature (TaSTD)- where temperatures are degrees Kelvin (0K)
19
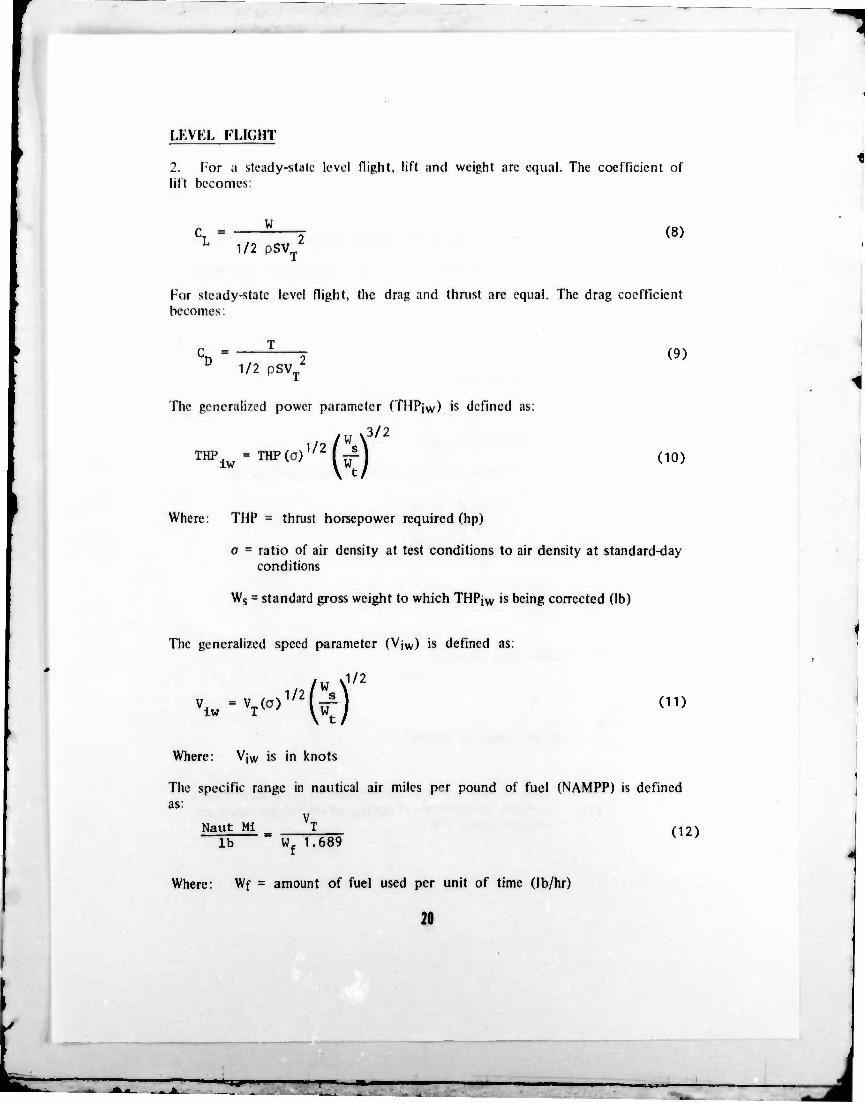
USVEL FLIGHT
2. F;or a steady-stutc level flight, lift and weight are equal. The coefficient of lilt becomes:
CL = W
1/2 pSV,, (8)
For steady-state level tlight, the drag and thrust are equal. The drag coefficient becomes:
CD =
1/2 pSV„ (9)
The generalized power parameter (THPiw) is defined as:
,3/2
THPJ = THP(O) Iw '"® (10)
Where: TUP = thrust horsepower required (hp)
o = ratio of air density at test conditions to air density at standard-day conditions
Ws = standard gross weight to which THPjw is being corrected (lb)
The generalized speed parameter (Viw) is defined as:
J/2
Viw = Vö) ■"ft (ID
Where: Vjw is in knots
The specific range in nautical air miles per pound of fuel (NAMPP) is defined as:
V Naut Mi _ _T ^2)
lb Wf 1.689
Where: Wf = amount of fuel used per unit of time (Ib/hr)
- ■ '
-=w
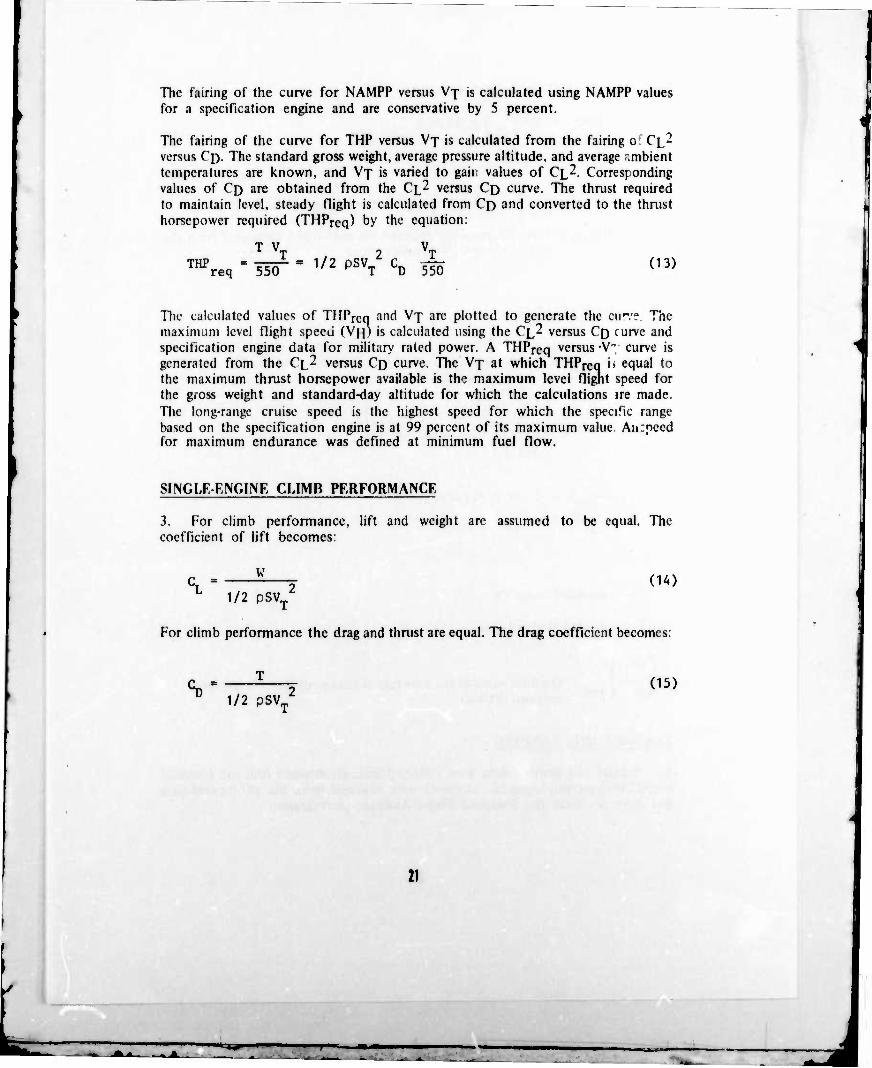
The fairing of the curve for NAMPP versus Vj is calculated using NAMPP values for a specification engine and are conservative by 5 percent.
The fairing of the curve for THP versus Vx is calculated from the fairing o; CL- versus Cf). The standard gross weight, average pressure altitude, and average r.mbient temperatures are known, and V7 is varied to gair; values of CL^. Corresponding values of C[) are obtained from the CL2 versus CD curve. The thrust required to maintain level, steady flight is calculated from Cf) and converted to the thrust horsepower required (THPrcq) by the equation:
THPreq = 55Ö1 = 1/2 ^ CD A (13)
The calculated values of TMPrcq and Vj are plotted to generate maximum level flight speed (Vin is calculated using the Cl* versu
the cur'? The ight speed (VH'I is calculated using the Cj^ versus Cß turvc and
specification engine data for military rated power. A THPreq versus •V", curve is generated from the CL^ versus C[) curve. The Vj at which THPreq '' equal to the maximum thrust horsepower available is the maximum level flignt speed for the gross weight and standard-day altitude for which the calculations ire made. The long-range cruise speed is the highest speed for which the specific range based on the specification engine is at 99 percent of its maximum value Aurpeed for maximum endurance was defined at minimum fuel flow.
SINGLK KINC.1NK CLIMB PERFORMANCE
3. For climb performance, lift and weight are assumed to be equal. The coefficient of lift becomes;
CL = W
1/2 pSV, (1A)
For climb performance the drag and thrust are equal. The drag coefficient becomes.
h 1/2 pSV, (15)
21
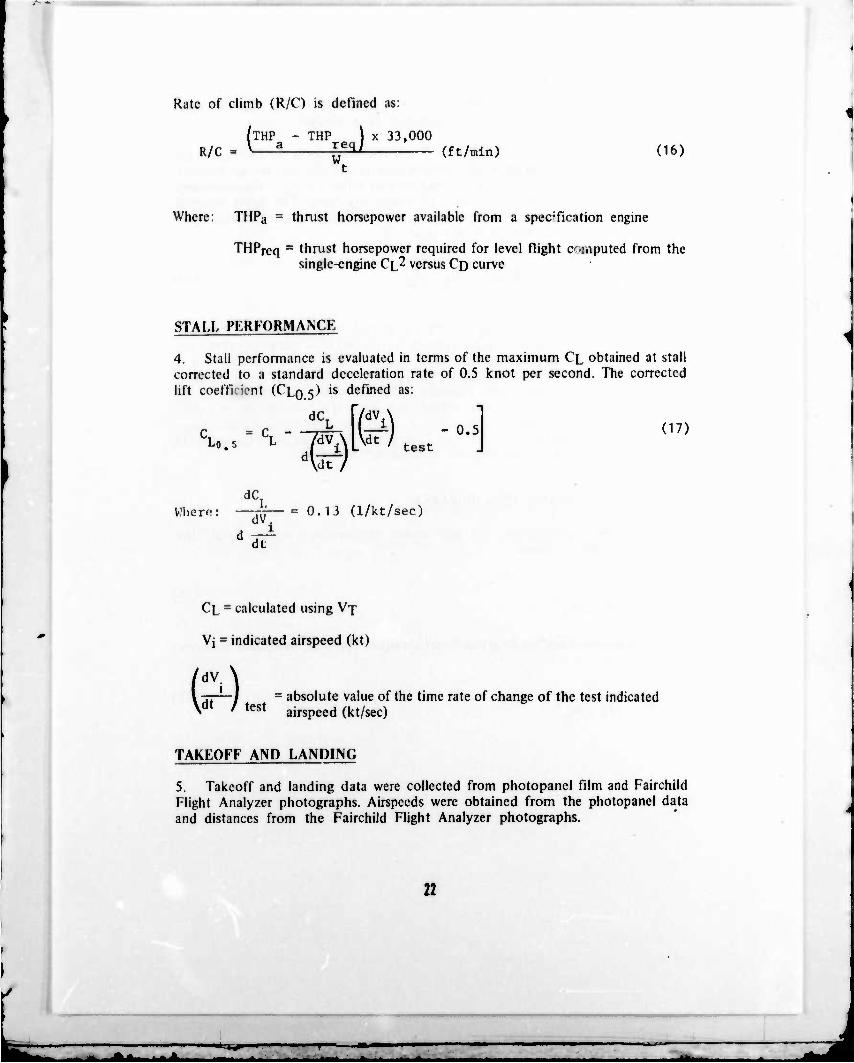
Rate of climb (R/C) is defined as:
R/C .( THP - THP
a re(J X 33,000
W. (ft/min) (16)
Where: THPa ■ thmst horsepower available from a specTication engine
THPreq = thrust horsepower required for level flight computed from the single-engine CL^ versus CD curve
STALL PERFORMANCE
4. Stall performance is evaluated in terms of the maximum C'L obtained at stall corrected to a standard deceleration rate of 0.5 knot per second. The corrected lift coeffirient (CLQS) is defined as:
dC. c. = c -
Lo. 5 L © -M.... ■ H (17)
dC, V.'lierf!:
dt
0.13 (1/kt/sec)
CL = calculated using V7
Vj = indicated airspeed (kt)
&•) = absolute value of the time rate of change of the test indicated
test airspeed (kt/sec)
TAKEOFF AND LANDING
5. Takeoff and landing data were collected from photopanel film and Fairchild Flight Analyzer photographs. Airspeeds were obtained from the photopanel data and distances from the Fairchild Flight Analyzer photographs.
22
1 »^ i <**. .*•*
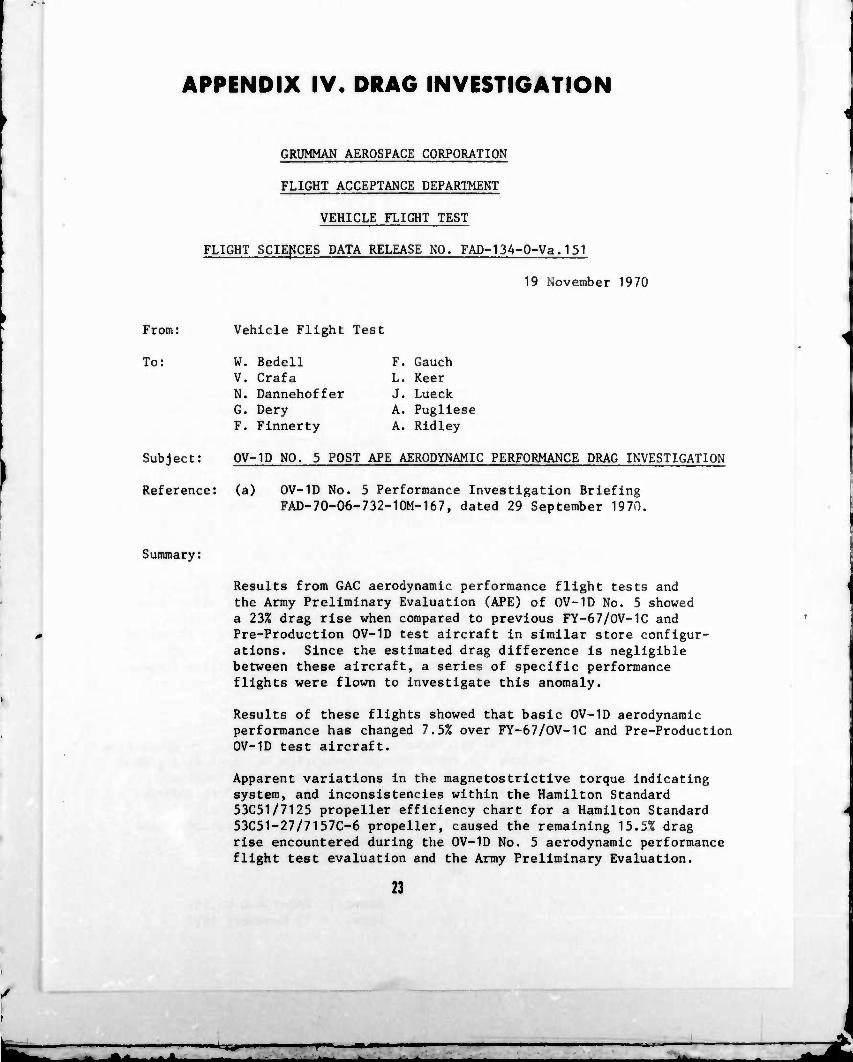
APPENDIX IV. DRAG INVESTIGATION
GRUMMAN AEROSPACE CORPORATION
FLIGHT ACCEPTANCE DEPARTMENT
VEHICLE FLIGHT TEST
FLIGHT SCIENCES DATA RELEASE NO. FAD-134-O-Va. 151
19 November 1970
From: Vehicle Flight Test
To: W. Bedell F. Gauch V. Crafa L. Keer N. Dannehoffer J. Lueck G. Dery A. Pugliese F. Finnerty A. Ridley
Subject: 0V-1D NO. 5 POST APE AERODYNAMIC PERFORMANCE DRAG INVESTIGATION
Reference: (a) OV-1D No. 5 Performance Investigation Briefing FAD-70-06-732-10M-167, dated 29 September 1970.
Summary:
Results from GAC aerodynamic performance flight tests and the Army Preliminary Evaluation (APE) of OV-1D No. 5 showed a 23% drag rise when compared to previous FY-67/0V-1C and Pre-Production OV-ID test aircraft in similar store configur- ations. Since the estimated drag difference is negligible between these aircraft, a series of specific performance flights were flown to investigate this anomaly.
Results of these flights showed that basic OV-ID aerodynamic performance has changed 7.5% over FY-67/0V-1C and Pre-Production OV-ID test aircraft.
Apparent variations in the magnetostrictive torque indicating system, and inconsistencies within the Hamilton Standard 53C51/7125 propeller efficiency chart for a Hamilton Standard 53C51-27/7157C-6 propeller, caused the remaining 15.5% drag rise encountered during the OV-ID No. 5 aerodynamic performance flight test evaluation and the Army Preliminary Evaluation.
23
A .*▲.
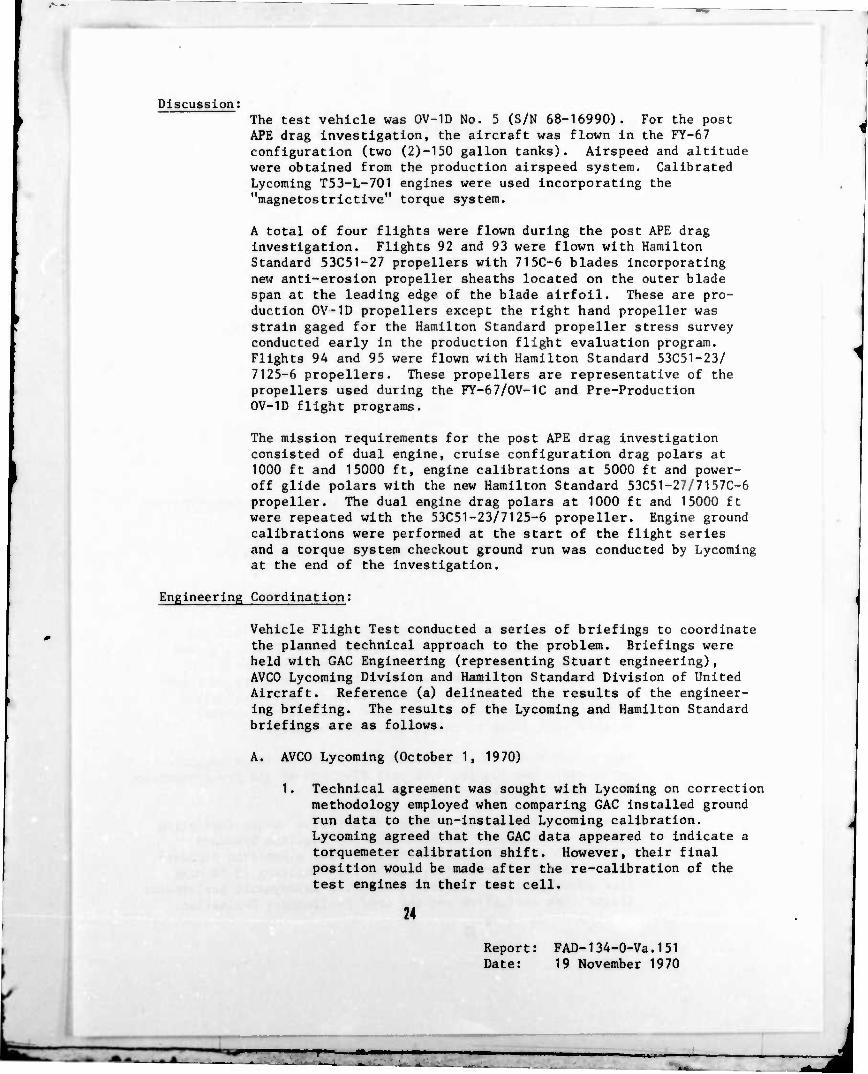
Discussion; The test vehicle was 0V-1D No. 5 (S/N 68-16990), For the post APE drag investigation, the aircraft was flown in the FY-67 configuration (two (2)-150 gallon tanks). Airspeed and altitude were obtained from the production airspeed system. Calibrated Lycoming T53-L-701 engines were used incorporating the "magnetostrictive" torque system.
A total of four flights were flown during the post APE drag investigation. Flights 92 and 93 were flown with Hamilton Standard 53C51-27 propellers with 715C-6 blades incorporating new anti-erosion propeller sheaths located on the outer blade span at the leading edge of the blade airfoil. These are pro- duction 0V-1D propellers except the right hand propeller was strain gaged for the Hamilton Standard propeller stress survey conducted early in the production flight evaluation program. Flights 94 and 95 were flown with Hamilton Standard 53C51-23/ 7125-6 propellers. These propellers are representative of the propellers used during the FY-67/OV-1C and Pre-Production 0V-1D flight programs.
The mission requirements for the post APE drag investigation consisted of dual engine, cruise configuration drag polars at 1000 ft and 15000 ft, engine calibrations at 5000 ft and power- off glide polars with the new Hamilton Standard 53C51-27/7157C-6 propeller. The dual engine drag polars at 1000 ft and 15000 ft were repeated with the 53C51-23/7125-6 propeller. Engine ground calibrations were performed at the start of the flight series and a torque system checkout ground run was conducted by Lycoming at the end of the investigation.
Engineering Coordination:
Vehicle Flight Test conducted a series of briefings to coordinate the planned technical approach to the problem. Briefings were held with GAG Engineering (representing Stuart engineering), AVC0 Lycoming Division and Hamilton Standard Division of United Aircraft. Reference (a) delineated the results of the engineer- ing briefing. The results of the Lycoming and Hamilton Standard briefings are as follows.
A. AVCO Lycoming (October 1, 1970)
1 Technical agreement was sought with Lycoming on correction methodology employed when comparing GAG installed ground run data to the un-installed Lycoming calibration. Lycoming agreed that the GAG data appeared to indicate a torquemeter calibration shift. However, their final position would be made after the re-calibration of the test engines in their test cell.
24
Report: FAD-134-0-Va. 1 51 Date: 19 November 1970
B. Hamilton Standard (October 2, 1970)
1. Hamilton Standard agreed that the area of the 53C51- 23/7125-6 propeller efficiency map which shows the largest drag polar variation is hard to define and extremely sensitive f .> horsepower coefficient change.
2. Hamilton Standard also indicated that: o The propeller anti-erosion sheath should
give no more than a 0.5% to 1 .0 % efficiency degradation.
o Manufacturing tolerances could result in another ±0.5% to ±1.0>o pfficiency variation.
o They had experienced as much as a 3% to 10% efficiency degradation with a similar strain gaged propeller (not a 53C51-27) during tunnel tests.
Test Results:
The enclosed data are broken into three categories:
I. Engine Summary II. Propeller Summary III. Drag and Range Summary
CATEGORY 1: ENGINE SUMMARY
Figures 1 and 2 present referred shaft horsepower vs. referred gas producer speed relationships for engines S/N's 30001 and 30003 respectively. These data show Lycoming's initial water- brake uninstalled S.L./Static calibrations at an optimum power turbine speeH. The data show an unexplained 10% shaft horsepower variation between Lycoming's calibration and GAC's calibration at low power levels.
Because of the apparent shift in engine calibration, Lycoming was asked to perform a torque system checkout. This is accomp- lished with a unique Lycoming "breakout box" specifically designed to test their magnetostrlctive system. The equipment consists of a digital voltmeter incorporating a Lycoming-designed indicator filter network and a power supply unit. Results of this checkout showed no measurable errors within the electrical torque indicat- ing system. However, this checkout does not rule out the possi- bility of a torquemeter calibration shift within the engines. The torque system checkout can only check the components of the torque indicating system, i.e., power supply and indiator. The equipment cannot checkout the waterbrake torque vs. milliamp signal relationship which represents the torquemeter calibration.
Report: FAD-134-0-Va.151 Date: 19 November 1970
Afe **L. ^**
CATERORY 1: (continued)
On the basis of the torquemeter calibration being the only undefined area of the torque system checkout, the test data showing a shift in the shaft horsepower vs. gas producer speed relationship, and Lycoming's technical agreement that the data appeared to indicate a torquemeter calibration shift, VFT pro- ceeded to generate an adjusted torquemeter calibration for both test engines.
Figures 1 and 2 show the high horsepower values indicated in the installed engine calibrations as compared with the Lycoming dynamometer calibrations. The errors were applied to the original Lycoming calibrations to correct torquemeter indicated values.
Figures 3 and 4 present the adjusted torquemeter calibrations. These curves were input into the GAC computer program and appli- cable GAC and Army APE performance data were rerun. Figures 5 through 10 present the corrected (and expected) gas generator performance characteristics for the T53-L-701 test engines.
Figures 5 and 6 present referred shaft horsepower vs. referred gas producer speed relationships for each test engine. Compari- sons of Lycoming uninstailed optimum power turbine speed calibra- tion and the GAC installed ground run data are shown. The GAC data are shown at Max increase prop. RPM with power extraction at 4900 ft. altitude and 0.29 3 Mach No. The Lycoming Sea Level calibration is shown for reference, as well as a correction of the calibration to flight conditions using a "Model Spec" adjustment. The Mach effect increment is in good agreement with the "Model Spec" at high gas producer speeds. At low gas producer speeds, "Model Spec" agreement no longer occurs since flight power turbine speeds were off optimum.
Figures 7 and 8 present referred fuel flow vs. referred gas producer speed relationships for both test engines. Also shown in the data is a Lycoming "Model Spec" adjustment to the test cell calibration data. Examination of both the "Model Spec" corrected data and the test data suggest the Mach effect is insignificant.
Figures 9 and 10 present the test engines shaft horsepower vs. observed fuel flow characteristics. Because of left engine flow meter problems having occurred during the test program, right engine fuel flow was used for the calculation of aircraft specific range in the drag and range section of this report (Figures 18 and 19).
26 Report: FAD-134-O-Va. 151 Date: 19 November 1970
■*»#" J
CATERORY II: PROPELLER SUMMARY
All data In this section have been corrected for the torquemeter variations.
All propeller efficiencies have been calculated through the HSD 53C51/7125-6 propeller efficiency map (HSD curve No. 27769 dated March 10, 2960).
Figures 11 through 14 present dual engine drag polars at 1000 ft and 15000 ft, respectively, for two different sets of propellers. These flight conditions were selected to produce diverse power coefficient/advance ratio combinations. This technique allows relative comparisons of accuracy In the propeller efficiency map.
Figures 11 and 12 are presented for the purpose of verifying the existence of relative Inaccuracies In the propeller efficiency map. Figure 11 presents data flown with the Hamilton Standard 53C51-27 propeller at two test altitudes. The data show a significant "altitude" variation. Inconsistencies within the propeller efficiency map for the HSD 53C51-27/7157C-6 propellers result In 7% to 14% differences In apparent drag with the same propeller.
Figure 12 presents the HSD 53C51-23/7125 propeller at the two test altitudes. A slight efficiency variation exists with this propeller.
Figure 13 shows two distinct drag polars at approximately the same flight conditions. The high drag polar was flown with (HSD 53C51-27/7157C-6 (with blade sheaths and strain gages). The low drag line was flown with the HSD 53C51-23/7125 propellers. The differences between the drag polars are attributed to pro- peller efficiency variation between the -27 and -23 propellers. The HSD 53C51-27/7157C-6 propellers are 6% less efficient when operating in the same area of the 53C51/7125-6 propeller efficiency map (approximately 1000 ft) as compared to the HSD 53C51-23/7125-6 propellers. This is consistent with what Hamilton Standard quotes as a possible maximum percent variation.
Figure 14 presents the same relationship as shown in Figure 13. However, these polars were flown at 15000 ft which also means a distinctly different area of the propeller efficiency map. The data show good agreement between the two sets of propellers.
Apparently the drag data at 15000 ft for both sets of propellers correspond to a region of the propeller efficiency map which is more accurately defined than the region corresponding to the 1000 ft drag polar data.
jl Report: " Date:
FAD-134-0-Va. 151 19 November 1970
«MM
~n
CATEGORY II: (Continued)
It can be concluded at this time that the HSD 53C51/7125 propeller efficiency map is not representative of the 0V-1D/HSD 53C51/7157C-6 production propellers at all flight conditions.
Figure 15 presents a relationship of drag coefficient vs. true pressure altitude as a function of lift coefficient squared, for the HSD 53C51-27 and the HSD 53C51-23 propellers.
Figure 16 presents the apparent change in drag coefficient (ACp) between the HSD 53C51-23 propellers and the HSD 53C51-27 propeller vs. true pressure altitude as a function of lift coefficient squared. This propeller correction is used to correct HSD 53C51-27 drag data to the HSD 53C51-23 propeller drag levels.
Figure 17 presents a power-off glide polar for reference purposes. This polar was generated by flying at flight idle power with the propellers feathered. Propeller windmilling drag and flight jet thrust have been accounted for. The data show good agreement with the FY-67 power-on polar at low lift coefficients. At C^ values above 0.8, power effects become apparent. These data present the power-off polar based on aerodynamic pressure drag only (no power effects) . The good agreement with FY-67 data suggests little aero- dynamic difference between 0V-1D and 0V-1C test aircraft.
CATEGORY III: DRAG AND RANGE SUMMARY
Figure 18 compares the 0V-1D No. 5 and FY-67/0V-1C dual engine drag polars computed at 5000 ft altitude. Army APE flight 72 is used as an example. Drag polar "A" presents the as-flown 0V-1D drag polar with no corrections incorporated (25% difference). Drag polar "B" incorporates the adjusted torquemeter calibrations (13%). Drag polar "C" incorporates the HSD-53C51-27 propeller correction (see Figure 16) (2.5%). Drag polar "D" accounts for the AN/ALQ-67 and AN/ALQ-80 store drag and presents itself in the FY-67 two (2) -150 gallon drop tank configuration (2%). The difference between drag polar "D" and drag polar "E" represents the measureable differences between the 0V-1C S/N 67-18897 aircraft (7.5% difference). All comparisons are made at a lift coefficient squared of 1.0.
.
1
2g Report: FAD-134-0-Va. 151 Date: 19 November 1970
AA. »ml i
CATEGORY III: (Continued)
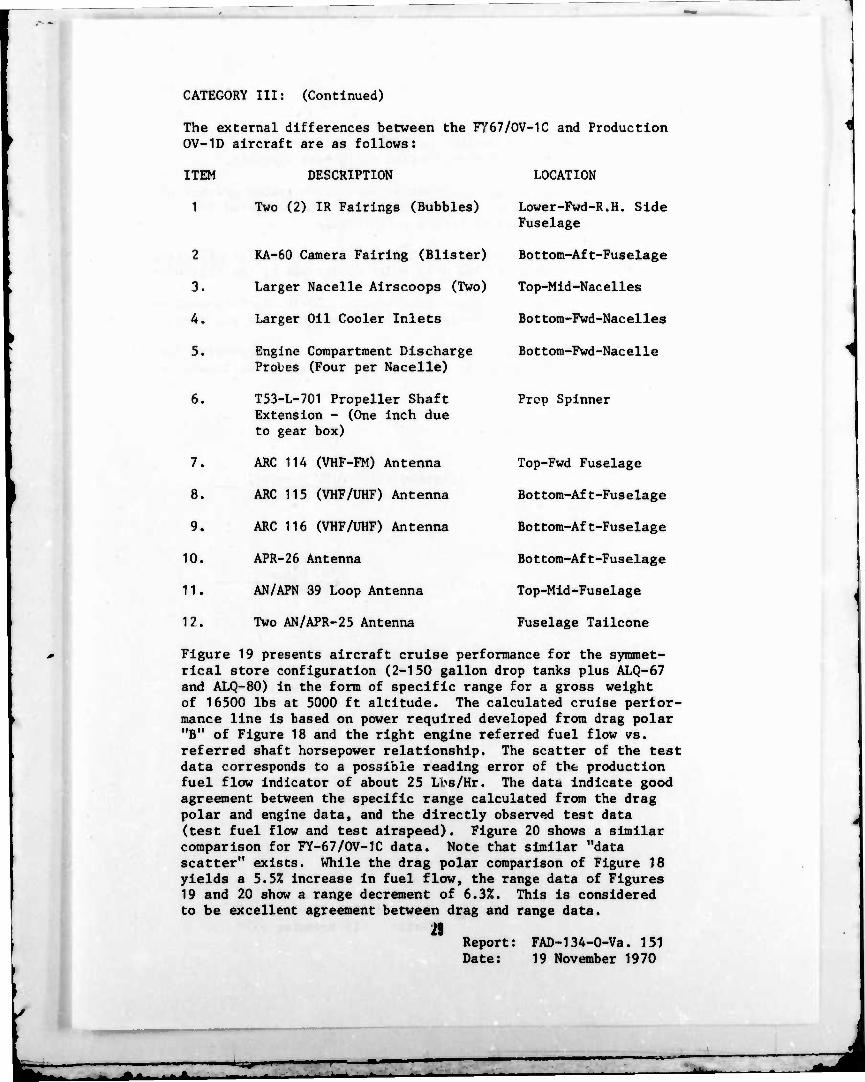
The external differences between the Fy67/OV-1C and Production 0V-1D aircraft are as follows:
ITEM DESCRIPTION
1 Two (2) IR Fairings (Bubbles)
2 RA-60 Camera Fairing (Blister)
3. Larger Nacelle Alrscoops (Two)
4. Larger Oil Cooler Inlets
5. Engine Compartment Discharge Probes (Four per Nacelle)
6. T53-L-701 Propeller Shaft Extension - (One Inch due to gear box)
7. ARC 114 (VHF-FM) Antenna
8. ARC 115 (VHF/UHF) Antenna
9. ARC 116 (VHF/UHF) Antenna
10. APR-26 Antenna
11 . AN/APN 39 Loop Antenna
12. Two AN/APR-25 Antenna
LOCATION
Lower-Fwd-R.H. Side Fuselage
Bottom-Aft-Fuselage
Top-Mld-Nacelles
Bottom-Fwd-Nacelles
Bottom-Fwd-Nacelle
Prop Spinner
Top-Fwd Fuselage
Bottom-Aft-Fuselage
Bottom-Aft-Fuselage
Bottom-Aft-Fuselage
Top-Mld-Fuselage
Fuselage Tallcone
Figure 19 presents aircraft cruise performance for the symmet- rical store configuration (2-150 gallon drop tanks plus ALQ-67 and ALQ-80) In the form of specific range for a gross weight of 16500 lbs at 5000 ft altitude. The calculated cruise perfor- mance line Is based on power required developed from drag polar "B" of Figure 18 and the right engine referred fuel flow vs. referred shaft horsepower relationship. The scatter of the test data corresponds to a possible reading error of the production fuel flow Indicator of about 25 Lbs/Hr. The data Indicate good agreement between the specific range calculated from the drag polar and engine data, and the directly observed test data (test fuel flow and test airspeed). Figure 20 shows a similar comparison for FY-67/OV-1C data. Note that similar "data scatter" exists. While the drag polar comparison of Figure 18 yields a 5.5% Increase In fuel flow, the range data of Figures 19 and 20 show a range decrement of 6.3%. This Is considered to be excellent agreement between drag and range data.
29 Report: FAD-134-0-Va. 151 Date: 19 November 1970
.AAi ■fej*1
.*-.
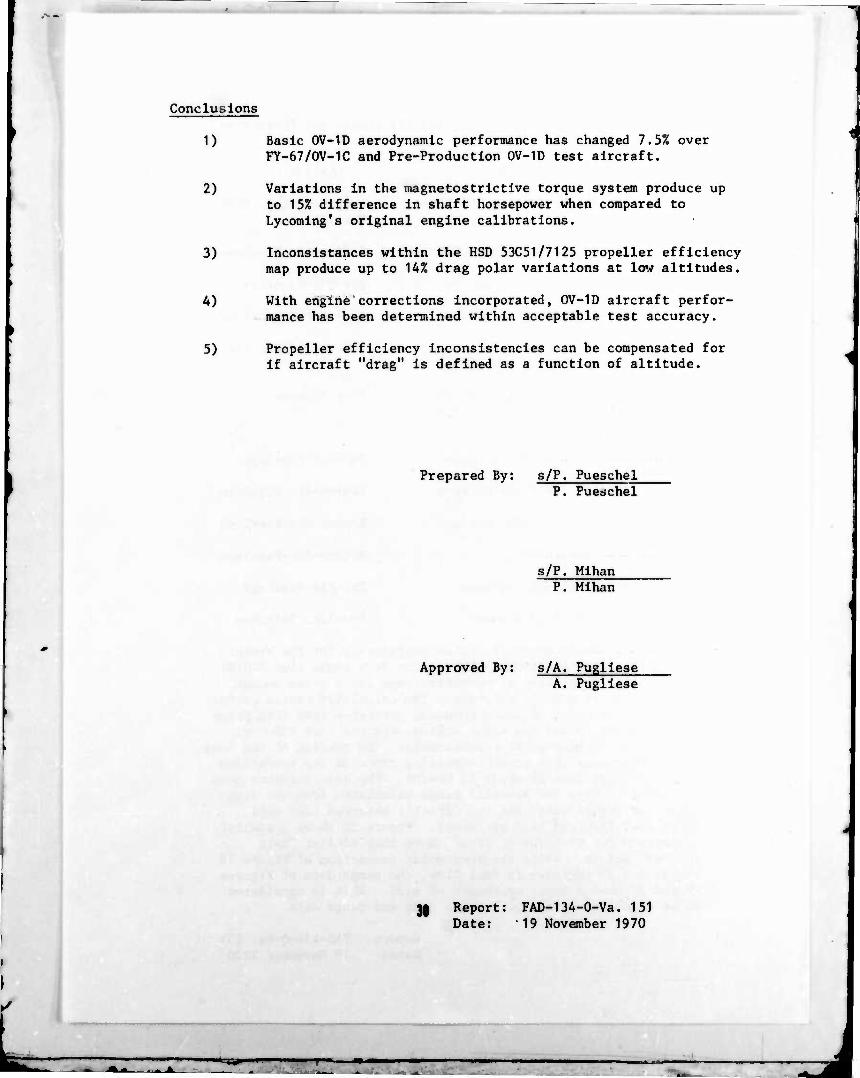
Conclusions
1) Basic 0V-1D aerodynamic performance has changed 7.5% over FY-67/OV-1C and Pre-Productlon 0V-1D test aircraft.
2) Variations In the magnetostrlctlve torque system produce up to 15% difference In shaft horsepower when compared to Lycomlng's original engine calibrations.
3) Inconslstances within the HSD 53C51/7125 propeller efficiency map produce up to 14% drag polar variations at low altitudes.
4) With engine"corrections Incorporated, 0V-1D aircraft perfor- mance has been determined within acceptable test accuracy.
5) Propeller efficiency Inconsistencies can be compensated for If aircraft "drag" Is defined as a function of altitude.
Prepared By: s/P. Pueschel P. Pueschel
s/P. Mlhan P. Mlhan
Approved By: s/A. Pugllese A. Pugllese
3| Report: FAD-134-O-Va. 151 Date: 19 November 1970
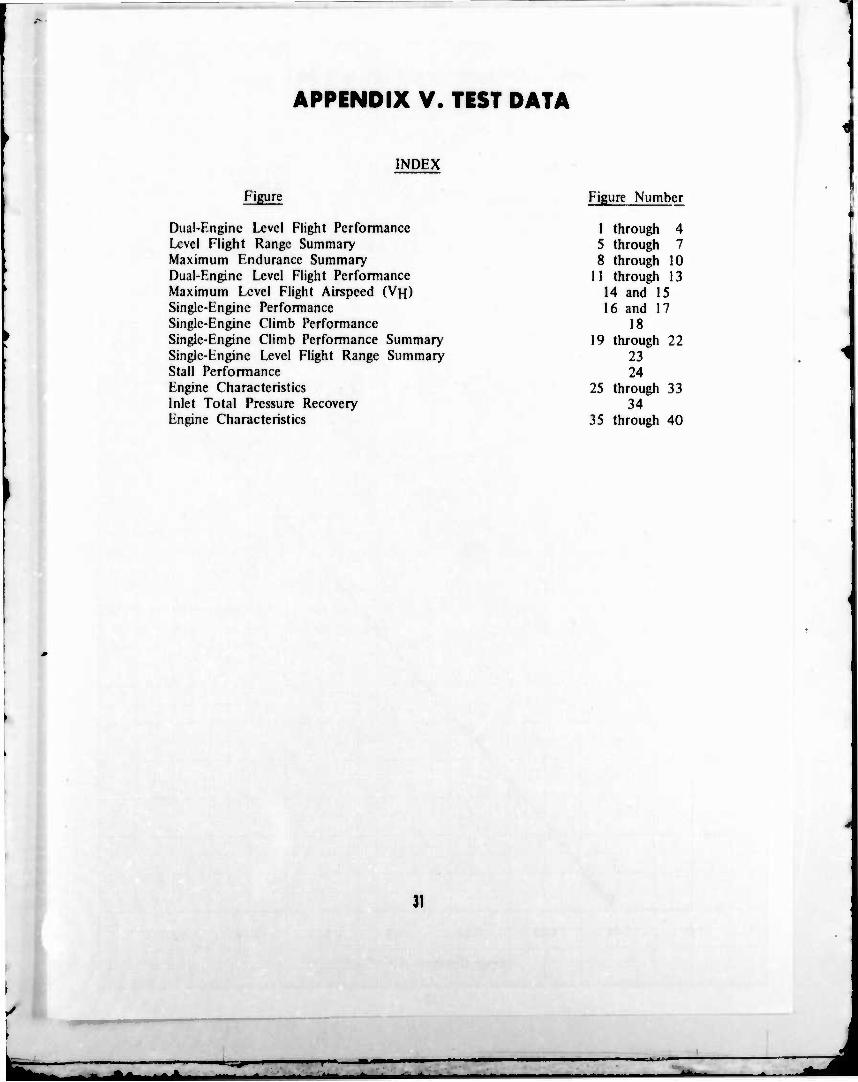
APPENDIX V. TEST DATA
INDEX
Figure
Dual-Engine Level Flight Performance Level Flight Range Summary Maximum Endurance Summary Dual-Engine Level Flight Performance Maximum Level Flight Airspeed (VH) Single-Engine Performance Single-Engine Climb Performance Single-Engine Climb Performance Summary Single-Engine Level Flight Range Summary Stall Performance Engine Characteristics Inlet Total Pressure Recovery Engine Characteristics
Figure Number
1 through 4 5 through 7 8 through 10
11 through 13 14 and 15 16 and 17
18 19 through 22
23 • 24
25 through 33 34
35 through 40
31
1 ' .^ " ' ■ ' " ■■ n " ' J
■ A"- -A
a- -A
^fc. •^JW

J
"*- --A —te^^ *■ A-- J
- A ■*=t*
1——
* Am *' u*
^
!■ ■ I
- - ■»
^
""""■
=ar
■' -A
^- - *
^ ■ fc. n . ■ A j
-^-*- ">*=5^
•MM_^ta ^M
■4M ^
: firp -j—ry—,- ■ -p—J^-J—pr"
^i ..S|ng|e.Brtgine: \ Lm-JFmil >m& n^^^T
{te^MACUwi^.
Swmitianr.
. ■ ■
■:::i- •■ "
1. Cumtet derived from figures 16 and ^ throupih 30.
TiOi^r specification (n(($,' 31
g-ra|i«e cruise spatdR afnd ijjeülflcininfej tre b^sed oil the
conditions::
0.99 inajlmiim imutjcul miles pet fH)iind d" fuel or
Emit, whichever U less.
i ■
■■■■
.*▲. ^J
L ^ -^äA. —=5^
'»mm
-M.
- *"- -A ^A*
m*, -A
mim^mm~*mmm—~mmmmim'l*l*m
.^^M^
I[ii;illl-ll!ll!}!
'" --A I— ^kl J
.^4^ I - - ' .
*=«»
ia —A
- -A
TWTTTFITITtTHII^
■- - - - -* "■- =J
UNCLASSIFIED St«! urily ( 'l.issifi« al Ion
DOCUMENT CONTROL DATA R&D I Sn nrity i I it** siltrntinn nl Uftv. luttlv nf nhsfrnt t »mi ituJvMinii H/incif/ifinn nmst l)v vntfrvd when tfW avvrull rvport ffl c hissified)
^m. REPORT SECURITY CLASSIEICATION
UNCLASSIFIED
1 OMK.INATtNG AC T I VI T Y f Corfiomrr «nfhorj
US ARMY AVIATION SYSTEMS TEST ACTIVITY FDWARDS AIR FORCE BASE, CALIFORNIA 93523
2b. GROUP
* REPOfc T TITLE
ARMY PRELIMINARY EVALUATION II PRODUCTION OV-ID (MO HAWK) PERFORMANCE ADDENDUM
4 OESCRIPTIVE OTES (Typr ol rrporl and inclusive dales)
FINAL RtPORT 12 February 1970 through 21 June 1971 5 AU Tue Rt5 I f Firs ■ name, n-.iddle initial, la Mt name)
GEORGE M. YAMAKAWA WILLIAM A. GRAHAM. JR.. ETC. TC, US ARMY i M Project Officer/Pilot
KARL H. BR/UER II. 1 LT, CE, US ARMY JOHN C. HENDERSON, MAJ, TC, US ARMY Assistant Entdruer Project Pilot
6 REPORT DATE
APRIL 1972 SM. CON TRACT OR GRAKT NO
h. PROJ EC T NO.
AVSCOM PROJE T NO. 70-03
7«. TOTAL NO OF PAGES
75
'b. NO OF REFS
8 »a. ORIGINATOR'S REPORT NUMBERISI
USAASTA PROJECT NO. 70-03
9b. OTHER REPORT NO(S) (Ary other numbers that may be assigned thia raport)
NA IP DISTRIBUTION STATEMEN
Distribution limited o US Government agencies only; test and evaluation. April 1972. Other requests for this doci ment must be referred to the Commanding G neral. AVSCOM. ATTN: AMSAV-EF. ^O Box 209, St. Louis, Missouri, 63166
II SUPPLEMENTARY NOTES t2 SPONSORING Ml LI T AR Y ACTIVITY
US ARMY AVIATION SYSTEMS COMMAND ATTN: AMSAV-EF PO Box 209, St. Louis, Missouri 63166
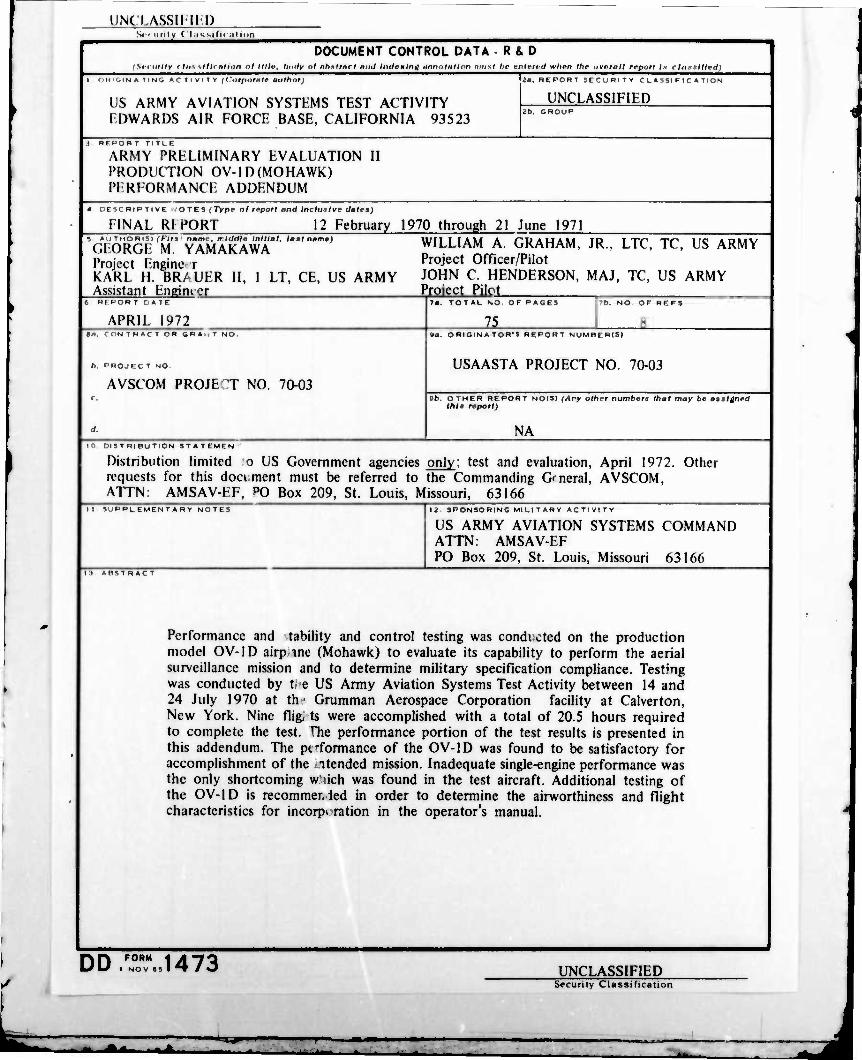
It ABSTRACT
Performance and tability and control testing was conducted on the production model OV-1D airpme (Mohawk) to evaluate its capability to perform the aerial surveillance mission and to determine military specification compliance. Testing was conducted by t e US Army Aviation Systems Test Activity between 14 and 24 July 1970 at th' Grumman Aerospace Corporation facility at Calverton, New York. Nine füg, ts were accomplished with a total of 20.5 hours required to complete the test. Hie performance portion of the test results is presented in this addendum. The pfformance of the OV-1D was found to be satisfactory for accomplishment of the itended mission. Inadequate single-engine performance was the only shortcoming w'dch was found in the test aircraft. Additional testing of the OV-1D is recommenled in order to determine the airworthiness and flight characteristics for incorporation in the operator's manual.
DD FORM I NO V ftS 1473 UNCLASSIFIED
Security Classification
" - * •-' *-
IINCl ASSH II I) Srt urifv C'lassificiition
K E V WO R DS
IVrlbrniünce and stability and control Production Model OV-II) Addendum Satisfactory for Intended mission Inadequate single-engine performance Additional testing recommended
ROLE V» T
L- I N K B
UNCLASSIFIED Security Classification
|—(■ u ■■ Ul«lli ■ "■' i
-1"
- . *J