Embed Size (px)
Citation preview

Atmos. Chem. Phys., 13, 10733–10753, 2013www.atmos-chem-phys.net/13/10733/2013/doi:10.5194/acp-13-10733-2013© Author(s) 2013. CC Attribution 3.0 License.
Atmospheric Chemistry
and PhysicsO
pen Access
Uncertainty in modeling dust mass balance and radiative forcingfrom size parameterization
C. Zhao1, S. Chen2,1, L. R. Leung1, Y. Qian1, J. F. Kok3, R. A. Zaveri1, and J. Huang2
1Atmospheric Sciences and Global Change Division, Pacific Northwest National Laboratory, Richland, WA, USA2Key Laboratory for Semi-Arid Climate Change of the Ministry of Education, Lanzhou University, Gansu, China3University of California, Los Angeles, CA, USA
Correspondence to:C. Zhao ([email protected])
Received: 11 July 2013 – Published in Atmos. Chem. Phys. Discuss.: 25 July 2013Revised: 24 September 2013 – Accepted: 5 October 2013 – Published: 5 November 2013
Abstract. This study examines the uncertainties in simulat-ing mass balance and radiative forcing of mineral dust dueto biases in the dust size parameterization. Simulations areconducted quasi-globally (180◦ W–180◦ E and 60◦ S–70◦ N)using the WRF-Chem model with three different approachesto represent dust size distribution (8-bin, 4-bin, and 3-mode).The biases in the 3-mode or 4-bin approaches against a rela-tively more accurate 8-bin approach in simulating dust massbalance and radiative forcing are identified. Compared tothe 8-bin approach, the 4-bin approach simulates similar butcoarser size distributions of dust particles in the atmosphere,while the 3-mode approach retains more fine dust particlesbut fewer coarse dust particles due to its prescribedσg ofeach mode. Although the 3-mode approach yields up to 10days of longer dust mass lifetime over the remote oceanicregions than the 8-bin approach, the three size approachesproduce a similar dust mass lifetime (3.2 days to 3.5 days)on quasi-global average, reflecting that the global dust masslifetime is mainly determined by the dust mass lifetime nearthe dust source regions.
With the same global dust emission (∼4600 Tg yr−1), the8-bin approach produces a dust mass loading of 39 Tg, whilethe 4-bin and 3-mode approaches produce 3 % (40.2 Tg) and25 % (49.1 Tg) higher dust mass loading, respectively. Thedifference in dust mass loading between the 8-bin approachand the 4-bin or 3-mode approaches has large spatial varia-tions, with generally smaller relative difference (< 10 %) nearthe surface over the dust source regions. The three size ap-proaches also result in significantly different dry and wet de-position fluxes and number concentrations of dust. The dif-ference in dust aerosol optical depth (AOD) (a factor of 3)
among the three size approaches is much larger than their dif-ference (25 %) in dust mass loading. Compared to the 8-binapproach, the 4-bin approach yields stronger dust absorptiv-ity, while the 3-mode approach yields weaker dust absorp-tivity. Overall, on quasi-global average, the three size pa-rameterizations result in a significant difference of a factorof 2∼3 in dust surface cooling (−1.02∼ −2.87 W m−2) andatmospheric warming (0.39∼0.96 W m−2) and in a tremen-dous difference of a factor of∼10 in dust TOA (top of at-mosphere) cooling (−0.24∼ −2.20 W m−2). The impact ofdifferent size representations on dust radiative forcing effi-ciency is smaller. An uncertainty of a factor of 2 is quantifiedin dust emission estimation due to the different size param-eterizations. This study also highlights the uncertainties inmodeling dust mass and number loading, deposition fluxes,and radiative forcing resulting from different size parameter-izations, and motivates further investigation of the impact ofsize parameterizations on modeling dust impacts on air qual-ity, climate, and ecosystems.
1 Introduction
Desert dust has been suggested as the main contributor tothe global aerosol burden (Forster et al., 2007). Dust playsan important role in the regional and global climate sys-tem and has significant impact on air quality (e.g., Wood-ward et al., 2001; Thomson et al., 2006; Huang et al., 2007;Lau et al., 2009; Zhao et al., 2011, 2012). First, it affectsEarth’s radiative budget directly through scattering and ab-sorption of radiation (e.g., Sokolik et al., 2001; Balkanski
Published by Copernicus Publications on behalf of the European Geosciences Union.
10734 C. Zhao et al.: Uncertainty in modeling dust mass balance and radiative forcing
et al., 2007; Zhao et al., 2010; Chen et al., 2013) and in-directly by acting as cloud condensation nuclei (CCN) andice nuclei (IN) and thus impacting clouds and radiation (e.g.,DeMott et al., 2010; Creamean et al., 2013). Second, whendust deposits on snow or ice, it would reduce snow/ice re-flectance (surface darkening) and consequently change theclimate and hydrological cycle by accelerating snow melting(Painter et al., 2010; Qian et al., 2011). Deposition of dustto oceans provides nutrients such as iron to ecosystems andmay be important for the ocean uptake of atmospheric CO2by promoting phytoplankton growth (e.g., Mahowald et al.,2009). Deposition of dust may also influence the ecosystemof rainforests by providing phosphorous as a source of nu-trients (e.g., Chadwick et al., 1999). Third, dust is importantfor air quality through its impact on visibility and concentra-tion of particulate matter, and thus can have negative impactson human health (e.g., Kim et al., 2001; Chen et al., 2004;Thomson et al., 2006). Furthermore, dust can interact withair pollution through heterogeneous reactions with pollutantgases such as nitric acid and sulfur dioxide (Liao et al., 2003;Bian and Zender, 2003).
There have been increasing efforts to improve dust mod-eling in the last decades (e.g., Marticorena and Bergametti,1995; Ginoux et al., 2001; Shao, 2001; Zender et al., 2003;Darmenova et al., 2009; Shao et al., 2010; Zhao et al.,2010; Solomos et al., 2011). Although state-of-the-art mod-els are able to generally capture many observed features ofdust distribution, modeling the spatial distribution of dustand its radiative forcing remains uncertain and challeng-ing, as highlighted by Forster et al. (2007). Climate mod-els simulate a very wide range of values for global dustemission and deposition as well as dust loading and its at-mospheric lifetime. By comparing results of multiple mod-els, the Aerosol Comparisons between Observations andModels (AEROCOM) project (http://nansen.ipsl.jussieu.fr/AEROCOM/) showed that models simulate the climatol-ogy of dust aerosol optical depth (AOD) within a factorof two whereas the total deposition and surface concentra-tion are reproduced within a factor of 10 (Huneeus et al.,2011). Models simulate global dust emissions between 514and 4313 Tg yr−1 and dust loads ranging from 6.8 to 29.5 Tg(Textor et al., 2006; Huneeus et al., 2011). Recent studieshave started to understand this large variation associated withdust modeling that results from the uncertainties in manymodel processes, such as dust source and sink processes, sizedistributions of emitted dust and dust in the atmosphere, andphysical and chemical properties of dust (Ginoux et al., 2001;Tegen et al., 2002; Zender et al., 2003; Balkanski et al., 2007;Darmenova et al., 2009; McConnell et al., 2010; Kok, 2011;Zhao et al., 2010, 2011). In addition, the spatial resolution ofmodels may also contribute to the uncertainty of dust mod-eling (Gläser et al., 2012). However, there is relatively lessattention given to the impact of size representation of dust inmodels.
The size distributions of dust particles in the atmosphereare mainly represented using multiple modes or bins in cli-mate models (Huneeus et al., 2011). A modal approach repre-sents the size distribution of aerosols by several overlappingintervals, called modes, normally assuming a log-normal dis-tribution within each mode, while a bin approach representsthe size distribution of aerosols by several discrete size bins,which are defined by their lower and upper dry particle diam-eters. Generally, a modal approach is less accurate because ofits assumption of log-normal distribution and limited numberof modes, but it is computationally cheaper than a bin ap-proach that uses more bins. The modal approach is also oftenfurther simplified (e.g., assuming a constant standard devia-tion of the log-normal distributions) and hence has biases insimulating aerosol size distributions (e.g., Zhang et al., 1999;Zhao et al., 2010). Herzog et al. (2004), using a box model,found that a modal approach simulates a difference of < 20 %in number concentrations and surface area density comparedto a bin approach. Kokkola et al. (2009) found that sectionaland modal approaches simulate significantly different strato-spheric conditions perturbed by volcano eruption. Mann etal. (2012) compared the modal and sectional approach inmodeling aerosol microphysics using a 3-D global offlinechemistry transport model. They found differences in annualmean surface-level masses of sulfate, sea salt, black carbon(BC), and organic carbon (OC) within 25 % in nearly all re-gions. Although these studies have demonstrated some dif-ferences in modeling aerosols between modal and sectionalapproaches, none of them focused on dust, and the impactof different size representations on simulating dust and itsradiative forcing has not yet been investigated.
The sizes of dust particles can range from nanometer tomicron; however most climate models represent dust sizedistribution with a limited number of bins or modes (e.g.,3 or 4) for computational efficiency (Huneeus et al., 2011).Therefore, size representation of dust can be one of the mainfactors that significantly contribute to uncertainties in mod-eling dust, particularly over areas far from the main dustsource regions. To enhance our understanding of the impactof size representation on the simulation of dust and its ra-diative forcing, a modeling framework including differentsize representations (e.g., mode versus bin, and fewer ver-sus more bins) of dust is needed. The WRF-Chem model(Grell et al., 2005), a version of the Weather Research andForecasting (WRF) model (Skamarock et al., 2008) that sim-ulates trace gases and particulates simultaneously with themeteorological fields, includes different size representations(modal and bin) of aerosols. The model has been used byZhao et al. (2010) to investigate the sensitivity of the simu-lated dust radiative forcing to dust emission and size repre-sentation schemes over West Africa. Zhao et al. (2010) foundthat with the 8-bin size approach, WRF-Chem can capturewell the observed dust size distribution near the dust sourceregion of the Sahara, and performs better than a 3-mode sizerepresentation. In this study, the WRF-Chem model is used
Atmos. Chem. Phys., 13, 10733–10753, 2013 www.atmos-chem-phys.net/13/10733/2013/

C. Zhao et al.: Uncertainty in modeling dust mass balance and radiative forcing 10735
to conduct quasi-global (−180◦–180◦ E, 60◦ S–70◦ N) sim-ulations with three size representations (3-mode, 4-bin, and8-bin) of dust to investigate the impact of size representa-tion on modeling dust mass balance and its radiative forcing.The paper is organized as follows. Sections 2 and 3 detail theWRF-Chem model and the observations used in this study.The results are discussed in Sect. 4. The paper concludes inSect. 5.
2 Model description
In this study, WRF-Chem (v3.3.1) is used with updates bythe Pacific Northwest National Laboratory (PNNL), as de-scribed in Sect. 2.1 below. Section 2.2 discusses the setupof the simulations. The emissions used in the simulations in-cluding anthropogenic and biomass burning emissions, andonline calculated emissions of mineral dust and sea salt aredescribed in Sect. 2.3.
2.1 WRF-Chem
Two of the aerosol schemes implemented in WRF-Chemare used. One is the MADE/SORGAM (Modal Aerosol Dy-namics Model for Europe and Secondary Organic AerosolModel) aerosol model (Ackermann et al., 1998; Schell etal., 2001) coupled with the RADM2 (Regional Acid De-position Model 2) photochemical mechanism (Stockwell etal., 1990). The other is the MOSAIC (Model for SimulatingAerosol Interactions and Chemistry) aerosol model (Zaveriet al., 2008) coupled with the CBM-Z (Carbon Bond Mech-anism) photochemical mechanism (Zaveri and Peters, 1999).The MADE/SORGAM aerosol scheme uses the modal ap-proach with three log-normal modes (Aitken, accumulation,and coarse modes) to represent aerosol size distributions,while the MOSAIC aerosol scheme uses the bin approachwhere the aerosol size distribution is divided into discretesize bins, i.e., four bins or eight bins in the current versionof WRF-Chem (Fast et al., 2006). All major aerosol compo-nents are simulated in the model, including sulfate (SO2−
4 ),nitrate (NO−
3 ), ammonium (NH+4 ), elemental carbon (EC),organic matter (OM), sea salt, and mineral dust.
Both aerosol schemes include physical and chemical pro-cesses of nucleation, condensation, coagulation, aqueousphase chemistry, water uptake by aerosols, and dry and wetdeposition. Although it would be more straightforward tocompare the bin and modal size approaches in the sameaerosol scheme, neither of the aerosol schemes is imple-mented with both size approaches in the version (v3.3.1) ofWRF-Chem used in this study (the same is true for the newestversion (v3.5) of WRF-Chem). In order to treat the sourceand sink processes of dust consistently, both aerosol schemesare configured with the same aerosol emission and dry andwet deposition modules. The only difference between the twoaerosol models is aerosol chemistry that may not play a sig-
nificant role in simulating dust life cycle in this study. There-fore the difference between the two aerosol schemes in sim-ulating dust mass loading and radiative forcing is mostly at-tributable to their different size representations (mode versusbin; discussed in Sect. 4). Aerosol dry deposition is simulatedfollowing the approach of Binkowski and Shankar (1995).Wet removal of aerosols by large-scale stratiform cloud in-cludes in-cloud removal (rainout) and below-cloud removal(washout) by impaction and interception for grid-resolvedclouds and precipitation following Easter et al. (2004) andChapman et al. (2009). In this study, convective transport ofaerosols by cumulus clouds is coupled with the Kain–Fritschcumulus scheme (Kain et al., 1990; Kain, 2004) followingZhao et al. (2009), and wet removal of aerosols by cumulusclouds uses the scheme of Liu et al. (2001), which is similarto that of the GEOS-Chem model (Bey et al., 2001).
Aerosol optical properties such as extinction, single-scattering albedo, and asymmetry factor for scattering arecomputed as a function of wavelength and three-dimensionalposition. A detailed description of the computation of aerosoloptical properties in WRF-Chem can be found in Fast etal. (2006) and Barnard et al. (2010). Aerosol radiative feed-back was coupled with the Rapid Radiative Transfer Model(RRTMG) (Mlawer et al., 1997; Iacono et al., 2000) forboth shortwave (SW) and longwave (LW) radiation as im-plemented by Zhao et al. (2011). Aerosol–cloud interac-tions were included in the model by Gustafson et al. (2007)for calculating the activation and re-suspension between dryaerosols and cloud droplets. Aerosols in this study are as-sumed internally mixed in each mode or bin, i.e., a com-plex refractive index is calculated by volume averaging foreach mode or bin for each chemical constituent of aerosols.Therefore, in this study, the optical depth and direct radia-tive forcing of dust are diagnosed following the methodol-ogy by Zhao et al. (2013). The refractive index of dust is setto 1.53 + 0.003i globally as Zhao et al. (2010).
2.2 Numerical experiments
The WRF-Chem simulations are performed at 1◦ horizon-tal resolution using a quasi-global channel configuration (us-ing periodic boundary conditions in the zonal direction) with360× 130 grid cells (180◦ W–180◦ E, 60◦ S–70◦ N) (Fig. 1).The quasi-global configuration is used instead of global con-figuration due to some technical difficulties in running globalWRF-Chem in v3.3.1. To our best knowledge, global WRF-Chem has not been used in previous published research.This study is the first to conduct a quasi-global simula-tion using WRF-Chem. The simulation is configured with30 vertical layers up to 50 hPa. The meteorological ini-tial and lateral boundary (only for the meridional direction)conditions are derived from the National Center for Envi-ronmental Prediction final analysis (NCEP/FNL) data at 1◦
horizontal resolution and 6 h temporal intervals. The mod-eled u-component and v-component wind and atmospheric
www.atmos-chem-phys.net/13/10733/2013/ Atmos. Chem. Phys., 13, 10733–10753, 2013

10736 C. Zhao et al.: Uncertainty in modeling dust mass balance and radiative forcing
Table 1.Mass balance for dust in WRF-Chem experiments.
MOSAIC MADE/SORGAM
BIN8 BIN4 MOD3 MOD3_tuned
Size (D in µm) 0.039–10 0.039–10 (modal) (modal)
Emission (Tg yr−1)D < 10µm 4664 4672 4604 2303Total 6012 6016 5969 2986
∗Dry Deposition (Tg yr−1) 3120 3043 4109 2031
∗Wet Deposition (Tg yr−1) 1365 1460 1507 773
∗Transport (Tg yr−1) 36 36 61 32
Mass Load (Tg)D< 10 µm 39.0 40.2 49.9 27.0Total N/A N/A 54.3 28.4
AOD (550 nm,D< 10 µm) 0.039 0.030 0.094 0.053
Life Time(days) 3.2 3.3 3.5 3.6
∗ The dust mass balance contributed by dry deposition, wet deposition, and transport is calculated for dust particlesin all size ranges in the MOD3 and MOD3_tuned cases and for dust particles with diameter smaller than 10 µm inthe BIN8 and BIN4 cases.
52
1132
1133
1134
Figure 1 Spatial distribution of annual mean dust emission in 2011 from the WRF-Chem 1135
simulation in the BIN8 case. Value of annual global total dust emission is also shown. 1136
1137
1138
1139
1140
1141
1142
1143
1144
1145
Fig. 1. Spatial distribution of annual mean dust emission in 2011from the WRF-Chem simulation in the BIN8 case. The value ofannual global total dust emission is also shown.
temperature are nudged towards the NCEP/FNL reanalysisdata with a nudging timescale of 6 h in all cases (Staufferand Seaman, 1990). Nudging provides a better simulationof large-scale circulation, which is important for long-rangetransport. The chemical initial and boundary (only for themeridional direction) conditions are from the default pro-files in WRF-Chem, which are the same as those used byMcKeen et al. (2002) and are based on averages of midlati-tude aircraft profiles from several field studies over the east-ern Pacific Ocean. The impact of chemical boundary con-
ditions on the simulated results is found negligible in thisstudy (will be discussed in Sect. 4). The simulation is con-ducted from 1 December 2010 to 31 December 2011. Onlyresults for the year of 2011 (referred to as the simulation pe-riod hereafter) are analyzed to minimize the impact from theinitial condition. The MYJ (Mellor–Yamada–Janjic) plane-tary boundary layer scheme, Noah land surface scheme, Mor-rison 2-moment microphysics scheme, Kain–Fritsch cumu-lus scheme, and RRTMG longwave and shortwave radiationschemes are used in this study.
In order to examine the uncertainties in modeling dustmass balance and radiative forcing resulting from size rep-resentation, WRF-Chem simulations are conducted for fourcases: BIN8, BIN4, MOD3, and MOD3_tuned. BIN8 andBIN4 use the MOSAIC aerosol scheme with the 8-bin and4-bin size representations, respectively; MOD3 uses theMADE/SORGAM aerosol scheme with the 3-mode size rep-resentation; MOD3_tuned is similar to MOD3 except that thetotal dust emission is tuned to be half of the former threecases (will be discussed in Sect. 2.3 about dust emission). Allfour case simulations are summarized in Table 1. As men-tioned above, a modal or bin approach with a smaller num-ber of modes or bins is less accurate in representing the dustsize distribution than a bin approach that uses more bins.To examine the uncertainty in modeling dust mass balanceand radiative forcing resulting from size representation, wefocus on comparing simulations in the BIN4, MOD3, andMOD3_tuned cases with the BIN8 case, all using the samephysics parameterizations of dust. In other words, the BIN8case is taken as a benchmark for analysis. With nudged me-teorology, the radiative feedback of dust on the meteorol-ogy is minimized so that the difference in dust mass balanceamong the four cases results mainly from the direct impact
Atmos. Chem. Phys., 13, 10733–10753, 2013 www.atmos-chem-phys.net/13/10733/2013/

C. Zhao et al.: Uncertainty in modeling dust mass balance and radiative forcing 10737
of size representations without the feedback of changed me-teorology to dust emissions and simulations of other aerosolspecies. We will note that the simulated dust emission andmass of other aerosol species are similar to each other amongthe four cases (Sect. 4). The impact of size representations ondust’s climatic effect will be investigated in future study.
2.3 Emissions
2.3.1 Dust emission
The dust emission scheme adopted from the Goddard Chem-istry Aerosol Radiation and Transport (GOCART) model(Ginoux et al., 2001) coupled with the MADE/SORGAMand MOSAIC aerosol schemes (Zhao et al., 2010) is usedin this study. It was implemented and evaluated by Zhao etal. (2010) over North Africa, and has been further evaluatedand used over other regions (e.g., North America, East Asia,and the Arabian Peninsula) by previous studies for dust simu-lations with WRF-Chem (e.g., Zhao et al., 2011, 2012; Chenet al., 2013; Kalenderski et al., 2013). The GOCART schemecalculates the dust emission fluxG as
G = CSspu210m(u10m− ut),
whereC (µg s2 m−5) is an empirical proportionality constant,S is a source function that defines the potential dust sourceregions and comprises surface factors, such as vegetation andsnow cover,sp is a fraction of each size class of dust in emis-sion,u10m (m s−1) is the horizontal wind speed at 10 m, andut (m s−1) is the threshold 10 m wind speed below which dustemission does not occur and is a function of particle size, airdensity, and surface moisture. The source functionS is pre-scribed as in Ginoux et al. (2001). The default value ofC
is 1.0 µg s2 m−5 provided by Ginoux et al. (2001). With thisC value, the MOD3 simulation significantly overestimatesthe AOD over the dust source regions compared to satel-lite retrievals (see further discussion in Sect. 4). Since theC value is tunable, we use aC value of 0.5 µg s2 m−5 in theMOD3_tuned case so that the simulated mean AOD with themodal size representation is more consistent with the satel-lite retrievals over the dust source regions. Comparing theresult of the MOD3_tuned case with that of the BIN8 case,we can identify the uncertainties in simulating dust mass bal-ance and radiative forcing when the mode size representationis used in models where dust emissions are calibrated to sim-ulate reasonable dust AOD against observations. Note thatthe GOCART scheme is only used for calculating total dustemission fluxes, and the emitted dust particles follow the sizedistributions discussed below.
The vertical dust flux emitted in each grid box and timestep is distributed using the corresponding size representa-tions of the four cases. The size distributions of emitted dustin all four cases are made consistent, so that the differencein simulated dust size distributions results solely from thedifference in size representations (see further discussion in
Sect. 4). The size distribution of emitted dust follows a the-oretical expression based on the physics of scale-invariantfragmentation of brittle materials derived by Kok (2011). Inthe BIN8 case, dust particles are emitted into eight size bins(0.039–0.078 µm, 0.078–0.156 µm, 0.156–0.312 µm, 0.312–0.625 µm, 0.625–1.25 µm, 1.25–2.5 µm, 2.5–5.0 µm, and 5.0–10.0 µm dry diameter) with mass fractions of 10−6 %,10−4 %, 0.02 %, 0.2 %, 1.5 %, 6 %, 26 %, and 45 %, re-spectively. In the BIN4 case, dust particles are emittedinto four size bins (0.039–0.156 µm, 0.156–0.625 µm, 0.625–2.5 µm, and 2.5–10.0 µm dry diameter) with mass fractionsof 10−4 %, 0.22 %, 7.5 %, and 71 %, respectively. In bothMOD3 and MOD3_tuned cases, the dust particles are emit-ted into two log-normal modes (accumulation and coarse)with mass fraction of 15 % and 85 %, respectively. The vol-ume median diameter (dpgv) and the standard deviation (σg)of the two log-normal modes are 2.91 µm and 2.20, respec-tively, for the accumulation mode, and 6.91 µm and 1.73, re-spectively, for the coarse mode. The dust mass and numberconcentrations in each bin or mode are updated during thesimulations. In simulations with mode size representation,the volume mean diameters of each mode are also updatedfrom the predicted mass and number concentrations, whilethe prescribedσg are kept constant, which is one of the ma-jor factors contributing to the biases of the modal approachto represent dust size distributions (Zhao et al., 2010).
It is noteworthy that the MOD3 and MOD3_tuned casessimulate dust particles in the entire modes, while the BIN8and BIN4 cases simulate dust particles with a diametersmaller than 10 µm (D < 10 µm). One reason is that parti-cles larger than 10 µm in diameter generally have short at-mospheric lifetimes due to gravitational settling (Tegen andFung, 1994). In addition, this study finds that the mass ofdust particles larger than 10 µm in diameter contributes to< 10 % of total dust mass loading based on the MOD3 andMOD3_tuned simulations. Therefore, the BIN8 and BIN4cases only simulate∼80 % of the total dust emissions tokeep the same size distributions of emitted dust with that ofMOD3 and MOD3_tuned. When the model simulated dustmass loading and radiative forcing among the four casescompared in the following, for consistency, only the contri-bution of dust particles smaller than 10 µm dry diameter isconsidered.
2.3.2 Other emissions
Anthropogenic emissions are obtained from the Reanal-ysis of the TROpospheric (RETRO) chemical compo-sition inventories (http://retro.enes.org/index.shtml) exceptover East Asia and the United States, where anthro-pogenic emissions are from David Streets’ 2006 emis-sion inventory (Zhang et al., 2009) and from the US Na-tional Emission Inventory (NEI) 2005 (WRF-Chem userguide fromhttp://ruc.noaa.gov/wrf/WG11/Users_guide.pdf),respectively. Biomass burning emissions are obtained from
www.atmos-chem-phys.net/13/10733/2013/ Atmos. Chem. Phys., 13, 10733–10753, 2013
10738 C. Zhao et al.: Uncertainty in modeling dust mass balance and radiative forcing
the Global Fire Emissions Database version 3 (GFEDv3),with monthly temporal resolution (van der Werf et al., 2010)and vertically distributed following the injection heights sug-gested by Dentener et al. (2006) for the Aerosol InterCom-parison project (AeroCom). Sea salt emission follows Zhaoet al. (2013), which is based on Gong (2003) to includecorrection of particles with radius smaller than 0.2 µm andJaeglé et al. (2011) to include the sea salt emission depen-dence on sea surface temperature.
3 Observations
The AOD retrieved from the Moderate Resolution Imag-ing Spectroradiometer (MODIS) instruments on board theNASA Terra and Aqua platforms and the Multi-angle Imag-ing SpectroRadiometer (MISR) instrument on board theNASA Terra platform are used. MODIS is uniquely designedwith high spatial resolution, wide spectral range, and neardaily global coverage to monitor changes in the Earth system,including tropospheric aerosols (Kaufman et al., 1997). Thestandard MODIS aerosol product does not retrieve aerosolinformation over bright surfaces (e.g., the Sahara) due toa strong surface spectral contribution in the visible range(Kaufman et al., 1997). A new algorithm, called the “deepblue algorithm” (Hsu et al., 2006), integrated with the ex-isting MODIS algorithm can retrieve AOD even over brightsurfaces. In this study, the retrieved “deep blue” AOD fromMODIS (L3) is used over land, while the standard retrievedAOD is used over the ocean. The MODIS on board the Aquaplatform passes over the Equator at∼13:30 LT (local time)during daytime (Kaufman et al., 1997). MISR observes con-tinuously in four narrow spectral bands centered at 446, 558,672, and 866 nm and at nine distinct zenith angles, rang-ing from 70◦ afterward to 70◦ forward. MISR’s spectral dataand unique blend of directional allows aerosol retrieval algo-rithms that do not depend on the explicit radiometric surfaceproperties. As such, MISR can retrieve aerosol propertieseven over highly reflective surfaces like deserts (Diner et al.,1998; Martonchik et al., 2004). The MISR on board the Terraplatform passes over the Equator at∼10:45 LT during day-time (Diner et al., 2001). When compared to the MODIS andMISR retrieved AOD, the model results are sampled from10:00–14:00 LT for averaging and at the locations where re-trievals are available.
4 Results and discussion
4.1 Impact of size representation on dust emissionestimation
Using the experimental design discussed above, the threecases of BIN8, BIN4, and MOD3 have consistent totalamounts and spatial distributions of dust emissions. Fig-ure 1 shows the spatial distribution of annual mean dust
emission from the WRF-Chem simulations in the BIN8 casein 2011. The model simulates significant amounts of dustemission over major deserts such as Sahara, Taklimakan,Gobi, North American, and Australian deserts. The differ-ence of total dust emissions among these three cases is lessthan 1 %. The annual total global dust emission simulatedby the three cases is about 6000 Tg yr−1. The emitted massof dust particles with diameter sizes smaller than 10 µm is4600 Tg yr−1, which is near the higher end of the range(3995–4313 Tg yr−1) reported by Huneeus et al. (2011). Thisvalue is about 50 % higher than 3157 Tg yr−1 estimated bythe GOCART model for year 2000 (Huneeus et al., 2011) and∼3000 Tg yr−1 estimated by Mian Chin et al. (2009) and andKim et al. (2013, this issue) for 2000–2007 using the GO-CART model. Although this study uses a similar dust emis-sion scheme as used in the GOCART model, the simulatedmeteorological fields (e.g., surface winds) and land surfaceconditions (e.g., soil moisture) could be different betweenWRF-Chem and the GOCART model. A full investigation ofthe difference between WRF-Chem and GOCART in simu-lating dust emission is beyond the scope of this study.
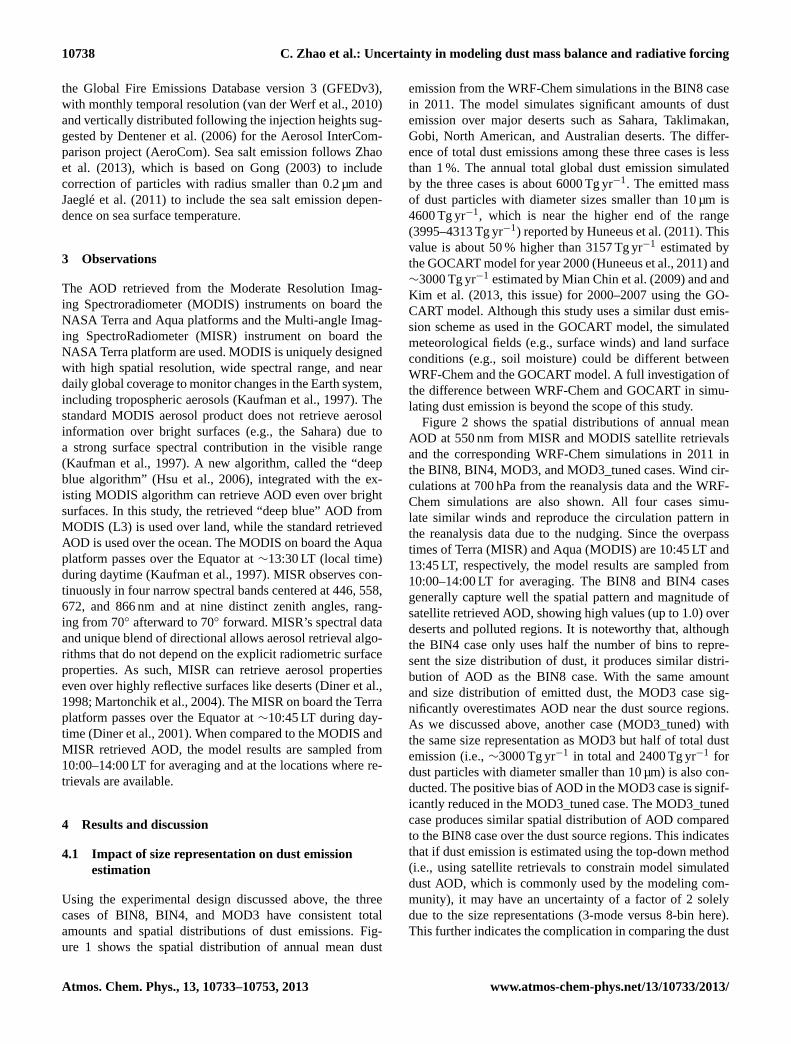
Figure 2 shows the spatial distributions of annual meanAOD at 550 nm from MISR and MODIS satellite retrievalsand the corresponding WRF-Chem simulations in 2011 inthe BIN8, BIN4, MOD3, and MOD3_tuned cases. Wind cir-culations at 700 hPa from the reanalysis data and the WRF-Chem simulations are also shown. All four cases simu-late similar winds and reproduce the circulation pattern inthe reanalysis data due to the nudging. Since the overpasstimes of Terra (MISR) and Aqua (MODIS) are 10:45 LT and13:45 LT, respectively, the model results are sampled from10:00–14:00 LT for averaging. The BIN8 and BIN4 casesgenerally capture well the spatial pattern and magnitude ofsatellite retrieved AOD, showing high values (up to 1.0) overdeserts and polluted regions. It is noteworthy that, althoughthe BIN4 case only uses half the number of bins to repre-sent the size distribution of dust, it produces similar distri-bution of AOD as the BIN8 case. With the same amountand size distribution of emitted dust, the MOD3 case sig-nificantly overestimates AOD near the dust source regions.As we discussed above, another case (MOD3_tuned) withthe same size representation as MOD3 but half of total dustemission (i.e.,∼3000 Tg yr−1 in total and 2400 Tg yr−1 fordust particles with diameter smaller than 10 µm) is also con-ducted. The positive bias of AOD in the MOD3 case is signif-icantly reduced in the MOD3_tuned case. The MOD3_tunedcase produces similar spatial distribution of AOD comparedto the BIN8 case over the dust source regions. This indicatesthat if dust emission is estimated using the top-down method(i.e., using satellite retrievals to constrain model simulateddust AOD, which is commonly used by the modeling com-munity), it may have an uncertainty of a factor of 2 solelydue to the size representations (3-mode versus 8-bin here).This further indicates the complication in comparing the dust
Atmos. Chem. Phys., 13, 10733–10753, 2013 www.atmos-chem-phys.net/13/10733/2013/

C. Zhao et al.: Uncertainty in modeling dust mass balance and radiative forcing 10739
53
1146
1147
1148
Figure 2 Spatial distribution of annual mean AOD from the MODIS and MISR retrievals 1149
and the corresponding WRF-Chem simulations in the four cases (BIN8, BIN4, MOD3, 1150
and MOD3_tuned) in 2011. The model results are sampled between 10am-2pm (local 1151
time) at each grid point. The winds at 700 hPa over MODIS and MISR are from GFS 1152
reanalysis and over four cases are from WRF-Chem simulations. 1153
1154
1155
1156
1157
Fig. 2. Spatial distribution of annual mean AOD from the MODIS and MISR retrievals and the corresponding WRF-Chem simulations inthe four cases (BIN8, BIN4, MOD3, and MOD3_tuned) in 2011. The model results are sampled between 10:00–14:00 LT at each grid point.The winds at 700 hPa over MODIS and MISR are from GFS reanalysis and over the four cases are from WRF-Chem simulations.
emissions from different models with different size represen-tations.
The AOD diversity among the four cases primarily comesfrom their difference in simulating dust instead of otheraerosol species. Figure 3 shows the spatial distributions ofannual mean AOD at 550 nm contributed by dust and otheraerosols, respectively, from the WRF-Chem simulations in2011 in the BIN8, BIN4, MOD3, and MOD3_tuned cases.In general, dust contributes to >90 % of total AOD over thedesert regions. Over the oceans downwind of the source re-gions, the dust contribution to total AOD can reach 70 % overthe North Atlantic. Its contribution is much less (∼20 %)over the North Pacific due to the strong anthropogenic pol-lution outflow from East Asia and sea salt emissions. Itshows that the difference in total AOD among the cases ofBIN8, BIN4, MOD3, and MOD3_tuned is dominated by thedifference in dust AOD among the four cases. The BIN8,BIN4, MOD3, and MOD3_tuned cases simulate domain-averaged dust AOD of 0.039, 0.030, 0.094, and 0.053, re-
spectively. The BIN8, BIN4, and MOD3_tuned cases sim-ulate much lower domain-averaged dust AOD than MOD3.Although the domain-averaged dust AOD from the BIN8,BIN4, and MOD3_tuned cases also have a large difference(up to∼35 %), these three cases simulate similar dust AODover the desert regions with a relative difference of less than10 %.
Although the simulated AOD contributed by otheraerosols in the four cases is not the same, its difference isrelatively small compared to the difference in the simulateddust AOD. The minor difference among the four cases insimulating other aerosols likely comes from their differentmechanisms of aerosol chemistry (MADE/SORGAM ver-sus MOSAIC). However, the difference in aerosol chemistryshould only have a minor impact on dust simulation, sincethe dust mass balance is mainly determined by the emissionand the dry and wet deposition processes. The size repre-sentations may also affect the simulations of other aerosols.Moreover, although meteorology fields are nudged to the
www.atmos-chem-phys.net/13/10733/2013/ Atmos. Chem. Phys., 13, 10733–10753, 2013

10740 C. Zhao et al.: Uncertainty in modeling dust mass balance and radiative forcing
54
1158
1159
1160
Figure 3 Spatial distribution of annual mean AOD contributed by dust and other 1161
aerosols, respectively, from the WRF-Chem simulations in the four cases (BIN8, BIN4, 1162
MOD3, and MOD3_tuned) in 2011. 1163
1164
1165
1166
1167
Fig. 3.Spatial distribution of annual mean AOD contributed by dust and other aerosols, respectively, from the WRF-Chem simulations in thefour cases (BIN8, BIN4, MOD3, and MOD3_tuned) in 2011.
reanalysis data, the different feedbacks on meteorology fromdust radiative forcing among the four cases (Sect. 4.3) mayalso play a role in the chemistry of other aerosols. Since ourprimary interest is not in the small difference in simulatingother aerosols among the four cases, we focus on the anal-ysis of the impact of size representations on dust simulationhereafter.
4.2 Impact of size representation on dust mass balance
4.2.1 Dust mass loading
Figure 4 shows the spatial distribution of annual mean dustmass loading in 2011 from the WRF-Chem simulations inthe BIN8 case and the difference in the BIN4, MOD3, andMOD3_tuned cases from the BIN8 case. The spatial distribu-tion of dust mass loading in the BIN8 case is consistent withits dust AOD (Fig. 3). A large amount of dust loading is sim-ulated over the source regions (i.e., deserts of the globe). Thedust mass loading over the Northern Hemisphere is much
larger than over the Southern Hemisphere. It also shows thatdust transport affects remote areas downwind of the sourceregions, such as the North Pacific and North Atlantic, wherethe dust mass loading can reach 0.1 g m−2 and 0.5 g m−2, re-spectively. The annual domain-averaged dust mass loadingin the BIN8 case is 39 Tg.
The difference of dust mass loading in the BIN4, MOD3,and MOD3_tuned cases from the BIN8 case is calculatedby subtracting the dust mass loading in the BIN8 case fromthat in each of the other three cases. With the same dustemission as BIN8, both BIN4 and MOD3 simulate higherdust mass loading than BIN8 over most regions, with an-nual domain averages of 40.2 Tg and 49.1 Tg, respectively. Itis noteworthy that the relative difference in dust mass load-ing among the BIN8, BIN4, and MOD3 cases is significantlylower than that in dust AOD. The highest difference is lo-cated at the desert regions due to the highest dust mass load-ing there. The relative difference (< 10 % globally) betweenBIN4 and BIN8 is much smaller than that (up to 150 %)
Atmos. Chem. Phys., 13, 10733–10753, 2013 www.atmos-chem-phys.net/13/10733/2013/

C. Zhao et al.: Uncertainty in modeling dust mass balance and radiative forcing 10741
55
1168
1169
1170
Figure 4 Spatial distribution of annual mean dust mass loading from the WRF-Chem 1171
simulations in the case BIN8 in 2011 (top panel) and the difference in the cases BIN4, 1172
MOD3, and MOD3_tuned from BIN8 (bottom three panel). 1173
1174
1175
Fig. 4. Spatial distribution of annual mean dust mass loading fromthe WRF-Chem simulations in the case BIN8 in 2011 (top panel)and the difference in the cases BIN4, MOD3, and MOD3_tunedfrom BIN8 (three bottom panels).
between MOD3 and BIN8. Over the source regions suchas the Sahara and the Taklimakan Desert, the relative dif-ference between MOD3 and BIN8 is within 10 %, which isconsistent with Zhao et al. (2010). However, over the down-wind regions such as the East China Sea, the relative dif-ference between MOD3 and BIN8 increases to 40 %. Thisdifference can even reach 80 % over the eastern and west-ern coasts of the United States after long-range transport and100 % over the southern oceans where the dust mass loadingis relatively low. With half the amount of dust emission in theBIN8 case, the MOD3_tuned case simulates much lower an-nual domain-averaged dust mass loading (27 Tg) than BIN8.The MOD3_tuned case simulates about half of the dust massloading from the BIN8 case over the desert regions, while it
produces similar (with < 10 % relative difference) dust massloading as the BIN8 case over the Northern Hemisphere andhigher (up to 40 %) dust mass loading over the SouthernHemisphere. It is interesting to note that the MOD3_tunedcase with half the amount of dust emission yields 30 % lowerannual domain-averaged dust mass loading but 35 % higherdust AOD compared to the BIN8 case. The dust emission,mass loading, and AOD for the four cases are listed in Ta-ble 1. In the analysis and comparison above, only dust parti-cles with a smaller than 10 µm dry diameter are considered.However, Table 1 also lists the dust emission and mass load-ing for all-size dust particles for the cases of MOD3 andMOD3_tuned. It shows that the mass loading of dust withsmaller than 10 µm dry diameter is about 5 % less than thatof all-size dust from the MOD3 and MOD3_tuned simula-tions.
Figure 5 shows the longitude–height cross section of an-nual meridional mean dust mass concentration in 2011 fromthe WRF-Chem simulations in the BIN8 case and the differ-ence in the BIN4, MOD3, and MOD3_tuned cases from theBIN8 case. The result from the BIN8 case shows the high-est dust mass concentration (∼70 µg m−3) over the regionswithin ± 30◦ E, where the Sahara, the world largest desert,is located. It also clearly indicates the distribution of globaldeserts with relatively high dust mass concentration, such asNorth American deserts around 115◦ W and Central Asiandeserts at 60◦–70◦ E. Above the source regions, the dust con-centration decreases gradually with height and reaches about10 % of the surface concentration at 8 km. Over the remoteregions, the largest dust mass concentration (∼4 µg m−3)is found at 3–4 km. In general, BIN4 and MOD3 simu-late higher dust mass concentration throughout the atmo-spheric column. The difference between BIN8 and BIN4 isrelatively small (< 10 %). The relatively large difference (upto ∼8 µg m−3) between MOD3 and BIN8 occurs over thesource regions in the lower atmosphere (<∼4 km). However,the relative difference between these two cases has the small-est values (< 10 %) near the surface of the source regions. Itincreases with height and the distance downwind and reaches100 % over the remote regions (e.g., around 150◦ W) upto 4 km. The MOD3_tuned case simulates about 30–50 %lower dust concentration over the source regions (60◦ W–0◦–100◦ E) up to 4 km. Over the remote regions (150◦ E–180◦–90◦ W, except the North American deserts around 115◦ W),the MOD3_tuned case simulates about 10–20 % higher dustconcentration up to 4 km. At 4–8 km, the relative differencebetween MOD3_tuned and BIN8 is relatively small (< 20 %).Above 8 km over the source regions, the MOD3_tuned casesimulates again 50 % lower dust concentration.
4.2.2 Dust size distribution in the atmosphere
The difference in dust mass loading among the cases ofBIN8, BIN4, and MOD3 primarily results from their differ-ent dust size distributions. Figure 6 shows the normalized
www.atmos-chem-phys.net/13/10733/2013/ Atmos. Chem. Phys., 13, 10733–10753, 2013

10742 C. Zhao et al.: Uncertainty in modeling dust mass balance and radiative forcing
Copernicus Publications
Bahnhofsallee 1e
37081 Göttingen
Germany
Martin Rasmussen (Managing Director)
Nadine Deisel (Head of Production/Promotion)
Contact
http://publications.copernicus.org
Phone +49-551-900339-50
Fax +49-551-900339-70
Legal Body
Copernicus Gesellschaft mbH
Based in Göttingen
Registered in HRB 131 298
County Court Göttingen
Tax Office FA Göttingen
USt-IdNr. DE216566440
Page 1/1
Fig. 5. Cross section of meridional mean dust mass concentrationfrom the WRF-Chem simulations in the case BIN8 in 2011; and thedifference in the cases BIN4, MOD3, and MOD3_tuned from theBIN8 case.
size distributions of dust at emission, over the source re-gion (North Africa, 2.5◦ E–28.5◦ E and 14.5◦ N–28.5◦ N),and over the remote region (North Atlantic, 60◦ W–34.5◦ Wand 16.5◦ N–31.5◦ N) from the WRF-Chem simulations inthe cases of BIN8, BIN4, MOD3, and MOD3_tuned. Thedust size distributions over the source and remote regions arecolumn integrated above 1 km. It can be noted that the sizedistributions of dust at emission are prescribed to be consis-tent among the four cases as discussed above. The dust sizedistribution in the BIN4 case generally follows that in theBIN8 case but has coarser size resolution. The MOD3_tunedcase simulates similar size distribution with the MOD3 case.The small difference between MOD3 and MOD3_tuned is
likely due to the feedbacks from their different dust massloading.
Between the cases of BIN8 and MOD3, the dust size dis-tributions start to differentiate in the atmosphere over thesource region, and the difference is enlarged after long-rangetransport over the remote region. The MOD3 case retainssubstantially more fine dust but less coarse dust versus theBIN8 case, indicating that it simulates a smaller dry depo-sition rate for fine particles but a larger dry deposition ratefor coarse particles, compared to the BIN8 case. This biasis general for a modal size representation with prescribedσg
that should be updated during the simulations, since dry de-position generally has a larger rate for coarse particles thanfor fine particles and thus change the shape of log-normalsize distributions that is described byσg. Sensitivity tests byZhao et al. (2010) showed that the dust size distribution issensitive to the prescribedσg for the mode size representa-tion. This study confirms that the prescribedσg causes theerror in calculating dust size distribution using the mode sizerepresentation. A three-moment aerosol size parameteriza-tion (i.e., predicting aerosol mass, number, and surface areaand thusσg) may be needed for the mode approach to ap-propriately represent dust size distributions (Binkowski andRoselle, 2003).
The bias in simulating dust size distributions (i.e., overes-timating fine particles and underestimating coarse particles)by the MOD3 and MOD3_tuned cases can also be demon-strated by the mass ratio of dust particles with dry diam-eters < 2.5 µm and those with dry diameters < 10 µm (i.e.,mass ratio of PM2.5-Dust and PM10-Dust). Figure 7 showsthe spatial distribution of PM2.5-Dust to PM10-Dust mass ra-tio in 2011 from the WRF-Chem simulations in the BIN8case and the difference in the cases of BIN4, MOD3, andMOD3_tuned from the BIN8 case. It clearly shows the trans-formation of mass ratio of fine and coarse particles duringthe transport in the BIN8 case. The mass ratio of PM2.5-Dust / PM10-Dust is around 0.2 over the desert regions andincreases to around 0.35 over the remote regions such as theNorth Pacific and Atlantic. In general, this ratio has largervalues over the Northern Hemisphere than those over theSouthern Hemisphere. In general, BIN4 simulates smaller ra-tio of PM2.5-Dust / PM10-Dust than BIN8. The difference be-tween BIN4 and BIN8 is relatively small within the range of± 0.05. The relative difference between BIN4 and BIN8 iswithin ± 5 % over the desert regions and can reach−15 %over the remote oceans such as the North Pacific and At-lantic. In contrast, the difference between MOD3 and BIN8is much larger. MOD3 generally simulates higher valuesof PM2.5-Dust / PM10-Dust than BIN8 globally. The differ-ence between MOD3 and BIN8 is smaller over the desertregions (∼0.05) than the remote regions (up to∼0.4). Theratio of PM2.5-Dust / PM10-Dust simulated by MOD3 canreach∼0.6 over the remote oceans, which is a factor of 2 ofthat from BIN8. Near the desert regions, MOD3 simulates a30–50 % higher ratio of PM2.5-Dust / PM10-Dust than BIN8.
Atmos. Chem. Phys., 13, 10733–10753, 2013 www.atmos-chem-phys.net/13/10733/2013/

C. Zhao et al.: Uncertainty in modeling dust mass balance and radiative forcing 10743
57
1182
1183
1184
1185
1186
1187
Figure 6 Normalized size distribution of dust at emission, over source regions, and over 1188
remote regions in 2011 from the WRF-Chem simulations in the case BIN8, BIN4, 1189
MOD3, and MOD3_tuned. Over source region and remote regions, only dust above 1 km 1190
is sampled for the size distribution to avoid the impact of sea salt emission. 1191
1192
1193
1194
1195
1196
1197
1198
1199
1200
Fig. 6.Normalized size distribution of dust at emission over source regions and over remote regions in 2011 from the WRF-Chem simulationsin the cases BIN8, BIN4, MOD3, and MOD3_tuned. Over source and remote regions, only dust above 1 km is sampled for the size distributionto avoid the impact of sea salt emission over remote regions.
The ratios of PM2.5-Dust / PM10-Dust between MOD3 andMOD3_tuned are similar.
4.2.3 Dust dry and wet deposition
The BIN8, BIN4, and MOD3 cases simulate different dryand wet deposition fluxes due to their different dust massloading and size distributions resulting from the differentsize representations, although the same parameterizations forthe fundamental processes of dust dry and wet depositionare used. Figure 8 shows the spatial distributions of dustdry, wet, and total deposition fluxes in 2011 from the WRF-Chem simulations in the BIN8 case and the difference in theBIN4, MOD3, and MOD3_tuned cases from the BIN8 case.It should be noted here that the dust dry and wet deposi-tion fluxes shown are for dust particles smaller than 10 µmin diameter in the BIN8 and BIN4 cases but for all-sizedust particles in the MOD3 and MOD3_tuned cases. Thefluxes for particles withD < 10 µm in the cases of MOD3 andMOD3_tuned cannot be obtained, since the model only sim-ulates the integrated total fluxes instead of the size-resolvedfluxes for dry and wet removal. However, the mass loadingof PM10-Dust is only∼5 % less than that of all-size dust(Table 1). The dry deposition flux simulated by the BIN8case shows larger spatial variability. It reaches∼200 g m−2
over the desert regions due to the highest dust mass loadingthere, and decreases significantly to merely∼0.1 g m−2 overthe remote oceans. Dust dry deposition fluxes are mainly de-termined by the dust mass loading, while its wet depositionfluxes are determined by both mass loading and precipitation.Therefore, the spatial variability of wet deposition fluxes isless heterogeneous than that of dry deposition fluxes, becauseprecipitation is low over the desert regions where the dustmass loading is high. The dust wet deposition flux reaches50 g m−2 over the continents near the deserts and 1 g m−2
over the oceans. In general, the dust dry deposition fluxesare larger over the continent but smaller over the ocean than
the dust wet deposition fluxes. As a domain average, BIN8simulates dust dry deposition fluxes of 3120 Tg yr−1, whichis more than a factor of 2 of the dust wet deposition fluxes(1365 Tg yr−1).
In general, BIN4 simulates smaller dust dry deposi-tion fluxes over the desert regions but larger values overthe remote regions, and 3 % lower on a domain average(3043 Tg yr−1) than BIN8. The dust wet deposition flux(1460 Tg yr−1 on a domain average) is larger (6 % on a do-main average) in the BIN4 case than that in the BIN8 caseglobally. The difference in simulating dust dry depositionfluxes between MOD3 and BIN8 is much larger than thatbetween BIN4 and BIN8. MOD3 simulates larger dust drydeposition fluxes than BIN8 globally. The difference in sim-ulating dust wet deposition between MOD3 and BIN8 ismore heterogeneous in terms of spatial distribution near thedesert regions with positive and negative values. The differ-ence in dust total deposition fluxes between MOD3 and BIN8is dominated by their difference in dust dry deposition fluxes.MOD3_tuned simulates much smaller dust dry and wet de-position fluxes than BIN8 globally, mainly due to its muchlower dust mass loading. The atmospheric mass balance ofdust is summarized in Table 1. Since the simulations are con-ducted with boundaries in meridional direction, there is alsoa dust mass balance term for transport. It is noteworthy thatthe contributions of transport in all four cases are negligible(< 1 % of the dust emission and deposition terms).
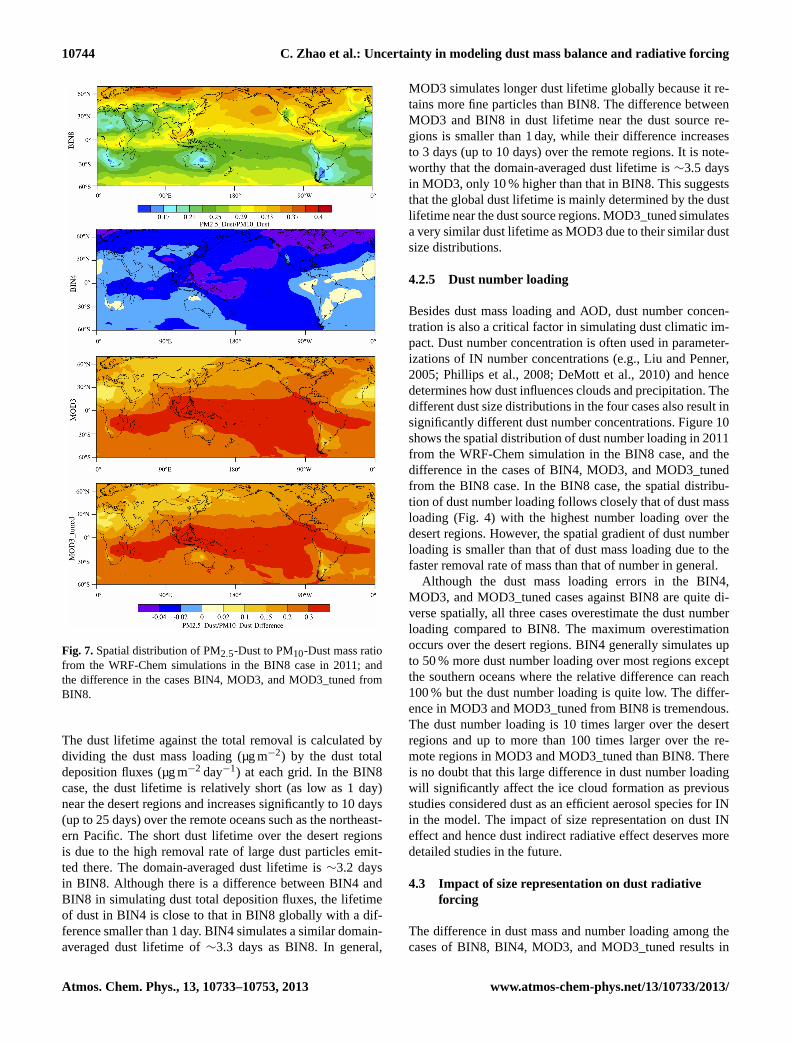
4.2.4 Dust lifetime
Since the dust dry and wet deposition fluxes are proportionalto its mass loading, the removal rate of dust can be betterdemonstrated in dust atmospheric lifetime. Figure 9 showsthe spatial distribution of dust atmospheric lifetime againstthe total removal (dry and wet deposition) in 2011 from theWRF-Chem simulations in the BIN8 case; and the differencein the cases of BIN4, MOD3, and MOD3_tuned from BIN8.
www.atmos-chem-phys.net/13/10733/2013/ Atmos. Chem. Phys., 13, 10733–10753, 2013
10744 C. Zhao et al.: Uncertainty in modeling dust mass balance and radiative forcing
58
1201
1202
Figure 7 Spatial distribution of PM2.5-Dust to PM10-Dust mass ratio from the WRF-1203
Chem simulations in the case BIN8 in 2011; and the difference in the cases BIN4, 1204
MOD3, and MOD3_tuned from BIN8. 1205
1206
1207
Fig. 7. Spatial distribution of PM2.5-Dust to PM10-Dust mass ratiofrom the WRF-Chem simulations in the BIN8 case in 2011; andthe difference in the cases BIN4, MOD3, and MOD3_tuned fromBIN8.
The dust lifetime against the total removal is calculated bydividing the dust mass loading (µg m−2) by the dust totaldeposition fluxes (µg m−2 day−1) at each grid. In the BIN8case, the dust lifetime is relatively short (as low as 1 day)near the desert regions and increases significantly to 10 days(up to 25 days) over the remote oceans such as the northeast-ern Pacific. The short dust lifetime over the desert regionsis due to the high removal rate of large dust particles emit-ted there. The domain-averaged dust lifetime is∼3.2 daysin BIN8. Although there is a difference between BIN4 andBIN8 in simulating dust total deposition fluxes, the lifetimeof dust in BIN4 is close to that in BIN8 globally with a dif-ference smaller than 1 day. BIN4 simulates a similar domain-averaged dust lifetime of∼3.3 days as BIN8. In general,
MOD3 simulates longer dust lifetime globally because it re-tains more fine particles than BIN8. The difference betweenMOD3 and BIN8 in dust lifetime near the dust source re-gions is smaller than 1 day, while their difference increasesto 3 days (up to 10 days) over the remote regions. It is note-worthy that the domain-averaged dust lifetime is∼3.5 daysin MOD3, only 10 % higher than that in BIN8. This suggeststhat the global dust lifetime is mainly determined by the dustlifetime near the dust source regions. MOD3_tuned simulatesa very similar dust lifetime as MOD3 due to their similar dustsize distributions.
4.2.5 Dust number loading
Besides dust mass loading and AOD, dust number concen-tration is also a critical factor in simulating dust climatic im-pact. Dust number concentration is often used in parameter-izations of IN number concentrations (e.g., Liu and Penner,2005; Phillips et al., 2008; DeMott et al., 2010) and hencedetermines how dust influences clouds and precipitation. Thedifferent dust size distributions in the four cases also result insignificantly different dust number concentrations. Figure 10shows the spatial distribution of dust number loading in 2011from the WRF-Chem simulation in the BIN8 case, and thedifference in the cases of BIN4, MOD3, and MOD3_tunedfrom the BIN8 case. In the BIN8 case, the spatial distribu-tion of dust number loading follows closely that of dust massloading (Fig. 4) with the highest number loading over thedesert regions. However, the spatial gradient of dust numberloading is smaller than that of dust mass loading due to thefaster removal rate of mass than that of number in general.
Although the dust mass loading errors in the BIN4,MOD3, and MOD3_tuned cases against BIN8 are quite di-verse spatially, all three cases overestimate the dust numberloading compared to BIN8. The maximum overestimationoccurs over the desert regions. BIN4 generally simulates upto 50 % more dust number loading over most regions exceptthe southern oceans where the relative difference can reach100 % but the dust number loading is quite low. The differ-ence in MOD3 and MOD3_tuned from BIN8 is tremendous.The dust number loading is 10 times larger over the desertregions and up to more than 100 times larger over the re-mote regions in MOD3 and MOD3_tuned than BIN8. Thereis no doubt that this large difference in dust number loadingwill significantly affect the ice cloud formation as previousstudies considered dust as an efficient aerosol species for INin the model. The impact of size representation on dust INeffect and hence dust indirect radiative effect deserves moredetailed studies in the future.
4.3 Impact of size representation on dust radiativeforcing
The difference in dust mass and number loading among thecases of BIN8, BIN4, MOD3, and MOD3_tuned results in
Atmos. Chem. Phys., 13, 10733–10753, 2013 www.atmos-chem-phys.net/13/10733/2013/

C. Zhao et al.: Uncertainty in modeling dust mass balance and radiative forcing 10745
59
1208
1209
1210
Figure 8 Spatial distributions of dust deposition fluxes due to dry removal, wet removal, 1211
and their sum from the WRF-Chem simulations in the case BIN8; (b) and (c) difference 1212
in the cases BIN4, MOD3, and MOD3_tuned from BIN8, in 2011. 1213
1214
1215
1216
1217
1218
Fig. 8.Spatial distributions of dust deposition fluxes due to dry removal, wet removal, and their sum from the WRF-Chem simulations in theBIN8 case; and difference in cases BIN4, MOD3, and MOD3_tuned from BIN8, in 2011.
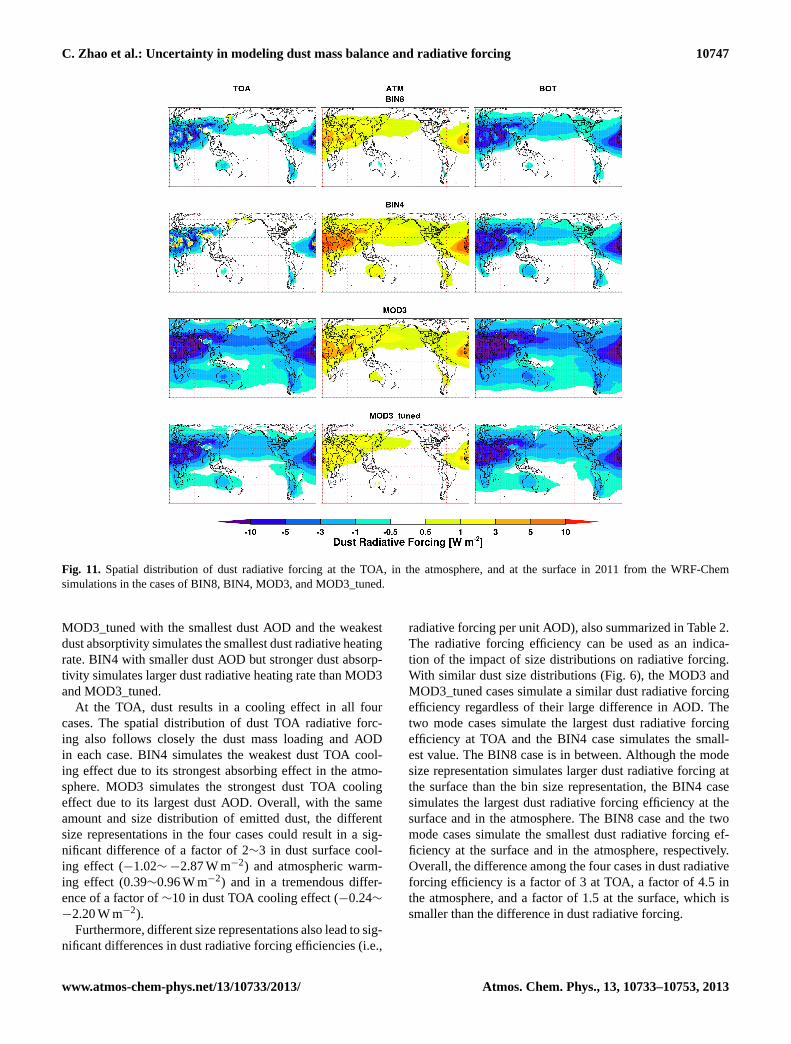
different dust radiative forcing. Figure 11 shows the spatialdistribution of dust radiative forcing at the top of atmosphere(TOA), in the atmosphere, and at the surface in 2011 from theWRF-Chem simulations in the cases of BIN8, BIN4, MOD3,and MOD3_tuned. The domain-averaged dust radiative forc-ing is summarized in Table 2. The spatial distributions of dustradiative forcing follow closely the dust mass loading in thefour cases. At the surface, dust reduces net radiative fluxesand results in cooling effect in all the four cases. The MOD3and MOD3_tuned cases simulate larger dust surface radiativeforcing than BIN8 and BIN4 due to their higher dust massloading and AOD. It is interesting to note that BIN4 simu-lates comparable dust mass loading and smaller dust AODat 550 nm but∼20 % larger dust surface cooling effect com-pared to BIN8. Further analysis shows that BIN4 simulateshigher dust AOD at wavelengths shorter than 550 nm (suchas 300 nm and 400 nm) than BIN8, which results in larger(more negative) dust surface radiative forcing. The differ-ence in dust AOD at different wavelengths between BIN8and BIN4 likely results from their different dust size distri-butions.
In the atmosphere, dust leads to a warming effect. It issurprising that BIN4 and MOD3_tuned simulate the high-est and smallest dust warming effect, respectively, amongthe four cases. This is different from the comparison in dustAOD among the four cases (Fig. 3 and Table 1), which showsthe largest and smallest dust AOD for MOD3 and BIN4, re-spectively. Figure 12 shows the longitude–height cross sec-tion of dust-induced radiative heating rate in 2011 from theWRF-Chem simulations in the cases of BIN8, BIN4, MOD3,and MOD3_tuned. Dust heats the atmosphere from the sur-face up to 12 km. The pattern of dust-induced radiative heat-ing profile follows the distribution of dust mass concentra-tion as shown in Fig. 5 in each case centering at the regionswithin ± 30◦ E. It shows consistent results that BIN4 sim-ulates the largest dust-induced radiative heating through theatmosphere up to 12 km among the four cases. The maximumdust-induced heating rate reaches 0.04 K day−1 below 4 kmin the BIN4 case.
To explore the reason why the dust heating rate doesnot monotonically vary with the dust AOD among the fourcases, the dust absorptivity should be examined, which can
www.atmos-chem-phys.net/13/10733/2013/ Atmos. Chem. Phys., 13, 10733–10753, 2013

10746 C. Zhao et al.: Uncertainty in modeling dust mass balance and radiative forcing
60
1219
1220
1221
Figure 9 Spatial distribution of dust atmospheric lifetime against total removal (dry+wet) 1222
in 2011 from the WRF-Chem simulations in the case of BIN8; and the difference in the 1223
cases of BIN4, MOD3, and MOD3_tuned from BIN8. 1224
1225
1226
Fig. 9.Spatial distribution of dust atmospheric lifetime against totalremoval (dry + wet) in 2011 from the WRF-Chem simulations in thecase of BIN8; and the difference in the cases of BIN4, MOD3, andMOD3_tuned from BIN8.
Table 2.Radiative forcing of dust in WRF-Chem experiments. Thevalues in parenthesis are radiative forcing efficiency (i.e., radiativeforcing per unit AOD).
BIN8 BIN4 MOD3 MOD3_tuned
TOA −0.56 (−14) −0.24 (−8) −2.20 (−23) −1.31 (−25)ATM 0.46 (12) 0.96 (32) 0.66 (7) 0.39 (7)BOT −1.02 (−26) −1.20 (−40) −2.87 (−31) −1.70 (−32)
be reflected in the dust single scattering albedo (SSA). Fig-ure 13 shows the vertical profiles of global mean dust SSAat 550 nm in 2011 from the WRF-Chem simulations in thecases of BIN8, BIN4, MOD3, and MOD3_tuned. It clearly
61
1227
1228
Figure 10 Spatial distribution of dust number loading in 2011 from the WRF-Chem 1229
simulation in the BIN8 case, and the difference in the cases of BIN4, MOD3, and 1230
MOD3_tuned from the BIN8 case. 1231
1232
1233
1234
Fig. 10. Spatial distribution of dust number loading in 2011 fromthe WRF-Chem simulation in the BIN8 case, and the difference inthe cases of BIN4, MOD3, and MOD3_tuned from the BIN8 case.
demonstrates that BIN4 simulates the smallest dust SSA(∼0.90 below 4 km) indicating the strongest dust absorp-tion among the four cases. BIN8 simulates a larger valueof dust SSA (∼0.93 below 4 km) indicating weaker dustabsorption. MOD3 and MOD3_tuned simulate very simi-lar and the largest dust SSA of 0.96 below 4 km indicat-ing the weakest dust absorption. In this study, dust opticalproperty (i.e., refractive index) is set the same for all fourcases. Therefore, the main factor determining dust absorptionis its size distribution (Tegen and Lacis, 1996). MOD3 andMOD3_tuned simulate similar dust absorptivity due to theirsimilar dust size distributions (Fig. 6). They also simulatethe weakest dust absorptivity due to their largest fractions offine particles. BIN4 with coarser resolution for the dust sizedistribution simulates stronger dust absorptivity than BIN8.
Atmos. Chem. Phys., 13, 10733–10753, 2013 www.atmos-chem-phys.net/13/10733/2013/
C. Zhao et al.: Uncertainty in modeling dust mass balance and radiative forcing 10747
62
1235
1236
Figure 11 Spatial distribution of dust radiative forcing at the TOA, in the atmosphere, 1237
and at the surface in 2011 from the WRF-Chem simulations in the cases of BIN8, BIN4, 1238
MOD3, and MOD3_tuned. 1239
1240
1241
1242
1243
1244
Fig. 11. Spatial distribution of dust radiative forcing at the TOA, in the atmosphere, and at the surface in 2011 from the WRF-Chemsimulations in the cases of BIN8, BIN4, MOD3, and MOD3_tuned.
MOD3_tuned with the smallest dust AOD and the weakestdust absorptivity simulates the smallest dust radiative heatingrate. BIN4 with smaller dust AOD but stronger dust absorp-tivity simulates larger dust radiative heating rate than MOD3and MOD3_tuned.
At the TOA, dust results in a cooling effect in all fourcases. The spatial distribution of dust TOA radiative forc-ing also follows closely the dust mass loading and AODin each case. BIN4 simulates the weakest dust TOA cool-ing effect due to its strongest absorbing effect in the atmo-sphere. MOD3 simulates the strongest dust TOA coolingeffect due to its largest dust AOD. Overall, with the sameamount and size distribution of emitted dust, the differentsize representations in the four cases could result in a sig-nificant difference of a factor of 2∼3 in dust surface cool-ing effect (−1.02∼ −2.87 W m−2) and atmospheric warm-ing effect (0.39∼0.96 W m−2) and in a tremendous differ-ence of a factor of∼10 in dust TOA cooling effect (−0.24∼−2.20 W m−2).
Furthermore, different size representations also lead to sig-nificant differences in dust radiative forcing efficiencies (i.e.,
radiative forcing per unit AOD), also summarized in Table 2.The radiative forcing efficiency can be used as an indica-tion of the impact of size distributions on radiative forcing.With similar dust size distributions (Fig. 6), the MOD3 andMOD3_tuned cases simulate a similar dust radiative forcingefficiency regardless of their large difference in AOD. Thetwo mode cases simulate the largest dust radiative forcingefficiency at TOA and the BIN4 case simulates the small-est value. The BIN8 case is in between. Although the modesize representation simulates larger dust radiative forcing atthe surface than the bin size representation, the BIN4 casesimulates the largest dust radiative forcing efficiency at thesurface and in the atmosphere. The BIN8 case and the twomode cases simulate the smallest dust radiative forcing ef-ficiency at the surface and in the atmosphere, respectively.Overall, the difference among the four cases in dust radiativeforcing efficiency is a factor of 3 at TOA, a factor of 4.5 inthe atmosphere, and a factor of 1.5 at the surface, which issmaller than the difference in dust radiative forcing.
www.atmos-chem-phys.net/13/10733/2013/ Atmos. Chem. Phys., 13, 10733–10753, 2013

10748 C. Zhao et al.: Uncertainty in modeling dust mass balance and radiative forcing
63
1245
1246
1247
1248
Figure 12 Cross-section of dust-induced radiative heating rate in 2011 from the WRF-1249
Chem simulations in the case BIN8, BIN4, MOD3, and MOD3_tuned. 1250
1251
1252
Fig. 12. Cross section of dust-induced radiative heating rate in2011 from the WRF-Chem simulations in the cases of BIN8, BIN4,MOD3, and MOD3_tuned.
64
1253
1254
1255
1256
1257
1258
Figure 13 Profiles of dust SSA at 550 nm in 2011 from the WRF-Chem simulations in 1259
the cases of BIN8, BIN4, MOD3, and MOD3_tuned. 1260
1261
1262
Fig. 13.Profiles of global mean dust SSA at 550 nm in 2011 fromthe WRF-Chem simulations in the cases of BIN8, BIN4, MOD3,and MOD3_tuned.
5 Summary and conclusion
Using the framework of WRF-Chem with three differentaerosol size representations (i.e., MOD3 with 3-mode, BIN4with 4-bin, and BIN8 with 8-bin), but the same parameteri-
zations for the fundamental processes of dust emission andremoval, this study examines the uncertainties rooting fromsize representations in simulating dust mass balance and ra-diative forcing quasi-globally (180◦ W–180◦ E and 60◦ S–70◦ N). The WRF-Chem simulation in the BIN8 case is takenas a benchmark for error analysis, since the 8-bin approachcan better resolve the dust size distribution (Zhao et al.,2010). The difference between the results from the BIN8 caseand the BIN4 or MOD3 cases are analyzed as the errors in 3-mode or 4-bin size representations that are widely used inglobal climate models due to their computational efficiency.One additional case (MOD3_tuned with 3-mode) is also con-ducted with half of the total dust emission of the former threecases to identify the error in a 3-mode size representationwhen AOD observations are used to constrain dust emissionover the dust source region.
The cases of BIN8, BIN4, MOD3, and MOD3_tunedsimulate different size distributions of dust in the atmo-sphere. The biases of the 4-bin (BIN4) and 3-mode (MOD3and MOD3_tuned) approaches against the 8-bin approach(BIN8) in simulating dust size distributions result from theirrelatively inaccurate size representations. The size distribu-tion with the 4-bin approach (BIN4) follows that of the 8-binapproach (BIN8) but has coarser size resolution. This resultsin fewer fine dust particles in the 4-bin approach than the 8-bin approach, as reflected by the difference in the ratios ofPM2.5-Dust / PM10-Dust between these two approaches. The3-mode approach (MOD3 and MOD3_tuned) retains morefine dust particles but fewer coarse dust particles comparedto the 8-bin approach. The prescribedσg (i.e., with a con-stant value) is the main contributor to the bias of the 3-modeapproach in representing dust size distribution (Zhao et al.,2010). This result is consistent with Mann et al. (2012), whofound that the modal approach simulates lower number con-centrations for larger aerosol particles than the bin approach.In addition, they also found that the result from the modal ap-proach is sensitive to the fixedσg. The difference in dust sizedistributions significantly impacts the dust lifetime amongthe four cases. BIN8 simulates a domain-averaged dust life-time of ∼3.2 days with a shorter lifetime (∼1 day) near thedust source regions and a longer lifetime (>10 days) over theremote oceans. The dust lifetime in BIN4 is less than 1 daylonger than BIN8 globally. The MOD3 and MOD3_tunedcases simulate relatively small differences in dust lifetime(∼1 day longer) relative to BIN8 near the dust source re-gions, but the difference increases significantly to 3 days (upto 10 days) longer lifetime over the remote regions. How-ever, it is noteworthy that the difference in domain-averageddust lifetime is relatively small among the four cases, i.e.,∼3.2 days in BIN8 and BIN4 and∼3.5 days in MOD3and MOD3_tuned, indicating that the global dust lifetime ismainly determined by the dust lifetime near dust source re-gions.
With the same emission but different size representationsand thus different size distributions and lifetimes of dust
Atmos. Chem. Phys., 13, 10733–10753, 2013 www.atmos-chem-phys.net/13/10733/2013/
C. Zhao et al.: Uncertainty in modeling dust mass balance and radiative forcing 10749
in the atmosphere, BIN8 simulates a dust mass loading of39 Tg, while BIN4 and MOD3 simulate 3 % (40.2 Tg) and25 % (49.1 Tg) higher dust mass loading, respectively, in-dicating an uncertainty of dust mass loading of up to 25 %due to the three size representations. Over the dust source re-gions, although the absolute difference between BIN8 andBIN4 or MOD3 is large, the relative errors in BIN4 andMOD3 compared to BIN8 are within+10 %. The relative er-rors increase with height and the distance downwind of dustsource regions and reach 100 % in MOD3 over the remote re-gions up to 4 km above the surface. On the contrary, the rela-tive error in MOD3_tuned against BIN8 is large (up to 50 %negative bias) over the dust source region and decreases to< 10 % negative bias or even positive bias over the remote re-gions. The different dust mass loading and size distributionsamong the four cases also result in significantly different dryand wet deposition fluxes and dust number concentrations.The dust number loading simulated by the 4-bin (BIN4) and3-mode approaches (MOD3 and MOD3_tuned) are up to afactor of 2 and 100 of BIN8, respectively.
The difference in dust AOD among the three cases is up toa factor of 3, much larger than their difference in dust massloading. It is noteworthy that BIN4 simulates 3 % higher dustmass loading but 25 % lower dust AOD than BIN8. Withhalf the dust emission, MOD3_tuned simulates 30 % lowerdust mass loading but 35 % higher dust AOD than BIN8.The difference in dust AOD results in different dust radia-tive forcing among the four cases. The dust-induced surfacecooling and atmospheric warming have a difference of abouta factor of 3 among the four cases. The difference in dust-induced atmospheric warming among the four cases resultsfrom their difference in dust AOD and dust absorptivity. The4-bin approach (BIN4) with coarser size resolution simulatesstronger dust absorptivity than the 8-bin approach (BIN8),while the 3-mode approach (MOD3 and MOD3_tuned) sim-ulates weaker dust absorptivity. At the TOA, dust results incooling effect in all the four cases with an uncertainty of afactor of 10. The radiative forcing efficiency is also analyzedto reflect the impact of size distributions on radiative forc-ing. With the similar dust size distributions, the two modecases simulate similar dust radiative forcing efficiencies re-gardless of their large difference in AOD. It is noteworthythat the difference resulted from the size representations indust radiative forcing efficiency is smaller than that in dustradiative forcing.
In this study, the total global dust emission (for dust parti-cles with diameter < 10 µm) estimated based on the top-downmethod (i.e., using satellite retrievals to constrain model sim-ulated dust AOD over the source regions, which is commonlyused by the modeling community) with the 8-bin size repre-sentation is 4600 Tg yr−1. This value is near the higher endof the range reported by Huneeus et al. (2011). However,the estimate of total dust emission can be reduced by 50 %to 2400 Tg yr−1 if the top-down method is applied using amodel with 3-mode size representation. This indicates an un-
certainty of a factor of 2 in dust emission derived by the top-down method solely due to the size representations in models(3-mode versus 8-bin here). Comparison between BIN4 withBIN8 indicates that models with four dust size bins may sim-ulate dust mass loading and AOD reasonably well but havepositive bias in both dust number loading and absorptivity.A sub-bin size distribution is needed to appropriately calcu-late dust optical properties and number concentration using4-size bin representation. The 3-mode representation has bi-ases in mass, number, and optical properties. Models withthree dust size modes have relatively large biases in simulat-ing dust mass loading and radiative forcing, even with con-strained AOD by observations. A three-moment aerosol sizeparameterization (i.e., predicting aerosol mass, number, andsurface area and thusσg) may be needed for the mode ap-proach to appropriately represent dust size distributions inthe atmosphere (Binkowski and Roselle, 2003). This studyfound a difference of 25 % in dust mass loading between thesimulations using modal and sectional size representations,which is consistent with what Mann et al. (2012) found forother aerosols. However, the difference in dust radiative forc-ing (up to a factor of 10) is much larger, indicating aerosolsize representation may have much larger impact on model-ing aerosol radiative forcing than aerosol mass.
In order to better capture the realistic meteorology and alsominimize the feedback of dust impact on meteorology, thesimulated winds are nudged towards the reanalysis data sothat our analysis can focus on the impact of size representa-tions on dust mass loading and radiative forcing in this study.However, uncertainties in simulating dust impact on climateand oceanic ecosystems due to size representations need tobe quantified, because of the significant difference in dustdirect radiative forcing, dust number loading (implying dustindirect radiative effect), and dust deposition fluxes amongthe simulations with different size representations. This studywith quasi-global configuration also cannot assess the sizeimpact on dust radiative effect over the polar regions, whichmay be of interest due to the potential role of dust in polaramplification of global warming (Lambert et al., 2013). Inaddition, the impact of size representation on the long-rangetransport of dust may also be worthy of further investigationdue to the recently raised concern about the impact of long-range transported dust (e.g., Asian dust and Saharan dust) onthe air quality and regional hydrological cycle of the westernUS (Yu et al., 2012; Creamean et al., 2013). The uncertain-ties identified in this study depend to some degree on the sizedistribution of emitted dust and theσg. The results may alsobe somewhat sensitive to how processes such as dry and wetdeposition are parameterized in the model. To fully explorethe uncertainties in dust mass balance and radiative forcingsimulated by different models, a systematic comparison ofmultiple sources of uncertainties and their interactions in amulti-model framework would be beneficial.
www.atmos-chem-phys.net/13/10733/2013/ Atmos. Chem. Phys., 13, 10733–10753, 2013
10750 C. Zhao et al.: Uncertainty in modeling dust mass balance and radiative forcing
Acknowledgements.This research was supported by the Officeof Science of the US Department of Energy (DOE) as part of theRegional & Global Climate Modeling (RGCM) program. Thisstudy used computing resources from the National Energy Re-search Scientific Computing Center, which is supported by the USDepartment of Energy Office of Science under Contract No. DE-AC02-05CH11231 and the PNNL Institutional Computing. PacificNorthwest National Laboratory is operated by Battelle MemorialInstitute for the DOE under contract DE-AC05-76RL01830. JasperKok was partly supported by the National Science Foundationunder Award AGS 1137716. We thank Nicole Riemer for theeditorial help. Insightful comments offered by the two anonymousreferees are highly appreciated. The authors thank Jiwen Fan forproviding an internal review.
Edited by: N. Riemer
References
Ackermann, I. J., Hass, H., Memmesheimer, M., Ebel, A.,Binkowski, F. S., and Shankar, U.: Modal aerosol dynamicsmodel for Europe: Development and first applications, Atmos.Environ., 32, 2981–2999, 1998.
Balkanski, Y., Schulz, M., Claquin, T., and Guibert, S.: Reevalua-tion of Mineral aerosol radiative forcings suggests a better agree-ment with satellite and AERONET data, Atmos. Chem. Phys., 7,81–95, doi:10.5194/acp-7-81-2007, 2007.
Barnard, J. C., Fast, J. D., Paredes-Miranda, G., Arnott, W. P.,and Laskin, A.: Technical Note: Evaluation of the WRF-Chem“Aerosol Chemical to Aerosol Optical Properties” Module usingdata from the MILAGRO campaign, Atmos. Chem. Phys., 10,7325–7340, doi:10.5194/acp-10-7325-2010, 2010.
Bey, I., Jacob, D. J., Yantosca, R. M., Logan, J. A., Field, B. D.,Fiore, A. M., Li, Q., Liu, H., Mickley, L. J., and Schultz, M. G.:Global modeling of tropospheric chemistry with assimilated me-teorology: Model description and evaluation, J. Geophys. Res.,106, 23073–23096, 2001.
Bian, H. S. and Zender, C. S.: Mineral dust and globaltro- pospheric chemistry: Relative roles of photolysis andhetero- geneous uptake, J. Geophys. Res.-Atmos., 108, 4672,doi:10.1029/2002JD003143, 2003.
Binkowski, F. S. and Shankar, U.: The Regional Particulate MatterModel: 1. Model Description and Preliminary Results, J. Geo-phys. Res., 100, 26191–26209, 1995.
Binkowski, F. S. and Shankar, U.: Models-3 CommunityMultiscale Air Quality (CMAQ) model aerosol compo-nent: 1. Model description, J. Geophys. Res., 108, 4183,doi:10.1029/2001JD001409, 2003.
Chadwick, O. A., Derry, L. A., Vitousek, P. M., Huebert, B. J.,and Hedin, L. O.: Changing sources of nutrients during fourmillion years of ecosystem development, Nature, 397, 491–497,doi:10.1038/17276, 1999.
Chen, S., Huang, J., Zhao C.„ Qian, Y., Leung, L. R., and Yang,B.: Modeling the Transport and Radiative Forcing of TaklimakanDust over the Tibetan Plateau in Summer, J. Geophys. Res., 118,797–812, doi:10.1002/jgrd.50122, 2013.
Chen, Y. S., Sheen, P. C., Chen, E. R., Liu, Y. K., Wu, T.N., and Yang, C. Y.: Effects of Asian dust storm events on
daily mortality in Taipei, Taiwan, Environ. Res., 95, 151–155,doi:10.1016/j.envres.2003.08.008, 2004.
Chapman, E. G., Gustafson Jr., W. I., Easter, R. C., Barnard, J. C.,Ghan, S. J., Pekour, M. S., and Fast, J. D.: Coupling aerosol-cloud-radiative processes in the WRF-Chem model: Investigat-ing the radiative impact of elevated point sources, Atmos. Chem.Phys., 9, 945–964, doi:10.5194/acp-9-945-2009, 2009.
Creamean, J. M., Suski, K. J., Rosenfeld, D., Cazorla, A., De-Mott, P. J., Sullivan, R. C., White, A. B., Ralph, F. M., Min-nis, P., Comstock, J. M., Tomlinson, J. M., and Prather, K. A.:Dust and Biological Aerosols from the Sahara and Asia Influ-ence Precipitation in the Western U.S., Science, 339, 1572–1578,doi:10.1126/science.1227279, 2013.
Darmenova, K., Sokolik, I. N., Shao, Y., Marticorena, B., andBergametti, G.: Development of a physically based dust emissionmodule within the Weather Research and Forecasting (WRF)model: Assessment of dust emission parameterizations and inputparameters for source regions in Central and East Asia, J. Geo-phys. Res., 114, D14201, doi:10.1029/2008JD011236, 2009.
DeMott, P. J., Prenni, A., Liu, X., Kreidenweis, S. M., Petters,M. D., Twohy, C. H., Richardson, M. S., Eidhammer, T., andRogers, D. C.: Predicting global atmospheric ice nuclei distribu-tions and their impacts on climate, Proc. Natl. Acad. Sci. USA,107, 11217–11222, doi:10.1073/pnas.0910818107, 2010.
Dentener, F., Kinne, S., Bond, T., Boucher, O., Cofala, J., Generoso,S., Ginoux, P., Gong, S., Hoelzemann, J. J., Ito, A., Marelli, L.,Penner, J. E., Putaud, J.-P., Textor, C., Schulz, M., van der Werf,G. R., and Wilson, J.: Emissions of primary aerosol and precur-sor gases in the years 2000 and 1750 prescribed data-sets for Ae-roCom, Atmos. Chem. Phys., 6, 4321–4344, doi:10.5194/acp-6-4321-2006, 2006.
Diner, D. J., Beckert, J., Reilly, T., Bruegge, C., Conel, J., Kahn,R., Martonchik, J., Ackerman, T., Davies, R., Gerstl, S., Gordon,H., Muller, J., Myneni, R., Sellers, P.J., Pinty, B., and Verstraete,M.: Multi-angle Imaging SpectroRadiometer (MISR) instrumentdescription and experiment overview, IEEE T., Geosci. Remote,36, 1072–1087, 1998.
Diner, D. J., Abdou, W. A., Bruegge, C. J., Conel, J. E., Crean, K.A., Gaitley, B. J., Helmlinger, M. C., Kahn, R. A., Martonchik, J.V., and Pilorz, S. H.: MISR aerosol optical depth retrievals oversouthern Africa during the SAFARI-2000 dry season campaign,Geophys. Res. Lett., 28, 3127–3130, 2001.
Easter, R. C., Ghan, S. J., Zhang, Y., Saylor, R. D., Chapman, E.G., Laulainen, N. S., Abdul-Razzak, H., Leung, L. R., Bian, X.,and Zaveri, R. A.: MIRAGE: Model Description and Evaluationof Aerosols and Trace Gases. J. Geophys. Res., 109, D20210,doi:10.1029/2004JD004571, 2004.
Fast, J. D, Gustafson Jr., W. I., Easter, R. C., Zaveri, R. A., Barnard,J. C., Chapman, E. G., and. Grell, G. A.: Evolution of ozone,particulates, and aerosol direct forcing in an urban area using anew fully-coupled meteorology, chemistry, and aerosol model, J.Geophys. Res., 111, D21305, doi:10.1029/2005JD006721, 2006.
Forster, P., Ramaswamy, V., Artaxo, P., Berntsen, T., Betts, R., Fa-hey, D. W., Haywood, J., Lean, J., Lowe, D. C., Myhre, G.,Nganga, J., Prinn, R., Raga, G., Schulz, M., and Van Dorland, R.:Radiative Forcing of Climate Change, in Climate Change 2007:The Physical Science Basis. Contribution of Working Group I tothe Fourth Assessment Report of the Intergovernmental Panel onClimate Change, edited by: Solomon, S., Qin, D., Manning, M.,
Atmos. Chem. Phys., 13, 10733–10753, 2013 www.atmos-chem-phys.net/13/10733/2013/

C. Zhao et al.: Uncertainty in modeling dust mass balance and radiative forcing 10751
Chen, Z., Marquis, M., Averyt, K. B., Tignor, M., and Miller, H.L., 129–234, Cambridge Univ. Press, Cambridge, UK and NewYork, NY, USA, 2007.
Ginoux, P., Chin, M., Tegen, I., Prospero, J. M., Holben, B.,Dubovik, O., and Lin, S.: Sources and distributions of dustaerosols simulated with the GOCART model, J. Geophys. Res.,106, 20225–20273, 2001.
Gläser, G., Kerkweg, A., and Wernli, H.: The Mineral Dust Cy-cle in EMAC 2.40: sensitivity to the spectral resolution and thedust emission scheme, Atmos. Chem. Phys., 12, 1611–1627,doi:10.5194/acp-12-1611-2012, 2012.
Gong, S. L.: A parameterization of sea-salt aerosol source functionfor sub- and super-micron particles, Global Biogeochem. Cy., 17,1097, doi:10.1029/2003GB002079, 2003.
Grell, G. A., Peckham, S. E., Schmitz, R., and McKeen, S. A.,Frost, G., Skamarock, W. C., and Eder, B.: Fully coupled “on-line” chemistry within the WRF model, Atmos. Environ., 39,6957–6976, 2005.
Gustafson, W. I., Chapman, E. G., Ghan, S. J., Easter, R. C.,and Fast, J. D.: Impact on modeled cloud characteristics dueto simplified treatment of uniform cloud condensation nu-clei during NEAQS 2004, Geophys. Res. Lett., 34, L19809,doi:10.1029/2007GL030021, 2007.
Herzog, M., Weisenstein, D. K., and Penner, J. E.: A dy-namic aerosol module for global chemical transport mod-els: Model description, J. Geophys. Res., 109, D18202,doi:10.1029/2003JD004405, 2004.
Hsu, N. C., Tsay, S., King, M., and Herman, J. R.: Deepblue retrievals of Asian Aerosol Properties during ACE-Asia, IEEE Trans. Geosci. Remote Sens., 44, 3180,doi:10.1109/TGRS.2006.879540, 2006.
Huang, J., Minnis, P., Yi, Y., Tang, Q., Wang, X., Hu, Y., Liu, Z.,Ayers, K., Trepte, C., and Winker, D.: Summer dust aerosols de-tected from CALIPSO over the Tibetan Plateau, Geophys. Res.Lett., 34, L18805, doi:10.1029/2007GL029938, 2007.
Huneeus, N., Schulz, M., Balkanski, Y., Griesfeller, J., Prospero,J., Kinne, S., Bauer, S., Boucher, O., Chin, M., Dentener, F.,Diehl, T., Easter, R., Fillmore, D., Ghan, S., Ginoux, P., Grini,A., Horowitz, L., Koch, D., Krol, M. C., Landing, W., Liu, X.,Mahowald, N., Miller, R., Morcrette, J.-J., Myhre, G., Penner,J., Perlwitz, J., Stier, P., Takemura, T., and Zender, C. S.: Globaldust model intercomparison in AeroCom phase I, Atmos. Chem.Phys., 11, 7781–7816, doi:10.5194/acp-11-7781-2011, 2011.
Iacono, M. J., Mlawer, E. J., Clough, S. A., and Morcrette, J.-J.:Impact of an improved longwave radiation model, RRTM. onthe energy budget and thermodynamic properties of the NCARcommunity climate mode, CCM3. J. Geophys. Res., 105, 14873–14890, 2000.
Jaeglé, L., Quinn, P. K., Bates, T. S., Alexander, B., and Lin, J.-T.:Global distribution of sea salt aerosols: new constraints from insitu and remote sensing observations, Atmos. Chem. Phys., 11,3137–3157, doi:10.5194/acp-11-3137-2011, 2011.
Kain, J. S.: The Kain–Fritsch Convective Parameterization: An Up-date, J. Appl. Meteor., 43, 170–181, 2004.
Kain, J. S. and Fritsch, J. M.: A One-Dimensional Entrain-ing/Detraining Plume Model and Its Application in ConvectiveParameterization, J. Atmos. Sci., 47, 2784–2802, 1990.
Kalenderski, S., Stenchikov, G., and Zhao, C.: Modeling a typicalwinter-time dust event over the Arabian Peninsula and the Red
Sea, Atmos. Chem. Phys., 13, 1999–2014, doi:10.5194/acp-13-1999-2013, 2013.
Kaufman, Y. J., Tanré, D., Remer, L. A., Vermote, E. F., Chu, A.,and Holben, B. N.: Operational remote sensing of troposphericaerosol over land from EOS moderate resolution imaging spec-troradiometer, J. Geophys. Res., 102, 17051–17067, 1997.
Kim, D., Chin, M., Bian, H., Tan, Q., Brown, M. E., Zheng,T., You, R., Diehl, T., Ginoux, P., and Kucsera, T.: The ef-fect of the dynamic surface bareness on dust source func-tion, emission, and distribution, J. Geophys. Res., 118, 1–16,doi:10.1029/2012JD017907, 2013.
Kim, K. W., Kim, Y. J., and Oh, S. J.: Visibility impairment duringYellow Sand periods in the urban atmosphere of Kwangju, Korea,Atmos. Environ., 35, 5157–5167, 2001.
Kok, J. F.: A scaling theory for the size distribution of emitted dustaerosols suggests climate models underestimate the size of theglobal dust cycle, Proc. Natl. Acad. Sci., 108, 1016–1021, 2011.
Kokkola, H., Hommel, R., Kazil, J., Niemeier, U., Partanen, A.-I.,Feichter, J., and Timmreck, C.: Aerosol microphysics modules inthe framework of the ECHAM5 climate model – intercomparisonunder stratospheric conditions, Geosci. Model Dev., 2, 97–112,doi:10.5194/gmd-2-97-2009, 2009.
Lambert, F., Kug, J.-S., Park, P. J., Mahowald, N., Winckler, G.,Abe-Ouchi, A., Oishi, R., Takemura, T., and Lee, J.-H.: The roleof mineral-dust aerosols in polar temperature amplification, Na-ture Clim. Change, 3, 487–491, 2013.
Lau, K. M., Kim, K. M., Sud, Y. C., and Walker, G. K.: AGCM study of the response of the atmospheric water cycle ofWest Africa and the Atlantic to Saharan dust radiative forcing,Ann. Geophys., 27, 4023–4037, doi:10.5194/angeo-27-4023-2009, 2009.
Liao, H., Adams, P. J., Chung, S. H., Seinfeld, J. H., Mickley, L.J., and Jacob, D. J.: Interactions between tropospheric chemistryand aerosols in a unified general circulation model, J. Geophys.Res.-Atmos., 108, 4001, doi:10.1029/2001JD001260, 2003.
Liu, H., Jacob, D. J., Bey, I., and Yantosca, R. M.: Constraintsfrom 210Pb and7Be on wet deposition and transporting aglobal threee-dimensional chemical tracer model driven by as-similated meteorological fields, J. Geophys. Res., 106, 12109–12128, 2001.
Liu, X. and Penner, J. E.: Ice nucleation parameterization for globalmodels. Meteor. Z., 14, 499–514, 2005.
Mann, G. W., Carslaw, K. S., Ridley, D. A., Spracklen, D. V.,Pringle, K. J., Merikanto, J., Korhonen, H., Schwarz, J. P., Lee,L. A., Manktelow, P. T., Woodhouse, M. T., Schmidt, A., Brei-der, T. J., Emmerson, K. M., Reddington, C. L., Chipperfield, M.P., and Pickering, S. J.: Intercomparison of modal and sectionalaerosol microphysics representations within the same 3-D globalchemical transport model, Atmos. Chem. Phys., 12, 4449–4476,doi:10.5194/acp-12-4449-2012, 2012.
Mahowald, N. M., Engelstaedter, S., Luo, C., Sealy, A., Artaxo, P.,Benitez-Nelson, C., Bonnet, S., Chen, Y., Chuang, P. Y., Cohen,D. D., Dulac, F., Herut, B., Johansen, A. M., Kubilay, N., Losno,R., Maenhaut, W., Paytan, A., Prospero, J. A., Shank, L. M., andSiefert, R. L.: Atmospheric Iron Deposition: Global Distribution,Variability, and Human Perturbations, Ann. Rev. Mar. Sci., 1,245–278, 2009.
www.atmos-chem-phys.net/13/10733/2013/ Atmos. Chem. Phys., 13, 10733–10753, 2013

10752 C. Zhao et al.: Uncertainty in modeling dust mass balance and radiative forcing
Marticorena, B. and Bergametti, G.: Modeling the atmospheric dustcycle: 1. Design of a soil-derived dust emission scheme, J. Geo-phys. Res., 100, 16415–16430, 1995.
Martonchik, J. V., Diner, D. J., Kahn, R., and Gaitley,B.: Comparison of MISR and AERONET aerosol opticaldepths over desert sites, Geophys. Res. Lett., 31, L16102,doi:10.1029/2004GL019807, 2004.
McConnell, C. L., Formenti, P., Highwood, E. J., and Harrison,M. A. J.: Using aircraft measurements to determine the re-fractive index of Saharan dust during the DODO experiments,Atmos. Chem. Phys., 10, 3081–3098, doi:10.5194/acp-8-3081-2010, 2010.
McKeen S. A., Wotawa G., Parrish D. D., Holloway J. S., Buhr M.P., Hubler G., Fehsenfeld F. C., and Meagher J. F.: Ozone pro-duction from Canadian wildfires during June and July of 1995, J.Geophys. Res., 107, 4192, doi:10.1029/2001JD000697, 2002.
Mian Chin, Diehl, T., Dubovik, O., Eck, T. F., Holben, B. N.,Sinyuk, A., and Streets, D. G.: Light absorption by pollution,dust, and biomass burning aerosols: a global model study andevaluation with AERONET measurements, Ann. Geophys., 27,3439–3464, doi:10.5194/angeo-27-3439-2009, 2009.
Mlawer, E. J., Taubman, S. J., Brown, P. D., Iacono, M. J., andClough, S. A.: RRTM, a validated correlated-k model for thelongwave, J. Geophys. Res., 102, 16663–16682, 1997.
Painter, T. H., Deems, J. S., Belnap, J., Hamlet, A. F., Landry, C.C., and Udall, B.: Response of Colorado River runoff to dustradiative forcing in snow, P. Natl. Acad. Sci. USA, 107, 17125–17130, 2010.
Phillips, V. T. J., DeMott, P. J., and Andronache, C.: An empiri-cal parameterization of heterogeneous ice nucleation for multi-ple chemical species of aerosol, J. Atmos. Sci., 65, 2757–2783,2008.
Qian, Y., Flanner, M. G., Leung, L. Y. R., and Wang, W.: Sensi-tivity studies on the impacts of Tibetan Plateau snowpack pol-lution on the Asian hydrological cycle and monsoon climate,Atmos. Chem. Phys., 11, 1929–1948, doi:10.5194/acp-11-1929-2011, 2011.
Schell, B., Ackermann, I. J., Hass, H., Binkowski, F. S., and Ebel,A.: Modeling the formation of secondary organic aerosol withina comprehensive air quality modeling system, J. Geophys. Res.,106, 28275–28293, 2001.
Shao, Y.: A model for mineral dust emission, J. Geophys. Res., 106,20239–20254, 2001.
Shao, Y., Fink, A. H., and Klose, M.: Numerical simulation ofa continental-scale Saharan dust event, J. Geophys. Res., 115,D13205, doi:10.1029/2009JD012678, 2010.
Skamarock, W. C., Klemp, J. B., Dudhia, J., Gill, D. O., Barker,D. M., Duda, M. G., Huang, X., Wang, W., and Powers, J. G.:A description of the advanced research WRF version 3, NCARTech. Note, NCAR/TN-475+STR, 8 pp., Natl. available at:http://www.mmm.ucar.edu/wrf/users/docs/arw_v3.pdf, Cent. for At-mos. Res., Boulder, CO, USA, 2008.
Sokolik, I. N., Winker, D. M., Bergametti, G., Gillette, D. A.,Carmichael, G., Kaufman, Y. J., Gomes, L., Schuetz, L., and Pen-ner, J. E.: Introduction to special section: Outstanding problemsin quantifying the radiative impacts of mineral dust, J. Geophys.Res.-Atmos., 106, 18015–18027, 2001.
Solomos, S., Kallos, G., Kushta, J., Astitha, M., Tremback, C.,Nenes, A., and Levin, Z.: An integrated modeling study on the
effects of mineral dust and sea salt particles on clouds and pre-cipitation, Atmos. Chem. Phys., 11, 873–892, doi:10.5194/acp-11-873-2011, 2011.
Stauffer, D. R. and Seaman, N. L.: Use of four-dimensional data as-similation in a limited-area mesoscale model, Part I: Experimentswith synoptic-scale data, Mon. Weather Rev., 118, 1250–1277,1990.
Stockwell, W. R., Middleton, P., Chang, J. S., and Tang, X.: The sec-ond generation regional acid deposition model chemical mech-anism for regional air quality modeling, J. Geophys. Res., 95,16343–16367, 1990.
Tegen, I. and Fung, I.: Modeling of mineral dust in the atmosphere:Sources, transport, and optical thickness, J. Geophys. Res., 99,22897–22914, 1994.
Tegen, I. and Lacis, A. A.: Modeling of particle size distribution andits influence on the radiative properties of mineral dust aerosol.J. Geophys. Res., 101, 19237–19244, doi:10.1029/95JD03610,1996.
Tegen, I., Harrison, S. P., Kohfeld, K., Prentice, I. C., Coe, M., andHeimann, M.: Impact of vegetation and preferential source areason global dust aerosol: Results from a model study, J. Geophys.Res.-Atmos., 107, 4576, doi:10.1029/2001JD000963, 2002.
Textor, C., Schulz, M., Guibert, S., Kinne, S., Balkanski, Y., Bauer,S., Berntsen, T., Berglen, T., Boucher, O., Chin, M., Dentener,F., Diehl, T., Easter, R., Feichter, H., Fillmore, D., Ghan, S., Gi-noux, P., Gong, S., Grini, A., Hendricks, J., Horowitz, L., Huang,P., Isaksen, I., Iversen, I., Kloster, S., Koch, D., Kirkevåg, A.,Kristjansson, J. E., Krol, M., Lauer, A., Lamarque, J. F., Liu,X., Montanaro, V., Myhre, G., Penner, J., Pitari, G., Reddy, S.,Seland, Ø., Stier, P., Takemura, T., and Tie, X.: Analysis andquantification of the diversities of aerosol life cycles within Ae-roCom, Atmos. Chem. Phys., 6, 1777–1813, doi:10.5194/acp-6-1777-2006, 2006.
Thomson, M. C., Molesworth, A. M., Djingarey, M. H., Yameogo,K. R., Belanger, F., and Cuevas, L. E.: Potential of environmentalmodels to predict meningitis epidemics in Africa, Trop. Med. Int.Health, 11, 781–788, 2006.
Van derWerf, G. R., Randerson, J. T., Giglio, L., Collatz, G. J.,Mu, M., Kasibhatla, P. S., Morton, D. C., DeFries, R. S., Jin,Y., and van Leeuwen, T. T.: Global fire emissions and the con-tribution of deforestation, savanna, forest, agricultural, and peatfires (1997–2009). Atmos. Chem. Phys., 10, 11707–11735, 10,doi:10.5194/acp-10-11707-2010, 2010.
Woodward, S.: Modeling the atmospheric life-cycle and radiativeimpact of mineral dust in the Hadley Centre climate model, J.Geophys. Res., 106, 18155–18166, 2001.
Yu, H., Remer, L. A., Chin, M., Bian, H., Tan, Q., Yuan,T., and Zhang, Y.: Aerosols from Overseas Rival Domes-tic Emissions over North America. Science, 337, 566–569,doi:10.1126/science.1217576, 2012.
Zaveri, R. A. and Peters, L. K.: A new lumped structure photochem-ical mechanism for large-scale applications, J. Geophys. Res.,104, 30387–30415, 1999.
Zaveri, R. A., Easter, R. C., Fast, J. D., and Peters, L. K.: Modelfor simulating aerosol interactions and chemistry (MOSAIC), J.Geophys. Res., 113, D13204, doi:10.1029/2007JD008792, 2008.
Zender, C. S., Bian, H., and Newman, D.: Mineral DustEntrainment and Deposition (DEAD) model: Description
Atmos. Chem. Phys., 13, 10733–10753, 2013 www.atmos-chem-phys.net/13/10733/2013/

C. Zhao et al.: Uncertainty in modeling dust mass balance and radiative forcing 10753
and 1990s dust climatology, J. Geophys. Res., 108, 4416,doi:10.1029/2002JD002775, 2003.
Zhang, Y., Seigneur, C., Seinfeld, J. H., and Jacobson, M. Z.: Sim-ulation of aerosol dynamics: a comparative review of algorithmsused in air quality models, Aerosol Sci. Technol., 31, 487–514,1999.
Zhang, Q., Streets, D. G., Carmichael, G. R., He, K. B., Huo, H.,Kannari, A., Klimont, Z., Park, I. S., Reddy, S., Fu, J. S., Chen,D., Duan, L., Lei, Y., Wang, L. T., and Yao, Z. L.: Asian emis-sions in 2006 for the NASA INTEX-B mission, Atmos. Chem.Phys., 9, 5131–5153, doi:10.5194/acp-9-5131-2009, 2009.
Zhao, C., Wang, Y., Choi, Y., and Zeng, T.: Summertime impact ofconvective transport and lightning NOx production over NorthAmerica: modeling dependence on meteorological simulations,Atmos. Chem. Phys., 9, 4315–4327, doi:10.5194/acp-9-4315-2009, 2009.
Zhao, C., Liu, X., Leung, L. R., Johnson, B., McFarlane, S. A.,Gustafson Jr., W. I., Fast, J. D., and Easter, R.: The spatialdistribution of mineral dust and its shortwave radiative forcingover North Africa: modeling sensitivities to dust emissions andaerosol size treatments, Atmos. Chem. Phys., 10, 8821–8838,doi:10.5194/acp-10-8821-2010, 2010.
Zhao, C., Liu, X., Leung, L. R., and Hagos, S.: Radiative impactof mineral dust on monsoon precipitation variability over WestAfrica, Atmos. Chem. Phys., 11, 1879–1893, doi:10.5194/acp-11-1879-2011, 2011.
Zhao, C., Liu, X., and Leung, L. R.: Impact of the Desert dust onthe summer monsoon system over Southwestern North America,Atmos. Chem. Phys., 12, 3717–3731, doi:10.5194/acp-12-3717-2012, 2012.
Zhao, C., Leung, L. R., Easter, R., Hand, J., and Avise, J.:Characterization of speciated aerosol direct radiative forc-ing over California, J. Geophys. Res., 118, 2372–2388,doi:10.1029/2012JD018364, 2013.
www.atmos-chem-phys.net/13/10733/2013/ Atmos. Chem. Phys., 13, 10733–10753, 2013