Embed Size (px)
Citation preview
J. P. Thomas and L. A. Olzak Vol. 13, No. 4/April 1996 /J. Opt. Soc. Am. A 689
Uncertainty experiments support the rolesof second-order mechanisms in spatial
frequency and orientation discriminations
James P. Thomas and Lynn A. Olzak
Department of Psychology, University of California, Los Angeles, Los Angeles, California 90095-1563
Received April 17, 1995; revised manuscript received October 6, 1995; accepted October 13, 1995
Previous studies of spatial frequency and orientation discrimination [Vision Res. 32, 1885 (1992)] suggestthe existence of two second-order cortical mechanisms: one that mediates spatial frequency discriminationsand sums signals across orientations and one that mediates orientation discriminations and sums signalsacross spatial frequency bands. The existence of each mechanism is tested in an uncertainty experiment inwhich the observer does not know which of two hypothetically pooled signals deviates from the standard butmust judge whether the deviation is an increment or a decrement. No uncertainty effect is expected if thesignals are completely pooled. Observed effects are compared with this expectation and with both theoreticaland empirical estimates of the effects expected if the signals are processed separately. Results support theexistence of the first mechanism, but not its exclusive role in mediating spatial frequency judgments, andsupport the exclusive role of the second mechanism in mediating orientation judgments. 1996 OpticalSociety of America
1. INTRODUCTION
The initial cortical representation of the visual scene isby cells that have defined receptive fields in the spacedomain and bandwidth sensitivity, with respect to spa-tial frequency and orientation, in the Fourier domain.In this paper we address the question of when per-ceptual decision-making processes have direct access tothis initial representation and when second-order rep-resentations intervene. When the task is detection oflow-contrast spatial patterns or discrimination betweensimple grating stimuli, much psychophysical evidencesupports the proposition that decision-making processeshave direct access to the initial representation.1,2 How-ever, most models of more complex perceptual tasks,such as segmentation on the basis of texture, postulatesecond-order integrating mechanisms.3 – 6 Furthermore,Olzak and Thomas7,8 tested the direct access hypothesisand showed that it failed for certain discriminations be-tween stimuli that comprised two diverse components.Their results suggested the existence of two second-ordermechanisms, one that combines spatial frequency infor-mation across orientations and one that combines orien-tation information across spatial frequency bands. Wepresent the results of uncertainty experiments that pro-vide an independent test of these possible mechanisms.
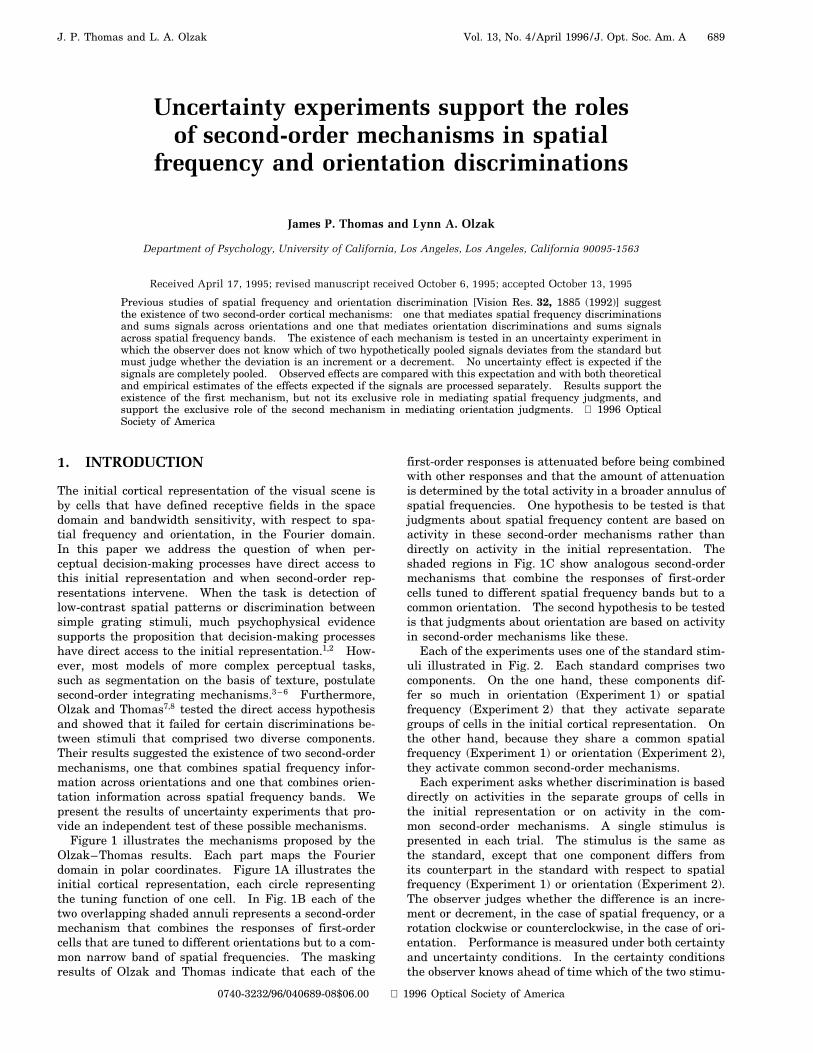
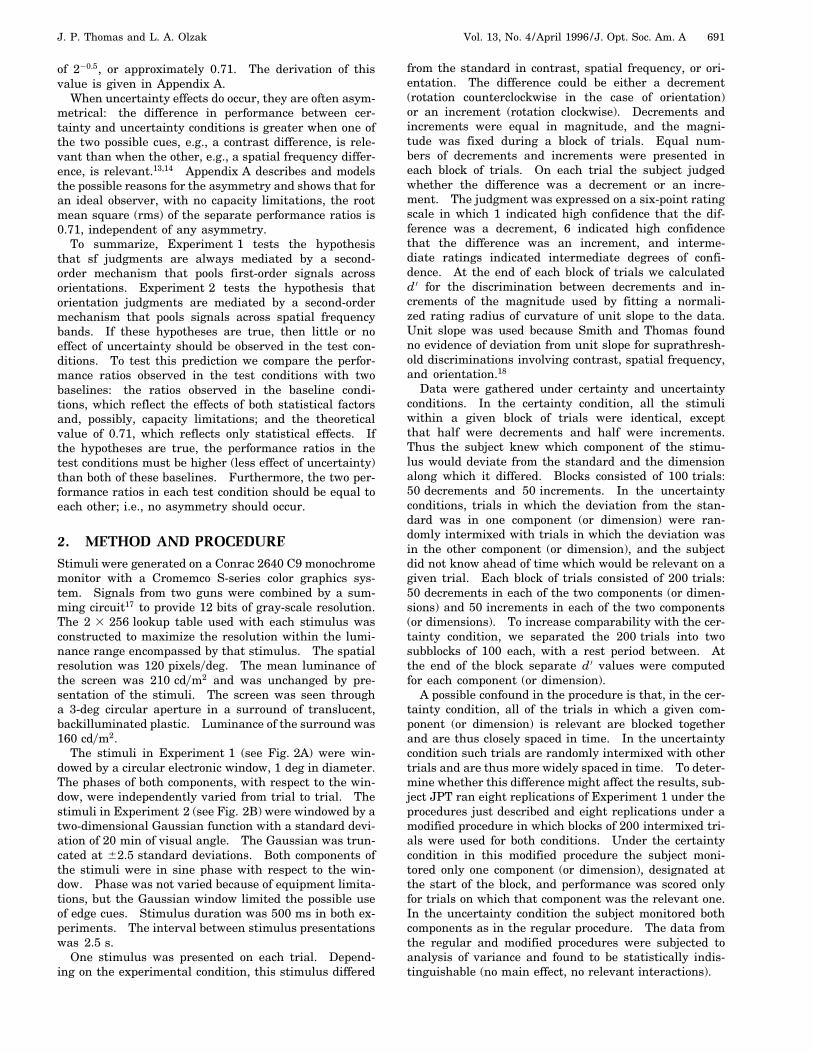
Figure 1 illustrates the mechanisms proposed by theOlzak–Thomas results. Each part maps the Fourierdomain in polar coordinates. Figure 1A illustrates theinitial cortical representation, each circle representingthe tuning function of one cell. In Fig. 1B each of thetwo overlapping shaded annuli represents a second-ordermechanism that combines the responses of first-ordercells that are tuned to different orientations but to a com-mon narrow band of spatial frequencies. The maskingresults of Olzak and Thomas indicate that each of the
0740-3232/96/040689-08$06.00
first-order responses is attenuated before being combinedwith other responses and that the amount of attenuationis determined by the total activity in a broader annulus ofspatial frequencies. One hypothesis to be tested is thatjudgments about spatial frequency content are based onactivity in these second-order mechanisms rather thandirectly on activity in the initial representation. Theshaded regions in Fig. 1C show analogous second-ordermechanisms that combine the responses of first-ordercells tuned to different spatial frequency bands but to acommon orientation. The second hypothesis to be testedis that judgments about orientation are based on activityin second-order mechanisms like these.
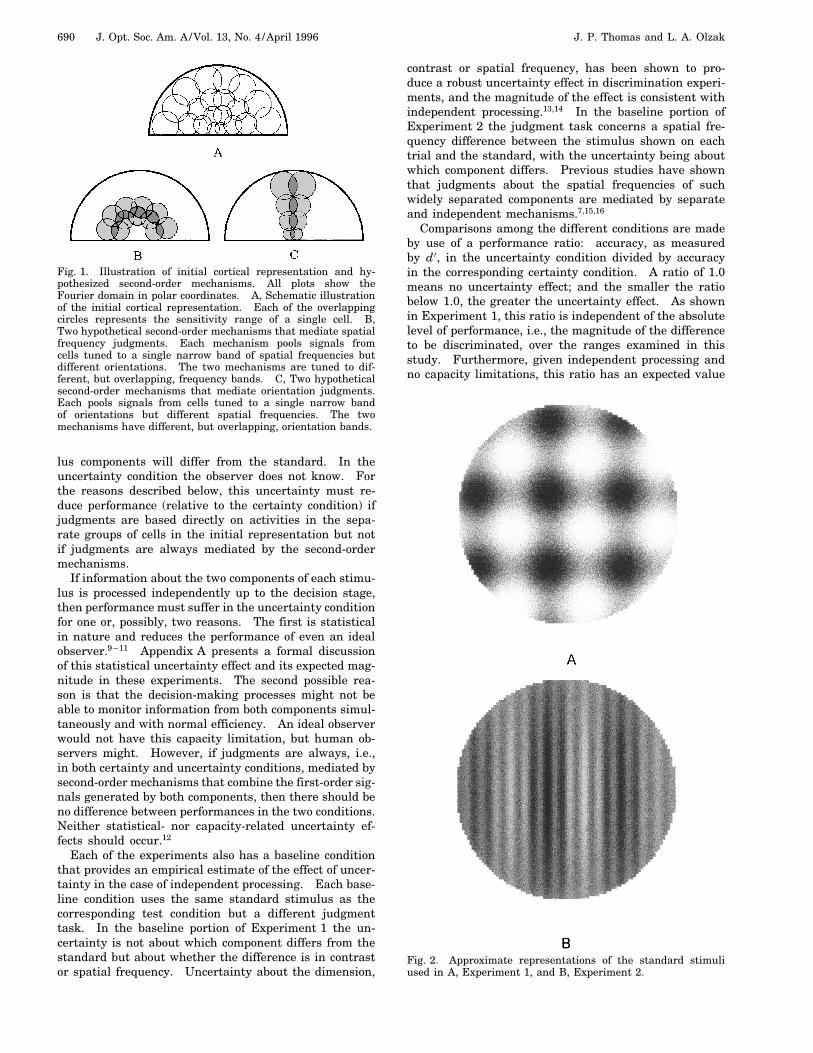
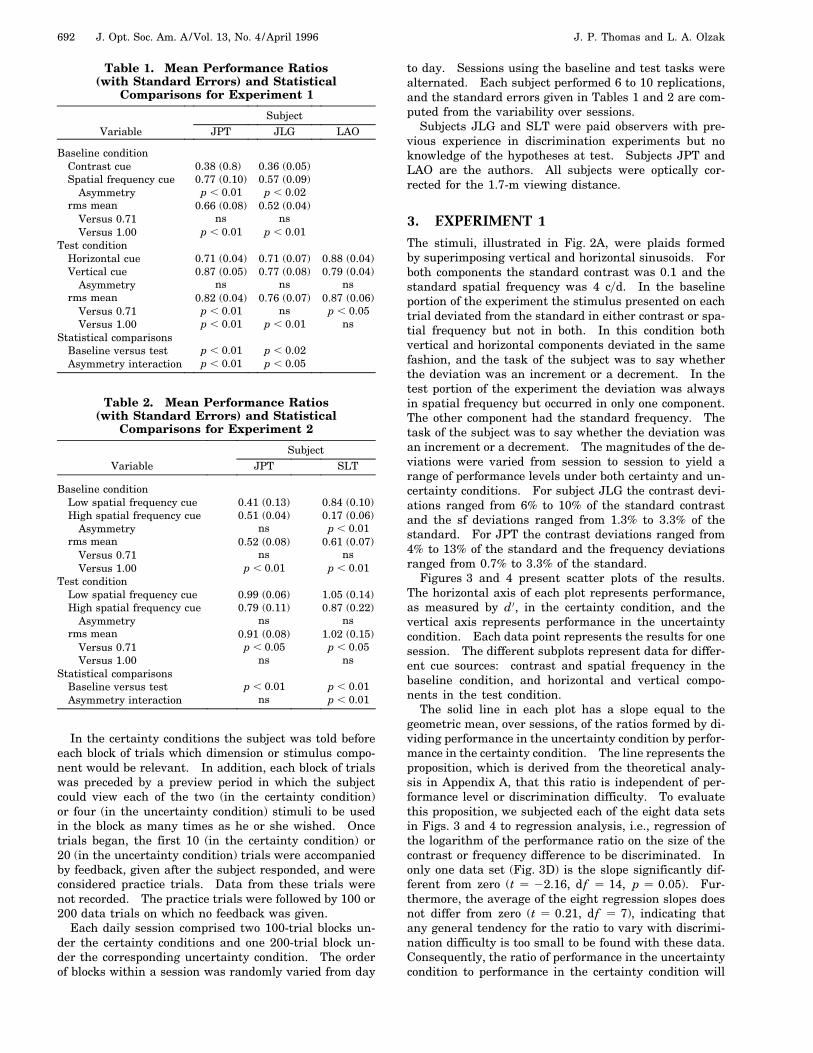
Each of the experiments uses one of the standard stim-uli illustrated in Fig. 2. Each standard comprises twocomponents. On the one hand, these components dif-fer so much in orientation (Experiment 1) or spatialfrequency (Experiment 2) that they activate separategroups of cells in the initial cortical representation. Onthe other hand, because they share a common spatialfrequency (Experiment 1) or orientation (Experiment 2),they activate common second-order mechanisms.
Each experiment asks whether discrimination is baseddirectly on activities in the separate groups of cells inthe initial representation or on activity in the com-mon second-order mechanisms. A single stimulus ispresented in each trial. The stimulus is the same asthe standard, except that one component differs fromits counterpart in the standard with respect to spatialfrequency (Experiment 1) or orientation (Experiment 2).The observer judges whether the difference is an incre-ment or decrement, in the case of spatial frequency, or arotation clockwise or counterclockwise, in the case of ori-entation. Performance is measured under both certaintyand uncertainty conditions. In the certainty conditionsthe observer knows ahead of time which of the two stimu-
1996 Optical Society of America
690 J. Opt. Soc. Am. A/Vol. 13, No. 4 /April 1996 J. P. Thomas and L. A. Olzak
Fig. 1. Illustration of initial cortical representation and hy-pothesized second-order mechanisms. All plots show theFourier domain in polar coordinates. A, Schematic illustrationof the initial cortical representation. Each of the overlappingcircles represents the sensitivity range of a single cell. B,Two hypothetical second-order mechanisms that mediate spatialfrequency judgments. Each mechanism pools signals fromcells tuned to a single narrow band of spatial frequencies butdifferent orientations. The two mechanisms are tuned to dif-ferent, but overlapping, frequency bands. C, Two hypotheticalsecond-order mechanisms that mediate orientation judgments.Each pools signals from cells tuned to a single narrow bandof orientations but different spatial frequencies. The twomechanisms have different, but overlapping, orientation bands.
lus components will differ from the standard. In theuncertainty condition the observer does not know. Forthe reasons described below, this uncertainty must re-duce performance (relative to the certainty condition) ifjudgments are based directly on activities in the sepa-rate groups of cells in the initial representation but notif judgments are always mediated by the second-ordermechanisms.
If information about the two components of each stimu-lus is processed independently up to the decision stage,then performance must suffer in the uncertainty conditionfor one or, possibly, two reasons. The first is statisticalin nature and reduces the performance of even an idealobserver.9 – 11 Appendix A presents a formal discussionof this statistical uncertainty effect and its expected mag-nitude in these experiments. The second possible rea-son is that the decision-making processes might not beable to monitor information from both components simul-taneously and with normal efficiency. An ideal observerwould not have this capacity limitation, but human ob-servers might. However, if judgments are always, i.e.,in both certainty and uncertainty conditions, mediated bysecond-order mechanisms that combine the first-order sig-nals generated by both components, then there should beno difference between performances in the two conditions.Neither statistical- nor capacity-related uncertainty ef-fects should occur.12
Each of the experiments also has a baseline conditionthat provides an empirical estimate of the effect of uncer-tainty in the case of independent processing. Each base-line condition uses the same standard stimulus as thecorresponding test condition but a different judgmenttask. In the baseline portion of Experiment 1 the un-certainty is not about which component differs from thestandard but about whether the difference is in contrastor spatial frequency. Uncertainty about the dimension,
contrast or spatial frequency, has been shown to pro-duce a robust uncertainty effect in discrimination experi-ments, and the magnitude of the effect is consistent withindependent processing.13,14 In the baseline portion ofExperiment 2 the judgment task concerns a spatial fre-quency difference between the stimulus shown on eachtrial and the standard, with the uncertainty being aboutwhich component differs. Previous studies have shownthat judgments about the spatial frequencies of suchwidely separated components are mediated by separateand independent mechanisms.7,15,16
Comparisons among the different conditions are madeby use of a performance ratio: accuracy, as measuredby d0, in the uncertainty condition divided by accuracyin the corresponding certainty condition. A ratio of 1.0means no uncertainty effect; and the smaller the ratiobelow 1.0, the greater the uncertainty effect. As shownin Experiment 1, this ratio is independent of the absolutelevel of performance, i.e., the magnitude of the differenceto be discriminated, over the ranges examined in thisstudy. Furthermore, given independent processing andno capacity limitations, this ratio has an expected value
Fig. 2. Approximate representations of the standard stimuliused in A, Experiment 1, and B, Experiment 2.
J. P. Thomas and L. A. Olzak Vol. 13, No. 4/April 1996 /J. Opt. Soc. Am. A 691
of 220.5, or approximately 0.71. The derivation of thisvalue is given in Appendix A.
When uncertainty effects do occur, they are often asym-metrical: the difference in performance between cer-tainty and uncertainty conditions is greater when one ofthe two possible cues, e.g., a contrast difference, is rele-vant than when the other, e.g., a spatial frequency differ-ence, is relevant.13,14 Appendix A describes and modelsthe possible reasons for the asymmetry and shows that foran ideal observer, with no capacity limitations, the rootmean square (rms) of the separate performance ratios is0.71, independent of any asymmetry.
To summarize, Experiment 1 tests the hypothesisthat sf judgments are always mediated by a second-order mechanism that pools first-order signals acrossorientations. Experiment 2 tests the hypothesis thatorientation judgments are mediated by a second-ordermechanism that pools signals across spatial frequencybands. If these hypotheses are true, then little or noeffect of uncertainty should be observed in the test con-ditions. To test this prediction we compare the perfor-mance ratios observed in the test conditions with twobaselines: the ratios observed in the baseline condi-tions, which reflect the effects of both statistical factorsand, possibly, capacity limitations; and the theoreticalvalue of 0.71, which reflects only statistical effects. Ifthe hypotheses are true, the performance ratios in thetest conditions must be higher (less effect of uncertainty)than both of these baselines. Furthermore, the two per-formance ratios in each test condition should be equal toeach other; i.e., no asymmetry should occur.
2. METHOD AND PROCEDUREStimuli were generated on a Conrac 2640 C9 monochromemonitor with a Cromemco S-series color graphics sys-tem. Signals from two guns were combined by a sum-ming circuit17 to provide 12 bits of gray-scale resolution.The 2 3 256 lookup table used with each stimulus wasconstructed to maximize the resolution within the lumi-nance range encompassed by that stimulus. The spatialresolution was 120 pixelsydeg. The mean luminance ofthe screen was 210 cdym2 and was unchanged by pre-sentation of the stimuli. The screen was seen througha 3-deg circular aperture in a surround of translucent,backilluminated plastic. Luminance of the surround was160 cdym2.
The stimuli in Experiment 1 (see Fig. 2A) were win-dowed by a circular electronic window, 1 deg in diameter.The phases of both components, with respect to the win-dow, were independently varied from trial to trial. Thestimuli in Experiment 2 (see Fig. 2B) were windowed by atwo-dimensional Gaussian function with a standard devi-ation of 20 min of visual angle. The Gaussian was trun-cated at 62.5 standard deviations. Both components ofthe stimuli were in sine phase with respect to the win-dow. Phase was not varied because of equipment limita-tions, but the Gaussian window limited the possible useof edge cues. Stimulus duration was 500 ms in both ex-periments. The interval between stimulus presentationswas 2.5 s.
One stimulus was presented on each trial. Depend-ing on the experimental condition, this stimulus differed
from the standard in contrast, spatial frequency, or ori-entation. The difference could be either a decrement(rotation counterclockwise in the case of orientation)or an increment (rotation clockwise). Decrements andincrements were equal in magnitude, and the magni-tude was fixed during a block of trials. Equal num-bers of decrements and increments were presented ineach block of trials. On each trial the subject judgedwhether the difference was a decrement or an incre-ment. The judgment was expressed on a six-point ratingscale in which 1 indicated high confidence that the dif-ference was a decrement, 6 indicated high confidencethat the difference was an increment, and interme-diate ratings indicated intermediate degrees of confi-dence. At the end of each block of trials we calculatedd0 for the discrimination between decrements and in-crements of the magnitude used by fitting a normali-zed rating radius of curvature of unit slope to the data.Unit slope was used because Smith and Thomas foundno evidence of deviation from unit slope for suprathresh-old discriminations involving contrast, spatial frequency,and orientation.18
Data were gathered under certainty and uncertaintyconditions. In the certainty condition, all the stimuliwithin a given block of trials were identical, exceptthat half were decrements and half were increments.Thus the subject knew which component of the stimu-lus would deviate from the standard and the dimensionalong which it differed. Blocks consisted of 100 trials:50 decrements and 50 increments. In the uncertaintyconditions, trials in which the deviation from the stan-dard was in one component (or dimension) were ran-domly intermixed with trials in which the deviation wasin the other component (or dimension), and the subjectdid not know ahead of time which would be relevant on agiven trial. Each block of trials consisted of 200 trials:50 decrements in each of the two components (or dimen-sions) and 50 increments in each of the two components(or dimensions). To increase comparability with the cer-tainty condition, we separated the 200 trials into twosubblocks of 100 each, with a rest period between. Atthe end of the block separate d0 values were computedfor each component (or dimension).
A possible confound in the procedure is that, in the cer-tainty condition, all of the trials in which a given com-ponent (or dimension) is relevant are blocked togetherand are thus closely spaced in time. In the uncertaintycondition such trials are randomly intermixed with othertrials and are thus more widely spaced in time. To deter-mine whether this difference might affect the results, sub-ject JPT ran eight replications of Experiment 1 under theprocedures just described and eight replications under amodified procedure in which blocks of 200 intermixed tri-als were used for both conditions. Under the certaintycondition in this modified procedure the subject moni-tored only one component (or dimension), designated atthe start of the block, and performance was scored onlyfor trials on which that component was the relevant one.In the uncertainty condition the subject monitored bothcomponents as in the regular procedure. The data fromthe regular and modified procedures were subjected toanalysis of variance and found to be statistically indis-tinguishable (no main effect, no relevant interactions).
692 J. Opt. Soc. Am. A/Vol. 13, No. 4 /April 1996 J. P. Thomas and L. A. Olzak
Table 1. Mean Performance Ratios(with Standard Errors) and Statistical
Comparisons for Experiment 1
SubjectVariable JPT JLG LAO
Baseline conditionContrast cue 0.38 (0.8) 0.36 (0.05)Spatial frequency cue 0.77 (0.10) 0.57 (0.09)
Asymmetry p , 0.01 p , 0.02rms mean 0.66 (0.08) 0.52 (0.04)
Versus 0.71 ns nsVersus 1.00 p , 0.01 p , 0.01
Test conditionHorizontal cue 0.71 (0.04) 0.71 (0.07) 0.88 (0.04)Vertical cue 0.87 (0.05) 0.77 (0.08) 0.79 (0.04)
Asymmetry ns ns nsrms mean 0.82 (0.04) 0.76 (0.07) 0.87 (0.06)
Versus 0.71 p , 0.01 ns p , 0.05Versus 1.00 p , 0.01 p , 0.01 ns
Statistical comparisonsBaseline versus test p , 0.01 p , 0.02Asymmetry interaction p , 0.01 p , 0.05
Table 2. Mean Performance Ratios(with Standard Errors) and Statistical
Comparisons for Experiment 2
SubjectVariable JPT SLT
Baseline conditionLow spatial frequency cue 0.41 (0.13) 0.84 (0.10)High spatial frequency cue 0.51 (0.04) 0.17 (0.06)
Asymmetry ns p , 0.01rms mean 0.52 (0.08) 0.61 (0.07)
Versus 0.71 ns nsVersus 1.00 p , 0.01 p , 0.01
Test conditionLow spatial frequency cue 0.99 (0.06) 1.05 (0.14)High spatial frequency cue 0.79 (0.11) 0.87 (0.22)
Asymmetry ns nsrms mean 0.91 (0.08) 1.02 (0.15)
Versus 0.71 p , 0.05 p , 0.05Versus 1.00 ns ns
Statistical comparisonsBaseline versus test p , 0.01 p , 0.01Asymmetry interaction ns p , 0.01
In the certainty conditions the subject was told beforeeach block of trials which dimension or stimulus compo-nent would be relevant. In addition, each block of trialswas preceded by a preview period in which the subjectcould view each of the two (in the certainty condition)or four (in the uncertainty condition) stimuli to be usedin the block as many times as he or she wished. Oncetrials began, the first 10 (in the certainty condition) or20 (in the uncertainty condition) trials were accompaniedby feedback, given after the subject responded, and wereconsidered practice trials. Data from these trials werenot recorded. The practice trials were followed by 100 or200 data trials on which no feedback was given.
Each daily session comprised two 100-trial blocks un-der the certainty conditions and one 200-trial block un-der the corresponding uncertainty condition. The orderof blocks within a session was randomly varied from day
to day. Sessions using the baseline and test tasks werealternated. Each subject performed 6 to 10 replications,and the standard errors given in Tables 1 and 2 are com-puted from the variability over sessions.
Subjects JLG and SLT were paid observers with pre-vious experience in discrimination experiments but noknowledge of the hypotheses at test. Subjects JPT andLAO are the authors. All subjects were optically cor-rected for the 1.7-m viewing distance.
3. EXPERIMENT 1The stimuli, illustrated in Fig. 2A, were plaids formedby superimposing vertical and horizontal sinusoids. Forboth components the standard contrast was 0.1 and thestandard spatial frequency was 4 cyd. In the baselineportion of the experiment the stimulus presented on eachtrial deviated from the standard in either contrast or spa-tial frequency but not in both. In this condition bothvertical and horizontal components deviated in the samefashion, and the task of the subject was to say whetherthe deviation was an increment or a decrement. In thetest portion of the experiment the deviation was alwaysin spatial frequency but occurred in only one component.The other component had the standard frequency. Thetask of the subject was to say whether the deviation wasan increment or a decrement. The magnitudes of the de-viations were varied from session to session to yield arange of performance levels under both certainty and un-certainty conditions. For subject JLG the contrast devi-ations ranged from 6% to 10% of the standard contrastand the sf deviations ranged from 1.3% to 3.3% of thestandard. For JPT the contrast deviations ranged from4% to 13% of the standard and the frequency deviationsranged from 0.7% to 3.3% of the standard.
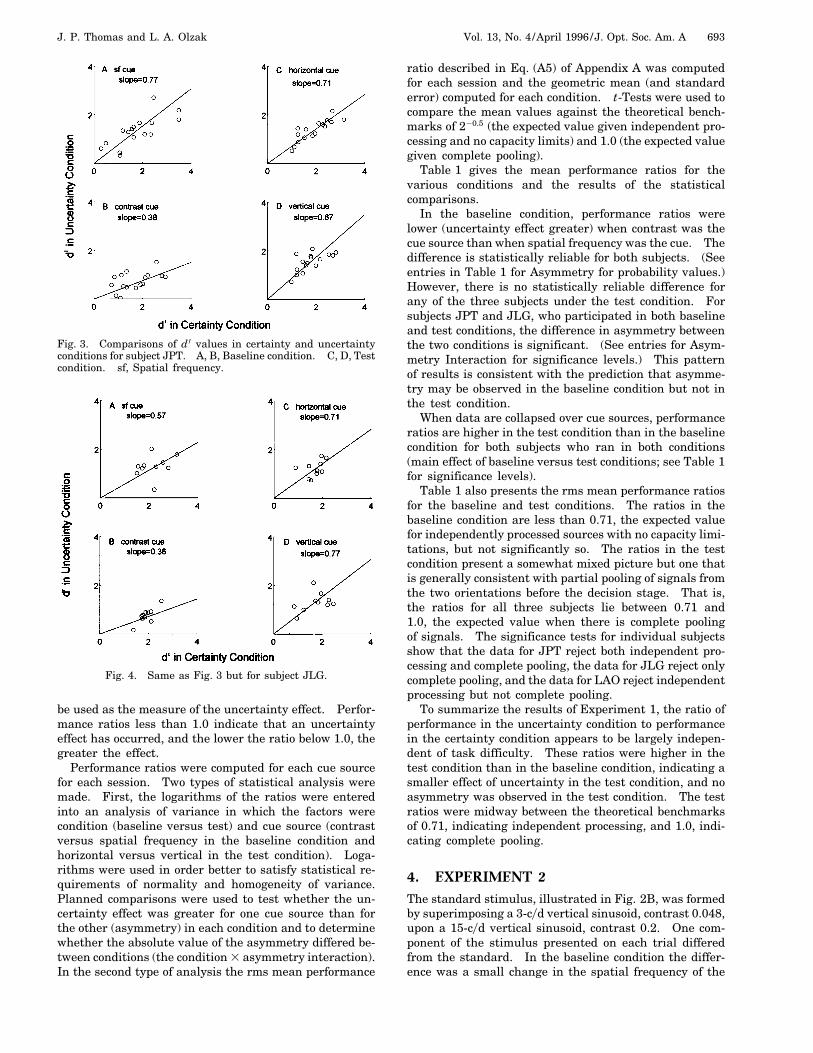
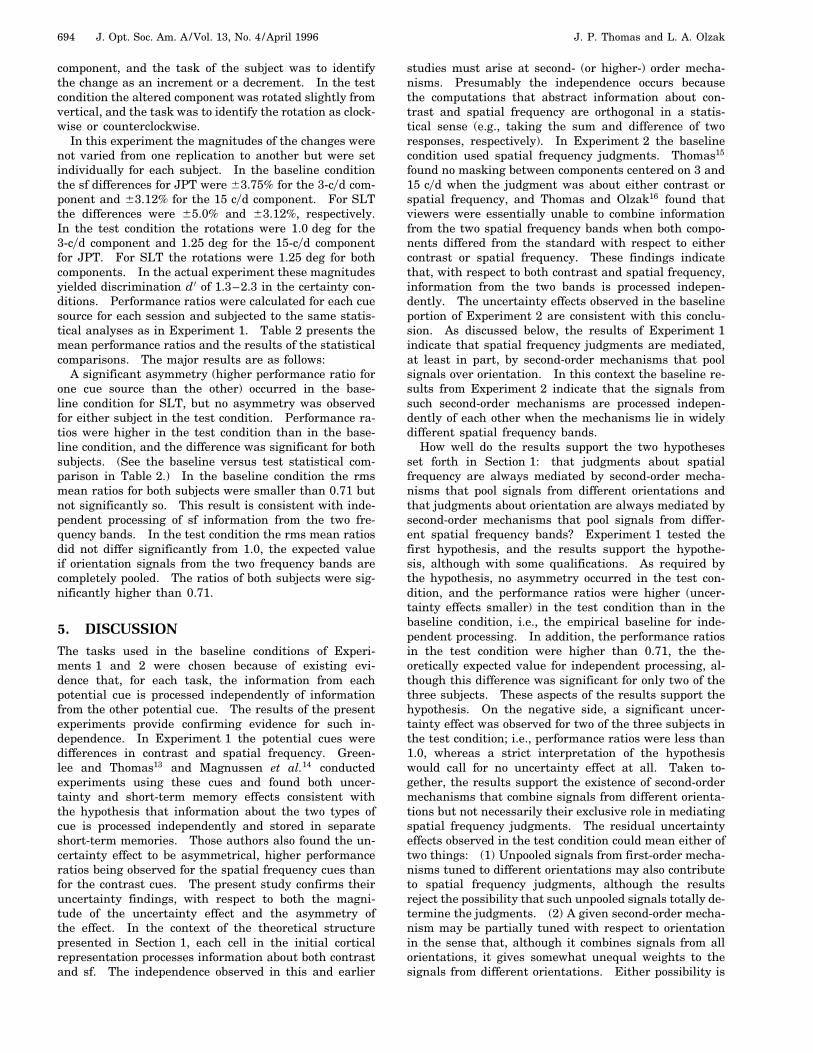
Figures 3 and 4 present scatter plots of the results.The horizontal axis of each plot represents performance,as measured by d0, in the certainty condition, and thevertical axis represents performance in the uncertaintycondition. Each data point represents the results for onesession. The different subplots represent data for differ-ent cue sources: contrast and spatial frequency in thebaseline condition, and horizontal and vertical compo-nents in the test condition.
The solid line in each plot has a slope equal to thegeometric mean, over sessions, of the ratios formed by di-viding performance in the uncertainty condition by perfor-mance in the certainty condition. The line represents theproposition, which is derived from the theoretical analy-sis in Appendix A, that this ratio is independent of per-formance level or discrimination difficulty. To evaluatethis proposition, we subjected each of the eight data setsin Figs. 3 and 4 to regression analysis, i.e., regression ofthe logarithm of the performance ratio on the size of thecontrast or frequency difference to be discriminated. Inonly one data set (Fig. 3D) is the slope significantly dif-ferent from zero (t 22.16, df 14, p 0.05). Fur-thermore, the average of the eight regression slopes doesnot differ from zero (t 0.21, df 7), indicating thatany general tendency for the ratio to vary with discrimi-nation difficulty is too small to be found with these data.Consequently, the ratio of performance in the uncertaintycondition to performance in the certainty condition will
J. P. Thomas and L. A. Olzak Vol. 13, No. 4/April 1996 /J. Opt. Soc. Am. A 693
Fig. 3. Comparisons of d0 values in certainty and uncertaintyconditions for subject JPT. A, B, Baseline condition. C, D, Testcondition. sf, Spatial frequency.
Fig. 4. Same as Fig. 3 but for subject JLG.
be used as the measure of the uncertainty effect. Perfor-mance ratios less than 1.0 indicate that an uncertaintyeffect has occurred, and the lower the ratio below 1.0, thegreater the effect.
Performance ratios were computed for each cue sourcefor each session. Two types of statistical analysis weremade. First, the logarithms of the ratios were enteredinto an analysis of variance in which the factors werecondition (baseline versus test) and cue source (contrastversus spatial frequency in the baseline condition andhorizontal versus vertical in the test condition). Loga-rithms were used in order better to satisfy statistical re-quirements of normality and homogeneity of variance.Planned comparisons were used to test whether the un-certainty effect was greater for one cue source than forthe other (asymmetry) in each condition and to determinewhether the absolute value of the asymmetry differed be-tween conditions (the condition 3 asymmetry interaction).In the second type of analysis the rms mean performance
ratio described in Eq. (A5) of Appendix A was computedfor each session and the geometric mean (and standarderror) computed for each condition. t-Tests were used tocompare the mean values against the theoretical bench-marks of 220.5 (the expected value given independent pro-cessing and no capacity limits) and 1.0 (the expected valuegiven complete pooling).
Table 1 gives the mean performance ratios for thevarious conditions and the results of the statisticalcomparisons.
In the baseline condition, performance ratios werelower (uncertainty effect greater) when contrast was thecue source than when spatial frequency was the cue. Thedifference is statistically reliable for both subjects. (Seeentries in Table 1 for Asymmetry for probability values.)However, there is no statistically reliable difference forany of the three subjects under the test condition. Forsubjects JPT and JLG, who participated in both baselineand test conditions, the difference in asymmetry betweenthe two conditions is significant. (See entries for Asym-metry Interaction for significance levels.) This patternof results is consistent with the prediction that asymme-try may be observed in the baseline condition but not inthe test condition.
When data are collapsed over cue sources, performanceratios are higher in the test condition than in the baselinecondition for both subjects who ran in both conditions(main effect of baseline versus test conditions; see Table 1for significance levels).
Table 1 also presents the rms mean performance ratiosfor the baseline and test conditions. The ratios in thebaseline condition are less than 0.71, the expected valuefor independently processed sources with no capacity limi-tations, but not significantly so. The ratios in the testcondition present a somewhat mixed picture but one thatis generally consistent with partial pooling of signals fromthe two orientations before the decision stage. That is,the ratios for all three subjects lie between 0.71 and1.0, the expected value when there is complete poolingof signals. The significance tests for individual subjectsshow that the data for JPT reject both independent pro-cessing and complete pooling, the data for JLG reject onlycomplete pooling, and the data for LAO reject independentprocessing but not complete pooling.
To summarize the results of Experiment 1, the ratio ofperformance in the uncertainty condition to performancein the certainty condition appears to be largely indepen-dent of task difficulty. These ratios were higher in thetest condition than in the baseline condition, indicating asmaller effect of uncertainty in the test condition, and noasymmetry was observed in the test condition. The testratios were midway between the theoretical benchmarksof 0.71, indicating independent processing, and 1.0, indi-cating complete pooling.
4. EXPERIMENT 2The standard stimulus, illustrated in Fig. 2B, was formedby superimposing a 3-cyd vertical sinusoid, contrast 0.048,upon a 15-cyd vertical sinusoid, contrast 0.2. One com-ponent of the stimulus presented on each trial differedfrom the standard. In the baseline condition the differ-ence was a small change in the spatial frequency of the
694 J. Opt. Soc. Am. A/Vol. 13, No. 4 /April 1996 J. P. Thomas and L. A. Olzak
component, and the task of the subject was to identifythe change as an increment or a decrement. In the testcondition the altered component was rotated slightly fromvertical, and the task was to identify the rotation as clock-wise or counterclockwise.
In this experiment the magnitudes of the changes werenot varied from one replication to another but were setindividually for each subject. In the baseline conditionthe sf differences for JPT were 63.75% for the 3-cyd com-ponent and 63.12% for the 15 cyd component. For SLTthe differences were 65.0% and 63.12%, respectively.In the test condition the rotations were 1.0 deg for the3-cyd component and 1.25 deg for the 15-cyd componentfor JPT. For SLT the rotations were 1.25 deg for bothcomponents. In the actual experiment these magnitudesyielded discrimination d0 of 1.3–2.3 in the certainty con-ditions. Performance ratios were calculated for each cuesource for each session and subjected to the same statis-tical analyses as in Experiment 1. Table 2 presents themean performance ratios and the results of the statisticalcomparisons. The major results are as follows:
A significant asymmetry (higher performance ratio forone cue source than the other) occurred in the base-line condition for SLT, but no asymmetry was observedfor either subject in the test condition. Performance ra-tios were higher in the test condition than in the base-line condition, and the difference was significant for bothsubjects. (See the baseline versus test statistical com-parison in Table 2.) In the baseline condition the rmsmean ratios for both subjects were smaller than 0.71 butnot significantly so. This result is consistent with inde-pendent processing of sf information from the two fre-quency bands. In the test condition the rms mean ratiosdid not differ significantly from 1.0, the expected valueif orientation signals from the two frequency bands arecompletely pooled. The ratios of both subjects were sig-nificantly higher than 0.71.
5. DISCUSSIONThe tasks used in the baseline conditions of Experi-ments 1 and 2 were chosen because of existing evi-dence that, for each task, the information from eachpotential cue is processed independently of informationfrom the other potential cue. The results of the presentexperiments provide confirming evidence for such in-dependence. In Experiment 1 the potential cues weredifferences in contrast and spatial frequency. Green-lee and Thomas13 and Magnussen et al.14 conductedexperiments using these cues and found both uncer-tainty and short-term memory effects consistent withthe hypothesis that information about the two types ofcue is processed independently and stored in separateshort-term memories. Those authors also found the un-certainty effect to be asymmetrical, higher performanceratios being observed for the spatial frequency cues thanfor the contrast cues. The present study confirms theiruncertainty findings, with respect to both the magni-tude of the uncertainty effect and the asymmetry ofthe effect. In the context of the theoretical structurepresented in Section 1, each cell in the initial corticalrepresentation processes information about both contrastand sf. The independence observed in this and earlier
studies must arise at second- (or higher-) order mecha-nisms. Presumably the independence occurs becausethe computations that abstract information about con-trast and spatial frequency are orthogonal in a statis-tical sense (e.g., taking the sum and difference of tworesponses, respectively). In Experiment 2 the baselinecondition used spatial frequency judgments. Thomas15
found no masking between components centered on 3 and15 cyd when the judgment was about either contrast orspatial frequency, and Thomas and Olzak16 found thatviewers were essentially unable to combine informationfrom the two spatial frequency bands when both compo-nents differed from the standard with respect to eithercontrast or spatial frequency. These findings indicatethat, with respect to both contrast and spatial frequency,information from the two bands is processed indepen-dently. The uncertainty effects observed in the baselineportion of Experiment 2 are consistent with this conclu-sion. As discussed below, the results of Experiment 1indicate that spatial frequency judgments are mediated,at least in part, by second-order mechanisms that poolsignals over orientation. In this context the baseline re-sults from Experiment 2 indicate that the signals fromsuch second-order mechanisms are processed indepen-dently of each other when the mechanisms lie in widelydifferent spatial frequency bands.
How well do the results support the two hypothesesset forth in Section 1: that judgments about spatialfrequency are always mediated by second-order mecha-nisms that pool signals from different orientations andthat judgments about orientation are always mediated bysecond-order mechanisms that pool signals from differ-ent spatial frequency bands? Experiment 1 tested thefirst hypothesis, and the results support the hypothe-sis, although with some qualifications. As required bythe hypothesis, no asymmetry occurred in the test con-dition, and the performance ratios were higher (uncer-tainty effects smaller) in the test condition than in thebaseline condition, i.e., the empirical baseline for inde-pendent processing. In addition, the performance ratiosin the test condition were higher than 0.71, the the-oretically expected value for independent processing, al-though this difference was significant for only two of thethree subjects. These aspects of the results support thehypothesis. On the negative side, a significant uncer-tainty effect was observed for two of the three subjects inthe test condition; i.e., performance ratios were less than1.0, whereas a strict interpretation of the hypothesiswould call for no uncertainty effect at all. Taken to-gether, the results support the existence of second-ordermechanisms that combine signals from different orienta-tions but not necessarily their exclusive role in mediatingspatial frequency judgments. The residual uncertaintyeffects observed in the test condition could mean either oftwo things: (1) Unpooled signals from first-order mecha-nisms tuned to different orientations may also contributeto spatial frequency judgments, although the resultsreject the possibility that such unpooled signals totally de-termine the judgments. (2) A given second-order mecha-nism may be partially tuned with respect to orientationin the sense that, although it combines signals from allorientations, it gives somewhat unequal weights to thesignals from different orientations. Either possibility is
J. P. Thomas and L. A. Olzak Vol. 13, No. 4/April 1996 /J. Opt. Soc. Am. A 695
consistent with the results of Experiment 1, and our dataprovide no way of distinguishing between them.
The results of Experiment 2 provide unqualified sup-port for the second hypothesis, that orientation judg-ments are mediated by a mechanism that pools signalsacross spatial frequency bands. The performance ratiosobtained in the test condition did not differ significantlyfrom 1.0, the expected value for complete pooling; weresignificantly larger than 0.71, the expected value for inde-pendent processing; and were significantly larger than theratios observed in the baseline condition, which providedan empirical baseline value for independent processing.No feature of the data is at variance with the hypothesisthat orientation judgments are always and solely medi-ated by mechanisms that pool signals over spatial fre-quency bands.
In summary, the results support the suggestion byOlzak and Thomas7 that judgments about spatial fre-quency and orientation are mediated by mechanisms thatcombine signal across orientations and across spatial fre-quency bands, respectively. The results of Experiment 2are consistent with the hypothesis that such mechanismsare exclusively responsible for orientation judgments.The results of Experiment 1 support the role of suchmechanisms in spatial frequency judgments but not nec-essarily an exclusive role.
APPENDIX AIn the present experiments the subject makes a discrimi-nation based on one of two possible cues. When the twocues are processed by completely separate and statisti-cally independent mechanisms, performance must dropwhen there is uncertainty about which cue is relevanton a given trial. In the absence of other limitations themagnitude of this drop can be determined from statis-tical considerations. Here we present a decision modelthat permits the magnitude of the uncertainty effect to becalculated.
On each trial the observer calculates two likelihoodratios, one for each potential cue. Each is the ratio of thelikelihood of an increment (or clockwise rotation) in thatcue to the likelihood of a decrement (or counterclockwiserotation). For convenience we represent the trial-to-trialvalues of the logarithms of these ratios as x and y. Thevariable x is distributed with standard deviation sx andmean 2Dxy2, 0, or 1Dxy2, depending on whether the cuehas been decremented, unchanged, or incremented withrespect to the standard. The variable y is analogouslydistributed.
In the certainty condition the observer knows whichcue is relevant and bases the judgment solely on thecorresponding likelihood ratio. In this condition
d0c,x Dxysx (A1a)
d0c,y Dyysy . (A1b)
In the uncertainty condition the optimal observer moni-tors the values of both x and y. In the absence of asym-metries (such as the cues’ being relevant with unequalfrequencies), the observer selects the variable with thelarger absolute value and judges “decrement” if the valueis negative and “increment” otherwise.
This procedure is equivalent to computing the decisionvariable
z x 1 y (A2)
and responding “decrement” when z is negative and “in-crement” otherwise. Note that z has the same sign asthe variable, x or y, with the larger absolute value. Re-sponse biases can be incorporated by modifying the deci-sion variable as follows:
z ax 1 by 1 c , (A3)
where a and b reflect weightings given to the two typesof cue and c reflects a bias with respect to whether thechange is judged an increment or a decrement. Giventhat the two cues are processed independently, perfor-mance in the uncertainty condition is as follows:
d0u,x aDxysa2s2
x 1 b2s2y d0.5, (A4a)
d0u,y bDyysa2s2
x 1 b2s2y d0.5. (A4b)
Comparisons of Eqs. (A1a) and (A1b) and (A4a) and (A4b)show that performance is reduced in the uncertainty con-dition. In general, the reduction is greater for the cuefor which the weighted variance, sa2s2
x d or sb2s2y d, is less.
However, the following rms ratio is independent of bothweights and variances:
hfsd0u,xyd0
c,xd2 1 sd0u,yyd0
c,yd2gy2j0.5 220.5. (A5)
If the observed mean ratio is significantly greater thanthis value, which is approximately 0.71, the reduction inperformance caused by uncertainty is less than expectedfor independently processed cues, and the implication isthat the cues are always correlated or at least partiallypooled before the decision stage. If the mean ratio is sig-nificantly less than 0.71 the implication is that factorsother than uncertainty, such as inability to process twocues during the same trial, are combining with uncer-tainty to reduce performance.
ACKNOWLEDGMENTSThis research was supported by grant EY00360 fromthe National Eye Institute. We thank Joseph Goldand Stephanie Tom for their valuable contributions asobservers.
REFERENCES AND NOTES1. N. V. S. Graham, Visual Pattern Analyzers (Oxford U. Press,
New York, 1989).2. L. A. Olzak and J. P. Thomas, “Seeing spatial patterns,”
in Sensory Processes and Perception, Vol. 1 of Handbook ofPerception and Human Performance, K. Boff, L. Kaufman,and J. P. Thomas, eds. (Wiley, New York, 1986), pp. 7-1–7-56.
3. A. C. Bovik, M. Clark, and W. S. Geisler, “Multichannel tex-ture analysis using localized spatial filters,” IEEE Trans.Patt. Analy. Mach. Vis. 12, 55–73 (1990).
4. M. S. Landy and J. R. Bergen, “Texture segregation andorientation gradient,” Vision Res. 31, 679–692 (1991).
5. N. Graham, J. Beck, and A. Sutter, “Nonlinear processesin spatial-frequency channel models of perceived texturesegregation: effects of sign and amount of contrast,” VisionRes. 32, 719–743 (1992).

696 J. Opt. Soc. Am. A/Vol. 13, No. 4 /April 1996 J. P. Thomas and L. A. Olzak
6. H. R. Wilson and W. A. Richards, “Curvature and separationdiscrimination at texture boundaries,” J. Opt. Soc. Am. A 9,1653–1662 (1992).
7. L. A. Olzak and J. P. Thomas, “Configural effects constrainFourier models of pattern discrimination,” Vision Res. 32,1885–1898 (1992).
8. L. A. Olzak and J. P. Thomas, “When orthogonal orien-tations are not processed independently,” Vision Res. 31,51–57 (1991).
9. W. P. Tanner, “Physiological implications of psychophysicaldata,” Ann. N. Y. Acad. Sci. 89, 752–765 (1961).
10. E. T. Davis and N. Graham, “Spatial frequency uncertaintyeffects in the detection of visual sinusoidal gratings,” VisionRes. 21, 705–712 (1981).
11. E. T. Davis, P. Kramer, and N. Graham, “Uncertainty aboutspatial frequency, spatial position, or contrast of visual pat-terns,” Percept. Psychophys. 33, 20–28 (1983).
12. In theory, there is a third possible explanation for un-certainty effects when only one component of the stimu-lus differs from the standard: in certainty conditions thesubject knows which component has the standard value andbases the judgment on a simultaneous comparison betweenthe components; in the uncertainty conditions such a com-parison is ambiguous, and the subject must rely on an abso-
lute judgment or a comparison with a remembered standardvalue. However, Olzak and Thomas found that, for the finediscriminations measured in this paper, subjects do not basetheir judgments on relative comparisons between compo-nents even when such judgments would be more accurate.7
13. M. W. Greenlee and J. P. Thomas, “Simultaneous discrimi-nation of the spatial frequency and contrast of periodic stim-uli,” J. Opt. Soc. Am. A 10, 395–404 (1993).
14. S. Magnussen, M. W. Greenlee, and J. P. Thomas, “Parallelprocessing in visual short-term memory,” J. Exp. Psychol.(to be published).
15. J. P. Thomas, “Independent processing of suprathresholdspatial gratings as a function of their separation in spatialfrequency,” J. Opt. Soc. Am. A 6, 1102–1111 (1989).
16. J. P. Thomas and L. A. Olzak, “Cue summation is spatialdiscriminations,” Vision Res. 30, 1865–1875 (1990).
17. A. B. Watson, K. R. Nielson, A. Poirson, A. Fitzhugh, A.Bilson, K. Nguyen, and A. Ahumada, “Use of raster frame-buffer in vision research,” Behav. Res. Methods Instrum.Comput. 18, 587–594 (1986).
18. B. G. Smith and J. P. Thomas, “Why are some spatial dis-criminations independent of contrast?” J. Opt. Soc. Am. A6, 713–724 (1989).