Embed Size (px)
Citation preview
American Journal of Civil Engineering 2016; 4(1): 12-23
Published online February 23, 2016 (http://www.sciencepublishinggroup.com/j/ajce)
doi: 10.11648/j.ajce.20160401.12
ISSN: 2330-8729 (Print); ISSN: 2330-8737 (Online)
Uncertainty and Risk Factors Assessment for Cross-Country Pipelines Projects Using AHP
Hesham Abd El Khalek1, Remon Fayek Aziz
2, Hamada Kamel
3, *
1Construction Engineering and Management, Faculty of Engineering, Alexandria University, Alexandria, Egypt 2Construction Engineering and Management, Faculty of Engineering, Alexandria University, Egypt 3Faculty of Engineering, Alexandria University, Alexandria, Egypt
Email address: [email protected] (H. A. El Khalek), [email protected] (R. F. Aziz), [email protected] (H. Kamel)
To cite this article: Hesham Abd El Khalek, Remon Fayek Aziz, Hamada Kamel. Uncertainty and Risk Factors Assessment for Cross-Country Pipelines Projects
Using AHP. American Journal of Civil Engineering. Vol. 4, No. 1, 2016, pp. 12-23. doi: 10.11648/j.ajce.20160401.12
Abstract: Infrastructure cross-country pipelines projects carry out higher risk than traditional because they entail high
capital outlays and intricate site conditions. The high-risk exposure associated with infrastructure cross-country pipelines
projects needs special attention from contractors to analyze and manage their risks. They cannot be eliminated but can be
minimized or transferred from one project stakeholder to another. Therefore, current research aims for identifying the risk
factors that affect infrastructure cross-country pipelines projects based on experts experience and company’s point of view
which participated in similar projects. The risk factors classified under two categories to company level risks and project level
risks. The risk factors were assessed using risk assessment models that facilitate this assessment procedure, prioritize these
projects based upon its risk indexes and evaluate risk contingency value. Analytical hierarchy process (AHP) used to evaluate
risk factors weights (likelihood) and FUZZY LOGIC approach to evaluate risk factors impact (Risk consequences) using
software aids such as EXCEL and MATLAB software, accordingly risk indexes for both company level and project level
evaluated and overall project risk index determined. Five case studies in different countries were selected to determine the
highest risk factors and to implement the designed models and test its results. Results show that project no 3 in Iraq conquer
the highest risk index (39.75%); however, project 5 in Egypt has the lowest risk index (5.24%). Results of risk factors in other
countries are (32.81%) in Emirates, (17.27%) in Saudi Arabia and (11.67%) in Libya. Therefore, the developed model can be
used to sort projects based upon risk, which facilitate company’s decision of which project can be pursued.
Keywords: Risk Management, International Construction, Risk Factors, Optimization Model,
Analytic Hierarchy Process (AHP), FUZZY LOGIC Approach, MATLAB Software, Validation Process
1. Introduction
The business of construction has changed a great deal
resulting from the effects of growing globalization and
competition [22]. The fast-growing international trade and
developments, such as the World Trade Organization
agreements [32] and the Asia-Pacific Economic Cooperation
forum (APEC, 2003) have provided new opportunities to the
construction industry. Facilitated by sophisticated
communication technologies, advanced project management,
and by profits attraction, large-scale projects are no longer
local events but international affairs involving parties of
different nations [13, 21, 22].
Infrastructure such pipelines project is by its nature the
corner stone of our society. It lays the foundation for a
healthy economy and civilization. Such projects carry out
higher risk than traditional because they spend high capital
outlays and have complicated site conditions. Generally,
projects that are implemented in the infrastructure field as
cross-country pipeline projects are considered as
investments, due to the high initial cost and the project's long
time horizon.
Risks cause cost overrun and schedule delay in many
projects. The effectiveness of risk management becomes an
important issue in project management. To make risk
management more efficient and effective, all parties must
understand risk responsibilities, risk event conditions, risk
preference, and risk management capabilities. There are
many types of potential sources of risk and uncertainty that
affect infrastructure cross-country pipelines projects. These
American Journal of Civil Engineering 2016; 4(1): 12-23 13
sources of risk and uncertainty include political, economical,
cultural, market, and technical risks that might reduce the
contractor(s) and/or subcontractor(s) profit. It is essential that
contractors and subcontractors conquer these sources of risk
and uncertainty. [1, 13, 30, 3, 9, 16].
2. Background
A cross-country pipeline construction projects are exposed
to an uncertain environment due to its enormous size
(physical, manpower requirement and financial value),
complexity in design technology and involvement of external
factors. These uncertainties can lead to several changes in
project scope during the process of project execution. Unless
the changes are properly controlled, the time, cost and quality
goals of the project may never be achieved [23].
The cross-country petroleum pipelines are sensitive for
risks because they traverse through varied terrain covering
crop fields, forests, rivers, populated areas, desert, Hills, sea
bed and offshore [13, 4, 6, 23]. Pipelines represent critical
infrastructure can create significant social and environmental
impacts, such pipeline exposed to natural disasters (such as
landslides, earthquakes). [3].
Large-scale construction projects are exposed to an
uncertain environment because of such factors as planning and
design complexity, presence of various interest groups (project
owner, owner’s project group, consultants, contractors,
vendors etc.), resources (materials, equipment, funds, etc.)
availability, climatic environment, the economic and political
environment and statutory regulations [30, 31, 23].
Sources of risk and uncertainty always exist in
construction projects and often cause schedule delay or
cost overrun [5, 33, and 36]. Project risk is defined as "the
exposure to loss/gain", "the probability of occurrence of
loss/gain multiplied by its respective magnitude" [15],
Cooper and Chapman [7] define it as “exposure to the
possibility of economic or financial loss or gain, physical
damage or injury, or delay, as a consequence of the
uncertainty associated with pursuing a particular course of
action.” Al-Bahar [2] defines it as “the exposure to the
chance of occurrences of events adversely or favorably
affecting project objectives as a consequence of
uncertainty.
Project management considers risk management as one of
the key knowledge areas for managers [33, 37].
2.1. Risk Management Process
Risks do not exist in isolation but evolve in the context of
a project. In order to reduce the potentially disastrous
consequences of risks, project managers seek to understand
them and deal with them appropriately. Project managers
have given this process the name Project Risk Analysis and
Management (PRAM) [5]. This process can be broken up
into a number of components, identification, assessment,
allocation, mitigation and management.
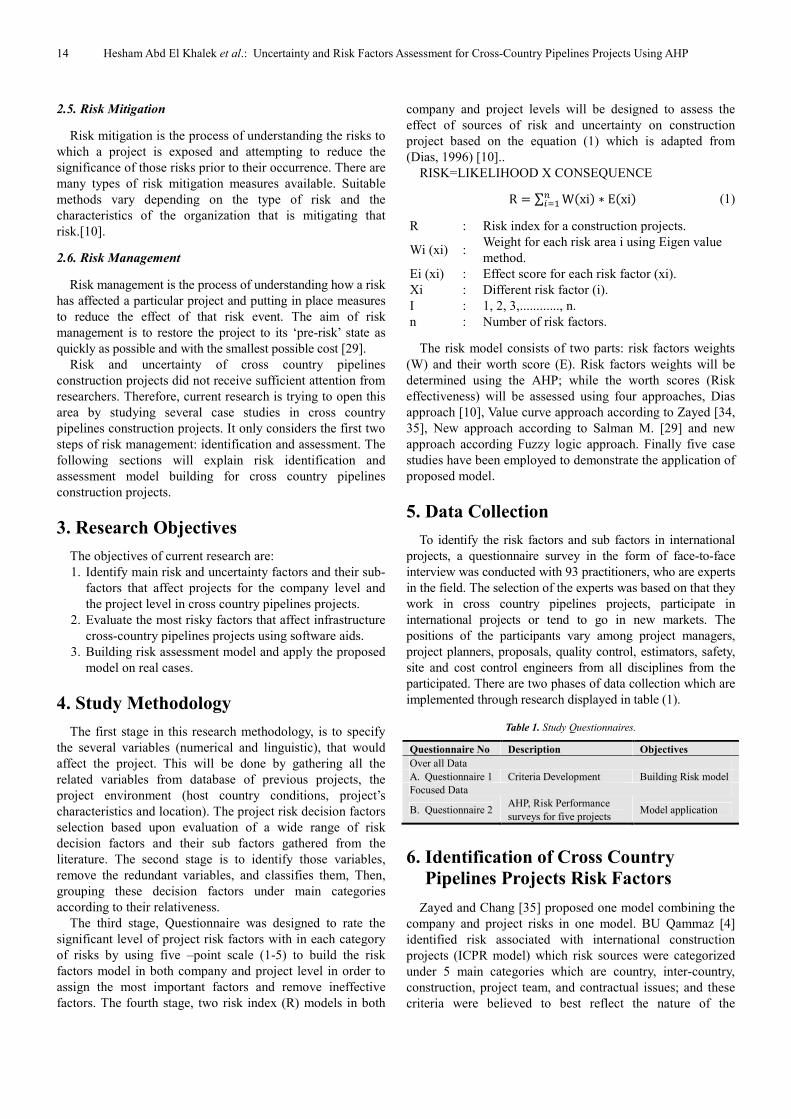
2.2. Risk Identification
The first stage of the risk management process is to
actually identify the relevant risks to the project. Dias A.,
[10] stated the aims of this phase are to: 1. Identify all the
significant types and sources of risk and uncertainty
associated with each of the investment objectives. 2.
Determining Key parameters relating to these objectives
ascertain the causes of each risk.3. Assess how risks are
related to other risks and how risks should be classified and
grouped for evaluation.
There are a number of methods available to project
planners when seeking to identify the relevant risks to their
project. Chapman [5] has assessed the benefits of three of the
most commonly used methods, Brain storming and nominal
group technique and Delphi technique.
Figure 1. The sequence of risk management process.
2.3. Risk Assessment
Risk assessment is the process of reviewing and
understanding risks in order to determine their significance
for the project and its outcomes. This process include
determining the relative importance of all risks which can
impact the project and estimating the probability of the risk
occurring and the likely size of the risk. Risk assessment is
important as it help project developers to concentrate theirre
sources (in terms of both time and money) in the areas where
they can make the most significant contribution to the
eventual project outcome. It also allows project developers to
understand which aspects of the project are the most sensitive
to risk events. There are two types of method which may be
used for risk assessment. [29].
2.4. Risk Allocation
Once project risks have been identified and assessed, they
are usually allocated to one of the parties involved. The party
that becomes responsible for the risk must bear any costs
associated with its crystallization.
14 Hesham Abd El Khalek et al.: Uncertainty and Risk Factors Assessment for Cross-Country Pipelines Projects Using AHP
2.5. Risk Mitigation
Risk mitigation is the process of understanding the risks to
which a project is exposed and attempting to reduce the
significance of those risks prior to their occurrence. There are
many types of risk mitigation measures available. Suitable
methods vary depending on the type of risk and the
characteristics of the organization that is mitigating that
risk.[10].
2.6. Risk Management
Risk management is the process of understanding how a risk
has affected a particular project and putting in place measures
to reduce the effect of that risk event. The aim of risk
management is to restore the project to its ‘pre-risk’ state as
quickly as possible and with the smallest possible cost [29].
Risk and uncertainty of cross country pipelines
construction projects did not receive sufficient attention from
researchers. Therefore, current research is trying to open this
area by studying several case studies in cross country
pipelines construction projects. It only considers the first two
steps of risk management: identification and assessment. The
following sections will explain risk identification and
assessment model building for cross country pipelines
construction projects.
3. Research Objectives
The objectives of current research are:
1. Identify main risk and uncertainty factors and their sub-
factors that affect projects for the company level and
the project level in cross country pipelines projects.
2. Evaluate the most risky factors that affect infrastructure
cross-country pipelines projects using software aids.
3. Building risk assessment model and apply the proposed
model on real cases.
4. Study Methodology
The first stage in this research methodology, is to specify
the several variables (numerical and linguistic), that would
affect the project. This will be done by gathering all the
related variables from database of previous projects, the
project environment (host country conditions, project’s
characteristics and location). The project risk decision factors
selection based upon evaluation of a wide range of risk
decision factors and their sub factors gathered from the
literature. The second stage is to identify those variables,
remove the redundant variables, and classifies them, Then,
grouping these decision factors under main categories
according to their relativeness.
The third stage, Questionnaire was designed to rate the
significant level of project risk factors with in each category
of risks by using five –point scale (1-5) to build the risk
factors model in both company and project level in order to
assign the most important factors and remove ineffective
factors. The fourth stage, two risk index (R) models in both
company and project levels will be designed to assess the
effect of sources of risk and uncertainty on construction
project based on the equation (1) which is adapted from
(Dias, 1996) [10]..
RISK=LIKELIHOOD X CONSEQUENCE
R = ∑ W�xi� ∗ E�xi��� � (1)
R : Risk index for a construction projects.
Wi (xi) : Weight for each risk area i using Eigen value
method.
Ei (xi) : Effect score for each risk factor (xi).
Xi : Different risk factor (i).
I : 1, 2, 3,............, n.
n : Number of risk factors.
The risk model consists of two parts: risk factors weights
(W) and their worth score (E). Risk factors weights will be
determined using the AHP; while the worth scores (Risk
effectiveness) will be assessed using four approaches, Dias
approach [10], Value curve approach according to Zayed [34,
35], New approach according to Salman M. [29] and new
approach according Fuzzy logic approach. Finally five case
studies have been employed to demonstrate the application of
proposed model.
5. Data Collection
To identify the risk factors and sub factors in international
projects, a questionnaire survey in the form of face-to-face
interview was conducted with 93 practitioners, who are experts
in the field. The selection of the experts was based on that they
work in cross country pipelines projects, participate in
international projects or tend to go in new markets. The
positions of the participants vary among project managers,
project planners, proposals, quality control, estimators, safety,
site and cost control engineers from all disciplines from the
participated. There are two phases of data collection which are
implemented through research displayed in table (1).
Table 1. Study Questionnaires.
Questionnaire No Description Objectives
Over all Data
A. Questionnaire 1 Criteria Development Building Risk model
Focused Data
B. Questionnaire 2 AHP, Risk Performance
surveys for five projects Model application
6. Identification of Cross Country
Pipelines Projects Risk Factors
Zayed and Chang [35] proposed one model combining the
company and project risks in one model. BU Qammaz [4]
identified risk associated with international construction
projects (ICPR model) which risk sources were categorized
under 5 main categories which are country, inter-country,
construction, project team, and contractual issues; and these
criteria were believed to best reflect the nature of the
American Journal of Civil Engineering 2016; 4(1): 12-23 15
considered risk sources, The hierarchical representation of
risk sources is known as a hierarchal risk breakdown
structure (HRBS). Many authors proposed different risk
breakdown structures to classify risk in these projects in two
categories, in the company management level and in the
project management level. Company level risks contain risk
factors which connect with the characteristics of the host
country. It concerns the political situation, economic
conditions, unethical practices, legal system maturity, and the
stability and level of security in the country. The factors
considered under this category are: bribery, government
instability, tension/conflicts/terrorism, bureaucratic
difficulties, immaturity/unreliability of legal system, change
of regulations/laws (government interventions), and
instability of economic conditions (inflation/currency
fluctuation) [11, 34, 38].
Different risk breakdown structures to classify risks in
project level were proposed reflecting different experts
opinions [7], In addition Zayed T [34] proposed the more
importance risk factors in the project level concerning
emerging technology usage, contracts and legal issues,
resources, design stage, construction stage, quality, and other
areas, such as weather, natural causes of delay in addition to
physical damages. Based upon literature and cross-country
pipelines projects expert’s opinions in questionnaire forms,
Risk factors classified under to main classes company and
project levels risk factors as displayed in Fig (2).
Twenty two factors have been selected in the company risk
level and thirty three factors have been selected in the project
risk as the most significant factors affecting the project and
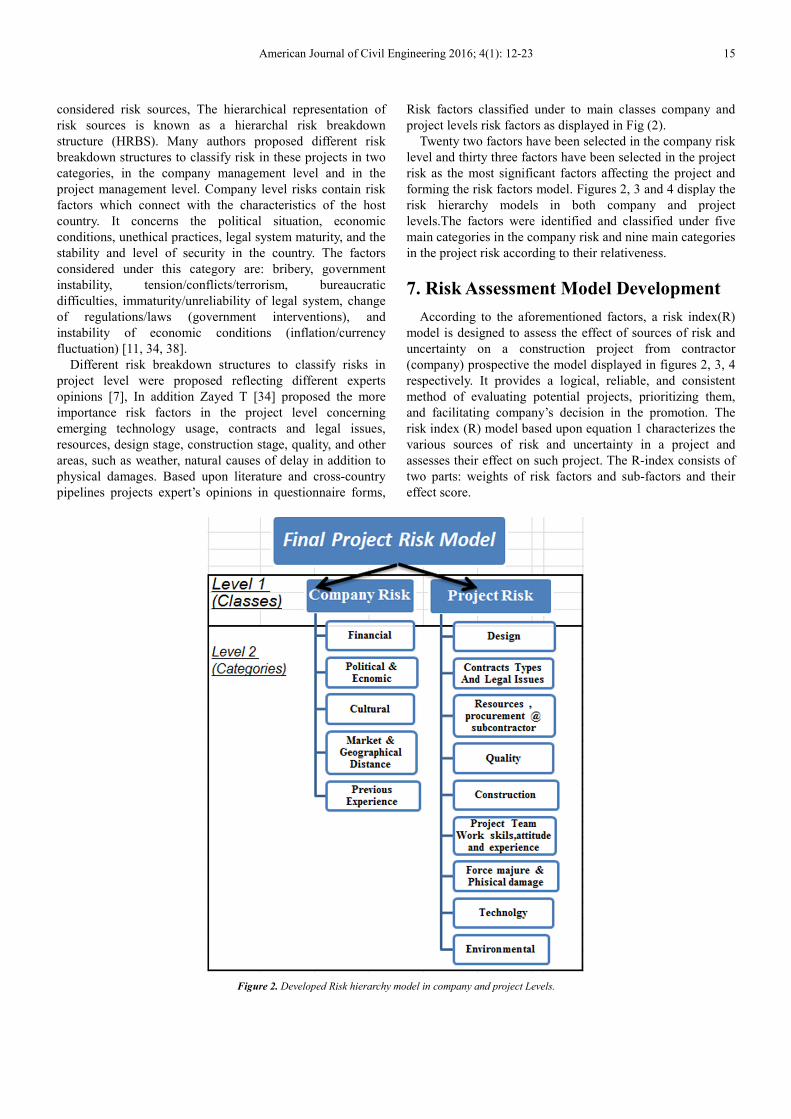
forming the risk factors model. Figures 2, 3 and 4 display the
risk hierarchy models in both company and project
levels.The factors were identified and classified under five
main categories in the company risk and nine main categories
in the project risk according to their relativeness.
7. Risk Assessment Model Development
According to the aforementioned factors, a risk index(R)
model is designed to assess the effect of sources of risk and
uncertainty on a construction project from contractor
(company) prospective the model displayed in figures 2, 3, 4
respectively. It provides a logical, reliable, and consistent
method of evaluating potential projects, prioritizing them,
and facilitating company’s decision in the promotion. The
risk index (R) model based upon equation 1 characterizes the
various sources of risk and uncertainty in a project and
assesses their effect on such project. The R-index consists of
two parts: weights of risk factors and sub-factors and their
effect score.
Figure 2. Developed Risk hierarchy model in company and project Levels.

16 Hesham Abd El Khalek et al.: Uncertainty and Risk Factors Assessment for Cross-Country Pipelines Projects Using AHP
Figure 3. Risk hierarchy model in company Level.
Figure 4. Risk hierarchy model in project Level.
American Journal of Civil Engineering 2016; 4(1): 12-23 17
8. Model Application
8.1. Program Verification for Five Projects
Five projects in different countries were selected to verify
model application, the projects are as follows: 1. Project 1: Nuayyim Field ASL Pipelines project (Saudi
Arabia).
2. Project 2: Habshan Saiem Plant and Pipelines
development (Arab United of Emirates).
3. Project 3: Nasria Pipeline /16 "/ 200km/Oil Pipeline
Company (OPC) (Iraq).
4. Project 4: Sareer Plant / Entisar Field Pipeline 195 KM
(Libya).
5. Project 5: Desouq Fields Development pipelines - 132
Km (Egypt).
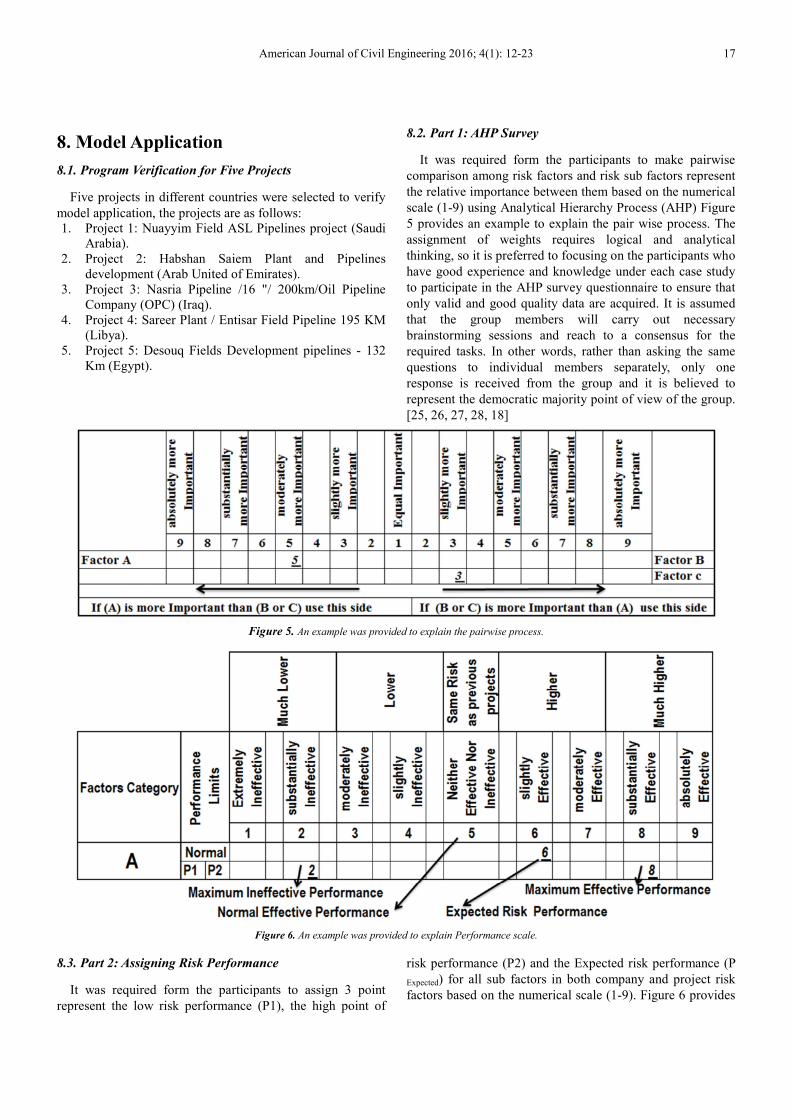
8.2. Part 1: AHP Survey
It was required form the participants to make pairwise
comparison among risk factors and risk sub factors represent
the relative importance between them based on the numerical
scale (1-9) using Analytical Hierarchy Process (AHP) Figure
5 provides an example to explain the pair wise process. The
assignment of weights requires logical and analytical
thinking, so it is preferred to focusing on the participants who
have good experience and knowledge under each case study
to participate in the AHP survey questionnaire to ensure that
only valid and good quality data are acquired. It is assumed
that the group members will carry out necessary
brainstorming sessions and reach to a consensus for the
required tasks. In other words, rather than asking the same
questions to individual members separately, only one
response is received from the group and it is believed to
represent the democratic majority point of view of the group.
[25, 26, 27, 28, 18]
Figure 5. An example was provided to explain the pairwise process.
Figure 6. An example was provided to explain Performance scale.
8.3. Part 2: Assigning Risk Performance
It was required form the participants to assign 3 point
represent the low risk performance (P1), the high point of
risk performance (P2) and the Expected risk performance (P
Expected) for all sub factors in both company and project risk
factors based on the numerical scale (1-9). Figure 6 provides
18 Hesham Abd El Khalek et al.: Uncertainty and Risk Factors Assessment for Cross-Country Pipelines Projects Using AHP
an example to explain Assigning Risk Performance for each
risk factor. The main points in the performance scale are:
Minimum Risk Performance (P1): this point represents
maximum Ineffective risk performance. It indicates the risk
factor impact if things go well (optimistic Impact).
Maximum Risk Performance (P2): this point represents
maximum effective risk performance. It refers to the risk
factor impact if things do not go well (pessimistic Impact).
Expected Risk Performance (P Expected): This point represents
best estimate of the risk impact (most likely impact).
Neither effective nor ineffective point: This point
represents normal risk performance which means the same
risk as previous projects.
Extremely Ineffective: The lowest risk point in the
performance scale. It is means there is extremely no risk.
Absolutely Effective: The highest risk point in the
performance scale. It is means there is extremely high risk.
Excel spread sheet software was designed to solve the
weights, impacts and receive the results obtained from fuzzy
program (Expected Risk Performance (P Expected), hence the
overall risk can be determined based on equation 1 [29, 34]
for four risk evaluation methods.
DIAS approach [10], P2=100 approach [34, 35], P2 only
[29] and new model based on FUZZY LOGIC approach (not
scope of this paper due to limited space reason).
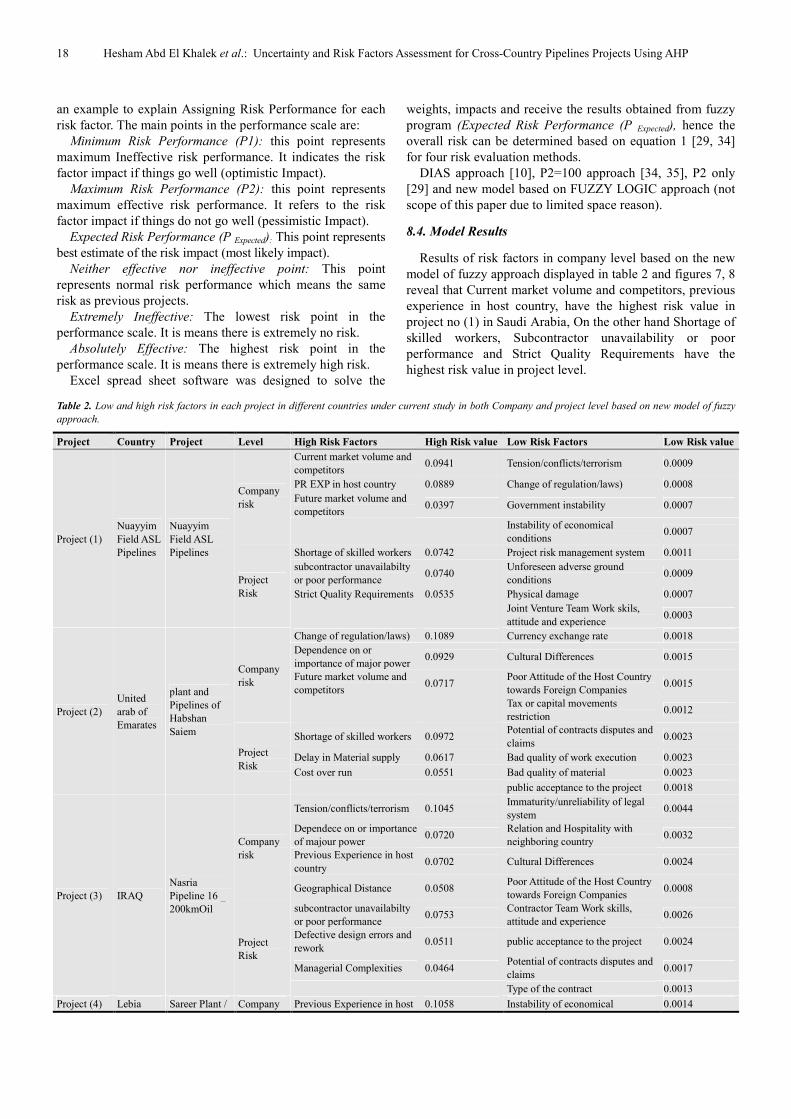
8.4. Model Results
Results of risk factors in company level based on the new
model of fuzzy approach displayed in table 2 and figures 7, 8
reveal that Current market volume and competitors, previous
experience in host country, have the highest risk value in
project no (1) in Saudi Arabia, On the other hand Shortage of
skilled workers, Subcontractor unavailability or poor
performance and Strict Quality Requirements have the
highest risk value in project level.
Table 2. Low and high risk factors in each project in different countries under current study in both Company and project level based on new model of fuzzy
approach.
Project Country Project Level High Risk Factors High Risk value Low Risk Factors Low Risk value
Project (1)
Nuayyim
Field ASL
Pipelines
Nuayyim
Field ASL
Pipelines
Company
risk
Current market volume and
competitors 0.0941 Tension/conflicts/terrorism 0.0009
PR EXP in host country 0.0889 Change of regulation/laws) 0.0008
Future market volume and
competitors 0.0397 Government instability 0.0007
Instability of economical
conditions 0.0007
Project
Risk
Shortage of skilled workers 0.0742 Project risk management system 0.0011
subcontractor unavailabilty
or poor performance 0.0740
Unforeseen adverse ground
conditions 0.0009
Strict Quality Requirements 0.0535 Physical damage 0.0007
Joint Venture Team Work skils,
attitude and experience 0.0003
Project (2)
United
arab of
Emarates
plant and
Pipelines of
Habshan
Saiem
Company
risk
Change of regulation/laws) 0.1089 Currency exchange rate 0.0018
Dependence on or
importance of major power 0.0929 Cultural Differences 0.0015
Future market volume and
competitors 0.0717
Poor Attitude of the Host Country
towards Foreign Companies 0.0015
Tax or capital movements
restriction 0.0012
Project
Risk
Shortage of skilled workers 0.0972 Potential of contracts disputes and
claims 0.0023
Delay in Material supply 0.0617 Bad quality of work execution 0.0023
Cost over run 0.0551 Bad quality of material 0.0023
public acceptance to the project 0.0018
Project (3) IRAQ
Nasria
Pipeline 16 _
200kmOil
Company
risk
Tension/conflicts/terrorism 0.1045 Immaturity/unreliability of legal
system 0.0044
Dependece on or importance
of majour power 0.0720
Relation and Hospitality with
neighboring country 0.0032
Previous Experience in host
country 0.0702 Cultural Differences 0.0024
Geographical Distance 0.0508 Poor Attitude of the Host Country
towards Foreign Companies 0.0008
Project
Risk
subcontractor unavailabilty
or poor performance 0.0753
Contractor Team Work skills,
attitude and experience 0.0026
Defective design errors and
rework 0.0511 public acceptance to the project 0.0024
Managerial Complexities 0.0464 Potential of contracts disputes and
claims 0.0017
Type of the contract 0.0013
Project (4) Lebia Sareer Plant / Company Previous Experience in host 0.1058 Instability of economical 0.0014

American Journal of Civil Engineering 2016; 4(1): 12-23 19
Project Country Project Level High Risk Factors High Risk value Low Risk Factors Low Risk value
Entisar field
Pipeline 195
km
risk country conditions
Current market volume and
competitors 0.0677 Tension/conflicts/terrorism 0.0013
Future market volume and
competitors 0.0478
Relation and hospitality with
neighboring country 0.0007
Government instability 0.0004
Project
Risk
Cost over run 0.0353 Type of the contract 0.0026
Unsuitable Design 0.0291
Conformance to laws Land
regulations/Strict Environment
Regulations
0.0017
Weather and natural Causes
of delay 0.0263 public acceptance to the project 0.0008
Project (5) Egypt
Desouq
Fields
development
pipelines -
132 Km
Company
risk
payment risk 0.0571 Relation and hospitality with
neighboring country 0.0009
Instability of economical
conditions 0.0460
Dependence on or importance of
majour power 0.0009
Previous Experience in zoon
area 0.0158
Interaction of management with
local contracts 0.0007
Project
Risk
Delay in Material supply 0.0680
Conformance to laws Land
regulations/Strict Environment
Regulations
0.0016
Delay in Design and
regularty Approval 0.0322 Physical damage 0.0014
work change order 0.0010
public acceptance to the project 0.0007
Figure 7. Risk attributes values in company level for each project (Model based on fuzzy approach).
20 Hesham Abd El Khalek et al.: Uncertainty and Risk Factors Assessment for Cross-Country Pipelines Projects Using AHP
The Change of regulation/laws, dependence or importance
of major power, Future market volume and competitors,
current market volume and competitors and geographical
distance have the highest risk value in company level in
project no (2) in Emirates, in addition Shortage of skilled
workers and Delay in Material supply have the highest risk
value in project level.
Tension/conflicts/terrorism, dependence on or importance
of major power and previous experience in host country have
the highest risk value in company level in project no (3) in
Iraq, On the other hand subcontractor unavailability or poor
performance and defective design errors and rework have the
highest risk value in project level. previous experience in
host country and Current market volume and competitors
have the highest risk value in company level in project no (4)
in Libya, On the other hand Cost overrun, unsuitable design
and weather and natural Causes of delay have the highest risk
value in project level.
Payment risk and Instability of economic conditions have
the highest risk value in company level in project no (5) in
Egypt, on the other hand delay in material supply and Delay
in Design and regularity Approval have the highest risk value
in project level.
The above analysis indicates that previous experience in
host country attribute, Current market volume and
competitors, The Change of regulation/laws, dependence or
importance of major power and payment risk and Instability
are considered high risk in the five existed profile projects
that mean, the decision makers should concentrate well on
such attributes to decrease their risk before proceeding with
similar to their project. Also The above analysis indicates that
availability of resources factors is considered high risk in the
most existed profile projects that mean, the decision makers
should concentrate well on such attributes to decrease their
risk before proceeding with their project by making sure that
the project local resources are available when needed and the
required imported resources with their paper works (type,
cost, import licenses, taxes, delivery time, etc.,) will be
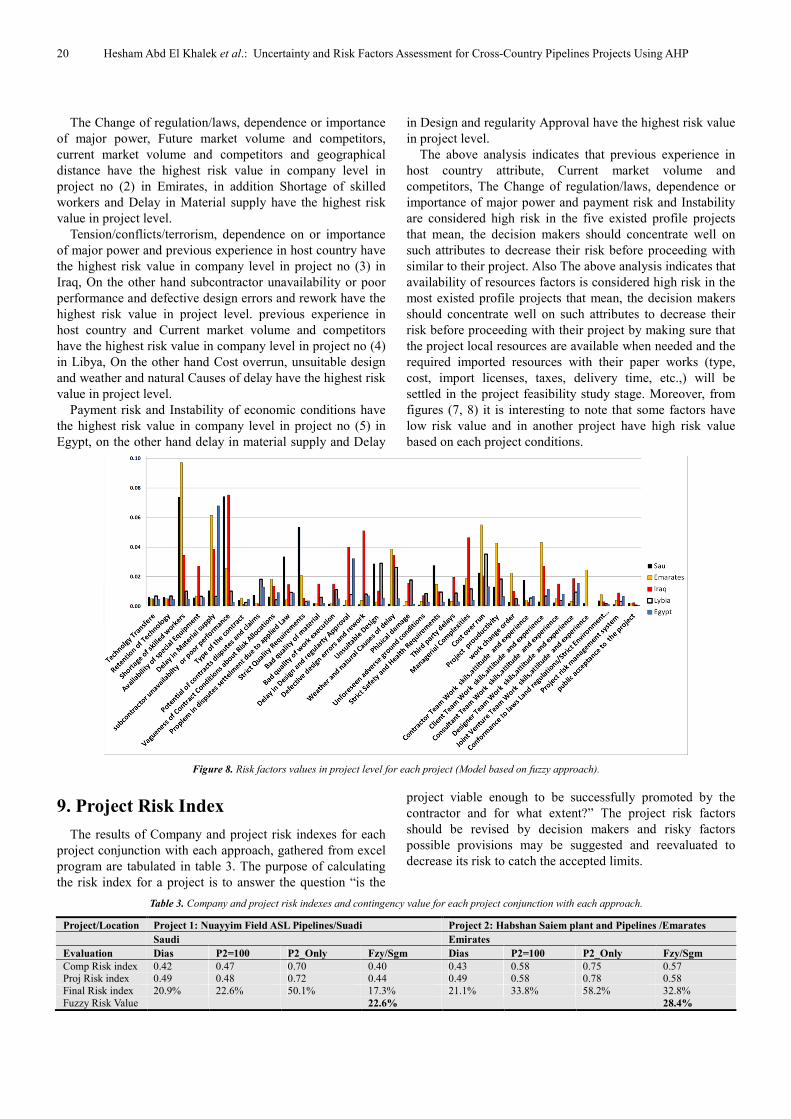
settled in the project feasibility study stage. Moreover, from
figures (7, 8) it is interesting to note that some factors have
low risk value and in another project have high risk value
based on each project conditions.
Figure 8. Risk factors values in project level for each project (Model based on fuzzy approach).
9. Project Risk Index
The results of Company and project risk indexes for each
project conjunction with each approach, gathered from excel
program are tabulated in table 3. The purpose of calculating
the risk index for a project is to answer the question “is the
project viable enough to be successfully promoted by the
contractor and for what extent?” The project risk factors
should be revised by decision makers and risky factors
possible provisions may be suggested and reevaluated to
decrease its risk to catch the accepted limits.
Table 3. Company and project risk indexes and contingency value for each project conjunction with each approach.
Project/Location Project 1: Nuayyim Field ASL Pipelines/Suadi Project 2: Habshan Saiem plant and Pipelines /Emarates
Saudi Emirates
Evaluation Dias P2=100 P2_Only Fzy/Sgm Dias P2=100 P2_Only Fzy/Sgm
Comp Risk index 0.42 0.47 0.70 0.40 0.43 0.58 0.75 0.57 Proj Risk index 0.49 0.48 0.72 0.44 0.49 0.58 0.78 0.58
Final Risk index 20.9% 22.6% 50.1% 17.3% 21.1% 33.8% 58.2% 32.8%
Fuzzy Risk Value 22.6% 28.4%
American Journal of Civil Engineering 2016; 4(1): 12-23 21
Table 3. Continued.
Project /
Location
Project 3: Nasria Pipeline /16 "/ 200km/Oil
Pipeline Company(OPC) /IRAQ
Project 4: Sareer Plant / Entisar field
Pipeline 195 km (Libya)
Project 5: Desouq Fields development
pipelines - 132 Km/Egypt
IRAQ
Libya
Egypt
Evaluation Dias P2=100 P2_Only Fzy/Sgm Dias P2=100 P2_Only Fzy/Sgm Dias P2=100 P2_Only Fzy/Sgm
Comp Risk
index 0.44 0.59 0.78 0.61 0.36 0.39 0.64 0.36 0.31 0.28 0.55 0.19
Proj Risk
index 0.52 0.62 0.80 0.65 0.35 0.34 0.53 0.32 0.46 0.37 0.64 0.27
Final Risk index
22.8% 36.5% 62.0% 39.8% 12.7% 13.4% 34.5% 11.7% 14.3% 10.5% 34.6% 5.2%
Fuzzy Risk
Value 33.6%
19.8%
16.2%
High risk projects may be accepted by decision maker as it
is if the project quantitative factors are feasible enough to
overcome the deficiencies in high qualitative attributes. Table
3 and figures 9, 10, 11 provide the results of risk index for
projects under the study for company and project level and
overall project risk index.
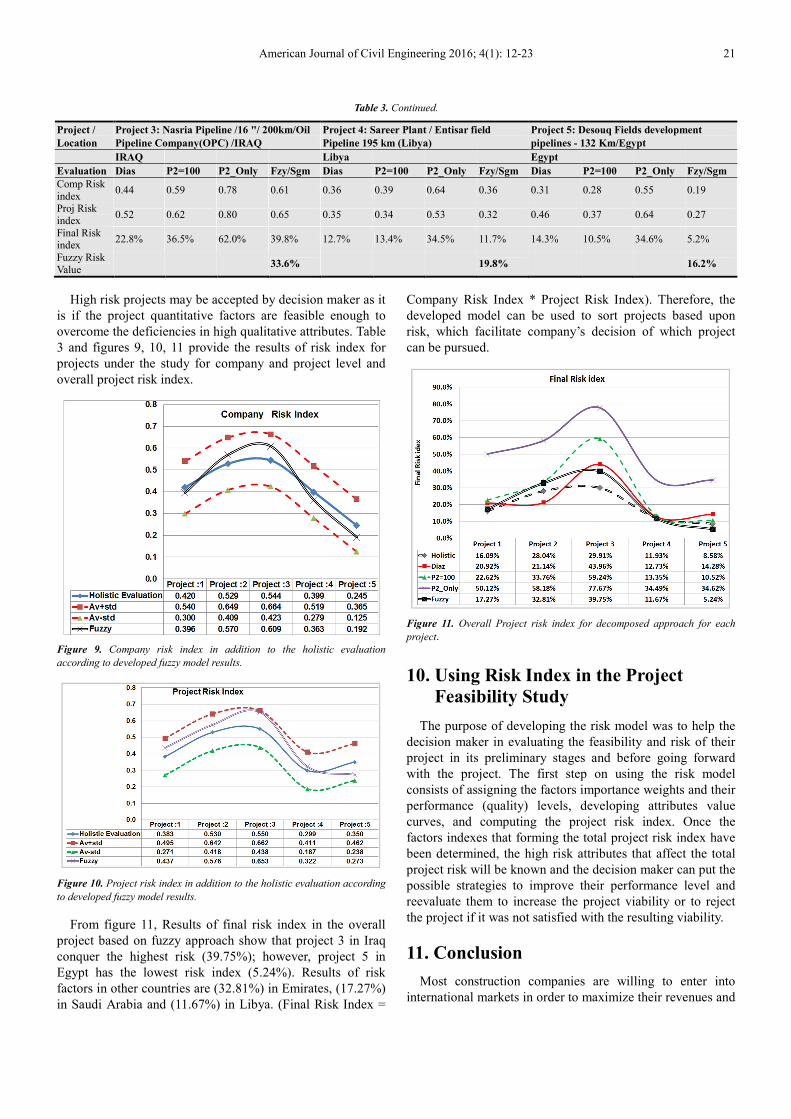
Figure 9. Company risk index in addition to the holistic evaluation
according to developed fuzzy model results.
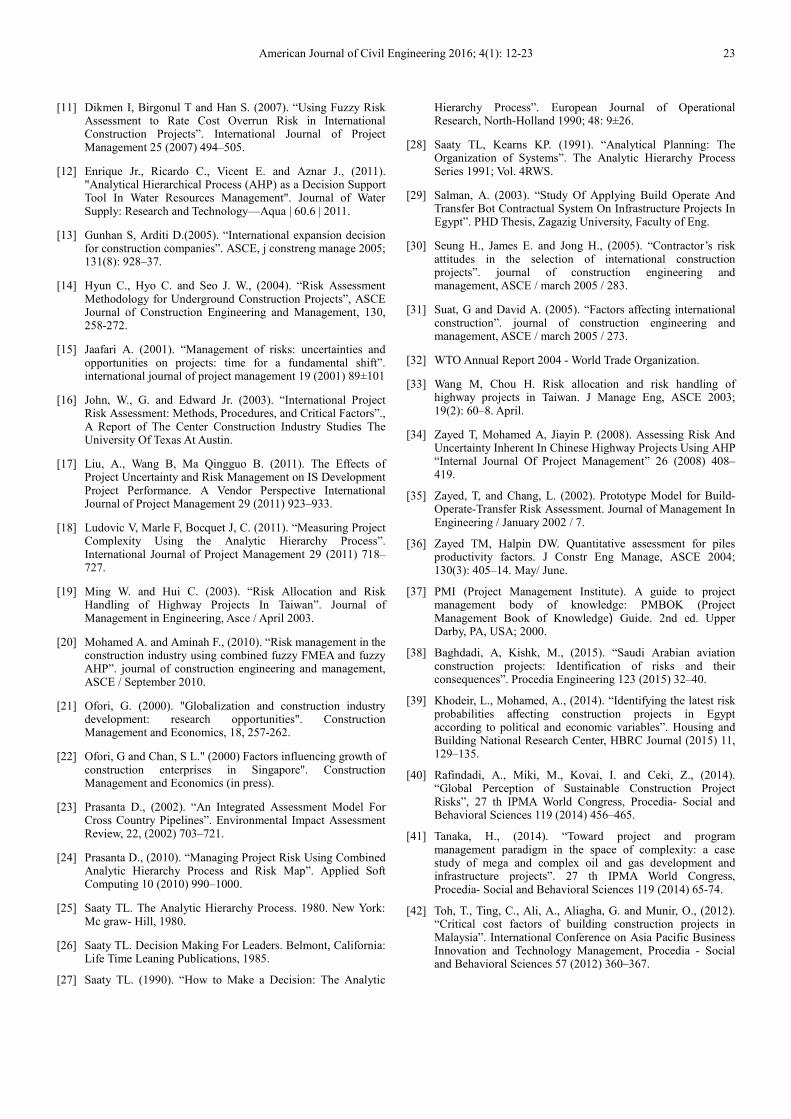
Figure 10. Project risk index in addition to the holistic evaluation according
to developed fuzzy model results.
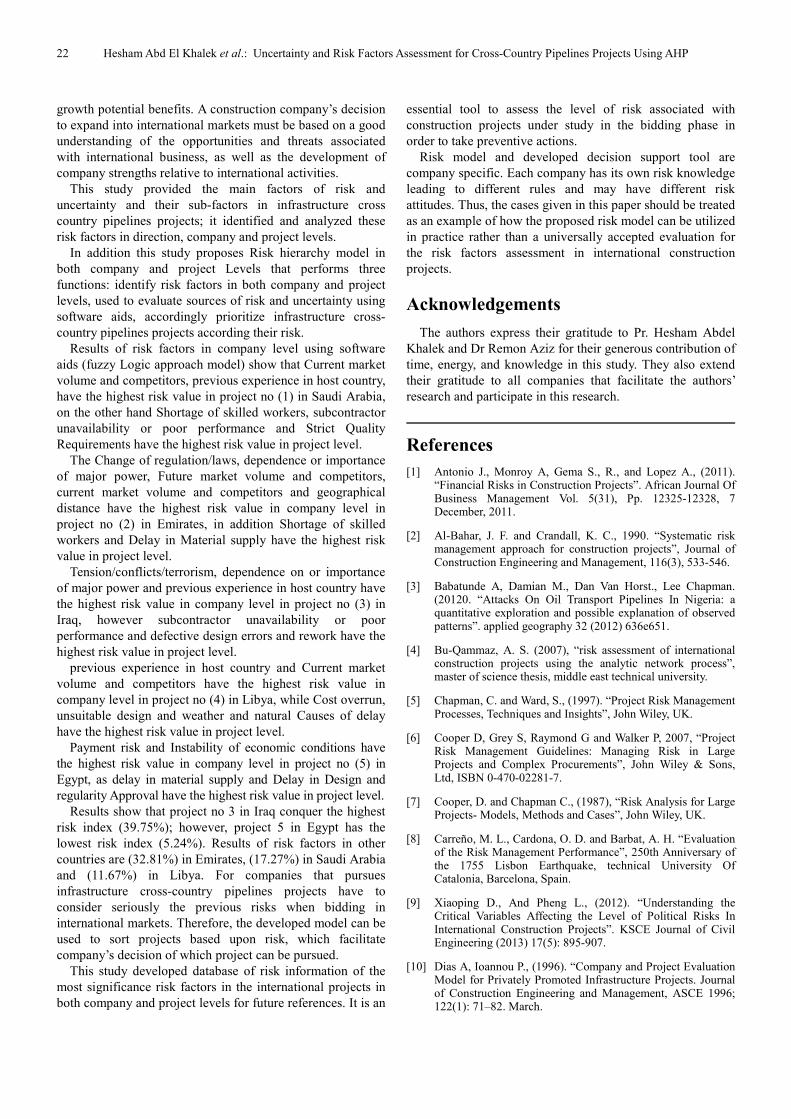
From figure 11, Results of final risk index in the overall
project based on fuzzy approach show that project 3 in Iraq
conquer the highest risk (39.75%); however, project 5 in
Egypt has the lowest risk index (5.24%). Results of risk
factors in other countries are (32.81%) in Emirates, (17.27%)
in Saudi Arabia and (11.67%) in Libya. (Final Risk Index =
Company Risk Index * Project Risk Index). Therefore, the
developed model can be used to sort projects based upon
risk, which facilitate company’s decision of which project
can be pursued.
Figure 11. Overall Project risk index for decomposed approach for each
project.
10. Using Risk Index in the Project
Feasibility Study
The purpose of developing the risk model was to help the
decision maker in evaluating the feasibility and risk of their
project in its preliminary stages and before going forward
with the project. The first step on using the risk model
consists of assigning the factors importance weights and their
performance (quality) levels, developing attributes value
curves, and computing the project risk index. Once the
factors indexes that forming the total project risk index have
been determined, the high risk attributes that affect the total
project risk will be known and the decision maker can put the
possible strategies to improve their performance level and
reevaluate them to increase the project viability or to reject
the project if it was not satisfied with the resulting viability.
11. Conclusion
Most construction companies are willing to enter into
international markets in order to maximize their revenues and
22 Hesham Abd El Khalek et al.: Uncertainty and Risk Factors Assessment for Cross-Country Pipelines Projects Using AHP
growth potential benefits. A construction company’s decision
to expand into international markets must be based on a good
understanding of the opportunities and threats associated
with international business, as well as the development of
company strengths relative to international activities.
This study provided the main factors of risk and
uncertainty and their sub-factors in infrastructure cross
country pipelines projects; it identified and analyzed these
risk factors in direction, company and project levels.
In addition this study proposes Risk hierarchy model in
both company and project Levels that performs three
functions: identify risk factors in both company and project
levels, used to evaluate sources of risk and uncertainty using
software aids, accordingly prioritize infrastructure cross-
country pipelines projects according their risk.
Results of risk factors in company level using software
aids (fuzzy Logic approach model) show that Current market
volume and competitors, previous experience in host country,
have the highest risk value in project no (1) in Saudi Arabia,
on the other hand Shortage of skilled workers, subcontractor
unavailability or poor performance and Strict Quality
Requirements have the highest risk value in project level.
The Change of regulation/laws, dependence or importance
of major power, Future market volume and competitors,
current market volume and competitors and geographical
distance have the highest risk value in company level in
project no (2) in Emirates, in addition Shortage of skilled
workers and Delay in Material supply have the highest risk
value in project level.
Tension/conflicts/terrorism, dependence on or importance
of major power and previous experience in host country have
the highest risk value in company level in project no (3) in
Iraq, however subcontractor unavailability or poor
performance and defective design errors and rework have the
highest risk value in project level.
previous experience in host country and Current market
volume and competitors have the highest risk value in
company level in project no (4) in Libya, while Cost overrun,
unsuitable design and weather and natural Causes of delay
have the highest risk value in project level.
Payment risk and Instability of economic conditions have
the highest risk value in company level in project no (5) in
Egypt, as delay in material supply and Delay in Design and
regularity Approval have the highest risk value in project level.
Results show that project no 3 in Iraq conquer the highest
risk index (39.75%); however, project 5 in Egypt has the
lowest risk index (5.24%). Results of risk factors in other
countries are (32.81%) in Emirates, (17.27%) in Saudi Arabia
and (11.67%) in Libya. For companies that pursues
infrastructure cross-country pipelines projects have to
consider seriously the previous risks when bidding in
international markets. Therefore, the developed model can be
used to sort projects based upon risk, which facilitate
company’s decision of which project can be pursued.
This study developed database of risk information of the
most significance risk factors in the international projects in
both company and project levels for future references. It is an
essential tool to assess the level of risk associated with
construction projects under study in the bidding phase in
order to take preventive actions.
Risk model and developed decision support tool are
company specific. Each company has its own risk knowledge
leading to different rules and may have different risk
attitudes. Thus, the cases given in this paper should be treated
as an example of how the proposed risk model can be utilized
in practice rather than a universally accepted evaluation for
the risk factors assessment in international construction
projects.
Acknowledgements
The authors express their gratitude to Pr. Hesham Abdel
Khalek and Dr Remon Aziz for their generous contribution of
time, energy, and knowledge in this study. They also extend
their gratitude to all companies that facilitate the authors’
research and participate in this research.
References
[1] Antonio J., Monroy A, Gema S., R., and Lopez A., (2011). “Financial Risks in Construction Projects”. African Journal Of Business Management Vol. 5(31), Pp. 12325-12328, 7 December, 2011.
[2] Al-Bahar, J. F. and Crandall, K. C., 1990. “Systematic risk management approach for construction projects”, Journal of Construction Engineering and Management, 116(3), 533-546.
[3] Babatunde A, Damian M., Dan Van Horst., Lee Chapman. (20120. “Attacks On Oil Transport Pipelines In Nigeria: a quantitative exploration and possible explanation of observed patterns”. applied geography 32 (2012) 636e651.
[4] Bu-Qammaz, A. S. (2007), “risk assessment of international construction projects using the analytic network process”, master of science thesis, middle east technical university.
[5] Chapman, C. and Ward, S., (1997). “Project Risk Management Processes, Techniques and Insights”, John Wiley, UK.
[6] Cooper D, Grey S, Raymond G and Walker P, 2007, “Project Risk Management Guidelines: Managing Risk in Large Projects and Complex Procurements”, John Wiley & Sons, Ltd, ISBN 0-470-02281-7.
[7] Cooper, D. and Chapman C., (1987), “Risk Analysis for Large Projects- Models, Methods and Cases”, John Wiley, UK.
[8] Carreño, M. L., Cardona, O. D. and Barbat, A. H. “Evaluation of the Risk Management Performance”, 250th Anniversary of the 1755 Lisbon Earthquake, technical University Of Catalonia, Barcelona, Spain.
[9] Xiaoping D., And Pheng L., (2012). “Understanding the Critical Variables Affecting the Level of Political Risks In International Construction Projects”. KSCE Journal of Civil Engineering (2013) 17(5): 895-907.
[10] Dias A, Ioannou P., (1996). “Company and Project Evaluation Model for Privately Promoted Infrastructure Projects. Journal of Construction Engineering and Management, ASCE 1996; 122(1): 71–82. March.
American Journal of Civil Engineering 2016; 4(1): 12-23 23
[11] Dikmen I, Birgonul T and Han S. (2007). “Using Fuzzy Risk Assessment to Rate Cost Overrun Risk in International Construction Projects”. International Journal of Project Management 25 (2007) 494–505.
[12] Enrique Jr., Ricardo C., Vicent E. and Aznar J., (2011). "Analytical Hierarchical Process (AHP) as a Decision Support Tool In Water Resources Management". Journal of Water Supply: Research and Technology—Aqua | 60.6 | 2011.
[13] Gunhan S, Arditi D.(2005). “International expansion decision for construction companies”. ASCE, j constreng manage 2005; 131(8): 928–37.
[14] Hyun C., Hyo C. and Seo J. W., (2004). “Risk Assessment Methodology for Underground Construction Projects”, ASCE Journal of Construction Engineering and Management, 130, 258-272.
[15] Jaafari A. (2001). “Management of risks: uncertainties and opportunities on projects: time for a fundamental shift”. international journal of project management 19 (2001) 89±101
[16] John, W., G. and Edward Jr. (2003). “International Project Risk Assessment: Methods, Procedures, and Critical Factors”., A Report of The Center Construction Industry Studies The University Of Texas At Austin.
[17] Liu, A., Wang B, Ma Qingguo B. (2011). The Effects of Project Uncertainty and Risk Management on IS Development Project Performance. A Vendor Perspective International Journal of Project Management 29 (2011) 923–933.
[18] Ludovic V, Marle F, Bocquet J, C. (2011). “Measuring Project Complexity Using the Analytic Hierarchy Process”. International Journal of Project Management 29 (2011) 718–727.
[19] Ming W. and Hui C. (2003). “Risk Allocation and Risk Handling of Highway Projects In Taiwan”. Journal of Management in Engineering, Asce / April 2003.
[20] Mohamed A. and Aminah F., (2010). “Risk management in the construction industry using combined fuzzy FMEA and fuzzy AHP”. journal of construction engineering and management, ASCE / September 2010.
[21] Ofori, G. (2000). "Globalization and construction industry development: research opportunities". Construction Management and Economics, 18, 257-262.
[22] Ofori, G and Chan, S L." (2000) Factors influencing growth of construction enterprises in Singapore". Construction Management and Economics (in press).
[23] Prasanta D., (2002). “An Integrated Assessment Model For Cross Country Pipelines”. Environmental Impact Assessment Review, 22, (2002) 703–721.
[24] Prasanta D., (2010). “Managing Project Risk Using Combined Analytic Hierarchy Process and Risk Map”. Applied Soft Computing 10 (2010) 990–1000.
[25] Saaty TL. The Analytic Hierarchy Process. 1980. New York: Mc graw- Hill, 1980.
[26] Saaty TL. Decision Making For Leaders. Belmont, California: Life Time Leaning Publications, 1985.
[27] Saaty TL. (1990). “How to Make a Decision: The Analytic
Hierarchy Process”. European Journal of Operational Research, North-Holland 1990; 48: 9±26.
[28] Saaty TL, Kearns KP. (1991). “Analytical Planning: The Organization of Systems”. The Analytic Hierarchy Process Series 1991; Vol. 4RWS.
[29] Salman, A. (2003). “Study Of Applying Build Operate And Transfer Bot Contractual System On Infrastructure Projects In Egypt”. PHD Thesis, Zagazig University, Faculty of Eng.
[30] Seung H., James E. and Jong H., (2005). “Contractor’s risk attitudes in the selection of international construction projects”. journal of construction engineering and management, ASCE / march 2005 / 283.
[31] Suat, G and David A. (2005). “Factors affecting international construction”. journal of construction engineering and management, ASCE / march 2005 / 273.
[32] WTO Annual Report 2004 - World Trade Organization.
[33] Wang M, Chou H. Risk allocation and risk handling of highway projects in Taiwan. J Manage Eng, ASCE 2003; 19(2): 60–8. April.
[34] Zayed T, Mohamed A, Jiayin P. (2008). Assessing Risk And Uncertainty Inherent In Chinese Highway Projects Using AHP “Internal Journal Of Project Management” 26 (2008) 408–419.
[35] Zayed, T, and Chang, L. (2002). Prototype Model for Build-Operate-Transfer Risk Assessment. Journal of Management In Engineering / January 2002 / 7.
[36] Zayed TM, Halpin DW. Quantitative assessment for piles productivity factors. J Constr Eng Manage, ASCE 2004; 130(3): 405–14. May/ June.
[37] PMI (Project Management Institute). A guide to project management body of knowledge: PMBOK (Project Management Book of Knowledge ) Guide. 2nd ed. Upper Darby, PA, USA; 2000.
[38] Baghdadi, A, Kishk, M., (2015). “Saudi Arabian aviation construction projects: Identification of risks and their consequences”. Procedia Engineering 123 (2015) 32–40.
[39] Khodeir, L., Mohamed, A., (2014). “Identifying the latest risk probabilities affecting construction projects in Egypt according to political and economic variables”. Housing and Building National Research Center, HBRC Journal (2015) 11, 129–135.
[40] Rafindadi, A., Miki, M., Kovai, I. and Ceki, Z., (2014). “Global Perception of Sustainable Construction Project Risks”, 27 th IPMA World Congress, Procedia- Social and Behavioral Sciences 119 (2014) 456–465.
[41] Tanaka, H., (2014). “Toward project and program management paradigm in the space of complexity: a case study of mega and complex oil and gas development and infrastructure projects”. 27 th IPMA World Congress, Procedia- Social and Behavioral Sciences 119 (2014) 65-74.
[42] Toh, T., Ting, C., Ali, A., Aliagha, G. and Munir, O., (2012). “Critical cost factors of building construction projects in Malaysia”. International Conference on Asia Pacific Business Innovation and Technology Management, Procedia - Social and Behavioral Sciences 57 (2012) 360–367.