Embed Size (px)
Citation preview

Uncertainty and Risk Analysis of Pakistan’s Regional Trade: Fan
Chart Approach
Syed Tehseen Jawaid ∗ Abdul Waheed †
Abstract: Economic forecasting, both specific and general, is a crucial part of economic plan-ning for a country. It is required to effectively deal with uncertainity as well as possible negativeimpact of proposed policies in future. Therefore, correct predictions will improve the effectivenessof the decision-making process. This study is a pioneering attempt to forecast aggregate and re-gional trade of Pakistan by using annual time series data from 1974 to 2014. With the help offan chart, aggregate and regional trade of Pakistan have been forecast from 2015 to 2020. Fanchart provides ranges of forecast at different levels of significance as well as assesses. The riskassociated with the forecast value, namely upside and downside risk. The results suggest that thereis considerable uncertainty associated with the regional trade of Pakistan. The policy makers aresuggested to monitor downside risk associated with the exports and upside risk associated with theimports of the country.
Keywords: Forecasting, Trade, Fan Chart, Risk, Pakistan.
Introduction
Economic integration is conducive for enhancing growth and development in the developing coun-tries. It also offers important advantages including lower risk associated with investment, lowertransaction cost of business, market’s expansion, pooling of regional resources, economies of scaleand efficient allocation of resources. Still, it is unquestionable that most favorable economic poli-cies are required to achieve these advantages. Additionally, regional trade also elevate numberof other than economic issues like regional security and political contacts amid regional coun-tries (Carbaugh, 2004; Raza & Karim, 2017). Like many other developing countries, Pakistan isactively pursuing the policy of enhancing regional economic cooperation.
Statistics show that Pakistan’s trade agreements have significantly impacted its trade which haswitnessed a substantial increase over time. With the help of these trade relationships, economicdevelopment can be further enhanced in the country. For better economic performance of thecountry, there is need to forecast aggregate and regional trade to make policies that enhancegrowth and sustain development in the country in future. A number of studies link trades withother aspects of Pakistan’s economy (Jawaid, 2014; Shahbaz, 2012; Hye, 2012; Gul & Yasin, 2011;Muhammad, 2010; Zaman, 2010; Ullah, Zaman, Farooq, & Javid, 2009; Din, Ghani, & Siddique,2003). Some studies forecast trade volume at aggregate level and commodity level. Iqbal, Bakhsh,
∗Assistant Professor/Research Economist, Applied Economics Research Centre, University of Karachi.E-mail:[email protected] paper is a part of Chapter 2 of Syed Tehseen Jawaid’s Ph.D. Dissertation.†Associate Professor, Department of Economics & Finance, University of Bahrain.
55
Journal of Management SciencesVol. 4(1): 55-81, 2017DOI: 10.20547/jms.2014.1704104

Journal of Management Sciences
Maqbool, and Ahmad (2005) forecast the production and area of wheat in Pakistan by employingARIMA model. Results indicated that production of wheat would be 29774.8 thousand tonsin 2022. On the other hand, area for wheat production would be 8475.1 thousand hectares.Ahmad and Mustafa (2006) forecast production of oranges in Pakistan. They used ARIMAmodel for forecasting and predicted the production of 2617.45 thousand tons in the year 2023.Khan, Mustafa, Shah, Khan, and Khan (2008) forecast the production of mangoes in Pakistan byemploying ARIMA model, suggesting that production of mangoes would be 1431010 metric tonsin 2024. They predicted that mangoes would be available for consumption as well as export. Naz(2013) predicted the date export from Pakistan using ARIMA model. Results indicated that dateexports of Pakistan would be 130622 thousand tons in 2025.
Additionally, Ghafoor and Hanif (2005) forecast aggregate exports and imports of Pakistan byemploying ARIMA estimation procedure. Findings suggested that exports of Pakistan would beRs. 418.46 billion, while imports would be Rs. 550.08 billion in 2010. Mehmood and Ahmad (2012)estimated Pakistan’s exports to SAARC countries by employing ARIMA estimation. Resultsrevealed that Pakistan’s exports to SAARC countries would be worth Rs. 442.07 billion in 2025. Itwas also predicted that Pakistan’s export to SAARC countries would increase by Rs. 27.63 billionper year from 2010 to 2025. Farooqi (2014) forecast aggregate exports and imports of Pakistanby using ARIMA estimation. Results showed that Pakistan’s exports and imports would be ofRs. 403.11 billion and Rs. 496.95 billion respectively in 2018. However, only residual uncertaintyin considered in ARIMA forecasting, and uncertainty in parameters is ignored (Fuller & Hasza,1981; De Luna, 2000). On the other hand, density forecast considers both shock and parameteruncertainty (Akram, Binning, & Maih, 2016). It is highly doubtful that the outcome overlapsexactly in case of point forecast, so provideing range of uncertainties will be helpful for policymakers to make favorable policies. There are some recent studies that have used Fan chart forforecasting, such as Dowd, Blake, and Cairns (2016), Castillo (2016) and Fukac and Kirkby (2017).Therefore, the objective of the study is to forecast Pakistan’s regional trade with Organization ofIslamic Cooperation (OIC), Organization for Economic Cooperation and Development (OECD)countries, South Asian Association for Regional Cooperation (SAARC) countries, and Associationof South East Asian Nation (ASEAN) countries which have not been forecast before, specificallywith an advanced econometric technique like Fan chart. The reason behind the selection of theseregions is the hugh percentage share of exports to these regions from Pakistan, which is 78.55percent of total Pakistani exports on average from 1974 to 2014. Similarly, the percentage shareof imports from these regions to Pakistan is 80 percent of the total Pakistani imports on averagefrom 1974 to 2014. These regions have covered almost 80% of Pakistan’s trade 1.
To achieve the objective of the study, we have used a newly developed technique namely FanChart based on density forecast. Fan chart is a useful tool to forecast with expected uncertain-ties. There are some other methods of forecasting like seasonal moving average and exponentialsmoothing, but uncertainty has not been incorporated in them unlike Fan chart.
Contextual Discussion
In this section, there is brief discussion about regions under consideration in the study namelyOIC, OECD, SAARC, and ASEAN.
1Authors’ estimation on the basis of Pakistan Economics Survey (various issues)
56
Journal of Management Sciences
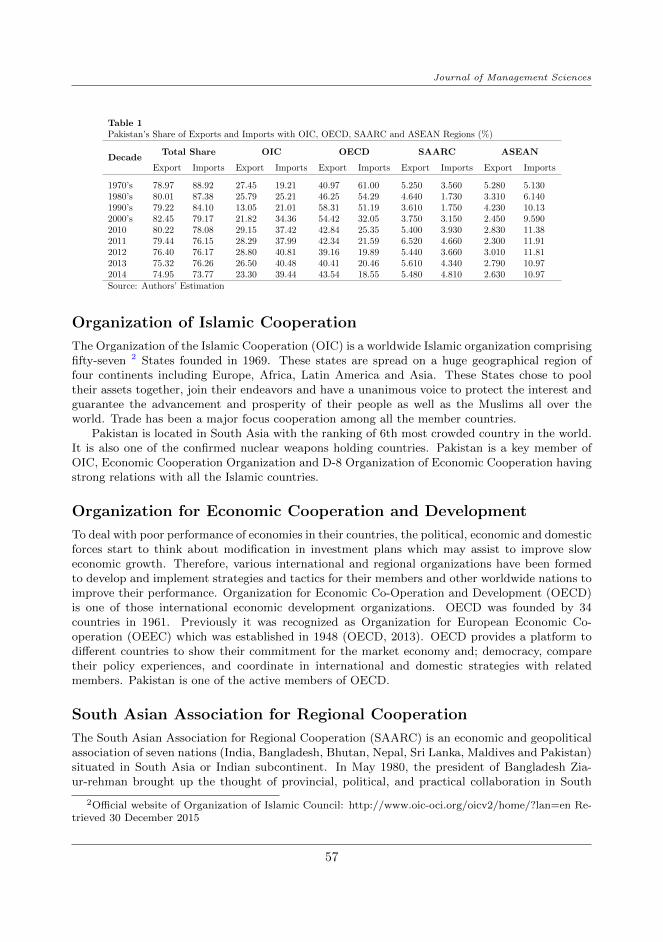
Table 1Pakistan’s Share of Exports and Imports with OIC, OECD, SAARC and ASEAN Regions (%)
DecadeTotal Share OIC OECD SAARC ASEAN
Export Imports Export Imports Export Imports Export Imports Export Imports
1970’s 78.97 88.92 27.45 19.21 40.97 61.00 5.250 3.560 5.280 5.1301980’s 80.01 87.38 25.79 25.21 46.25 54.29 4.640 1.730 3.310 6.1401990’s 79.22 84.10 13.05 21.01 58.31 51.19 3.610 1.750 4.230 10.132000’s 82.45 79.17 21.82 34.36 54.42 32.05 3.750 3.150 2.450 9.5902010 80.22 78.08 29.15 37.42 42.84 25.35 5.400 3.930 2.830 11.382011 79.44 76.15 28.29 37.99 42.34 21.59 6.520 4.660 2.300 11.912012 76.40 76.17 28.80 40.81 39.16 19.89 5.440 3.660 3.010 11.812013 75.32 76.26 26.50 40.48 40.41 20.46 5.610 4.340 2.790 10.972014 74.95 73.77 23.30 39.44 43.54 18.55 5.480 4.810 2.630 10.97Source: Authors’ Estimation
Organization of Islamic Cooperation
The Organization of the Islamic Cooperation (OIC) is a worldwide Islamic organization comprisingfifty-seven 2 States founded in 1969. These states are spread on a huge geographical region offour continents including Europe, Africa, Latin America and Asia. These States chose to pooltheir assets together, join their endeavors and have a unanimous voice to protect the interest andguarantee the advancement and prosperity of their people as well as the Muslims all over theworld. Trade has been a major focus cooperation among all the member countries.
Pakistan is located in South Asia with the ranking of 6th most crowded country in the world.It is also one of the confirmed nuclear weapons holding countries. Pakistan is a key member ofOIC, Economic Cooperation Organization and D-8 Organization of Economic Cooperation havingstrong relations with all the Islamic countries.
Organization for Economic Cooperation and Development
To deal with poor performance of economies in their countries, the political, economic and domesticforces start to think about modification in investment plans which may assist to improve sloweconomic growth. Therefore, various international and regional organizations have been formedto develop and implement strategies and tactics for their members and other worldwide nations toimprove their performance. Organization for Economic Co-Operation and Development (OECD)is one of those international economic development organizations. OECD was founded by 34countries in 1961. Previously it was recognized as Organization for European Economic Co-operation (OEEC) which was established in 1948 (OECD, 2013). OECD provides a platform todifferent countries to show their commitment for the market economy and; democracy, comparetheir policy experiences, and coordinate in international and domestic strategies with relatedmembers. Pakistan is one of the active members of OECD.
South Asian Association for Regional Cooperation
The South Asian Association for Regional Cooperation (SAARC) is an economic and geopoliticalassociation of seven nations (India, Bangladesh, Bhutan, Nepal, Sri Lanka, Maldives and Pakistan)situated in South Asia or Indian subcontinent. In May 1980, the president of Bangladesh Zia-ur-rehman brought up the thought of provincial, political, and practical collaboration in South
2Official website of Organization of Islamic Council: http://www.oic-oci.org/oicv2/home/?lan=en Re-trieved 30 December 2015
57
Journal of Management Sciences
Asia. Therefore, the first summit was held in Dhaka on 8 December 1985, when the associationwas secured by the legislatures of eight countries. The association has been extended by includingAfghanistan as one new member as well as a few observer states including China, EuropeanUnion, Japan, Australia, Myanmar, USA, Iran, Mauritius, and South Korea 3. The SAARC plansto advance welfare financial matters and; cooperative self-assurance among the nations of SouthAsia, and to speed up socio-economic growth in the region.
The SAARC has created outer relations by creating changeless political relations with theUN as an observer, the EU and other multilateral bodies. Official gatherings of the pioneers ofevery country are held on annually, whilst the outside priests meet bi-annually. The 18th SAARCSummit was held in Kathmandu in November 2014.
Association of South East Asian Nation
The ASEAN was established on 8 august 1967 with its headquarter in Jakarta Indonesia, forpolitical and economic collaboration by the joint venture of ten Southeast Asian countries includingIndonesia, Malaysia, Philippines, Singapore, Thailand, Brunei, Cambodia, Laos, Myanmar, andVietnam. The main purpose of ASEAN is to enhance social progress, economic growth and socio-cultural revolution, protect regional peace and stability, and provide opportunities to membercountries for discussion on differences peacefully.
Pakistan’s Regional Trade Performance
There are a number of aspects through which a country’s performance has been observed. In thissection, some trade related aspects have been discussed in the context of Pakistan. In addition,we will discuss Pakistan’s trade performance with selected regions namely OIC, OECD, ASEAN,and SAARC.
The balance of payments is seen as an essential marker of the developing financial activitiesin all the countries. Therefore, the balance of payments is the measurable (Statistical) record ofall transactions occurring between a country’s inhabitants and rest of the world in a particularperiod. The balance of payments has been a sign of trouble in developing countries, particularlyin Pakistan, where it has been a serious issue in the recent times.
Pakistan has been experiencing trade deficits since 1947. As it is a developing country, thebalance of payments has not been very sustainable. Pakistan’s visible and invisible imports haveexceed its exports throughout the years, except during a brief period of 1951 to 1957 and the year1973 4.
It has been observed that five primary commodities including raw jute, raw wool, hides, cotton,and tea accounted for 99% of Pakistan’s export earnings since the time of independence till 1949.In this way, Pakistan fits the unusual example as an unindustrialized undeveloped nation, and thecause of this accomplishment was delivering and sending out just Primary items and primarilyreliant on sufficient climatic conditions in the early years. Pakistan’s economic strategies movedtowards an accentuation on industrialization which became the catalyst for an economic change.thus,the 99% contribution of 5 main commodities had fallen to 75% in 1958-9 and the main causewas the shift in the direction of trade towards dependence on Indian imported goods includingcotton yarn, consumer goods, and textiles (Zaidi, 2005).
3(SAARC Summit press, 2013)4Handbook of Statistics of Pakistan Economy (2015) p. 790
58
Journal of Management Sciences
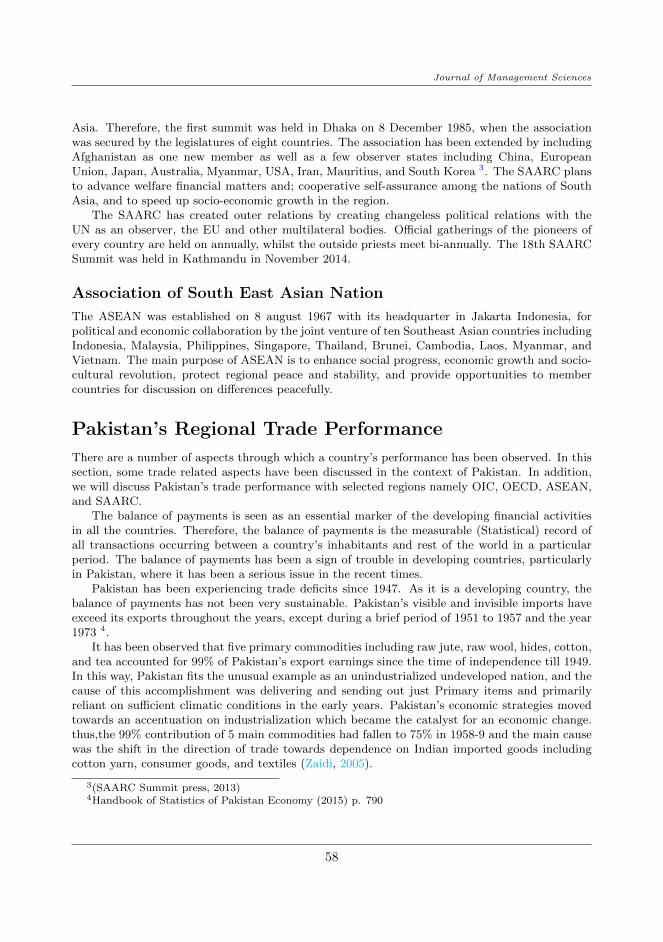
The importance of industry was further recognized in the era of growth under Ayub Khan andthe way of production changed. Pakistan started to export outside the developed countries, whilethe developed nations now had a decision to purchase products from different sources. Figure 1 isa synopsis of balance of trade from 1974 to 2014, demonstrating the main earnings and expensesassociated with exports and imports respectively. The trade balance has generally been in thenegative, suggesting that imports have been more prominent than exports.
Furthermore, the details of Pakistan’s imports and exports from 1974 to 2014 (latest statis-tics available) are shown through Figure 1. This Figure demonstrates that Pakistan’s total tradecomprising of real imports and real exports has increased about 872 percent from 1974 to 2014.
Figure 1
Exports, Imports, and Trade Balance 1974-2014 (Million Rs)
Furthermore, the details of Pakistan’s imports and exports from 1974 to 2014 (latest statisticsavailable) are shown through Figure 1. This figure demonstrates that Pakistan’s trade (realimports and real exports) has increased by about 872 percent from 1974 to 2014. It can beobserved that from 2005-14 the trade deficit has increased compared to previous 10 years largelydriven by the import of consumer items and higher international crude oil. Hence Figure 1 suggeststhat the balance of trade has been pessimistic in Pakistan as its imports are more than its export.
Additionally, the changing pattern of exports and imports from 1974 to 2014 can be easilyobserved through Figure 2 & 3 respectively. It can be seen that manufactured goods contributed70%, primary commodities 16% and semi-manufacturer, 14% to the total exports of Pakistan in2014.
59

Journal of Management Sciences
Figure 2
Economic Classification of Exports (in percentage)
Figure 3
Economic Classification of Imports (in percentage)
On the other hand, consumer goods contributed 17%, capital goods 23%, industrial raw materialof capital good 7%, whereas industrial raw material of consumer good iscontributed the largestshare at 53% to the imports of Pakistan in 2014.
Foreign exchange reserves (FER) are considered a measure of financial strength of a country.Figure 5 shows volatility in Pakistan’s foreign exchange reserve throughout the period. There is
60

Journal of Management Sciences
an increase in foreign exchange reserve during 2001 to 2004, 2006 and 2008 to 2011. On the otherhand, there is sharp decline in 2007-2008 and after 2011. It has increased in 2014.
Figure 4
Foreign Exchange Reserve (Rs. Millions)
Pakistan-OIC trade has always played a vital role in Pakistan’s international trade. Pakistan’sexports have considerably increased in the last decade with these countries. Imports have alsoincreased at a high rate in these years. Among these countries, U.A.E has 9% and 7% share oftotal exports in 2010 and 2014 respectively 5.
Pakistan’s trade performance with SAARC countries is in a better condition. Here deficit hasnot increased consistently, instead Pakistan has enjoyed trade surplus in some years between 1975to 2000 and in 2003. However, after 2003, Pakistan has been facing trade deficit continuously.
Pakistan’s trade performance with ASEAN countries is not healthy. Here deficit has increasedconsistently from 1974 trade deficit has increased to 2005. Trade surplus has been noticed in 2006and after 2006, Pakistan has been facing drastic escalation in trade deficit.
5Pakistan Economic Survey 2014-15, p. 143
61

Journal of Management Sciences
Figure 5
Exports, Imports and Trade Balance with OIC Countries (Millions Rs.)
Figure 6Exports, Imports and Trade Balance with OECD Countries (Millions Rs.)
62

Journal of Management Sciences
Figure 7Exports, Imports and Trade Balance with SAARC Countries (Millions Rs.)
Figure 8Exports, Imports and Trade Balance with ASEAN Countries (Millions Rs.)
63

Journal of Management Sciences
Methodology
Economic forecast fundamentally faces the problem of uncertainty. Nobody can predict futurewith complete certainty because forecast is always bound by different assumptions and a varietyof upside and downside risks. The uncertainty is one of the main causes of bad forecast outcomesand it can even cause major failures in forecasting. Although forecasting methodologies havedeveloped extensively, the problem of uncertainty has not been resolved efficiently in economicforecasting.
Fan chart is a device that can represent uncertainty conditions over time. The fan chartuses different type of lines and shades in graphical representation of the density forecast to showdifferent percentiles of estimated probability distribution. When forecast uncertainties increaseover time, the band for same percentile becomes broader, making the presentation of the graphappear like a wider fan over time.
Fan chart has become a popular technique for economists in forecasting economic indicators.The monetary policy committee of Bank of England used fan chart for the first time in its inflationreport published in 1996. Since then, fan chart has been extensively used to forecast other aspectsof economy including prediction of growth rate of gross domestic product and other indicators.Since 2006, International Monetary Fund (IMF) has also used Fan chart for world GDP growthforecast. In this study, growth in aggregate and regional trade is forecast for the period of 2015to 2020.
By employing the methodology of Kannan and Elekdag (2009), following steps have been usedto produce fan chats for growth in aggregate and regional trade:
1. Determine the growth forecast for aggregate and regional trade (denoted as y).
2. Uncertainty parameter is computed as historical forecast error variance (denoted as δy).
3. For producing skewed fan chart, Pearson skewness indicator (denoted as γy) is computed.
4. The confidence levels (q) i.e. 90 percent, 60 percent and 30 percent, are chosen to bedisplayed in the fan chart.
5. When variance (δy) and skewness (γy) parameters are established, they characterizeforecast distribution in terms of parameters of the 2-piece normal distribution (i.e. themean (µ) which represents the central forecast and the left (δ1) and right (δ2) standarddeviation of said distribution.
The density function of 2-piece normal distribution (combination of 2 halves of normal dis-tribution with same mean (µ) and different deviations (δ1 and δ2) on each side) is presentedby:
f(y) = Aexp
{− (y − µ)2
2δ21
}fory ≤ µ (1)
f(y) = Aexp
{− (y − µ)2
2δ22
}fory > µ (2)
Where,
A =
√2(δ1 + δ2)−1
√π
(3)
64
Journal of Management Sciences
Here µ represents the mode of distribution if δ1 6= δ2 (i.e. distribution is skewed). Followingare the equations which represent mean, variance, and skewness of two-piece normal distributionrespectively:
E(y) = µ+
√2
π(δ2 − δ1) (4)
V (y) = δ1δ2 +
(1− 2
π
)(δ2 − δ1)2 (5)
γ(y) =
√2
π(δ2 − δ1)[
(4
π− 1
)(δ2 − δ1)2 + δ1δ2] (6)
Where E(y), V(y) and γ(y) represent the mean, variance and skewness of 2-piece normaldistribution respectively. Blix and Sellin (1998) discussed that the skewness of 2-piece normal dis-tribution (since skewness and variance are uniquely identified) could be approximately calculatedas:
γ(y) =
√2
π(δ2 − δ1) (7)
This form of skewness of 2-piece normal distribution simplifies our calculation of δ1 and δ2 forconstructing confidence interval and Fan chart. Now we can solve δ1 and δ2 from V(y) and γ(y).By substituting δ2 in V(y) with skewness from γ(y) and δ1 we get the following equation:
δ21 +
√π
2γyδ1 − [
(1− π
2
)γ2y + δ2y] = 0 (8)
Where γy and δy are estimated skewness and variance of 2-piece normal distribution respec-tively. Once we determine δ1, the right hand side standard deviation of the distribution, δ2 canbe determined by the approximation of equation 7.
6. The confidence interval surrounding each point estimate of aggregate and regional tradegrowth can be drawn for each level of confidence (q), by solving for
z1 = µ− δ1δ2
(z2 − µ) (9)
z2 = µ− δ2ψ−1
(1 + q
2
)(10)
Where ψ−1 (0 < ψ−1 < 1) is the inverse of standard normal distribution. For more detailson the procedure, see Camilleri and Vella (2015) and Yu (2011). All the data have been gatheredfrom Pakistan Economic Surveys (various issues) and Handbook of statistics of Pakistan Economy(2015).
Fan Chart Analysis
In this section, trade forecasting is discussed at aggregate level as well as regional trade level. Inthe umbrella of trade, here we discuss aggregate and region wise export, import and trade balanceof Pakistan.
65

Journal of Management Sciences
Figure 9Fan Chart of Export Growth Rate
Figure 10Fan Chart of Import Growth Rate
66
Journal of Management Sciences
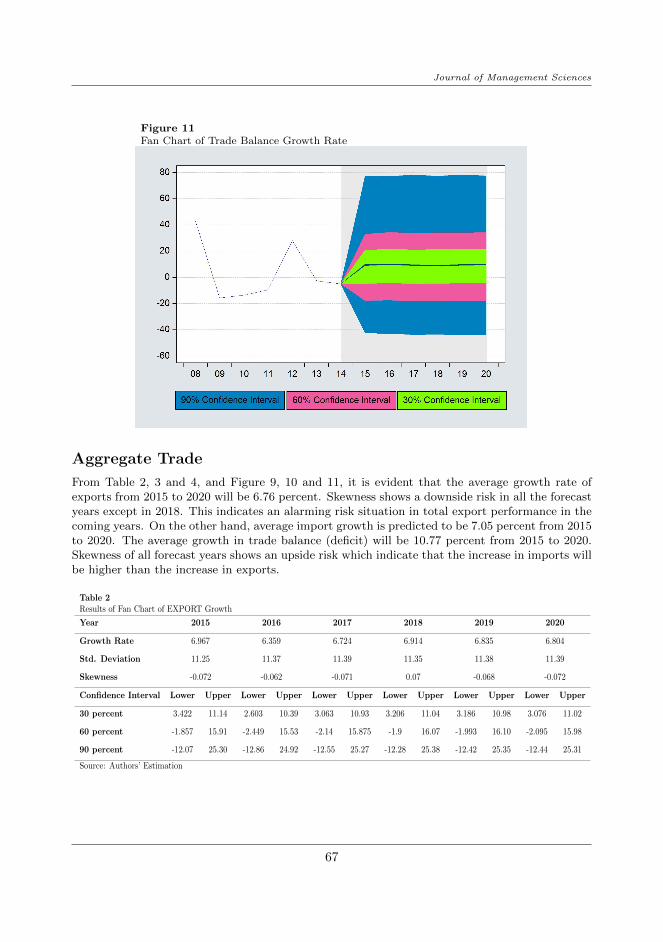
Figure 11Fan Chart of Trade Balance Growth Rate
Aggregate Trade
From Table 2, 3 and 4, and Figure 9, 10 and 11, it is evident that the average growth rate ofexports from 2015 to 2020 will be 6.76 percent. Skewness shows a downside risk in all the forecastyears except in 2018. This indicates an alarming risk situation in total export performance in thecoming years. On the other hand, average import growth is predicted to be 7.05 percent from 2015to 2020. The average growth in trade balance (deficit) will be 10.77 percent from 2015 to 2020.Skewness of all forecast years shows an upside risk which indicate that the increase in imports willbe higher than the increase in exports.
Table 2Results of Fan Chart of EXPORT Growth
Year 2015 2016 2017 2018 2019 2020
Growth Rate 6.967 6.359 6.724 6.914 6.835 6.804
Std. Deviation 11.25 11.37 11.39 11.35 11.38 11.39
Skewness -0.072 -0.062 -0.071 0.07 -0.068 -0.072
Confidence Interval Lower Upper Lower Upper Lower Upper Lower Upper Lower Upper Lower Upper
30 percent 3.422 11.14 2.603 10.39 3.063 10.93 3.206 11.04 3.186 10.98 3.076 11.02
60 percent -1.857 15.91 -2.449 15.53 -2.14 15.875 -1.9 16.07 -1.993 16.10 -2.095 15.98
90 percent -12.07 25.30 -12.86 24.92 -12.55 25.27 -12.28 25.38 -12.42 25.35 -12.44 25.31
Source: Authors’ Estimation
67
Journal of Management Sciences
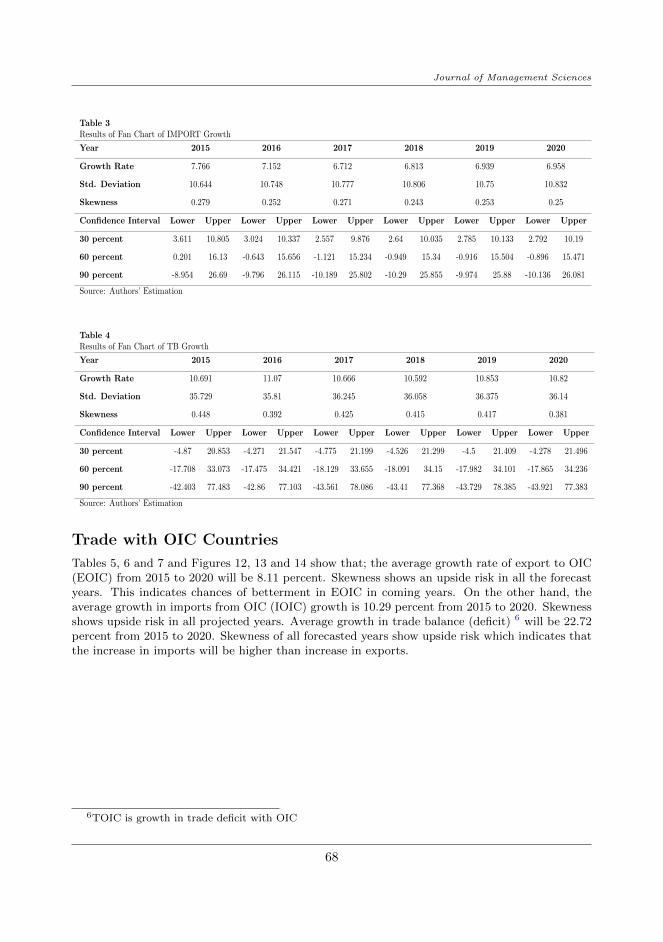
Table 3Results of Fan Chart of IMPORT Growth
Year 2015 2016 2017 2018 2019 2020
Growth Rate 7.766 7.152 6.712 6.813 6.939 6.958
Std. Deviation 10.644 10.748 10.777 10.806 10.75 10.832
Skewness 0.279 0.252 0.271 0.243 0.253 0.25
Confidence Interval Lower Upper Lower Upper Lower Upper Lower Upper Lower Upper Lower Upper
30 percent 3.611 10.805 3.024 10.337 2.557 9.876 2.64 10.035 2.785 10.133 2.792 10.19
60 percent 0.201 16.13 -0.643 15.656 -1.121 15.234 -0.949 15.34 -0.916 15.504 -0.896 15.471
90 percent -8.954 26.69 -9.796 26.115 -10.189 25.802 -10.29 25.855 -9.974 25.88 -10.136 26.081
Source: Authors’ Estimation
Table 4Results of Fan Chart of TB Growth
Year 2015 2016 2017 2018 2019 2020
Growth Rate 10.691 11.07 10.666 10.592 10.853 10.82
Std. Deviation 35.729 35.81 36.245 36.058 36.375 36.14
Skewness 0.448 0.392 0.425 0.415 0.417 0.381
Confidence Interval Lower Upper Lower Upper Lower Upper Lower Upper Lower Upper Lower Upper
30 percent -4.87 20.853 -4.271 21.547 -4.775 21.199 -4.526 21.299 -4.5 21.409 -4.278 21.496
60 percent -17.708 33.073 -17.475 34.421 -18.129 33.655 -18.091 34.15 -17.982 34.101 -17.865 34.236
90 percent -42.403 77.483 -42.86 77.103 -43.561 78.086 -43.41 77.368 -43.729 78.385 -43.921 77.383
Source: Authors’ Estimation
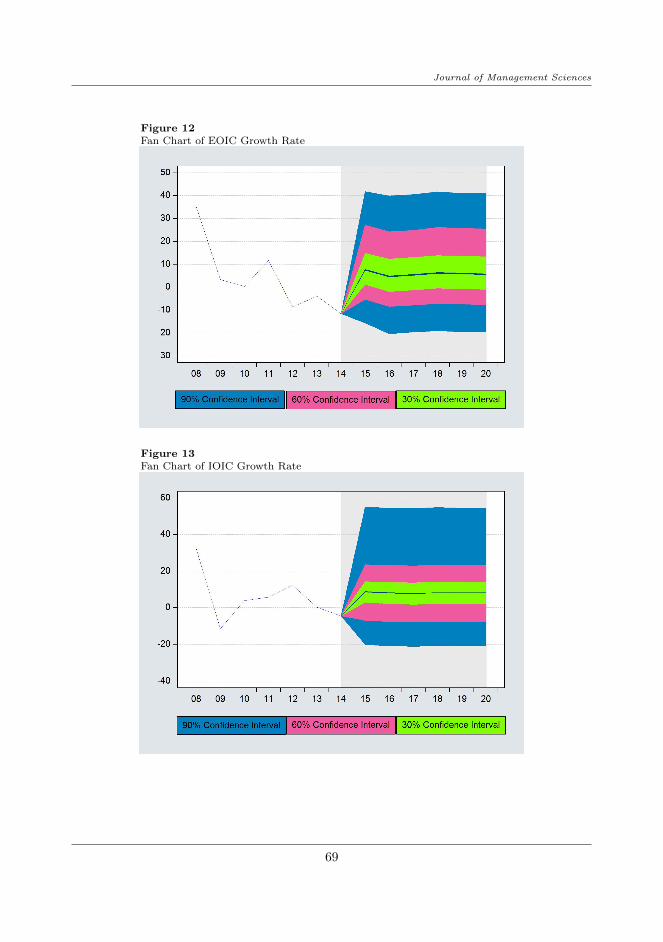
Trade with OIC Countries
Tables 5, 6 and 7 and Figures 12, 13 and 14 show that; the average growth rate of export to OIC(EOIC) from 2015 to 2020 will be 8.11 percent. Skewness shows an upside risk in all the forecastyears. This indicates chances of betterment in EOIC in coming years. On the other hand, theaverage growth in imports from OIC (IOIC) growth is 10.29 percent from 2015 to 2020. Skewnessshows upside risk in all projected years. Average growth in trade balance (deficit) 6 will be 22.72percent from 2015 to 2020. Skewness of all forecasted years show upside risk which indicates thatthe increase in imports will be higher than increase in exports.
6TOIC is growth in trade deficit with OIC
68
Journal of Management Sciences
Figure 12Fan Chart of EOIC Growth Rate
Figure 13Fan Chart of IOIC Growth Rate
69
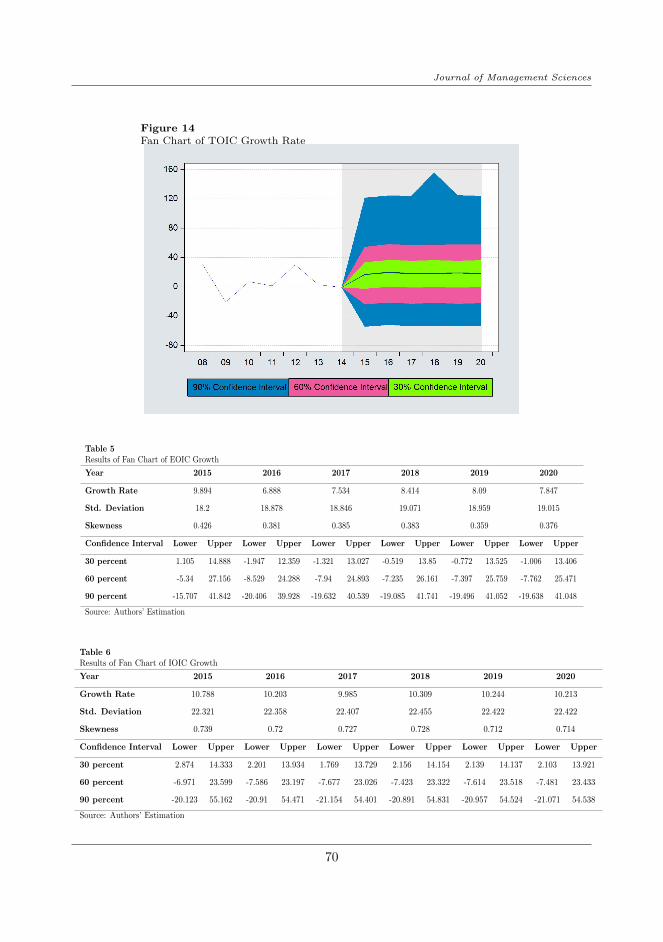
Journal of Management Sciences
Figure 14Fan Chart of TOIC Growth Rate
Table 5Results of Fan Chart of EOIC Growth
Year 2015 2016 2017 2018 2019 2020
Growth Rate 9.894 6.888 7.534 8.414 8.09 7.847
Std. Deviation 18.2 18.878 18.846 19.071 18.959 19.015
Skewness 0.426 0.381 0.385 0.383 0.359 0.376
Confidence Interval Lower Upper Lower Upper Lower Upper Lower Upper Lower Upper Lower Upper
30 percent 1.105 14.888 -1.947 12.359 -1.321 13.027 -0.519 13.85 -0.772 13.525 -1.006 13.406
60 percent -5.34 27.156 -8.529 24.288 -7.94 24.893 -7.235 26.161 -7.397 25.759 -7.762 25.471
90 percent -15.707 41.842 -20.406 39.928 -19.632 40.539 -19.085 41.741 -19.496 41.052 -19.638 41.048
Source: Authors’ Estimation
Table 6Results of Fan Chart of IOIC Growth
Year 2015 2016 2017 2018 2019 2020
Growth Rate 10.788 10.203 9.985 10.309 10.244 10.213
Std. Deviation 22.321 22.358 22.407 22.455 22.422 22.422
Skewness 0.739 0.72 0.727 0.728 0.712 0.714
Confidence Interval Lower Upper Lower Upper Lower Upper Lower Upper Lower Upper Lower Upper
30 percent 2.874 14.333 2.201 13.934 1.769 13.729 2.156 14.154 2.139 14.137 2.103 13.921
60 percent -6.971 23.599 -7.586 23.197 -7.677 23.026 -7.423 23.322 -7.614 23.518 -7.481 23.433
90 percent -20.123 55.162 -20.91 54.471 -21.154 54.401 -20.891 54.831 -20.957 54.524 -21.071 54.538
Source: Authors’ Estimation
70
Journal of Management Sciences
Table 7Results of Fan Chart of TOIC Growth
Year 2015 2016 2017 2018 2019 2020
Growth Rate 20.27 23.12 21.92 26.38 22.31 22.34
Std. Deviation 52.96 53.23 53.61 62.44 53.85 53.55
Skewness 0.583 0.572 0.579 0.985 0.569 0.568
Confidence Interval Lower Upper Lower Upper Lower Upper Lower Upper Lower Upper Lower Upper
30 percent -2.541 33.33 0.201 36.51 -0.886 35.36 -0.407 36.09 -0.759 35.46 -0.435 36.13
60 percent -23.85 54.43 -21.35 58.01 -22.82 56.96 -22.11 57.51 -22.81 57.60 -22.32 57.62
90 percent -54.26 121.5 -51.88 124.5 -53.53 124.2 -52.81 155.8 -53.64 124.8 -53.24 124.2
Source: Authors’ Estimation
Trade with OECD Countries
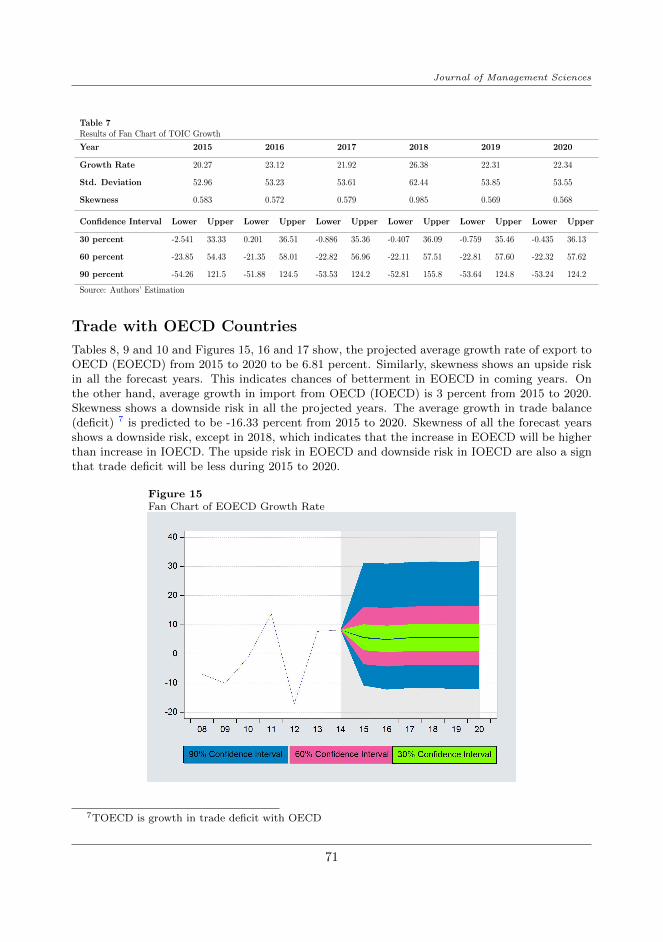
Tables 8, 9 and 10 and Figures 15, 16 and 17 show, the projected average growth rate of export toOECD (EOECD) from 2015 to 2020 to be 6.81 percent. Similarly, skewness shows an upside riskin all the forecast years. This indicates chances of betterment in EOECD in coming years. Onthe other hand, average growth in import from OECD (IOECD) is 3 percent from 2015 to 2020.Skewness shows a downside risk in all the projected years. The average growth in trade balance(deficit) 7 is predicted to be -16.33 percent from 2015 to 2020. Skewness of all the forecast yearsshows a downside risk, except in 2018, which indicates that the increase in EOECD will be higherthan increase in IOECD. The upside risk in EOECD and downside risk in IOECD are also a signthat trade deficit will be less during 2015 to 2020.
Figure 15Fan Chart of EOECD Growth Rate
7TOECD is growth in trade deficit with OECD
71

Journal of Management Sciences
Figure 16
Fan Chart of IOECD Growth Rate
Figure 17Fan Chart of TOECD Growth Rate
72
Journal of Management Sciences
Table 8Results of Fan Chart of EOECD Growth
Year 2015 2016 2017 2018 2019 2020
FDI Growth 6.99 6.357 6.83 6.891 6.908 6.934
Std. Deviation 12.78 13.08 13.08 13.17 13.12 13.27
Skewness 0.601 0.558 0.551 0.552 0.527 0.543
Confidence Interval Lower Upper Lower Upper Lower Upper Lower Upper Lower Upper Lower Upper
30 percent 1.311 10.14 0.692 9.69 1.029 10.18 1.059 10.16 1.183 10.30 1.205 10.23
60 percent -3.444 16.10 -4.238 15.80 -3.768 16.23 -3.737 16.38 -3.687 16.51 -3.745 16.37
90 percent -10.76 31.30 -12.12 31.02 -11.67 31.46 -11.76 31.70 -11.81 31.48 -11.99 31.94
Source: Authors’ Estimation
Table 9Results of Fan Chart of IOECD Growth
Year 2015 2016 2017 2018 2019 2020
Growth Rate 3.682 2.686 2.658 2.955 3.065 2.981
Std. Deviation 11.18 11.29 11.36 11.35 11.39 11.39
Skewness -0.024 -0.026 -0.039 -0.033 -0.012 -0.025
Confidence Interval Lower Upper Lower Upper Lower Upper Lower Upper Lower Upper Lower Upper
30 percent -0.951 8.387 -1.899 7.339 -1.934 7.309 -1.601 7.608 -1.580 7.777 -1.561 7.730
60 percent -5.951 13.39 -7.007 12.51 -6.921 12.55 -6.695 12.93 -6.680 12.90 -6.789 12.81
90 percent -14.39 21.49 -15.61 20.68 -15.90 20.75 -15.51 21.00 -15.35 21.34 -15.51 21.20
Source: Authors’ Estimation
Table 10Results of Fan Chart of TOECD Growth
Year 2015 2016 2017 2018 2019 2020
Growth Rate -41.30 -78.24 6.580 30.54 3.386 -19.00
Std. Deviation 79.59 151.5 93.60 96.70 99.41 101.6
Skewness -0.254 -1.462 -0.069 0.088 -0.026 -0.279
Confidence Interval Lower Upper Lower Upper Lower Upper Lower Upper Lower Upper Lower Upper
30 percent -61.28 -16.06 -76.81 -23.19 -18.61 33.66 1.667 56.36 -24.28 31.67 -42.87 13.61
60 percent -92.24 14.10 -115.3 8.126 -54.15 68.06 -33.37 96.21 -62.91 70.15 -85.60 49.26
90 percent -186.1 87.77 -419.1 97.78 -157.8 166.1 -133.0 200.2 -169.0 173.7 -204.7 145.3
Source: Authors’ Estimation
Trade with SAARC Countries
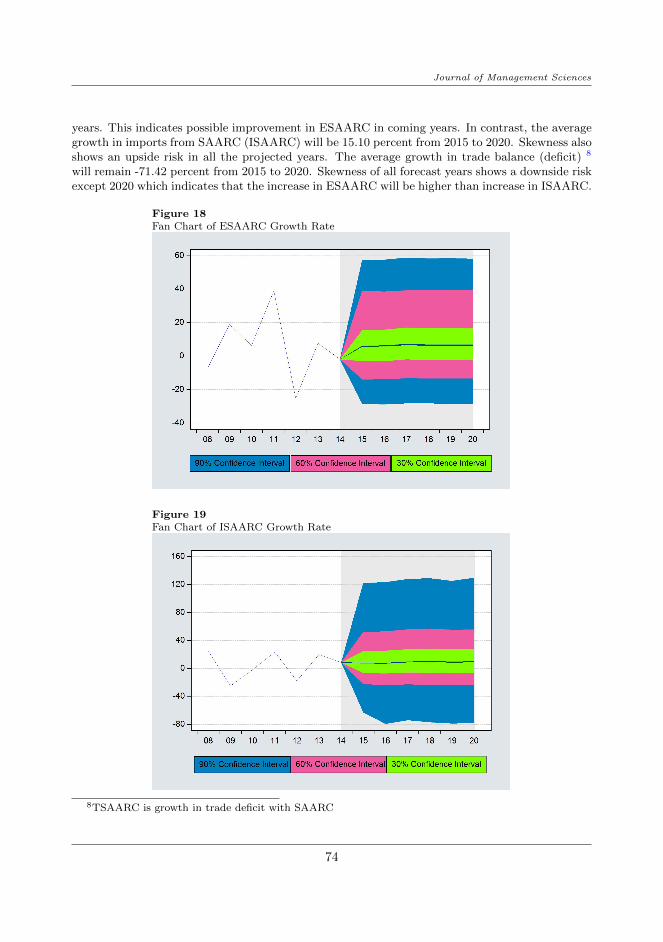
According to Tables 11, 12 and 13 and Figures 18, 19 and 20, the average growth rate of exports toSAARC (ESAARC) from 2015 to 2020 will be 10.26 percent, which is consistent with the findingsof Mehmood and Ahmad (2012). Side by side, skewness shows an upside risk in all the forecast
73
Journal of Management Sciences
years. This indicates possible improvement in ESAARC in coming years. In contrast, the averagegrowth in imports from SAARC (ISAARC) will be 15.10 percent from 2015 to 2020. Skewness alsoshows an upside risk in all the projected years. The average growth in trade balance (deficit) 8
will remain -71.42 percent from 2015 to 2020. Skewness of all forecast years shows a downside riskexcept 2020 which indicates that the increase in ESAARC will be higher than increase in ISAARC.
Figure 18Fan Chart of ESAARC Growth Rate
Figure 19Fan Chart of ISAARC Growth Rate
8TSAARC is growth in trade deficit with SAARC
74

Journal of Management Sciences
Figure 20Fan Chart of TSAARC Growth Rate
Table 11Results of Fan Chart of ESAARC Growth
Year 2015 2016 2017 2018 2019 2020
Growth Rate 9.804 9.804 10.71 10.47 10.45 10.37
Std. Deviation 27.73 27.72 27.87 27.81 27.87 27.88
Skewness 0.497 0.428 0.424 0.429 0.427 0.418
Confidence Interval Lower Upper Lower Upper Lower Upper Lower Upper Lower Upper Lower Upper
30 percent -2.913 15.54 -2.960 15.77 -1.925 16.98 -2.278 16.68 -2.230 16.66 -2.429 16.55
60 percent -13.88 39.09 -13.79 38.49 -13.11 39.34 -13.23 39.38 -13.22 39.30 -13.26 39.43
90 percent -28.59 57.41 -28.83 57.56 -28.19 58.76 -28.20 58.32 -28.42 58.46 -28.61 58.18
Source: Authors’ Estimation
Table 12Results of Fan Chart of ISAARC Growth
Year 2015 2016 2017 2018 2019 2020
Growth Rate 15.35 13.36 15.97 15.87 14.61 15.417
Std. Deviation 54.67 58.76 59.04 60.12 59.34 60.49
Skewness 0.672 0.403 0.498 0.461 0.396 0.460
Confidence Interval Lower Upper Lower Upper Lower Upper Lower Upper Lower Upper Lower Upper
30 percent -6.510 24.77 -6.997 25.45 -5.799 27.55 -6.052 28.01 -6.623 27.21 -6.421 27.22
60 percent -22.17 52.21 -23.49 53.00 -22.58 55.99 -23.24 56.66 -23.57 55.25 -23.29 55.60
90 percent -62.84 121.9 -79.15 123.1 -73.98 127.9 -76.74 129.1 -78.50 125.0 -78.19 129.6
Source: Authors’ Estimation
75
Journal of Management Sciences
Table 13Results of Fan Chart of TSAARC Growth
Year 2015 2016 2017 2018 2019 2020
Growth Rate -77.72 -72.63 -70.41 -67.57 -69.42 -70.79
Std. Deviation 287.3 307.4 311.5 323.4 319.4 319.1
Skewness -0.521 -0.498 -0.490 -0.326 -0.380 0.414
Confidence Interval Lower Upper Lower Upper Lower Upper Lower Upper Lower Upper Lower Upper
30 percent -131.4 18.56 -127.1 26.11 -126.4 30.04 -130.4 27.3 -131.4 27.91 -132.2 28.05
60 percent -243.4 107.8 -249.1 117.5 -245.8 121.9 -251.3 121.9 -250.5 120.6 -253.4 125.2
90 percent -631.7 364.5 -664.5 406.9 -670.1 417.1 -673.8 462.8 -673.4 446.6 -676.7 438.5
Source: Authors’ Estimation
Trade with ASEAN Countries
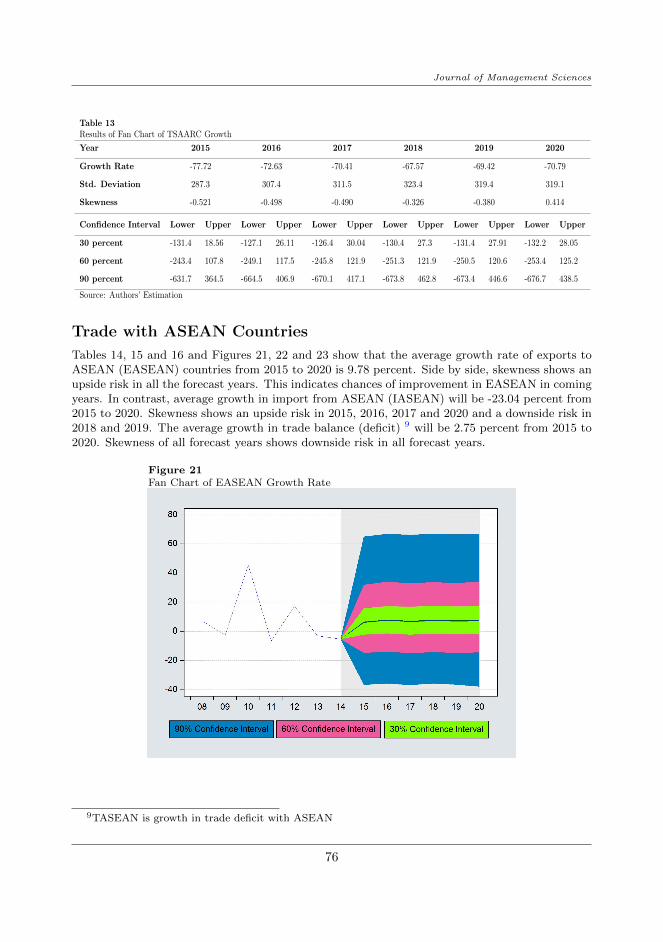
Tables 14, 15 and 16 and Figures 21, 22 and 23 show that the average growth rate of exports toASEAN (EASEAN) countries from 2015 to 2020 is 9.78 percent. Side by side, skewness shows anupside risk in all the forecast years. This indicates chances of improvement in EASEAN in comingyears. In contrast, average growth in import from ASEAN (IASEAN) will be -23.04 percent from2015 to 2020. Skewness shows an upside risk in 2015, 2016, 2017 and 2020 and a downside risk in2018 and 2019. The average growth in trade balance (deficit) 9 will be 2.75 percent from 2015 to2020. Skewness of all forecast years shows downside risk in all forecast years.
Figure 21Fan Chart of EASEAN Growth Rate
9TASEAN is growth in trade deficit with ASEAN
76

Journal of Management Sciences
Figure 22Fan Chart of IASEAN Growth Rate
Figure 23
Fan Chart of TASEAN Growth Rate
77

Journal of Management Sciences
Table 14Results of Fan Chart of EASEAN Growth
Year 2015 2016 2017 2018 2019 2020
Growth Rate 9.000 10.31 9.507 10.20 9.831 9.857
Std. Deviation 30.47 30.85 30.93 30.89 30.94 31.34
Skewness 0.425 0.420 0.411 0.423 0.415 0.368
Confidence Interval Lower Upper Lower Upper Lower Upper Lower Upper Lower Upper Lower Upper
30 percent -2.206 15.82 -1.415 17.22 -2.075 16.78 -1.516 17.59 -1.691 17.164 -1.825 17.34
60 percent -14.58 31.91 -13.91 34.04 -14.76 32.97 -14.23 33.67 -14.57 33.16 -14.34 33.97
90 percent -36.68 65.07 -35.72 66.82 -36.83 66.15 -35.77 66.86 -36.46 66.58 -37.80 66.73
Source: Authors’ Estimation
Table 15Results of Fan Chart of IASEAN Growth
Year 2015 2016 2017 2018 2019 2020
Growth Rate 42.79 41.01 37.23 -38.26 -277.9 56.89
Std. Deviation 349.8 390.3 388.0 605.8 1229 432.9
Skewness 0.266 0.289 0.204 -0.981 -1.959 0.446
Confidence Interval Lower Upper Lower Upper Lower Upper Lower Upper Lower Upper Lower Upper
30 percent -84.83 143.9 -86.34 139.3 -88.80 143.9 -86.54 153.6 -87.29 152.4 -87.45 151.5
60 percent -222.2 286.6 -232.4 282.7 -234.2 287.4 -240.0 302.9 -239.3 301.9 -239.4 303.7
90 percent -509.3 671.3 -586.7 757.2 -598.0 734.9 -1316 815.1 -3220. 807.0 -617.7 879.9
Source: Authors’ Estimation
Table 16Results of Fan Chart of TASEAN Growth
Year 2015 2016 2017 2018 2019 2020
Growth Rate 3.416 2.303 3.022 2.178 2.645 2.982
Std. Deviation 65.91 73.34 72.39 74.48 73.16 72.80
Skewness -0.459 -0.577 -0.480 -0.550 -0.485 -0.484
Confidence Interval Lower Upper Lower Upper Lower Upper Lower Upper Lower Upper Lower Upper
30 percent -11.59 26.02 -11.95 26.85 -12.71 26.83 -12.86 26.84 -12.83 26.86 -12.82 27.29
60 percent -34.49 51.04 -35.88 52.96 -36.46 53.82 -37.46 54.56 -37.94 54.55 -37.79 54.69
90 percent -121.8 104.7 -140.9 113.0 -135.6 114.6 -142.3 115.0 -137.4 115.0 -136.2 114.7
Source: Authors’ Estimation
Concluding Remarks
This study analyzes and forecasts the overall and regional trade of Pakistan. The considered regionare OIC, OECD, SAARC and ASEAN which cover almost 80% of total trade of Pakistan. Thisstudy is a pioneering attempt to forecast aggregate and regional trade from 2015 to 2020 with fan
78

Journal of Management Sciences
chart approach by using annual data from 1974 to 2014. This approach of forecast not only makespredictions for a particular point in future but also identifies the uncertainty associated with theforecast. This approach also provides risk information in the context of upside and downside risk.
The results reveal that in case of overall trade, the risk associated with export is predictedto be downside during all the forecast years, except 2018. Imports and trade deficit have anupside risk in all the forecast years. Trade with OIC has an upside risk in export, import, andtrade deficit. Trade with OECD shows favorable conditions for Pakistan in near future,whereas,exports with OECD indicate upside risk and import and trade deficit shows downside risk. Tradedeficit with OECD has upside risk in 2018 only. Trade condition with SAARC countries will bebetter in forecasted years. Growth in export and import with SAARC have upside risk in allforecasted years while, trade deficit with SAARC has a downside risk. In the case of ASEAN,exports and growth are positive and have an upside in coming years. On the other hand, importswith positive growth having upside risk in 2015, 2016, 2017 and 2020 and downside risk in 2018and 2019. As far as the trade deficit is concerned, it has a trade deficit having downside risk inall the projected years. The results also suggest that there is considerable uncertainty associatedwith these forecasts. The policy makers are recommended to monitor the downside risk associatedwith exports and the upside risk associated with imports of the country.
Policy makers are also suggested to attract and retain both private and foreign direct invest-ment in Pakistan, which can be used to sustain export growth mostly with upside risk in thecountry. Side by side, import growth has been observed to have an upside risk, except importgrowth from OECD countries which has a downside risk. If one accepts Jawaid (2014)’s findingsof positive effect of aggregate export on economic growth and negative effect of aggregate importson economic growth, import growth should be analyzed regionally as well as through commoditywise import contents. Those contents which substitute efficient domestic production should notbe encouraged.
The above risk and uncertainty analysis suggests us to conduct for further research by analyzingtrade of commodity groups, with these regions to make more growth friendly policies. This analysiswill also help us to identify those regions which are more beneficial in terms of export, import andtrade balance for Pakistan.
79
Journal of Management Sciences
References
Ahmad, B., & Mustafa, K. (2006). Forecasting kinnow production in Pakistan: Aneconometrics analysis. International Journal of Agriculture & Biology , 8 (4), 455–458.
Akram, Q. F., Binning, A., & Maih, J. (2016). Joint prediction bands for macroeconomicrisk management. CAMP Working Paper Series No 5/2016 .
Blix, M., & Sellin, P. (1998). Uncertainty bands for inflation forecasts. Sveriges RiksbankWorking Paper No 65 .
Camilleri, G., & Vella, K. (2015). Interpolating forecast errors for assessing uncertaintyin macroeconomic forecasts: An analysis for Malta. Ministry of Finance, EconomicPolicy Department Working Paper Series WP 01/2015..
Carbaugh, R. J. (2004). International economics. Thomson South-Western, Australia.Castillo, M. A. (2016). Template for external sustainability assessment (Tech. Rep.).
Inter-American Development Bank Techical Note IDB-TN-1095.De Luna, X. (2000). Prediction intervals based on autoregression forecasts. Journal of the
Royal Statistical Society: Series D (The Statistician), 49 (1), 87–93.Din, M. U., Ghani, E., & Siddique, O. (2003). Openness and economic growth in Pakistan.
The Pakistan Development Review , 42 (4), 795–807.Dowd, K., Blake, D., & Cairns, A. J. (2016). The myth of methuselah and the uncertainty
of death: The mortality fan charts. Risks, 4 (3), 1–7.Farooqi, A. (2014). ARIMA model building and forecasting on imports and exports of
Pakistan. Pakistan Journal of Statistics and Operation Research, 10 (2), 157–168.Fukac, M., & Kirkby, R. (2017). Accounting for uncertainty in public debt targets. Aus-
tralian Economic Review , 50 (1), 89–102.Fuller, W. A., & Hasza, D. P. (1981). Properties of predictors for autoregressive time
series. Journal of the American Statistical Association, 76 (373), 155–161.Ghafoor, A., & Hanif, S. (2005). Analysis of the trade pattern of Pakistan: Past trends
and future prospects. Journal of Agriculture & Social Sciences, 1 (4), 346–349.Gul, N., & Yasin, H. M. (2011). The trade potential of Pakistan: an application of the
gravity model. The Lahore Journal of Economics, 16 (1), 23–62.Hye, Q. M. A. (2012). Long term effect of trade openness on economic growth in case of
Pakistan. Quality & Quantity , 46 (4), 1137–1149.Iqbal, N., Bakhsh, K., Maqbool, A., & Ahmad, A. S. (2005). Use of the ARIMA model
for forecasting wheat area and production in Pakistan. Journal of Agriculture andSocial Sciences, 1 (2), 120–122.
Jawaid, S. T. (2014). Trade openness and economic growth: A lesson from Pakistan.Foreign Trade Review , 49 (2), 193–212.
Kannan, P., & Elekdag, S. (2009). Incorporating market information into the constructionof the fan chart(no. 9-178). IMF Working Paper, WP/09/178 .
Khan, M., Mustafa, K., Shah, M., Khan, N., & Khan, J. Z. (2008). Forecasting mangoproduction in Pakistan an econometric model approach. Sarhad J. Agric, 24 (2),363–370.
80
Journal of Management Sciences
Mehmood, S., & Ahmad, Z. (2012). Forecasting Pakistan’s exports to SAARC: An ap-plication of univiriate ARIMA model. Journal of Contemporary Issues in BusinessResearch, 1 (3), 41–54.
Muhammad, S. D. (2010). The effectiveness of financial development and openness oneconomic growth: Case study of Pakistan. European Journal of Social Sciences,13 (3), 415–425.
Naz, F. (2013). A univariate time series modelling of dates exports in Pakistan. Journalof Contemporary Issues in Business Research, 1 (2), 37–48.
Raza, S. A., & Karim, M. Z. A. (2017). Influence of systemic banking crisis & currencycrisis on the relationship of export & economic growth: Evidence from China. Journalof Chinese Economic and Foreign Trade Studies, 10 (1), 82–110.
Shahbaz, M. (2012). Does trade openness affect long run growth? cointegration, causalityand forecast error variance decomposition tests for Pakistan. Economic Modelling ,29 (6), 2325–2339.
Ullah, S., Zaman, B., Farooq, M., & Javid, A. (2009). Cointegration and causality betweenexports and economic growth in Pakistan. European Journal of Social Sciences,10 (2), 264–272.
Yu, H. (2011). Uncertainty and risk analysis of the langrun chinese GDP forecast: Fancharts revisited. China Economic Journal , 4 (2-3), 81–104.
Zaidi, S. A. (2005). Issues in Pakistan’s economy. Oxford University Press, UnitedKingdom.
Zaman, K. (2010). Trade liberalization, financial development and economic growth:Evidence from Pakistan (1980-2009). Journal of International Academic Research,10 (2), 30–37.
81