Embed Size (px)
Citation preview

HPA-RPD-024
© Health Protection Agency Centre for Radiation, Chemical and Environmental Hazards Radiation Protection Division Chilton, Didcot, Oxfordshire OX11 0RQ
Approval: March 2007 Publication: June 2007 £20.00 ISBN 978-0-85951-592-4
This report from HPA Radiation Protection Division reflects understanding and evaluation of the current scientific evidence as presented and referenced in this document.
Uncertainty Analysis of the ICRP Systemic Model for Uranium as applied to Interpretation of Bioassay Data for Depleted Uranium
J D Harrison, T P Fell, P G D Pellow, A W Phipps and M Puncher
ABSTRACT This report provides a review of the ICRP model for the systemic biokinetics of uranium absorbed to blood, identifies key model parameters that affect urinary excretion, considers uncertainties in values for these parameters, and determines the effect of these uncertainties on dose assessments based on urine measurements. A parallel study of the application of the ICRP respiratory tract model to inhaled DU is reported separately. Consistent with available human and animal data, the ICRP systemic model predicts rapid urinary excretion of uranium entering blood, about 75% after 1 week and 95% at 1 year, with long-term retention mainly in the skeleton (4% at 1 year, 1% at 20 years). Following a sensitivity analysis of the ICRP systemic model, uncertainty analysis was confined to values for key parameters: the urinary excretion rate and rates associated with skeletal retention. These uncertainties were considered together and in combination with respiratory tract model uncertainties obtained in the parallel study. Considering committed effective dose following inhalation of DU, assessed from a measurement of DU in urine, probabilistic analysis showed that uncertainties in dose estimates were dominated by respiratory tract model uncertainties at all times. For measurements at early times up to about 6 months (200 days) after intake, the 2.5% - 97.5% range in dose estimates was a factor of about 50 – 70, independent of the inclusion of systemic model uncertainties. For measurements at later times, from 3 years to approaching 30 years after intake, the range in uncertainties in dose estimates was reduced to < 10, considering uncertainties in respiratory tract model parameter values only. Systemic model uncertainties made the greatest contribution to overall uncertainties in dose estimates at the latest time-point considered, approaching 30 years after intake (10,000 days), but only increase the 2.5% - 97.5% range from 10 to 15. The maximum assessed doses for the example of measured urinary excretion of 1 ng DU d-1 (97.5% values) were below 1 mSv up to about 14 years after intake but could exceed 3 mSv for measurements at times approaching 30 years after intake.
This study was partly funded by the Defence Science and Technology Laboratory under contract number RD034 9781.


iii
EXECUTIVE SUMMARY
Measurements of uranium excreted in urine have been widely used to monitor possible exposures to depleted uranium (DU) by personnel who have served in areas where DU munitions were used in conflicts. In the UK, the Depleted Uranium Oversight Board (DUOB) developed a testing programme for UK military veterans and eligible non-military personnel who wished to know whether they had been significantly exposed to DU in the 1991 Gulf War, or during operations in the Balkans from 1994. The test method adopted was based on measurement of uranium isotopic ratios and total uranium excretion in urine.
This is the second of three reports that consider the assessment of radiation doses and health risks to individuals exposed to depleted uranium (DU) on the basis of measurements of uranium in urine samples. The first report (Bailey and Puncher, 2007) provides an overall introduction to this work and addresses the effect of uncertainties and variability in the behaviour of inhaled DU in the respiratory tract on dose assessments. The third report (Hodgson et al. 2007) addresses the possibility of alterations in kidney function due to uranium toxicity and consequent effects on urinary excretion and on dose assessments. This report considers uncertainties in the behaviour of uranium absorbed to blood, including its deposition and retention in body tissues and its urinary excretion, and the effect these uncertainties have on dose assessments. It presents an analysis of the ICRP (1995a) model for the systemic biokinetics of uranium absorbed to blood. It identifies key model parameters that influence urinary excretion and considers variability and uncertainty in values for these parameters. The ranges obtained are used to determine corresponding ranges in committed effective dose assessed from measurements of DU in urine samples at times between 3 months and 30 years after intake to blood. Inhalation of DU is then considered, taking account of uncertainties in key respiratory tract model parameter values, obtained by Bailey and Puncher (2007).
Analysis of the ICRP systemic model for uranium (ICRP, 1995a) shows that good use has been made of available human and animal data to develop a sophisticated model with reasonable physiological realism. It is essentially the same model as used for the alkaline earth elements, strontium, radium (ICRP, 1993) and calcium (ICRP, 1995b), reflecting the similarity in behaviour of uranyl (UO2
2+) and Ca2+ ions. The only structural difference in the models is the inclusion of a red blood cell compartment in the uranium model to allow for observed retention of uranium by circulating cells, not seen for the alkaline earth elements. For uranium, as for the alkaline earth elements, the most important site of long-term retention is the skeleton. However, the behaviour of uranium differs quantitatively from that of the alkaline earth elements, with notable differences being the rapidity of urinary excretion of uranium and the proportion of retained uranium accounted for by the kidneys.
A review of human data on the urinary excretion of uranium showed that all relevant data have been used to construct the ICRP model. Additional data were identified on urinary excretion after oral administration, inhalation and absorption through skin but these did not provide information that could be used to improve quantitative estimates

UNCERTAINTY ANALYSIS OF THE ICRP SYSTEMIC MODEL FOR URANIUM AS APPLIED TO INTERPRETATION OF BIOASSAY DATA FOR DEPLETED URANIUM
iv
for modelling purposes. The ICRP model took account of human data from studies in which uranium was administered intravenously, showing that typically two-thirds of injected uranium is excreted in urine in the first 24 hours and about a further 10% over the next 5 days. Similar results were obtained for baboons and dogs. The human and animal data indicate that most of the remaining uranium is excreted over a period of a few months, but a few percent of the amount injected may be retained for a period of years. The ICRP model predicts 90% urinary excretion after about 2 months and 95% after 1 year.
The main site of long-term retention of uranium is the skeleton. ICRP model parameter values for uptake and retention in the skeleton were based on human data from injection studies and post-mortem measurements on environmentally and occupationally exposed individuals, animal data, analogy with the alkaline earth elements and considerations of bone metabolism. The ICRP model predicts retention of about 4% of uranium reaching blood after 1 year and 1% after 20 years.
The report also includes an analysis of a biokinetic model for uranium developed by Wrenn et al. (1994) at around the same time as Leggett (1994) published the model that was used, with slight simplifications, by ICRP (1995a). Notable differences are lower uptake of uranium in the skeleton and soft tissues other than kidneys in the Wrenn model and a more rapid decline in retained activity at late times (by 10 years). The skeleton is a single compartment in the Wrenn model compared with the six compartments of the ICRP model which treat cortical and trabecular bone separately and consider bone surfaces, exchangeable bone volume and non-exchangeable bone volume in each case. It appears that the Wrenn model may substantially underestimate urinary excretion at later times, resulting from the release of the residual small proportion of retained uranium, mainly from the skeleton.
A sensitivity analysis was undertaken to identify the parameters in the ICRP model that have the greatest effect on urinary excretion over the period from 100 to 10,000 days after entry to blood. This was done before undertaking an uncertainty analysis because of the complexity of the model. The sensitivity analysis showed that the most important transfer is that from blood plasma to the bladder, followed by all transfers into, from and within bone. Uncertainty analysis was therefore confined to changes in these rates, basing changes on reported data for ranges in urinary excretion and skeletal retention. Two types of uncertainty analysis were undertaken. In the first, upper and lower values were specified without consideration of the distribution of values within this range. This analysis of “indicative uncertainties” fulfilled the initial objectives of the study. However, software was subsequently developed that allowed comparison with results obtained using a probabilistic approach in which values were sampled from the chosen distributions using Monte Carlo techniques (Puncher and Birchall, 2007).
For the indicative uncertainty analysis, all bone rates were adjusted to the same extent on advice from Leggett (personal communication), and consistent with previous treatment of changes in bone metabolism affecting calcium and strontium retention in the skeleton during pregnancy (Fell et al. 2001). Analysis showed that the required ranges in urinary excretion and skeletal retention of uranium were obtained using ranges in rates from 0.5 times the urinary excretion rate combined with 2 times the bone rates to 2 times the urinary excretion rate combined with 0.5 times the bone rates. The

v
resulting range in cumulative urinary excretion over the first week after entry to blood was 54 – 87%, consistent with the available human data and encompassing variability between individuals. The range in skeletal retention at 1 year was 1 – 10%, reasonably consistent with the available human and animal data and allowing for uncertainties in these data.
The next stage in the indicative analysis was to determine the effect of changes in the retention and excretion parameter values on doses from DU estimated on the basis of urine measurements at different times after intake to blood. The example of measured urinary excretion of 1 ng d-1 DU was used in calculations, since reported excretion rates are typically in the range 1 – 30 ng l-1 (Ting et al. 1999) and it is possible to measure DU at 0.3 ng d-1 against a background of 10 ng d-1 natural uranium (Parrish et al. 2006). Considering the committed effective dose assessed from 1 ng DU measured in a 24 hour urine sample, the overall range in estimated doses after intake to blood was shown to be less than a factor of ten for all measurement times, and more typically < 2. However, while this analysis gives an indication of the contribution of systemic model uncertainties to uncertainties in assessed doses, in reality uranium will not enter blood directly. The final stage was therefore to consider the inhalation of DU, with reference to the parallel study of Bailey and Puncher (2007). The analysis of Bailey and Puncher (2007) of respiratory tract model uncertainties for inhaled DU identified key parameters for aerosol size, breathing characteristics, absorption to blood and particle transport. They proposed central values and ranges for each parameter and determined their combined effect on dose assessments. Central values for respiratory tract model parameters for inhaled DU, together with default systemic model assumptions, gave increasing estimates of dose from measurements of 1 ng DU d-1 in urine from about 0.2 μSv at 10 days to about 1 mSv at approaching 30 years (10,000 days). Combining the indicative uncertainty ranges obtained for assessed doses obtained on the basis of respiratory tract model uncertainties with those resulting from systemic model uncertainties showed that up to 2 – 3 years after intake the overall uncertainties are dominated by respiratory tract model uncertainties. For example, at 100 days (about 3 months) after intake, the minimum value was about a factor of 5 below the central value and the maximum was about a factor of 100 above the central value, with or without the inclusion of systemic model uncertainties. However, contributions to uncertainties from respiratory tract and systemic models were similar at later times. Thus, at times greater than 10 years after intake, the overall uncertainty range was about an order of magnitude greater with inclusion of systemic model uncertainties than when considering only respiratory tract model uncertainties (ie. about 200 compared with about 20).
For the probabilistic analysis, consideration of uncertainties was again confined to the transfer of uranium from blood plasma to urinary bladder and rates into, within and from the skeleton. Following consultation with Leggett (personal communication), a more complex treatment of variations in bone rates was adopted than that used for the indicative uncertainty analysis. Thus, one factor was applied to variation in rates from bone surfaces and a separate and independent factor for rates to and from bone volume. Following iterative analysis of the effect of variations in rates, the following ranges were used: plasma to urinary bladder was varied by a factor of 3 above and below the central value; all rates from bone surfaces were varied by a factor of 9 above and below the central value; and all rates to and from bone volume were varied by a

UNCERTAINTY ANALYSIS OF THE ICRP SYSTEMIC MODEL FOR URANIUM AS APPLIED TO INTERPRETATION OF BIOASSAY DATA FOR DEPLETED URANIUM
vi
factor of 2 above and below the central value. Assuming log normal distributions in each case resulted in urinary excretion at one week of 53 – 89% (95% confidence limits) and skeletal retention at one year of 1 – 10% (99% confidence limits), consistent with available human data. The rate from plasma to bone surfaces was fixed at the ICRP value, as varying this parameter value with the other rates resulted in substantial violation of constraints.
Considering the committed effective dose assessed from 1 ng DU measured in a 24 -hour urine sample following direct entry of DU into blood, the overall range in estimated doses (2.5% - 97.5% range) was around a factor of two (1.5 – 3) throughout the time range considered (10 – 10,000 days). Thus, the indicative and probabilistic analyses gave similar results, with a tendency for the range from the probabilistic analysis to change less with time.
Considering committed effective dose following inhalation of DU, assessed from a measurement of 1 ng of DU in urine, and the effect of combined probabilistic analysis of uncertainties in respiratory tract and systemic model parameter values, showed that uncertainties in dose estimates were dominated by respiratory tract model uncertainties at all times. For measurements at early times up to about 6 months (200 days) after intake, the 2.5% - 97.5% range in dose estimates was a factor of about 50 – 70, independent of the inclusion of systemic model uncertainties. For measurements at later times, from 3 years to approaching 30 years after intake, the range in uncertainties in dose estimates was reduced to < 10, considering uncertainties in respiratory tract model parameter values only. Systemic model uncertainties made the greatest contribution to overall uncertainties in dose estimates at the latest time-point considered, approaching 30 years after intake (10,000 days), but only increase the 2.5% - 97.5% range from 10 to 15. The maximum assessed doses from 1 ng DU d-1 (97.5% values) were below 1 mSv up to about 14 years after intake but could exceed 3 mSv for measurements at times approaching 30 years after intake.
The report concludes with recommendations for future research. A recommendation during the development of the project was that the analysis should be repeated using probabilistic Monte Carlo techniques. Although not a requirement of the initial project specification, this has been done as summarised above. In preparation of this work for publication in the open literature, consideration will be given to a more extensive treatment of uncertainties in the systemic model. In particular, long-term retention of uranium in soft tissues, as well as in the skeleton, will be addressed.
Both indicative and probabilistic uncertainty analyses of the systemic model resulted in narrow uncertainty ranges on dose estimates. Such small uncertainties do not argue for further practical research. However, a case could be made for a volunteer study of the long-term retention and urinary excretion of uranium to test the validity of the results obtained in this study. A good experimental design would be to administer uranium simultaneously by inhalation and intravenous injection, using different isotopes. Modern techniques of mass spectrometry would enable measurements of urinary excretion to continue for decades after administration.

vii
CONTENTS
Executive summary iii
1 Introduction 1
2 Overview of the model 2
3 Data on the systemic biokinetics of Uranium 5 3.1 Main types of data 5 3.2 Summary of controlled studies on human subjects 5 3.3 Information from occupational and environmental studies 7
4 Basis for the ICRP model parameter values for adults 8 4.1 Blood clearance 8 4.2 Urinary excretion and renal retention 11 4.3 Faecal excretion 14 4.4 Liver retention 14 4.5 Other soft tissues 14 4.6 Retention in the skeleton 15
5 Summary of ICRP model parameter values for adults and model predictions 20
6 Additional data on urinary excretion of uranium 22
7 Sensitivity analysis of the effect of changes of ICRP model parameter values on urinary excretion rates 25
8 The Wrenn et al. (1994) model for the systemic biokinetics of uranium 28
9 Uncertainties in key parameter values of the ICRP model 30
10 Indicative uncertainty analysis of doses estimated from urine measurements using the ICRP systemic model 31
11 Indicative uncertainty analysis of doses estimated from urine measurements using the ICRP systemic model and respiratory tract model 36
12 Probabilistic uncertainty analysis of doses estimated from urine measurements using the ICRP systemic model and respiratory tract model 41
13 Discussion 45
14 Recommendations for research 48
15 References 49


INTRODUCTION
1
1 INTRODUCTION
This is the second of three reports that consider the assessment of radiation doses and health risks to individuals exposed to depleted uranium (DU) on the basis of measurements of uranium in urine samples. The first report (Bailey and Puncher, 2007) provides an overall introduction to this work and addresses the effect of uncertainties and variability in the behaviour of inhaled DU in the respiratory tract on dose assessments. The third report (Hodgson et al. 2007) addresses the possibility of alterations in kidney function due to uranium toxicity and consequent effects on urinary excretion and on dose assessments. This report considers uncertainties in the behaviour of uranium absorbed to blood, including its deposition and retention in body tissues and its urinary excretion, and the effect these uncertainties have on dose assessments.
The measurement of uranium in urine samples is a standard method for the assessment of intakes and radiation doses (ICRP, 1979; 1997), applied in the nuclear industry for many years. During the last few years, urine analysis has been used to monitor possible exposures to DU following the use of DU munitions (e.g. Portuguese Nuclear and Technological Institute, 2001; Roth et al. 2001; Meddings and Haldiman, 2002; Ough et al. 2002; McDiarmid et al. 2004). Intakes and doses from DU can be assessed on the basis of its 238U:235U isotopic ratio which is greater than that of natural uranium (Parrish et al. 2006).
The International Commission on Radiological Protection (ICRP) publishes dose coefficients (Sv Bq-1) for intakes of radionuclides by inhalation or ingestion, giving both equivalent doses to individual organs and tissues and effective dose (ICRP, 1979, 1994b). ICRP also publishes data for the interpretation of bioassay measurements (ICRP, 1997). Dose coefficients are calculated using biokinetic and dosimetric models (ICRP, 1979). Biokinetic models represent the movement of radionuclides within the body and allow the calculation of the number of radioactive decays occurring in different “source” organs or tissues. Dosimetric models are then used to determine energy deposition and dose in “target” organs and tissues per decay occurring in source regions. The basic quantity calculated is absorbed dose (Gy), from which ICRP calculates equivalent dose to organs and tissues, and effective dose (Sv). Equivalent dose takes account of the relative biological effectiveness (RBE) of different radiations using radiation weighting factors (wR). Effective dose is the sum of equivalent doses, taking account of the contribution of individual organs and tissues to the total risk of cancer and hereditary effects, using tissue weighting factors (wT).
ICRP methodology provides an internationally accepted basis for the assessment of doses and risks. The main intended application of dose coefficients is in prospective planning and in this context some degree of conservatism in assessed doses is acceptable. However, the same modelling approaches are used in the interpretation of bioassay data for workers, in retrospective assessments of public doses, and in interpretation of epidemiological data. For these applications, and particularly for estimating organ and tissues doses (Gy) for epidemiological analyses, it is important that models are as realistic as possible. Models that give conservative values for dose
UNCERTAINTY ANALYSIS OF THE ICRP SYSTEMIC MODEL FOR URANIUM AS APPLIED TO INTERPRETATION OF BIOASSAY DATA FOR DEPLETED URANIUM
2
coefficients may not be conservative when used to interpret urine measurements and may therefore result in underestimates of doses.
While ICRP reports include reviews of biokinetic data on which models are based, they do not provide any assessment of levels of uncertainty associated with dose coefficients. There is an increasing recognition, however, that quantitative estimates of uncertainties may be important in the assessment of doses and risks in particular circumstances. It is important to distinguish between uncertainty and variability. Uncertainty refers to the level of confidence that can be placed in model parameter values and estimates of dose as central values for a population or group. Variability refers to quantitative differences between different members of the population or group in question. With good data, it is possible to have low uncertainty on a central value for a population but substantial individual variation. However, variability will be an important source of uncertainty in the estimate of a central value when the estimate is based on a few, highly variable observations.
The ICRP Human Respiratory Tract Model (HRTM) provides both biokinetic and dosimetric models to describe the behaviour of radionuclides in the respiratory tract, determine the number of disintegrations occurring in different source regions and calculate doses in specified target regions (ICRP, 1994a). The report by Bailey and Puncher (2007) considers uncertainties and variability in biokinetic parameter values in the model as applied to the inhalation of DU. It identifies key parameter values contributing to overall uncertainty, and provides an assessment of overall uncertainties in estimates of lung dose and effective dose on the basis of measurements of uranium in urine.
This report provides a review of the ICRP (1995a) biokinetic model for uranium absorbed to blood and discusses the data used to build the model and set parameter values. It includes a detailed examination of available data on urinary excretion and the basis for model predictions of urinary excretion at later times, taken to be 100 – 10,000 days after intake to blood. Comparisons are made between the ICRP model and a model developed by Wrenn et al. (1994). The ICRP model is analysed to identify the parameters that have the greatest influence on urinary excretion rates. Uncertainty in the values of these parameters is assessed as input to analyses of possible uncertainties in doses assessed on the basis of measurements of uranium in urine at different times after intake. On this basis, uncertainty analyses are provided for uranium entering blood and for inhaled DU. The report concludes with recommendations for further research.
2 OVERVIEW OF THE MODEL
Figure 1 shows the biokinetic model used by ICRP (1995a) for uranium absorbed to blood, as developed by Leggett (1994). It is essentially the same as the model developed for the alkaline earth elements, strontium, radium (ICRP, 1993) and calcium (ICRP, 1995b), reflecting the similarity in behaviour of uranyl (UO2
2+) and Ca2+ ions. The only structural difference in the models is the inclusion of a red blood cell compartment in the uranium model to allow for observed retention of uranium by circulating cells, not seen for the alkaline earth elements. For uranium, as for the alkaline earth elements, the

OVERVIEW OF THE MODEL
3
most important site of long-term retention is the skeleton. However, the behaviour of uranium differs quantitatively from that of the alkaline earth elements, with notable differences being the rapidity of urinary excretion of uranium and the proportion of retained uranium accounted for by the kidneys.
Figure 1. The ICRP (1995a) systemic model for uranium.
Transport of uranium between compartments in the model is assumed to follow first-order kinetics. Parameter values are expressed as transfer rates (d-1) between compartments because software packages for the implementation of compartmental models usually require transfer rates as input (Table 1). The term transfer rate, as used here, indicates fractional transfer per unit time from one compartment to another. The total transfer rate from a compartment refers to the sum of all transfer rates from that compartment. Most of the transfer rates used in the model are secondary values
OTHER SOFT TISSUES
INTERMEDIATE TURNOVER (ST1)
RAPID TURNOVER (STO)
SLOW TURNOVER (ST2)
PLASMA
CORTICAL VOLUME
NONEXCH EXCH
CORTICAL SURFACE
TRABECULAR VOLUME
NONEXCH EXCH
TRABECULAR SURFACE
LIVER 2 LIVER 1
SKELETON
URINE URINARY BLADDER CONTENTS URINARY PATH
KIDNEYS
GI TRACT
CONTENTS
FAECES
RBC
OTHER KIDNEY TISSUE

UNCERTAINTY ANALYSIS OF THE ICRP SYSTEMIC MODEL FOR URANIUM AS APPLIED TO INTERPRETATION OF BIOASSAY DATA FOR DEPLETED URANIUM
4
calculated by Leggett (1994) from selected data on deposition fractions and removal half-times (see Section 5).
Table 1. Transfer rates used for adults in the ICRP (1995a) model. Path Transfer rate (d-1) Plasma to soft tissue, extracellular fluid (ST0) 10.5
Plasma to red blood cells (RBC) 0.245
Plasma to urinary bladder 15.43
Plasma to kidneys (urinary path) 2.94
Plasma to kidneys (other kidney tissues) 0.0122
Plasma to upper large intestine (ULI) 0.122
Plasma to liver (1) 0.367
Plasma to soft tissues, intermediate turnover (ST1) 1.63
Plasma to soft tissues, slow turnover (ST2) 0.0735
Plasma to skeleton, trabecular surfaces 2.04
Plasma to skeleton, cortical surfaces 1.63
Extracellular fluid (ST0) to plasma 8.32
Red blood cells (RBC) to plasma 0.347
Other kidney tissues to plasma 0.00038
Liver 1 to plasma 0.092
Liver 2 to plasma 0.00019
Soft tissues ST1 to plasma 0.0347
Soft tissues ST2 to plasma 0.000019
Bone surfaces to plasma 0.0693
Non-exchangeable trabecular bone volume to plasma 0.000493
Non-exchangeable cortical bone volume to plasma 0.0000821
Urinary path to urinary bladder 0.099
Liver 1 to Liver 2 0.00693
Bone surfaces to exchangeable bone volume 0.0693
Exchangeable bone volume to bone surfaces 0.0173
Exchangeable bone volume to non-exchangeable bone volume 0.00578
Deposition fractions describe the initial distribution of uranium leaving the circulation; that is all losses from plasma in the model, except that to ST0 which represents rapidly exchanging extra-vascular tissue fluids. Deposition fractions are used mainly to translate experimental data into model transfer rates. In practice, they correspond to the portions of intravenously injected uranium that can be found in the various compartments (tissues and excreta) at 1 d after injection. The removal half-time from a compartment refers to the biological half-time that would be observed, theoretically, if outflow from that compartment continued while feeds from all other compartments were stopped. Such removal half-times are, therefore, generally shorter than apparent half-times observed when there is recycling between compartments.

DATA ON THE SYSTEMIC BIOKINETICS OF URANIUM
5
3 DATA ON THE SYSTEMIC BIOKINETICS OF URANIUM
3.1 Main types of data
Direct human data (H1) on the systemic biokinetics of uranium come from controlled studies as well as occupational and environmental studies (Leggett, 1994; ICRP, 1995a). The usefulness of H1 data for building a biokinetic model for uranium is limited by the following factors:
1. the controlled studies involved mainly seriously ill persons;
2. for many of the environmental studies, measurements of low concentrations of uranium in tissues and fluids may be unreliable, particularly in studies conducted more than 30-40 years ago;
3. for occupational studies, the pattern of intake usually is not well established.
The biokinetics of uranium have been studied extensively in laboratory animals (A1 data). Data from more than thirty animal studies were used in different ways in the development of parameter values for the ICRP’s systemic model (Leggett, 1994). Four of these studies involved baboons and six involved dogs. The animal data helped to fill gaps in the human data and in some cases were used instead of questionable human data. In addition to uncertainties regarding interspecies extrapolation of results, the animal data have many of the same problems that complicate the human studies. For example, most animal studies involved administration of relatively high masses of uranium; there was often limited sampling of tissues, particularly bone and massive soft tissues such as muscle, fat, and skin; and some studies involved small numbers of animals.
A summary of human data used in the model is given in the sections below (3.2, 3.3) and the human and animal data are discussed together in section 4 in an examination of the basis for the choice of parameter values in the ICRP model.
3.2 Summary of controlled studies on human subjects
Direct information on the systemic biokinetics of uranium comes principally from three controlled studies on human subjects, called the Boston study, the Bassett study (also called the Rochester study), and the Terepka study.
The Boston study (Struxness et al. 1956; Bernard and Struxness, 1957; Luessenhop et al. 1958) involved at least 11 patients, ages 26-63 y, in the terminal phases of diseases of the central nervous system. Most of the Boston subjects were comatose at the time of injection. Uranyl nitrate solutions enriched with 234U and 235U were administered to Subjects 1-6 and Subjects 9-11 by intravenous injection. Subjects 7 and 8 received intravenous injections of tetravalent uranium as UCl4. The mass of administered uranium was varied from one subject to another but ranged up to about 0.9 mg/kg. Due to difficulties with the injection apparatus or discrepancies between protocol sheets and

UNCERTAINTY ANALYSIS OF THE ICRP SYSTEMIC MODEL FOR URANIUM AS APPLIED TO INTERPRETATION OF BIOASSAY DATA FOR DEPLETED URANIUM
6
analysis of dummy injections, the mass of injected uranium is known only approximately for Subjects 2, 9, 10 and 11. In some cases, several bone biopsy samples were taken from the anterior tibia during the first day or two after injection. Extensive measurements of uranium in blood and excreta were made over the first several weeks or months after injection. Urinary uranium measurements were made over several months in some of the Boston subjects and extended to times >1 year for one subject. Autopsy samples were obtained from various bones and soft tissues of subjects dying at times from 2.5 d to 4.5 months after injection and from one subject dying 566 d after injection.
Selected data from the Boston study are summarised in Table 2. The range of values given for bone indicate the lower and upper bounds derived from different assumptions regarding the portion of the skeleton represented by samples collected at autopsy.
Table 2. Summary of results for eight of the Boston subjects who were injected with uranyl nitrate, based on data of Struxness et al. (1956) and Bernard and Struxness (1957) and logbooks from the Boston study. From Leggett (1994).
Subject number / time to death, days % administered uranium
1/ 2.5 6/ 18 9/ 25 11/ 28 2/ 74 10/ 94 5/ 139 3/ 566
Urinary uranium, day 1 59 49 ~80 ~60 78 ~80 67 84
Kidney 14 6 1.7 1.6 0.6 0.8 1.0 0.3
Bone 8-12 4-13 1.5-2.5 2-3 1.2-2 2.5-3 0.5-0.7 1.1-1.7
Liver 1.5 1.0 0.2 0.05 0.2 0.01 0.15 0.05
Other soft tissues 6 4 1 2 1.5 2.5 0.5 0.3
The poor physical conditions of the Boston subjects limits the confidence with which the data can be taken to represent the typical biokinetics of uranium. Struxness et al. (1956) pointed out that the bed-ridden condition of these subjects indicated a negative calcium balance, which might "hasten the removal of uranium from the skeleton". Also, the subjects were given relatively high masses of uranium. Animal studies indicate that administration of high masses of uranium will result in elevated uptake and retention in kidneys, among several potential effects on biokinetics (Bernard and Struxness, 1957; Leggett 1989, 1994). A third difficulty is that the post-mortem data are not sufficiently detailed in some cases to allow a close determination of the total uranium content of some massive tissues, particularly the skeleton.
The Bassett (Rochester) study involved six subjects, ages 24-61 y, two female and four males, chosen because they had reasonably good kidney function and their urine was free of protein (Bassett et al. 1948). These subjects were hospital patients but were ambulatory. Subject 1 suffered from rheumatoid arthritis, subject 2 from cirrhosis of the liver, subject 3 from chronic undernutrition, subject 4 from alcoholism, subject 5 from unresolved pneumonia, and subject 6 from pulmonary fibrosis and a gastric ulcer. The subjects received intravenous injections of uranyl nitrate solutions enriched with 234U and 235U. Administered masses ranged from 6.3 to 70.9 μg uranium /kg. Total urine and

DATA ON THE SYSTEMIC BIOKINETICS OF URANIUM
7
faecal collection was made for periods ranging up to 16 d, and several blood samples were taken.
Terepka and co-workers (Terepka et al. 1964; Hursh and Spoor, 1973) investigated the possibility of evaluating bone disorders based on the level of retention of intravenously injected uranium. They injected hexavalent uranium (30 μg/kg) into three control patients and seven patients with various bone disorders (Paget's disease, hyper- or hypoparathyroidism, osteomalacia, senile osteoporosis). Some patients were investigated before and after oestrogen or parathyroid extract treatments. Urinary excretion of uranium was measured for at least 6 d in each subject. Subjects with osteomalacia and Paget’s disease showed radically reduced urinary uranium compared with controls, presumably due to radically increased uptake of uranium by the skeleton. Cumulative urinary uranium over 6 d was similar in controls and subjects with osteoporosis or hyper- or hypoparathyroidism.
3.3 Information from occupational and environmental studies
Additional information on the biological fate of uranium in humans is provided by post- mortem measurements of uranium in tissues of occupationally and environmentally exposed subjects (Table 3). These studies provide information on the long-term distribution of uranium in the human body, i.e., the relative quantities of uranium in different tissues. Some limitations of the post-mortem data for modelling purposes are:
1. the small numbers of subjects examined in most studies;
2. uncertainties in the exposure histories of those subjects;
3. uncertainties in estimates of total-organ contents of the subjects based on small samples of tissue, particularly skeletal tissues; and,
4. in some cases, unreliable techniques for determining low concentrations of uranium in tissues or fluids.

UNCERTAINTY ANALYSIS OF THE ICRP SYSTEMIC MODEL FOR URANIUM AS APPLIED TO INTERPRETATION OF BIOASSAY DATA FOR DEPLETED URANIUM
8
Table 3. Relative amounts of uranium in total liver, total kidneys, and total skeleton as determined from post-mortem measurements on occupationally or non-occupationally exposed human subjects. From Leggett (1994). Subjects Liver
contenta
(μg uranium)
Ratio of Kidney : liver contentb
Ratio of skeleton:liver contentb
New York residents (Fisenne and Welford, 1986) 0.36 0.37 19 (V)c
Pennsylvania residents (Singh et al., 1986) 0.22 0.56 34 (R,V)
Utah residents (Singh et al., 1986) 0.9 0.47 25 (R,V)
Colorado residents (Singh et al., 1986) 0.54 0.57 36 (R,V)
Tokyo residents (Igarashi et al., 1985) 0.43 0.24 16 (F,R,Sk)
Uranium worker, 26-y exposure (Kathren et al., 1989) 216 0.36 23 (R,V,S)
Uranium worker, 10-y exposure (Donoghue et al. 1972) 35 0.86 29 (S)
Uranium worker, 2-y exposure (Roberts et al. 1977) 6 3.2 74 (R,V,S)
Uranium worker, 9-y exposure (Campbell 1975) 6.6 3.8 45 (F,R,S,V)
Uranium worker, 28-y exposure (Campbell 1975) 8 0.18 50 (F,R,V)
Uranium miller, 33-y exposure (Singh et al. 1987) 14 0.20 20 (V)
Uranium miller, 4-y exposure ~30 y before (Singh et al.1987) 0.9 0.60 150 (V)
Uranium miner (Singh et al. 1987) 6 0.50 24 (V)
Median 0.50 29 aBased on measurement of 238U where available; otherwise, assumption made that isotopic ratios were same as for natural uranium. bIf organ contents and organ weights were not reported, ratio of kidney mass to liver mass was assumed to be 0.172 (ICRP, 1975). Reported concentrations in bones were converted to ash weight; Basis percent ash weights of bones assumed to be 15% for vertebra and sternum, 25% for rib, and 35% for femur and skull (Fisenne et al., 1988). Weight of total bone ash was assumed to be 1.556 times wet weight of liver (ICRP 1975). cSampled bones indicated in parentheses; V = vertebra, R = rib, F = femur, Sk = skull, S = sternum.
4 BASIS FOR THE ICRP MODEL PARAMETER VALUES FOR ADULTS
4.1 Blood clearance
Uranium entering the blood is rapidly taken up by tissues or excreted in urine. In human subjects given uranium nitrate intravenously, on average about 25% remained in the blood after 5 minutes, 5% after 5 hours, 1% after 20 hours and less than 0.5% after 100 hours, although inter-subject variation was high (Bassett et al. 1948; Bernard et al. 1957; Struxness et al. 1956; Bernard and Struxness, 1957; Luessenhop et al. 1958). Baboon and dog data are reasonably consistent (Figure 2).

BASIS FOR THE ICRP MODEL PARAMETER VALUES FOR ADULTS
9
Figure 2. Comparison of rates of clearance of uranium from blood in human subjects (Bernard and Struxness, 1957), a baboon (Lipsztein, 1981) and a dog (Rowland and Farnham, 1969). From Leggett (1994).
Rapid excretion is consistent with the presence of uranium in plasma mainly in the form of ultrafilterable low molecular weight ligands, as demonstrated in animal studies, with the remainder weakly associated with transferrin and other plasma proteins (Stevens et al. 1980; Cooper et al. 1982; Durbin, 1984). In addition, the rapid loss of uranium from the circulation in the first few minutes after injection is attributable to a high rate of diffusion into extracellular fluid. Morrow et al. (1982) estimated that soft tissues of beagles given intravenous injections of UO2F2 contained about 24% of the administered amount after 24 hours and 4% after 48 hours, consistent with rapid entry of uranium into extracellular fluid and subsequent return to the circulation.
Limited measurements on human blood containing environmental levels of uranium indicated that a large proportion was associated with red blood cells (Lucas and Marcun, 1970; Fisenne and Perry, 1985). However, it has been suggested that these measurements of background levels of uranium in blood are unreliable (Byrne and Benedik, 1991). Measurements of uranium in plasma and red blood cells of baboons after intravenous injection of uranium showed that red blood cells contained on average about 10% of circulating uranium after 2 hours, 25% after 6 hours, 80% after 1 day and 60% from 1 - 49 days (Lipsztein, 1981; Figure 3). These data indicate that about 0.5 – 1% of uranium from plasma attaches to red blood cells and is returned to plasma with a half-time of about 1 day (Leggett, 1994).

UNCERTAINTY ANALYSIS OF THE ICRP SYSTEMIC MODEL FOR URANIUM AS APPLIED TO INTERPRETATION OF BIOASSAY DATA FOR DEPLETED URANIUM
10
Figure 3. Plasma clearance and red blood cell (RBC) binding of uranium in baboons after intravenous injection (Lipsztein, 1981). From Leggett (1994).
In the ICRP model, plasma is taken to be a uniformly mixed pool from which uranium is removed at a rate of 35 d-1. Compartment ST0 represents extracellular fluid in soft tissues and receives 30% of uranium leaving plasma. The assumed removal half-time from ST0 to plasma is 2 hours. These parameter values result in model predictions that are in reasonable accord with data for blood clearance in humans (Figure 4) and animal data on binding of uranium to red blood cells and rapid uptake and subsequent loss of uranium from soft tissues, assumed to be due to exchange with non-vascular extracellular fluids.
Figure 4. Observations (points) and model predictions (line) of retention of uranium in blood during the first few weeks after intravenous injection. Data from Bernard and Struxness (1957). From Leggett (1994).

BASIS FOR THE ICRP MODEL PARAMETER VALUES FOR ADULTS
11
4.2 Urinary excretion and renal retention
In the Rochester study (Bassett et al. 1948; Hursh and Spoor, 1973), in which six patients were given intravenous injections of different masses of uranium (VI) nitrate (see section 3.2), approximately 50% of the administered uranium was excreted in 3-10 hours, an average of 76% (range 66.6-84.7%) by 24 hours and 81.3% (range 71.5-87.6%; 5 patients) by 5 days. Because of the rapid excretion and the small proportion excreted daily after the first few days, the amounts in urine soon became undetectable (below detection limits reported as about 1 µg uranium per sample, except for patient 6 with a reported detection limit of about 6.5 µg). For example, for patient 1 who received 385 µg uranium, 82% was excreted in the first 21 hours (about 317 µg), 2% in the following 24 hours (9 µg) and a measurement between 69 and 93 hours after administration was below the limit of detection; that is, less than 0.2%. For patient 4 who received 1918 µg uranium, 67% was excreted within 20 hours (1278 µg) and by 8 days after injection the level of activity in 24-hour urine samples had fallen to about 0.1% (below 2 µg). Measurements were continued on patient 4 up to 17 days after injection, the longest period over which uranium was measured in the urine in any of the patients. However, beyond day 8, uranium was not consistently detected in 24 hour urine samples. No uranium was detected on days 9, 12, 13, and 17, indicating that these samples contained less than 0.2-1.2 µg uranium, equivalent to 0.03-0.06% of the injected amount. Day 16 was the last day on which a positive measurement was made, of 0.5 µg uranium, equivalent to 0.03%. The longest unbroken series of measurements was made for patient 6, over 13 days. The 24 hour urine sample for day 13 contained 10.6 µg uranium, equivalent to 0.27%. No uranium was detected in the 24 hour sample for day 14, and the uranium content was therefore less than 6.5 µg or 0.17%.
In the Boston study (Struxness et al. 1956; Bernard and Struxness, 1957; Bernard et al 1957; Bernard 1958; Luessenhop et al. 1958; Hursh and Spoor, 1973), six patients received injections of between 4.3 and 50 mg of uranium (see section 3.2). The average urinary excretion in the first 24 hours was 69% (range 49.1-83.8%) of the injected amount, rising to 73% (range 53-88%) at 48 hours. Two patients that died at 136 and 139 days after injection had excreted 88.1% and 86.6% of the injected amounts, respectively. The longest surviving patient had excreted approximately 98% after 201 days and 100% after 566 days.
In the study by Terepka and co-workers (Terepka et al. 1964; Hursh and Spoor, 1973), three male controls and seven patients (3 male, 4 female) with various bone diseases were given intravenous injections of natural uranium (VI), 30 µg/kg body weight (see section 3.2). In the control patients the average cumulative excretion of uranium in the urine was 62.4% (range 61.5-64.3%) of the injected amount on day 1 and 69.8% by day 5. The average amount excreted on day 5 was 0.5% (range 0.4-0.6%) of the administered amount. Similar results were observed for 2 patients with osteoporosis where bone formation is virtually unaffected (average cumulative excretion of 59.8% on day 1 and 69.9% by day 5). However, in patients with Paget’s disease and osteomalacia, urinary excretion was lower, with an average value on day 1 of 17.3% (range 16.0-18.3) and 33.4% (range 34.2-36.6) respectively. Daily urinary excretion reduced rapidly in all the patients whether or not they had bone diseases. For example, a 72 year-old male control patient excreted 61.5% of the injected amount on day 1,

UNCERTAINTY ANALYSIS OF THE ICRP SYSTEMIC MODEL FOR URANIUM AS APPLIED TO INTERPRETATION OF BIOASSAY DATA FOR DEPLETED URANIUM
12
3.8% on day 2 and 0.4% on day 6. A 60 year-old patient with osteomalacia excreted 34.2% on day 1, 5% on day 2 and 1% on day 6.
Urinary excretion of uranium in five baboons given intravenous injections of uranyl nitrate averaged 67% (range 58-76%) on day 1 and 75% (range 64.1-84.8%) by day 4 (Lipsztein, 1981). On day 4, the 24 hour urine samples contained between 0.7 and 2.5% of the injected activity. The data from day 8 onwards were limited to two animals and from day 22 until the end of the study on day 29 results were given for one animal. Between day 4 and day 21 about 3.1-3.8 % of the injected activity was excreted in the urine with the amount in 24-hour urine samples falling gradually from 0.7-0.8% on day 5 to between 0.04 and 0.1 % on day 21, and then remaining between 0.03 and 0.05% until day 29. In beagle dogs given intravenous injections of uranium nitrate in citrate buffer, urinary excretion ranged from 22 to 58% of the injected activity on day 1, rising to a mean cumulative urinary excretion of 83% at 3 weeks (Stevens et al. 1980). Although the study ran for 726 days, little information was provided on urinary excretion. In beagles given UO2F2 intravenously, cumulative excretion in individual animals was 56% after 1 day, 77% after 3 days, 79% after 6 days and 87% after 14 days (Morrow et al. 1982).
In summary, the human data show that typically about two-thirds of intravenously injected uranium is excreted in the first 24 hours and roughly a further 10% over the next 5 days. Similar results were obtained for baboons and beagle dogs. The human and animal data indicate that most of the remaining uranium is excreted over a period of a few months, but a few percent of the amount injected may be retained for a period of years (Bernard et al. 1957; Struxness et al. 1956; Luessenhop et al. 1958; Stevens et al. 1980; Sontag, 1984).
A substantial fraction of uranium filtered by the kidneys is temporarily retained in the renal tubules before passing in the urine to the urinary bladder. Morrow et al. (1982) estimated that the kidneys of beagle dogs contained 44% of uranium reaching blood at 6 hours after inhalation of UO2F2 and 16% after 24 hours. At 1 – 3 days after inhalation or injection of soluble forms of uranium, the kidneys of humans, dogs and rats contained 12 – 25% of the amount entering blood (Bernard and Struxness, 1957; Muir et al. 1960; Jones, 1966; Stevens et al. 1980; Morrow et al. 1982). Durbin (1984) reviewed data on the retention of uranium in the kidneys of humans, beagles, rats and mice and concluded that 92 – 95% of the renal content at 1 day was lost with a half-time of 2 – 6 days and the remainder was lost with a half-time of 30 – 340 days.
In the ICRP model, urinary excretion is assumed to occur directly from plasma to the urinary bladder contents, accounting for 63% of uranium leaving the circulation, and after temporary retention in renal tubules, denoted urinary path in the model (Figure 1), accounting for a further 12% of uranium leaving the circulation. The half-time of retention in the renal tubules is taken to be 7 days. The model also includes other kidney tissues which are assumed to receive 0.05% of uranium leaving the circulation, retained with a half-time of 5 years. These parameter values were chosen to be consistent with data on urinary excretion and renal retention of uranium, including data for the relative retention in kidneys and liver in environmentally exposed humans (Tables 3 and 4).

BASIS FOR THE ICRP MODEL PARAMETER VALUES FOR ADULTS
13
Table 4. Comparison of measured and model-generated uranium contents of post-mortem tissues from environmentally exposed subjects from the United States. Assumes inhalation intakes of uranium are negligible compared with ingestion intakes, GI uptake is 2%, and daily intakes of uranium are 1.75 and 4 μg uranium d-1 in the eastern and western states, respectively. From Leggett (1994). Subjects Liver uranium
content Kidney:Liver Skeleton:Liver
New York and Pennsylvania residents Observed (average) Model
0.29 μg 0.23 μg
0.47 0.50
27 27
Colorado and Utah residents Observed (average) Model
0.57 μg 0.52 μg
0.52 0.50
31 27
Figure 5 shows the agreement between human data for short-term urinary excretion and model predictions. Model predictions of daily urinary uranium during the first few days are in good agreement with the central values of the observations. No effort was made to reproduce the central values of the observations at later times due to the poor physical conditions of the subjects and the high variability of the data (R.W. Leggett, personal communication). Model predictions of daily urinary uranium are within the wide range of observations at all times but are generally higher than central values at times greater than a few days after injection. Essentially, predictions of urinary uranium at remote times are driven by parameter values for uptake and removal of uranium by individual tissues, particularly the skeleton, which is expected to contain most of the retained uranium by a few weeks after uptake (see below).
Figure 5. Observations and model predictions of cumulative urinary uranium in human subjects as a function of time after intravenous injection with uranium isotopes (Leggett, 1994). The three study groups indicated in the legend are described in the text.

UNCERTAINTY ANALYSIS OF THE ICRP SYSTEMIC MODEL FOR URANIUM AS APPLIED TO INTERPRETATION OF BIOASSAY DATA FOR DEPLETED URANIUM
14
4.3 Faecal excretion
Faecal excretion accounted for less than 1% of total excretion in the human studies discussed above (Leggett, 1994; ICRP 1995a). Similar results were obtained for baboons (Lipsztein, 1981). In beagles, an estimated 2 – 5% of injected uranium was excreted in the faeces in the first 2 weeks (Stevens et al. 1980; Morrow et al. 1982). In the ICRP model, faecal excretion is included as 0.5% of uranium leaving the circulation entering the upper large intestine.
4.4 Liver retention
The assumptions for uranium retention in the liver in the ICRP model are based on the available experimental data for humans, baboons and dogs, discussed above, and data for chronic exposures of humans, particularly environmental exposures (Tables 3 and 4). Two liver compartments are used to model the short-term retention of uranium shown by the experimental data and the long-term retention indicated by the environmental data. It is assumed that 1.5% of uranium leaving the circulation deposits in liver 1 (Figure 1) and that the retention half-time for this compartment is 7 days. Liver 2 receives 7% of uranium from liver 1, 93% being returned to plasma. The half-time of retention in liver 2 is assumed to be 10 years. Figure 6 shows the agreement between model predictions and short-term experimental data and Table 4 shows the agreement between model predictions and measured liver content in environmentally exposed persons.
4.5 Other soft tissues
The high short-term retention of uranium in soft tissues, attributable to transfer between plasma and extracellular fluid, is discussed above (section 4.1) and was modelled by ST0. Two other compartments are used in the ICRP model, called ST1 and ST2, corresponding to intermediate and long-term retention in soft tissues. Parameter values for these compartments were set for consistency with data for the Boston subjects (Figure 7) and data for chronic exposure suggesting that there may be significant long-term retention of uranium in soft tissues (Igarashi et al. 1985; Fisenne et al. 1988; Gonzales and McInroy, 1991). Thus, post-mortem data for two non-occupationally exposed persons indicate that muscle and skin accounted for about 25% of retained uranium, with 70% in the skeleton (Gonzales and McInroy, 1991).
Compartments ST1 and ST2 receive 6.65% and 0.3%, respectively, of uranium leaving the circulation, and are assumed to retain uranium with half-times of 20 days and 100 years respectively. The model predicts that chronic exposure will result in soft tissues accounting for about 20% of total body uranium.

BASIS FOR THE ICRP MODEL PARAMETER VALUES FOR ADULTS
15
Figure 6. Observations and model predictions of liver content of uranium. Humans (Bernard and Struxness, 1957), dogs (Fish and Bernard, 1961; Tannenbaum, 1951; Morrow et al. 1982; Stevens et al. 1980) and baboons (Lipsztein, 1981, Bhattacharyya et al. 1989). From Leggett (1994).
Figure 7. Observations and model predictions of the uranium content of soft tissues (other than liver and kidneys). Data from Bernard and Struxness (1957) and from original logbooks. From Leggett (1994).
4.6 Retention in the skeleton
The behaviour of uranium in the skeleton shows qualitative similarities to that of calcium and other alkaline earth elements (strontium, radium). There is evidence that UO2
2+ exchanges with Ca2+ at the surface of bone mineral crystals but does not participate in crystal formation or enter existing crystals (Neuman et al. 1948; Neuman, 1949-1953; Stevens et al. 1980). The size of the UO2
2+ ions is thought to prevent inclusion in the

UNCERTAINTY ANALYSIS OF THE ICRP SYSTEMIC MODEL FOR URANIUM AS APPLIED TO INTERPRETATION OF BIOASSAY DATA FOR DEPLETED URANIUM
16
internal domain of the crystal lattice so that they remain on crystal surfaces, subject to ion exchange reactions. The early distribution of uranium among different parts of the skeleton appears to be similar to that of calcium (Figure 8). Uranium is initially deposited on all bone surfaces, with the greatest concentrations in areas of growth. There appear to be differences between animal species in the extent of subsequent diffusion of uranium into bone mineral. Such diffusion has been observed in dogs (Rowland and Farnham, 1969; Stevens et al. 1980) but this may have been a processing artefact and was not seen in studies on rats and mice (Priest et al. 1982; Kisieleski et al. 1952). Figures 9 and 10 show autoradiographs of uranium-233 in sections of mouse bone at 1 day and 224 days after injection (Ellender et al. 1995). These autoradiographs are track-etch images created in plastic sheets placed adjacent to the tissue sections containing the alpha-emitting radionuclide; they do not show an image of the bone itself, only the alpha tracks in the plastic, etched with NaOH to make them visible. The autoradiographs illustrate the initial deposition of uranium on bone surfaces and the subsequent burial of such lines of activity as well as some evidence of diffuse activity within bone mineral. Thus, it appears that uranium shows similarities to other actinides, including plutonium, as well as to calcium (Ellender et al. 1995). In all species for which there are data, there is evidence of similarity to calcium in that return of uranium from bone to plasma occurs at rates that are greater than could be attributed only to bone resorption.
Figure 8. Comparative gross distribution of uranium and calcium in the beagle skeleton at 7 days after intravenous injection. Ca data from Wood et al. (1970) and uranium data from Bruenger et al. (1976).
The model for the skeleton used by ICRP for calcium and similar elements (ICRP, 1993) and applied to uranium (Figure 1) has the following characteristics:
1. Cortical and trabecular bone are considered separately, and for each there are three compartments representing bone surfaces, exchangeable bone volume and non-exchangeable bone volume.
2. Rapid exchange between bone and plasma is assumed to be confined to bone surfaces, meaning endosteal and periosteal surfaces, surfaces of Haversian and

BASIS FOR THE ICRP MODEL PARAMETER VALUES FOR ADULTS
17
Volkmann canals, surfaces of resorption cavities, and surfaces of trabecular bone (ICRP, 1995b). Bone surfaces do not include smaller structures within bone mineral and crystal surfaces.
3. Exchangeable bone volume provides for slower exchange, assumed to occur via bone surfaces.
4. Non-exchangeable bone provides for long-term loss resulting from bone resorption.
These assumptions are at best only partly accurate. The model is intended only to approximate the net result of the various processes involved in the time-dependent uptake and removal of calcium-like elements from bone, using first order kinetics and a minimal number of compartments.
Parameter values for uptake and retention in the skeleton were based on data from the Boston study, animal data, post-mortem measurements on environmentally and occupationally exposed humans, analogy with the alkaline earth elements and considerations of bone metabolism. Figure 11 shows experimental data and model predictions. Each of the data sets have important limitations to their usefulness for the prediction of the skeletal kinetics of uranium in healthy humans. As discussed in section 2.2, the Boston subjects were terminally ill and their calcium metabolism cannot reliably be regarded as normal. Extrapolation of animal data to man requires caution, particularly in this case for the rat data. Baboon data are very limited and the dog data are subject to uncertainties resulting from the use of high masses of uranium, small number of animals and small bone samples. Some other studies suggest higher deposition and retention of uranium in the skeleton than indicated in Figure 11. For example, Sanotskii et al. (1963, 1964) reported high initial deposition of uranium in the skeleton (25-40% of the administered amount) in dogs, rabbits and rats after subcutaneous or intratracheal administration of uranyl nitrate, although only 3 – 4% was retained after 6 months.
Figure 9. Autoradiograph of the distribution of uranium-233 in mouse femur at one day after injection showing uneven distribution of activity on bone surfaces and some diffuse activity throughout the bone.

UNCERTAINTY ANALYSIS OF THE ICRP SYSTEMIC MODEL FOR URANIUM AS APPLIED TO INTERPRETATION OF BIOASSAY DATA FOR DEPLETED URANIUM
18
Figure 10. Autoradiograph of the distribution of uranium-233 in mouse femur at 224 days after injection showing uneven lines of buried activity and small amounts of diffuse activity throughout the bone.
Figure 11. Observations and model predictions of retention of uranium in the skeleton. Data for humans (Bernard and Struxness, 1957 and original logbooks), dogs (Stevens et al. 1980; Morrow et al. 1982; Tannenbaum et al. 1951; Fish and Bernard, 1961), baboons (Bhattacharyya et al. 1989; Lipsztein, 1981) and rats (Sontag, 1984). From Leggett (1994).
In the ICRP model, it is assumed that 15% of uranium leaving the circulation deposits on bone surfaces. By analogy with the alkaline earth elements (ICRP, 1993), the ratio of the amount deposited on trabecular surfaces to that deposited on cortical surfaces is assumed to be 1.25 in the mature skeleton (after 25 years of age). The value of 1.25 is derived from an average six-fold greater rate of turnover of trabecular bone (Figure 12) divided by a four-fold greater cortical bone mass (Leggett et al., 1982; Leggett, 1992). The rate of removal of uranium from bone surfaces cannot be estimated with much certainty, but reasonable lower and upper bounds can be determined. Uranium apparently leaves bone surfaces much more slowly than calcium (Rowland and Farnham, 1969; Stevens et al. 1980), but a half-time longer than about 5 – 10 days

BASIS FOR THE ICRP MODEL PARAMETER VALUES FOR ADULTS
19
would be difficult to reconcile with the relatively rapid loss of uranium from bone seen in human and most animal studies. The assumption made is of a removal half-time of 5 days, compared with a value of 1 day for calcium (Leggett, 1992). Because of recycling, the apparent retention time on bone surfaces will be greater than 5 days. For consistency with the available experimental data for the first few weeks after injection, it is assumed that 50% of uranium from bone surfaces returns to plasma and 50% transfers to exchangeable bone volume.
The removal half-time assigned to the exchangeable bone volume is 30 days. This value was derived for radium and lead (Leggett, 1992, 1993). From exchangeable bone volume, 75% of uranium is returned to bone surfaces and 25% transfers to non-exchangeable bone volume. These values were chosen by Leggett (1994) to achieve broad consistency with the experimental data in Figure 11 and data for liver to skeleton ratios in chronically exposed humans (Tables 3 and 4). Removal from non-exchangeable bone volume to plasma is assumed to occur at the rates of bone turnover shown in Figure 12.
Figure 12. A model of the rate of turnover of cortical (solid line) and trabecular (dashed line) human bone as a function of age (Leggett et al., 1982, Leggett 1992).
The model predicts that the uranium content of the skeleton is about 30 times greater than that of the liver following constant chronic exposures to uranium, in good agreement with autopsy data for environmentally exposed subjects (Table 4) and data for uranium workers (Table 3). The model predicts that the adult skeleton contains about 75% of the body content of uranium after chronic exposure, consistent with autopsy data (Gonzales and McInroy, 1991).

UNCERTAINTY ANALYSIS OF THE ICRP SYSTEMIC MODEL FOR URANIUM AS APPLIED TO INTERPRETATION OF BIOASSAY DATA FOR DEPLETED URANIUM
20
5 SUMMARY OF ICRP MODEL PARAMETER VALUES FOR ADULTS AND MODEL PREDICTIONS
The basis for the choice of parameter values for adults for use in the ICRP model is discussed in detail above in Section 4. The model structure (Figure 1), transfer rates (Table 1) and an explanation of the general approaches adopted to specify model parameter values are given in Section 2. Here, the values used and model predictions are summarised.
For uranium entering blood plasma, the removal rate is taken to be 35 d-1. Plasma is assumed to be in rapid exchange with extra-vascular tissue fluids in soft tissues, represented by ST0 which receives 30% of uranium entering plasma; that is, the transfer rate is taken to be 0.3 x 35 d-1 = 10.5 d-1 (return rate from ST0 to plasma is 8.32 d-1). Deposition fractions to all other tissue compartments are then converted to transfer rates from plasma on the basis of a total removal rate of 35 – 10.5 = 24.5 d-1. For example, the transfer rate to liver, which has an initial deposition fraction of 1.5% is 0.015 x 24.5 = 0.367 d-1.
Initial deposition fractions from plasma are taken to be 63% for direct urinary excretion to the urinary bladder, 12% retained for a short period (removal half-time of 7 days) in the kidneys (“urinary path”) prior to excretion in the urine, and 15% deposited on bone surfaces. The remaining 10% is distributed to soft tissues, including the liver (1.5%) and a small proportion (0.05%) retained in kidney tissues and returning to plasma with a half-time of 5 years.
Short-term release of uranium from bone is modelled by a removal half-time from bone surfaces of 5 days. Half of the material leaving the bone surface returns to the plasma. The other half is transferred to exchangeable bone volume, of which 75% is returned to bone surfaces with a removal half-time of 30 days and the other 25% is transferred to non-exchangeable bone volume with the same half-time. Slow removal from non-exchangeable bone volume is assumed to occur at the rate of bone turnover, with values for adults taken to be 0.03 y-1 for cortical bone and 0.18 y-1 for trabecular bone.
Short-term release of uranium from the liver is modelled by a removal half-time of 7 days applying to “Liver 1”, with 93% returning to plasma. Long-term retention of the 7% uranium transferring form Liver 1 to Liver 2 is modelled by a removal half-time to plasma of 10 years. Soft tissue compartments ST1 and ST2 have initial deposition fractions of 6.65% and 0.3% and return uranium to plasma with half-times of 20 days and 100 years.
The model predictions in Table 5 and Figure 13 show that, consistent with experimental data, about 75% of uranium absorbed to blood is excreted in the urine in the following week, largely in the first day (65%). The main sites of retention after one week are the skeleton (11%), kidneys (7%) and other soft tissues (6%). By one to two months after entry into blood, around 90% of uranium has been excreted in the urine and daily urinary excretion has declined to around 0.1 – 0.2%. Retention in the kidneys has declined to 1% or less and the main sites of retention are the skeleton (6-8%) and soft tissues (1-3%). By 20 years after intake, the model predicts retention of about 1% in the skeleton

SUMMARY OF ICRP MODEL PARAMETER VALUES FOR ADULTS AND MODEL PREDICTIONS
21
and 0.3% in soft tissues. Figure 14 shows model predictions for continuous intake of uranium to blood and is included for comparison with data in Tables 3 and 4 for occupational and environmental exposures.
Table 5. ICRP (1995a) model predictions of the tissue retention and excretion of uranium as a function of time after entry into blood, expressed as a percentage of total uranium entering blood
Urine Faeces Time, d (y) Skeleton Liver Kidneys
Other soft tissues 24h Totala 24h Totala
1 14.3 1.4 11.2 7.1 64.5 64.5 0.2 0.2
3 13.1 1.2 9.5 6.7 1.8 68.5 0.09 0.4
7 11.3 0.9 6.8 6.1 1.2 74.2 0.007 0.5
10 10.4 0.7 5.3 5.6 0.9 77.3 0.004 0.5
30 8.1 0.2 1.1 3.3 0.2 86.7 0.001 0.6
70 6.4 0.1 0.2 1.3 0.06 91.4 0.0004 0.6
100 5.6 0.1 0.1 0.8 0.04 92.8 0.0002 0.6
365 (1) 3.6 0.1 0.06 0.4 0.002 95.2 <0.0001 0.6
1825 (5) 2.4 0.1 0.03 0.4 0.0006 96.4 <0.0001 0.6
3650 (10) 1.7 0.07 0.02 0.4 0.0003 97.2 <0.0001 0.6
7300 (20) 1.0 0.04 0.005 0.3 0.0001 97.9 <0.0001 0.7
10950 (30) 0.7 0.02 0.001 0.3 <0.0001 98.3 <0.0001 0.7
14600 (40) 0.5 0.009 0.0005 0.3 <0.0001 98.5 <0.0001 0.7
18250 (50) 0.4 0.005 0.0002 0.3 <0.0001 98.6 <0.0001 0.7 aTotal is cumulative excretion from time 0 to the specified time.
1.0E-07
1.0E-06
1.0E-05
1.0E-04
1.0E-03
1.0E-02
1.0E-01
1.0E+00
1 10 100 1000 10000
Time (d)
Bq
or B
q/d Skeleton
LiverKidneys24h Urine
Figure 13. ICRP (1995a) model predictions of the tissue retention and excretion of uranium as a function of time after entry into blood, expressed as Bq retained or Bq/d excreted following acute intake of 1 Bq of uranium isotopes to blood.

UNCERTAINTY ANALYSIS OF THE ICRP SYSTEMIC MODEL FOR URANIUM AS APPLIED TO INTERPRETATION OF BIOASSAY DATA FOR DEPLETED URANIUM
22
1.00E-01
1.00E+00
1.00E+01
1.00E+02
1.00E+03
1 10 100 1000 10000Time (d)
Bq
or B
q/d Skeleton
LiverKidneys24h Urine
Figure 14. ICRP (1995a) model predictions of the tissue retention and excretion of uranium as a function of time after entry into blood, expressed as Bq retained or Bq/d excreted following chronic intake of 1 Bq/d of uranium isotopes to blood.
6 ADDITIONAL DATA ON URINARY EXCRETION OF URANIUM
Those reports on urinary excretion of uranium cited by Leggett (1994) and ICRP (1995a) and used in the development of the ICRP model are discussed in detail in Section 4.2. There do not appear to be any further published studies of urinary excretion in humans, primates, monkeys or dogs after systemic administration of soluble forms of uranium. However, a review of the literature has identified a small number of other papers that contain useful data on other routes of exposure.
Two studies have been reported in which volunteers ingested uranium. In the first study (Butterworth 1955), 1 g of uranyl nitrate was administered orally to a volunteer in 200 cm3 of water. Urinary excretion of uranium was followed continuously for 7 days and then at intervals up to 30 days after administration, at which time uranium was still measurable in the samples. The estimated uptake of uranium into the body was 1% of the ingested material, ie 10 mg. Assuming a 10 mg uptake, the excretion as a percentage of absorbed uranium was approximately 22% at 1 day and 24% by 5 days after administration. However, the volunteer suffered from acute nausea, vomiting and two attacks of diarrhoea within the first 12 hours of the study. Leggett and Harrison (1995) considered that it was not possible to reliably estimate the uptake of uranium into the body under these conditions. In the second study (Hursh et al. 1969), 10.8 mg of uranyl nitrate was administered orally to each of 4 patients in 100 ml of ‘Coca Cola’ and urinary excretion of uranium was followed continuously for between 4 and 14 days. A few intermittent measurements were made beyond these times. The measured amounts of uranium in urine in subjects A – D were 0.2 – 0.3%, 0.7%, 1.1% and 3.0% of

ADDITIONAL DATA ON URINARY EXCRETION OF URANIUM
23
administered uranium, respectively. However, the rate of urinary excretion declined much more slowly than anticipated and, as pointed out by Leggett and Harrison (1995), cumulative urinary excretion of uranium had not reached a plateau for any of the subjects at the end of the primary period of administration. Leggett and Harrison (1995) discussed other data that show a prolonged pattern of urinary excretion after oral administration compared with intravenous injection. The human data and direct comparisons of excretion for the two routes of administration in a baboon (Larsen et al. 1984) are consistent with slow transfer of ingested uranium from the intestine to blood, with a half-time of 1 – 3 days. For example, the assumption of a 2 day half-time of retention of uranium in the intestinal wall reduces the ICRP model prediction of cumulative urinary excretion over the first three days from about 70% to an average of 45%, while excretion over the first month is the same in both cases (>85%). Leggett and Harrison (1995) reinterpreted the data of Hursh et al. (1969) and suggested absorption values for subjects A – D of 0.4, 1.2, 2.0, and 6.0%, respectively. Measured urinary excretion of 0.2 – 0.3%, 0.7%, 1.1% and 3.0% of administered uranium over periods of 11, 14, 10 and 8 days, respectively, would then correspond to about 50 – 60% of uranium reaching blood. Longer term measurements were made after 50 days on subject D (estimated absorption 324 µg uranium) who was still excreting 4 µg uranium per day (about 1% of the material absorbed) and after 5 months on subject A (estimated absorption 32 µg uranium) when no uranium was detected in the urine or faeces.
There are also a number of studies relating to accidental human exposure with soluble uranium materials. These fall into two categories: external skin contamination and inhalation.
Two cases of skin exposure have been reported. In 1955 (Butterworth 1955), a worker received severe skin burns over an area of 900 cm2 from exposure to uranyl nitrate solution. No urine samples were obtained for the first week after exposure. The results of later urine measurements indicated that uranium excretion may be more prolonged after absorption from injured skin than after absorption from the alimentary tract. Butterworth (1955) postulated that this difference was due partly to slower absorption through skin and also partly due to prolonged retention in the damaged skin. Albuminuria was reported in this case, indicating kidney damage, persisting until the beginning of the third week after exposure. Butterworth (1955) compared the case with observations on previous cases and found that the case was unusual in showing prolonged absorption, excretion and kidney damage. Wilson (1959) reported a case where a worker fell into a tank of uranyl nitrate solution and was completely immersed for about 1 minute before being pulled out. He removed his clothing and showered to remove the majority of the surface contamination within about 7 minutes of the time he had fallen in. He was then moved to hospital where all the remaining surface contamination was removed by scrubbing within 4 hours of the accident. Urinary excretion was followed by collecting individual urine samples for 10 days. Excretion fell from 838-850 µg uranium /litre urine on day 1, at 4-6 hours after immersion, to the below the limit of detection (3.2 µg uranium /litre) after 10 days (the last measurement was 0.7 µg in a 220 ml sample). If the estimate of uptake of 2000 µg uranium quoted in the report is assumed to be accurate, then 60% of the absorbed uranium was excreted on day 1 and 84% was excreted by day 5, values within the range of values obtained in intravenous injection studies.

UNCERTAINTY ANALYSIS OF THE ICRP SYSTEMIC MODEL FOR URANIUM AS APPLIED TO INTERPRETATION OF BIOASSAY DATA FOR DEPLETED URANIUM
24
Reported inhalation accidents considered here all involved exposure to uranium hexafluoride (UF6). In 1944 a tank of UF6 gas was ruptured in an explosion and 20 individuals were exposed to a cloud of UF6 steam and hydrolysis products, UO2F2 and hydrofluoric acid (HF). The cloud dispersed rapidly and the average exposure period was calculated as 17 seconds. The level of intake varied depending on where the workers were standing at the time of the explosion and two died within a short time of the accident. A number of other staff were hospitalised and the urinary excretion of uranium was recorded for 3 patients from day 3 to day 19 after the accident. However, it is difficult to analyse the results from these cases because the quantity of uranium excreted in the urine was only recorded up to day 10 for Case 3, day 5 for Case 4 and day 9 for Case 5 (Voegtlin and Hodge 1949-1953; Kathren and Moore 1986). A follow up of cases 4 and 5 undertaken 38 years later showed no detectable uranium retention and no physical findings attributable to uranium exposure.
Heatherton and Huesing (1959) reported on the urinary excretion of uranium by 12 workers up to 4 days after inhalation of UF6, following release of 4.5 lbs of UF6 from a pilot plant. Fisher et al. (1991) reported on an accidental inhalation of UF6, and its hydrolysis products UO2F2 and HF, by 31 workers, resulting from the rupture of a cylinder of UF6. Urine measurements were instigated for these workers from between 4 to 8 hours after the accident until the urine content had fallen to the limit of detection (3-5 µg uranium per litre urine) at about 15 days after the accident. In both studies, only the concentration of uranium in urine was reported, not the volume of urine produced, so no record of the total uranium excretion was retained. Data from the 1944 UF6 inhalation incident (Voegtlin and Hodge 1949-1953; Kathren and Moore 1986) indicates that, over the first few days, the volume of urine excreted in this type of accident may be substantially higher than the 1.6 litres quoted for ICRP Reference Man (ICRP 2002), although the reason for this is unclear. Therefore, it would be difficult make accurate estimates of excretion from these data.
All of the papers discussed in this section are summarised in Table 6. It can be concluded that there are no additional data, not considered by Leggett (1994) and ICRP (1995a), that would influence the judgements made in the development of the ICRP model and the choice of parameter values.

SENSITIVITY ANALYSIS OF THE EFFECT OF CHANGES OF ICRP MODEL PARAMETER VALUES ON URINARY EXCRETION RATES
25
Table 6. Research papers quoting data on excretion of uranium after exposure to soluble uranium by skin contact, ingestion or inhalation.
Chemical form Route of intake No. of Subjects Duration of study (measurements) , d Reference
Uranyl nitrate Oral / volunteer 1 29 (30) Butterworth 1955
Uranyl nitrate Oral / volunteer patients 4 9 – 150 (9 – 50) Hursh et al 1969
Uranyl nitrate Skin through burns 1 46 (7 – 53) Butterworth 1955
Uranyl nitrate Skin by complete immersion 1 10 (10) Wilson 1959
UF6, steam, hydrolysis products, UO2F2, HF
Accidental inhalation due to laboratory explosion
16
(5 studied)
19 (16) Voegtlin & Hodge 1949-1953; Kathren & Moore 1986
UF6 Accidental inhalation due to release from pilot plant
12 4 (4) Heatherton & Huesing 1959 (HASL-58)
UF6, hydrolysis products, UO2F2 and HF
Accidental inhalation 31 (11 studied)
2 y (10 – 15) Fisher et al 1990; 1991
7 SENSITIVITY ANALYSIS OF THE EFFECT OF CHANGES OF ICRP MODEL PARAMETER VALUES ON URINARY EXCRETION RATES
Sensitivity analyses offer a way of identifying the parameters that have the greatest influence on urinary excretion rates and hence assessed doses. Concentration can then be focused on these parameters in uncertainty analyses of doses assessed on the basis of measurements of uranium in urine at different times after intake.
The ICRP (1995a) model for uranium is quite complex with many variables. To conduct an exhaustive uncertainty analysis to investigate changes in activity retention or excretion in compartment i with respect to changes in rate j for all combinations of i and j would be impractical. To help limit the study to a more manageable size, partial differential sensitivity coefficients, Sij are used to identify and rank the important combinations so the computational effort can be better directed and unimportant parameters screened out (Khursheed and Fell, 1997; Saltelli et al. 2000). Formally
i
j
j
iij q
λλq
S ∂∂
= is the sensitivity of the contents of the ith compartment qi with respect to the
jth biokinetic transfer rate λj. They may be easier to interpret expressed as the following limit
j
ji
i
λij
λλ
Sj
Δ
Δ
lim=0>Δ
, so if Sij=1 a 1% change in λj produces a 1% change in qi.
The normalisation factor λj/qi ensures the coefficients are dimensionless which makes comparisons of different end-point sensitivities such as retention (Bq) or excretion rates (Bq/d) possible. The Sij may be positive or negative depending on whether qi increases or decreases with λj. They are time-dependent (see Figure 15) and, in a recycling model

UNCERTAINTY ANALYSIS OF THE ICRP SYSTEMIC MODEL FOR URANIUM AS APPLIED TO INTERPRETATION OF BIOASSAY DATA FOR DEPLETED URANIUM
26
such as that for systemic uranium, may change sign in the interval of interest (a compartment’s loss may eventually become its gain with feedback). Sensitivity analysis complements uncertainty analysis and they should not be confused.
-1
-0.8
-0.6
-0.4
-0.2
0
0.2
0.4
0.6
0.8
1
100 1000 10000
Time (d)
Sens
itivi
ty C
oeffi
cien
ts (S
ij)
Plasma to BladderTrab Vol 2 to PlasmaPlasma to Trab SurfTrab Surf to PlasmaTrab Surf to Trab VolTrab Vol to Trab SurfTrab Vol to Trab Vol 2
Figure 15. Sensitivity coefficients, Sij, for the urinary excretion rate of uranium after entry into blood. Note that “Trab Vol” is “Exchangeable trabecular volume” in the model (Figure 1) and “Trab Vol 2” is “Non-exchangeable trabecular volume”.
Examination of weighted organ dose contributions to effective dose shows little isotopic dependence for injections of 234U, 235U and 238U and the target tissues dominating (contributing more than 10% to) effective dose are gonads, red bone marrow (RBM), bone surfaces and liver. Given that all these radionuclides emit alpha particles the important sources for bone surface dose are cortical and trabecular surfaces and for RBM, trabecular surfaces. Since dose rate in the target tissue is proportional to the activity content qi of the source, these particular sources are of interest if the end-point of concern is dose. The sensitivity of the urinary excretion rate is
b
j
j
b
bb
j
j
bbbj q
qSλ
λλλ
λλ
∂∂
=∂
∂=
)()(
)( bj λλ ≠ or b
b
b
bbb q
qS λλ∂∂
+= 1 )( bj λλ =
where the suffix b identifies the bladder.
Some thought is required in interpreting the numerical values of Sij. A value of 1 means that a fractional change in the parameter leads to the same fractional change in the compartment contents (the changes are fractional because the right-hand side has been normalised by dividing the partial derivative by the ratio qi/λj). Small values of Sij indicate that the parameter has little effect on the compartmental contents for the particular

SENSITIVITY ANALYSIS OF THE EFFECT OF CHANGES OF ICRP MODEL PARAMETER VALUES ON URINARY EXCRETION RATES
27
combination of i and j. When Sij is positive it means that increases in the parameter result in increases in the contents, similarly a negative value indicates that increases in the parameter result in decreases in the contents.
Figure 15 shows Sij for the urinary excretion rate as a function of time for the period 100 to 10,000 days after entry of uranium to blood. Figure 16 compares mean values of the absolute magnitude of Sij , denoted <Sij>, for this same time period. Figure 15 is included to illustrate the time dependence of Sij for all rates. Rates for which the Sij lay within a band of + 0.2 were excluded from the analysis. The legend lists rates in the order of their <Sij> values, with the rate from plasma to urinary bladder having the most effect on urinary excretion. All the remaining rates with <Sij> values greater than 0.2 are for the movement of uranium into, within, or from the skeleton. For clarity of presentation, the rates shown in Figure 15 are limited to those for trabecular bone; rates for cortical bone are excluded. Figure 16 shows <Sij> values for all bone rates as well as for plasma to urinary bladder. Thus, the analysis shows that the rates having the greatest effect on urinary excretion throughout the period of interest are those for transfer of uranium from plasma to urinary bladder and all rates into, within and from bone.
0 0.1 0.2 0.3 0.4 0.5 0.6 0.7 0.8 0.9
Plasma to Soft Tissue 2
Soft Tissue 2 to Plasma
Cortical Volume 2 to Plasma
Trabecular Volume to Trabecular Volume 2
Cortical Volume to Cortical Volume 2
Cortical Volume to Cortical Surface
Trabecular Volume to Trabecular Surface
Cortical Surface to Cortical Volume
Cortical Surface to Plasma
Trabecular Surface to Trabecular Volume
Trabecular Surface to Plasma
Plasma to Cortical Surface
Plasma to Trabecular Surface
Trabecular Volume 2 to Plasma
Plasma to Bladder
Mean value of Sensitivity Coefficients (<Sij>)
Figure 16. Mean values of sensitivity coefficients, <Sij> , for the urinary excretion of uranium over the period from 100 – 10,000 days after entry into blood. Note that “Trabecular Volume” and “Cortical Volume” refer to “Exchangeable” compartments of the skeleton and “Trabecular Volume 2” and “Cortical Volume 2” refer to “Non-exchangeable compartments.

UNCERTAINTY ANALYSIS OF THE ICRP SYSTEMIC MODEL FOR URANIUM AS APPLIED TO INTERPRETATION OF BIOASSAY DATA FOR DEPLETED URANIUM
28
8 THE WRENN ET AL. (1994) MODEL FOR THE SYSTEMIC BIOKINETICS OF URANIUM
A systemic model for uranium was published by Wrenn et al. (1994) at about the same time as Leggett (1994) published the model that was used, with slight simplifications, by ICRP (1995a). The same data were used in the development of both models with the exception that Wrenn et al. (1994) did not take account of data for chronic environmental and occupational exposures. The Wrenn model is considerably simpler in form (Figure 17) than the model developed by Leggett and used by ICRP. It considers the skeleton as a single compartment rather than the six compartments used in the ICRP model. Thus, no attempt is made to take account of initial deposition on bone surfaces and subsequent process of movement into bone volume and loss by bone remodelling. In addition, the Wrenn model does not include the liver as a separate compartment, considers soft tissues as a single compartment, and does not model faecal excretion.
Table 7 compares predictions of the Wrenn and ICRP models. Notable differences are the lower initial uptake of uranium in the skeleton and soft tissues other than kidneys in the Wrenn model and the more rapid decline in retained activity at late times (by 10 years). This is illustrated graphically for the skeleton in Figure 18. It can be concluded that the Wrenn model may substantially underestimate urinary excretion at later times, resulting from release of the residual small proportion of retained uranium, mainly in the skeleton. Indeed, the authors concluded that their model was suitable for urine bioassay procedures “at least for time periods less than 100 days post intake”. A comparison of doses calculated using the two models, considering the example of an intake of uranium-238 directly to blood, showed that the effective dose obtained using the Wrenn model would be four times less than the ICRP value.
Figure 17. The Wrenn et al. (1994) model for the systemic biokinetics of uranium in adults.

THE WRENN ET AL. (1994) MODEL FOR THE SYSTEMIC BIOKINETICS OF URANIUM
29
Table 7. Wrenn et al. (1994) model predictions of the tissue retention and excretion of uranium as a function of time after entry into blood, expressed as a percentage of total uranium entering blood. (Values in brackets are ICRP model predictions from Table 5.)
Urine Time, d (y) Skeleton Kidneys
Other soft tissues 24h Totala
1 7.4 (14.3) 24.0 (11.2) 1.5 (7.1) 64.0 (64.5) 64.0 (64.5)
3 7.6 (13.1) 16.2 (9.5) 1.5 (6.7) 4.0 (1.8) 74.8 (68.5)
7 7.6 (11.3) 7.1 (6.8) 1.5 (6.1) 1.6 (1.2) 83.9 (74.2)
10 7.6 (10.4) 4.1 (5.3) 1.5 (5.6) 0.8 (0.9) 86.9 (77.3)
30 7.5 (8.1) 0.9 (1.1) 1.3 (3.3) 0.03 (0.2) 90.3 (86.7)
70 7.3 (6.4) 0.6 (0.2) 1.2 (1.3) 0.02 (0.06) 91.0 (91.4)
100 7.1 (5.6) 0.5 (0.1) 1.0 (0.8) 0.01 (0.04) 91.4 (92.8)
365 (1) 5.9 (3.6) 0.05 (0.06) 0.4 (0.4) 0.006 (0.002) 93.7 (95.2)
1825 (5) 2.1 (2.4) 0.004 (0.03) 0.009 (0.4) 0.002 (0.0006) 97.9 (96.4)
3650 (10) 0.5 (1.7) 0.001 (0.02) 0.002 (0.4) 0.0004 (0.0003) 99.4 (97.2)
7300 (20) 0.04 (1.0) <10-4 (0.005) 0.0001 (0.3) <10-4 (0.0001) 100 (97.9)
10950 (30) 0.0003 (0.7) <10-4 (0.001) <10-4 (0.3) <10-4 (<10-4) 100 (98.3)
14600 (40) 0.0002 (0.5) <10-4 (0.0005) <10-4 (0.3) <10-4 (<10-4) 100 (98.5)
18250 (50) <10-4 (0.4) <10-4 (0.0002) <10-4 (0.3) <10-4 (<10-4) 100 (98.6) aTotal is cumulative excretion from time 0 to the specified time.
1.0E-07
1.0E-06
1.0E-05
1.0E-04
1.0E-03
1.0E-02
1.0E-01
1.0E+00
1 10 100 1000 10000 100000
Time (d)
Ura
nium
ske
leta
l ret
entio
n (B
q)
Wrenn modelICRP model
Figure 18. Wrenn et al. (1994) model predictions of the skeletal retention of uranium, Bq, as a function of time after entry of 1 Bq into blood.

UNCERTAINTY ANALYSIS OF THE ICRP SYSTEMIC MODEL FOR URANIUM AS APPLIED TO INTERPRETATION OF BIOASSAY DATA FOR DEPLETED URANIUM
30
9 UNCERTAINTIES IN KEY PARAMETER VALUES OF THE ICRP MODEL
The relatively low coefficient of variation (CV) in the human or animal data on early cumulative urinary uranium and the consistency of the H1 and A1 data give fairly high confidence in model predictions of cumulative urinary uranium at early times. On the other hand, retention of uranium will have a high CV and might be considered fairly uncertain, even though it is nearly the complement of cumulative urinary uranium. For example, if all measurements of urinary uranium fell in the range 50-90% (high/low =1.8) to day 6 (Section 4.2 and Figure 5), then the CV for cumulative urinary uranium would be fairly low; however, the CV of 100% minus urinary uranium would fall in the relatively larger range 10-50% (high/low = 5), and its CV could be large. The high variability in uranium retention is an important contributing factor to a fairly high uncertainty in estimated tissue doses, particularly with regard to estimates for individuals but also with regard to central estimates. Uncertainties in retention, principally in the skeleton, are also important determinants of uncertainties in the interpretation of urine measurements made at later times after intake (after 1 month).
For injection of 234U, 235U, or 238U into blood, estimates of dose and interpretation of urine measurements are sensitive to at least three relatively uncertain aspects of the systemic model:
• skeletal retention at times remote from injection • the residence time of uranium on or near bone surfaces • cumulative activity of uranium in soft tissues other than liver and kidneys.
Although it is known that at most a few percent of absorbed uranium is retained beyond a few months, and that most of the retained amount is in the skeleton, typical skeletal retention at times remote from injection is uncertain. While uranium is generally considered to be a bone-volume seeker, uranium entering the skeleton initially deposits on bone surfaces, and autoradiographic evidence does not rule out the possibility of longer surface retention of a dosimetrically important portion of the bone surface deposits.
Data on the distribution of uranium in chronically exposed persons indicate that cumulative activity in the liver, kidneys, and other soft tissues may contribute significantly to the effective dose from intake of long-lived uranium isotopes. However, the cumulative activity in all soft tissues and the distribution of that activity with respect to the soft tissues with relatively high risk weighting factors are not well known. The concentration of uranium in massive soft tissues such as muscle, fat, and skin often is sufficiently low that accurate measurement of the uranium concentration and/or avoidance of relatively significant levels of contamination is difficult. Nevertheless, these tissues represent a large portion of the body's mass and, conceivably, a substantial portion of total-body uranium under some conditions.
Dose coefficients for 238U are relatively insensitive to uncertainties in the fate of decay chain members produced in vivo. Because the fifth member of this chain is long-lived (234U), only the chain members 238U, 234Th, 234mPa, and 234Pa need be considered in
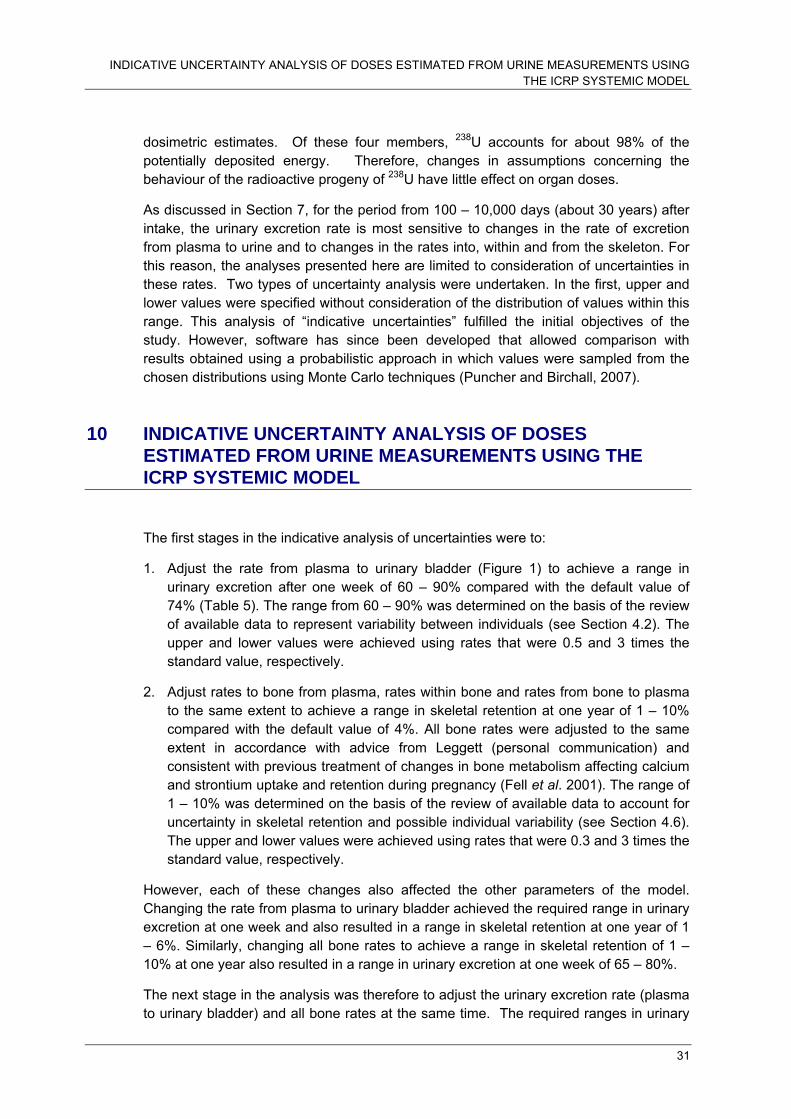
INDICATIVE UNCERTAINTY ANALYSIS OF DOSES ESTIMATED FROM URINE MEASUREMENTS USING THE ICRP SYSTEMIC MODEL
31
dosimetric estimates. Of these four members, 238U accounts for about 98% of the potentially deposited energy. Therefore, changes in assumptions concerning the behaviour of the radioactive progeny of 238U have little effect on organ doses.
As discussed in Section 7, for the period from 100 – 10,000 days (about 30 years) after intake, the urinary excretion rate is most sensitive to changes in the rate of excretion from plasma to urine and to changes in the rates into, within and from the skeleton. For this reason, the analyses presented here are limited to consideration of uncertainties in these rates. Two types of uncertainty analysis were undertaken. In the first, upper and lower values were specified without consideration of the distribution of values within this range. This analysis of “indicative uncertainties” fulfilled the initial objectives of the study. However, software has since been developed that allowed comparison with results obtained using a probabilistic approach in which values were sampled from the chosen distributions using Monte Carlo techniques (Puncher and Birchall, 2007).
10 INDICATIVE UNCERTAINTY ANALYSIS OF DOSES ESTIMATED FROM URINE MEASUREMENTS USING THE ICRP SYSTEMIC MODEL
The first stages in the indicative analysis of uncertainties were to:
1. Adjust the rate from plasma to urinary bladder (Figure 1) to achieve a range in urinary excretion after one week of 60 – 90% compared with the default value of 74% (Table 5). The range from 60 – 90% was determined on the basis of the review of available data to represent variability between individuals (see Section 4.2). The upper and lower values were achieved using rates that were 0.5 and 3 times the standard value, respectively.
2. Adjust rates to bone from plasma, rates within bone and rates from bone to plasma to the same extent to achieve a range in skeletal retention at one year of 1 – 10% compared with the default value of 4%. All bone rates were adjusted to the same extent in accordance with advice from Leggett (personal communication) and consistent with previous treatment of changes in bone metabolism affecting calcium and strontium uptake and retention during pregnancy (Fell et al. 2001). The range of 1 – 10% was determined on the basis of the review of available data to account for uncertainty in skeletal retention and possible individual variability (see Section 4.6). The upper and lower values were achieved using rates that were 0.3 and 3 times the standard value, respectively.
However, each of these changes also affected the other parameters of the model. Changing the rate from plasma to urinary bladder achieved the required range in urinary excretion at one week and also resulted in a range in skeletal retention at one year of 1 – 6%. Similarly, changing all bone rates to achieve a range in skeletal retention of 1 – 10% at one year also resulted in a range in urinary excretion at one week of 65 – 80%.
The next stage in the analysis was therefore to adjust the urinary excretion rate (plasma to urinary bladder) and all bone rates at the same time. The required ranges in urinary

UNCERTAINTY ANALYSIS OF THE ICRP SYSTEMIC MODEL FOR URANIUM AS APPLIED TO INTERPRETATION OF BIOASSAY DATA FOR DEPLETED URANIUM
32
excretion were achieved by ranges in rates from 0.5 times the urinary excretion rate combined with 2 times the bone rates to 2 times the urinary excretion rate combined with 0.5 times the bone rates (0.5U + 2B to 2U + 0.5B). Table 8 shows the resulting ranges in skeletal retention and urinary excretion as a function of time after entry of uranium into blood. Ranges in skeletal retention and daily urinary excretion are also presented graphically in Figures 19 and 20.
1.0E-03
1.0E-02
1.0E-01
1.0E+00
1 10 100 1000 10000Time after intake (d)
Bq
per B
q in
take
ICRP2U + 0.5B0.5U + 2B
Figure 19. Ranges in ICRP (1995a) model predictions of the skeletal retention of uranium as a function of time after entry into blood, expressed as Bq retained per Bq entering blood. Ranges were obtained by changing rates from plasma to urinary bladder (U) and all rates into, within and out of bone (B) from 0.5U + 2B to 2U + 0.5B.
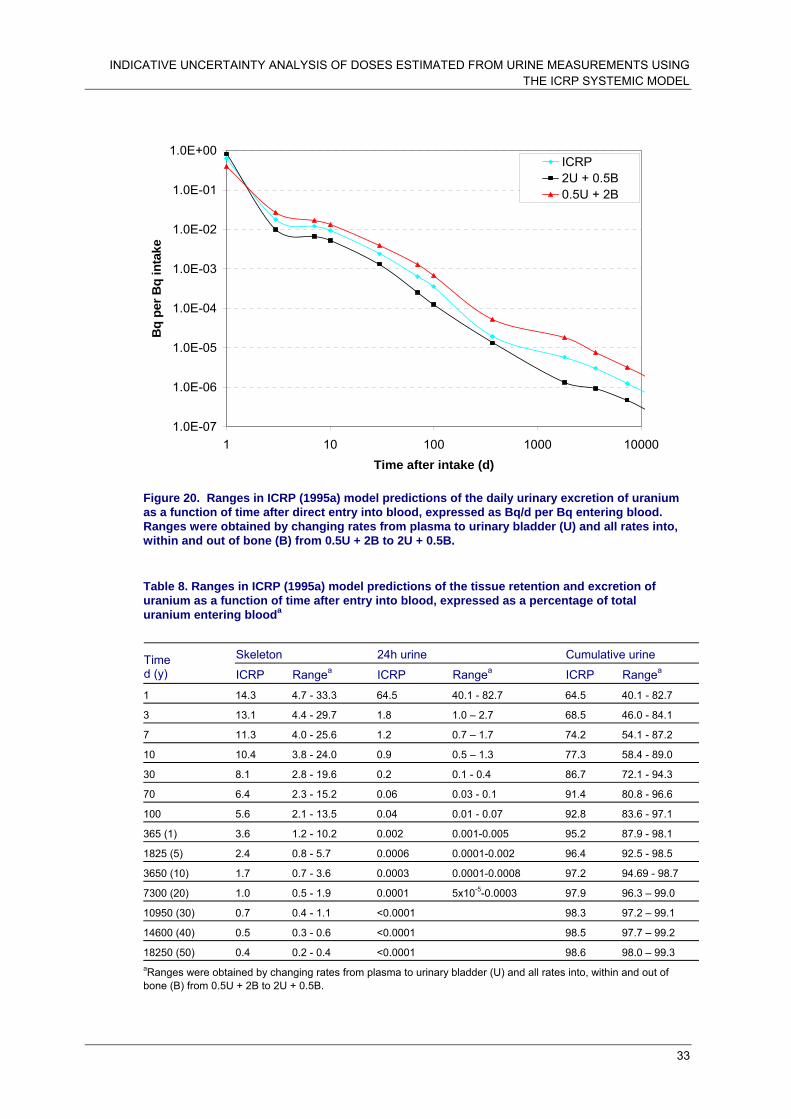
INDICATIVE UNCERTAINTY ANALYSIS OF DOSES ESTIMATED FROM URINE MEASUREMENTS USING THE ICRP SYSTEMIC MODEL
33
1.0E-07
1.0E-06
1.0E-05
1.0E-04
1.0E-03
1.0E-02
1.0E-01
1.0E+00
1 10 100 1000 10000Time after intake (d)
Bq
per B
q in
take
ICRP2U + 0.5B0.5U + 2B
Figure 20. Ranges in ICRP (1995a) model predictions of the daily urinary excretion of uranium as a function of time after direct entry into blood, expressed as Bq/d per Bq entering blood. Ranges were obtained by changing rates from plasma to urinary bladder (U) and all rates into, within and out of bone (B) from 0.5U + 2B to 2U + 0.5B.
Table 8. Ranges in ICRP (1995a) model predictions of the tissue retention and excretion of uranium as a function of time after entry into blood, expressed as a percentage of total uranium entering blooda
Skeleton 24h urine Cumulative urine Time
d (y) ICRP Rangea ICRP Rangea ICRP Rangea
1 14.3 4.7 - 33.3 64.5 40.1 - 82.7 64.5 40.1 - 82.7
3 13.1 4.4 - 29.7 1.8 1.0 – 2.7 68.5 46.0 - 84.1
7 11.3 4.0 - 25.6 1.2 0.7 – 1.7 74.2 54.1 - 87.2
10 10.4 3.8 - 24.0 0.9 0.5 – 1.3 77.3 58.4 - 89.0
30 8.1 2.8 - 19.6 0.2 0.1 - 0.4 86.7 72.1 - 94.3
70 6.4 2.3 - 15.2 0.06 0.03 - 0.1 91.4 80.8 - 96.6
100 5.6 2.1 - 13.5 0.04 0.01 - 0.07 92.8 83.6 - 97.1
365 (1) 3.6 1.2 - 10.2 0.002 0.001-0.005 95.2 87.9 - 98.1
1825 (5) 2.4 0.8 - 5.7 0.0006 0.0001-0.002 96.4 92.5 - 98.5
3650 (10) 1.7 0.7 - 3.6 0.0003 0.0001-0.0008 97.2 94.69 - 98.7
7300 (20) 1.0 0.5 - 1.9 0.0001 5x10⁻⁵-0.0003 97.9 96.3 – 99.0
10950 (30) 0.7 0.4 - 1.1 <0.0001 98.3 97.2 – 99.1
14600 (40) 0.5 0.3 - 0.6 <0.0001 98.5 97.7 – 99.2
18250 (50) 0.4 0.2 - 0.4 <0.0001 98.6 98.0 – 99.3 aRanges were obtained by changing rates from plasma to urinary bladder (U) and all rates into, within and out of bone (B) from 0.5U + 2B to 2U + 0.5B.

UNCERTAINTY ANALYSIS OF THE ICRP SYSTEMIC MODEL FOR URANIUM AS APPLIED TO INTERPRETATION OF BIOASSAY DATA FOR DEPLETED URANIUM
34
The next stage in this analysis was to determine the effect of the changes in retention and excretion parameter values on doses from DU estimated on the basis of uranium in urine measurements at different times after intake. Table 9 considers doses estimated on the basis of a measurement of 1 ng of DU in urine at selected times from 1 day to 20 years after intake of uranium to blood (ie. within the 1 – 10,000 day period presented graphically). The example of measured urinary excretion of 1 ng d-1 DU was used in calculations, since reported excretion rates are typically in the range 1 – 30 ng l-1 (Ting et al. 1999) and it is possible to measure DU at 0.3 ng d-1 against a background of 10 ng d-1 natural uranium (Parrish et al. 2006). However, this is an arbitrary choice and results may be scaled linearly over a wide range of measured excretion values (Bailey and Puncher, 2007; Hodgson et al. 2007). The results are presented as the ratio of the upper and lower values calculated using the altered rates for urinary excretion and bone uptake and retention relative to the default ICRP model assumptions. They show the sensitivity of the estimated committed effective dose to the model uncertainties considered. The corresponding ratios for urinary excretion and skeletal retention are also given. They show that ranges in urinary excretion and skeletal retention are generally greater than ranges in predicted dose.
Figure 21 shows the committed effective dose assessed from 1 ng DU measured in a 24 hour urine sample obtained at times from 1 day to about 30 years after intake to blood, comparing values obtained using default ICRP model assumptions and values obtained using altered rates of urinary excretion and bone metabolism. The default model assumptions give increasing estimates of dose for a measurement of 1 ng, with values of about 3 nSv at 10 days to about 40 μSv at about 30 years (10,000 days). The overall range in dose estimates obtained using changes in urinary excretion and bone metabolism rates is seen to be less than a factor of ten for all measurement times and more typically <2.
It should be emphasized that this indicative analysis of uncertainties in dose estimates, based on DU measurements in 24h urine samples, assesses only the systemic model and considers only the principal biokinetic factors of importance. No account is taken of uncertainties in dosimetric assumptions; the possibility that modelling assumptions may underestimate retention of uranium on bone surfaces is discussed in Section 9. In practice, of course, DU will not enter blood directly and consideration of uncertainties in the systemic model must be coupled to uncertainties associated with its entry from the respiratory and alimentary tracts (or wounds) and uncertainties in doses to these body systems. The next section considers the effect of uncertainties in the systemic model applied to the inhalation of DU.
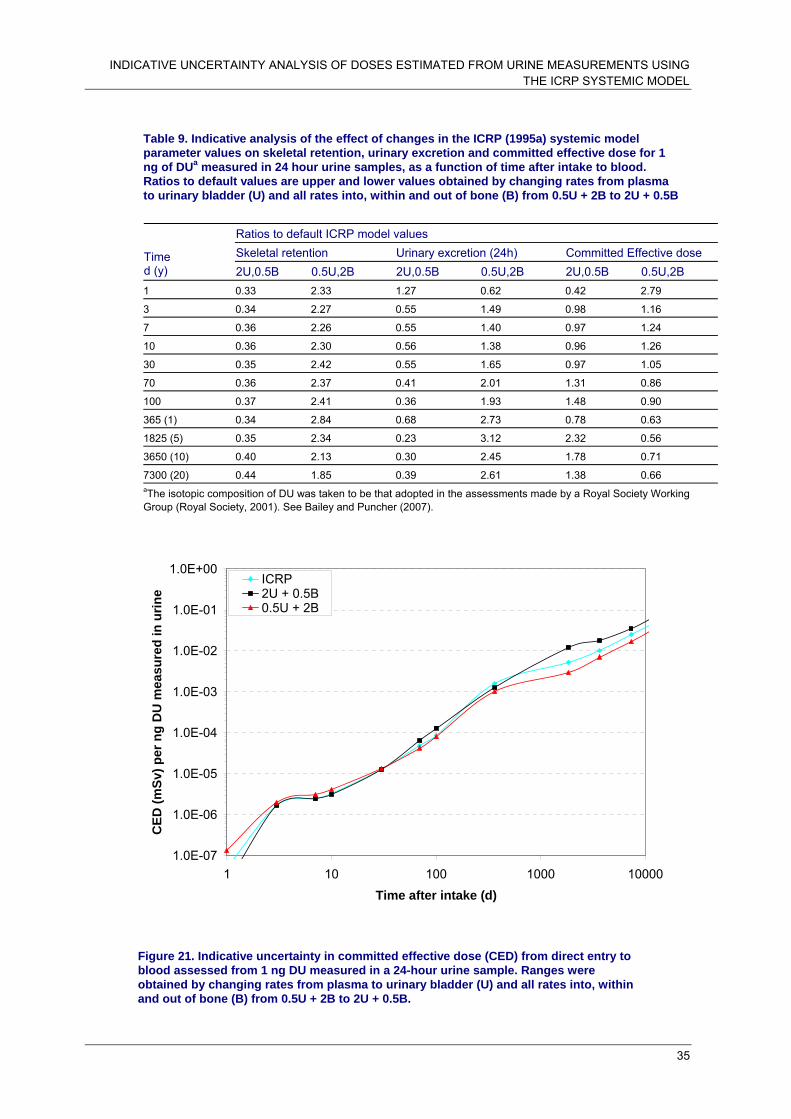
INDICATIVE UNCERTAINTY ANALYSIS OF DOSES ESTIMATED FROM URINE MEASUREMENTS USING THE ICRP SYSTEMIC MODEL
35
Table 9. Indicative analysis of the effect of changes in the ICRP (1995a) systemic model parameter values on skeletal retention, urinary excretion and committed effective dose for 1 ng of DUa measured in 24 hour urine samples, as a function of time after intake to blood. Ratios to default values are upper and lower values obtained by changing rates from plasma to urinary bladder (U) and all rates into, within and out of bone (B) from 0.5U + 2B to 2U + 0.5B
Ratios to default ICRP model values Skeletal retention Urinary excretion (24h) Committed Effective dose Time
d (y) 2U,0.5B 0.5U,2B 2U,0.5B 0.5U,2B 2U,0.5B 0.5U,2B 1 0.33 2.33 1.27 0.62 0.42 2.79
3 0.34 2.27 0.55 1.49 0.98 1.16
7 0.36 2.26 0.55 1.40 0.97 1.24
10 0.36 2.30 0.56 1.38 0.96 1.26
30 0.35 2.42 0.55 1.65 0.97 1.05
70 0.36 2.37 0.41 2.01 1.31 0.86
100 0.37 2.41 0.36 1.93 1.48 0.90
365 (1) 0.34 2.84 0.68 2.73 0.78 0.63
1825 (5) 0.35 2.34 0.23 3.12 2.32 0.56
3650 (10) 0.40 2.13 0.30 2.45 1.78 0.71
7300 (20) 0.44 1.85 0.39 2.61 1.38 0.66 aThe isotopic composition of DU was taken to be that adopted in the assessments made by a Royal Society Working Group (Royal Society, 2001). See Bailey and Puncher (2007).
1.0E-07
1.0E-06
1.0E-05
1.0E-04
1.0E-03
1.0E-02
1.0E-01
1.0E+00
1 10 100 1000 10000Time after intake (d)
CED
(mSv
) per
ng
DU
mea
sure
d in
urin
e
ICRP2U + 0.5B0.5U + 2B
Figure 21. Indicative uncertainty in committed effective dose (CED) from direct entry to blood assessed from 1 ng DU measured in a 24-hour urine sample. Ranges were obtained by changing rates from plasma to urinary bladder (U) and all rates into, within and out of bone (B) from 0.5U + 2B to 2U + 0.5B.

UNCERTAINTY ANALYSIS OF THE ICRP SYSTEMIC MODEL FOR URANIUM AS APPLIED TO INTERPRETATION OF BIOASSAY DATA FOR DEPLETED URANIUM
36
11 INDICATIVE UNCERTAINTY ANALYSIS OF DOSES ESTIMATED FROM URINE MEASUREMENTS USING THE ICRP SYSTEMIC MODEL AND RESPIRATORY TRACT MODEL
Bailey and Puncher (2007) have considered inhalation parameter values for retrospective assessments of exposures to DU from penetrator impacts or fires, giving central values and ranges for all important parameters. To complete the analysis of effects of uncertainties in the systemic model on the interpretation of measurements of DU in urine samples, first the central values of Bailey and Puncher (2007) were used to provide input of uranium to blood after inhalation of DU for comparison with the above considerations of direct entry of uranium into blood. Figures 22 and 23 compare the resulting ranges in skeletal retention and urinary excretion as a function of time after intake, expressed as a fraction of the intake by inhalation or direct injection to blood (labelled systemic). The results reflect the slow entry of uranium from the respiratory tract into the systemic circulation and show similar uncertainty ranges for skeletal retention but reduced ranges for urinary excretion except at late times.
1.0E-04
1.0E-03
1.0E-02
1.0E-01
1.0E+00
1 10 100 1000 10000Time after intake (d)
Bq
per B
q in
take
ICRP systemic2U + 0.5B systemic0.5U + 2B systemicICRP inhalation2U + 0.5B inhalation0.5U + 2B inhalation
Figure 22. Ranges in model predictions of the skeletal retention of uranium as a function of time after intake, comparing inhalation of DU and direct entry to blood (systemic). Ranges were obtained by changing rates from plasma to urinary bladder (U) and all rates into, within and out of bone (B) from 0.5U + 2B to 2U + 0.5B.
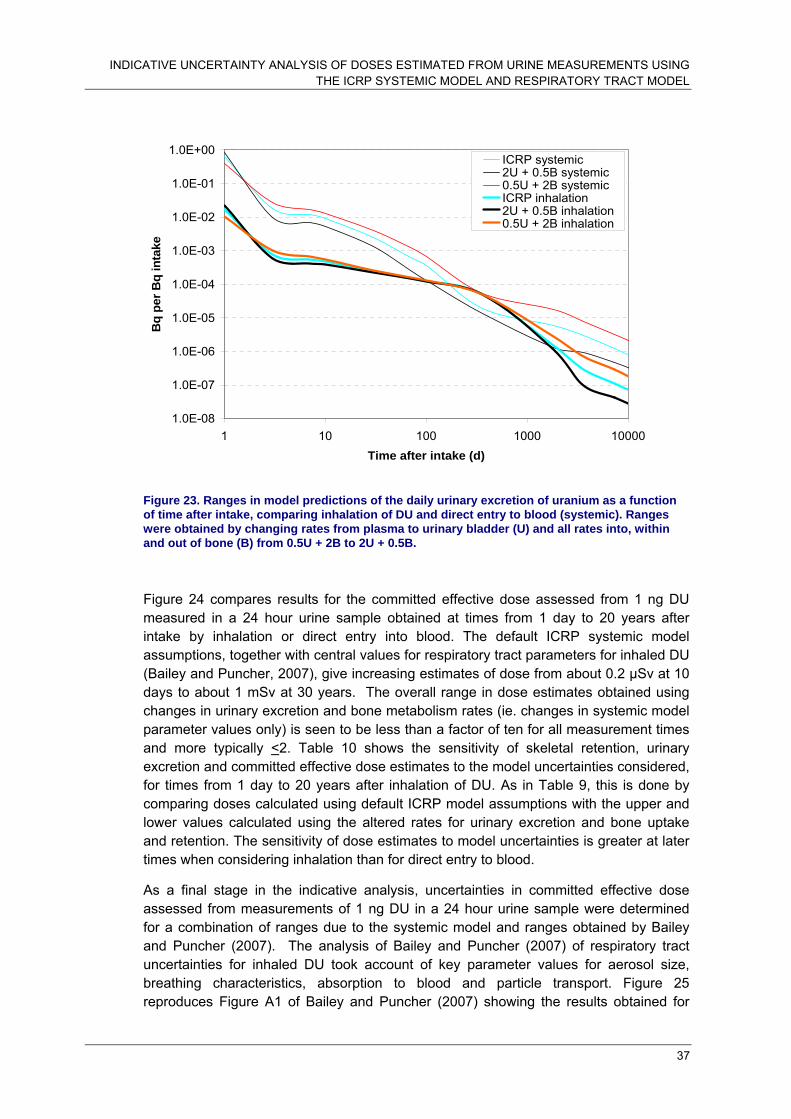
INDICATIVE UNCERTAINTY ANALYSIS OF DOSES ESTIMATED FROM URINE MEASUREMENTS USING THE ICRP SYSTEMIC MODEL AND RESPIRATORY TRACT MODEL
37
1.0E-08
1.0E-07
1.0E-06
1.0E-05
1.0E-04
1.0E-03
1.0E-02
1.0E-01
1.0E+00
1 10 100 1000 10000Time after intake (d)
Bq
per B
q in
take
ICRP systemic2U + 0.5B systemic0.5U + 2B systemicICRP inhalation2U + 0.5B inhalation0.5U + 2B inhalation
Figure 23. Ranges in model predictions of the daily urinary excretion of uranium as a function of time after intake, comparing inhalation of DU and direct entry to blood (systemic). Ranges were obtained by changing rates from plasma to urinary bladder (U) and all rates into, within and out of bone (B) from 0.5U + 2B to 2U + 0.5B.
Figure 24 compares results for the committed effective dose assessed from 1 ng DU measured in a 24 hour urine sample obtained at times from 1 day to 20 years after intake by inhalation or direct entry into blood. The default ICRP systemic model assumptions, together with central values for respiratory tract parameters for inhaled DU (Bailey and Puncher, 2007), give increasing estimates of dose from about 0.2 μSv at 10 days to about 1 mSv at 30 years. The overall range in dose estimates obtained using changes in urinary excretion and bone metabolism rates (ie. changes in systemic model parameter values only) is seen to be less than a factor of ten for all measurement times and more typically <2. Table 10 shows the sensitivity of skeletal retention, urinary excretion and committed effective dose estimates to the model uncertainties considered, for times from 1 day to 20 years after inhalation of DU. As in Table 9, this is done by comparing doses calculated using default ICRP model assumptions with the upper and lower values calculated using the altered rates for urinary excretion and bone uptake and retention. The sensitivity of dose estimates to model uncertainties is greater at later times when considering inhalation than for direct entry to blood.
As a final stage in the indicative analysis, uncertainties in committed effective dose assessed from measurements of 1 ng DU in a 24 hour urine sample were determined for a combination of ranges due to the systemic model and ranges obtained by Bailey and Puncher (2007). The analysis of Bailey and Puncher (2007) of respiratory tract uncertainties for inhaled DU took account of key parameter values for aerosol size, breathing characteristics, absorption to blood and particle transport. Figure 25 reproduces Figure A1 of Bailey and Puncher (2007) showing the results obtained for

UNCERTAINTY ANALYSIS OF THE ICRP SYSTEMIC MODEL FOR URANIUM AS APPLIED TO INTERPRETATION OF BIOASSAY DATA FOR DEPLETED URANIUM
38
uncertainties in committed effective dose assessed from 1 ng DU in urine, and uncertainty ranges are also given in Table 11. These ranges were combined with ranges resulting from uncertainties in the systemic model by multiplying the values in columns 2 and 3 of Table 11 by factors representing the ranges of uncertainty that could be introduced by considerations of the systemic model. These factors were based on the ratios given in the last two columns of Table 10, and were taken to be, in rounded terms, 1.2 at times of 500 days or less, 1.3 at 1000 days, 1.8 at 2000 days, and 3 at the last two time points. The results are shown in Figure 26 and columns 5 – 7 of Table 11.
Central values of committed effective dose corresponding to 1 ng DU in a 24 hour urine sample following inhalation of DU increase from about 0.2 μSv at 10 days to about 1 mSv at about 30 years (10,000 days) (Figures 25 and 26). Combining the indicative uncertainty ranges showed that up to 2 – 3 years after intake the overall uncertainties are dominated by respiratory tract model uncertainties but systemic model uncertainties make similar contributions at later times (Table 11; Figures 25 and 26). Thus, at 100 days (about 3 months) after intake, the minimum value is about a factor of 5 below the central value and the maximum is about a factor of 100 above the central value, with or without the inclusion of systemic model uncertainties. At times greater than 10 years after intake, however, the overall uncertainty range is about an order of magnitude greater with inclusion of systemic model uncertainties (approaching 200 compared with about 20). This contribution of systemic model uncertainties at later times is attributable to uncertainties in the retention of uranium in the skeleton. Despite the large overall uncertainty ranges, the maximum assessed doses from 1 ng DU d-1 are below 1 mSv up to about 10 years after intake but could exceed 10 mSv for measurements at 30 years after intake.
1.0E-08
1.0E-07
1.0E-06
1.0E-05
1.0E-04
1.0E-03
1.0E-02
1.0E-01
1.0E+00
1.0E+01
1 10 100 1000 10000
Time after intake (d)
CED
(mSv
) per
ng
DU
mea
sure
d in
urin
e
ICRP systemic
2U + 0.5B systemic
0.5U + 2B systemic
ICRP inhalation
2U + 0.5B inhalation
0.5U + 2B inhalation
Figure 24. Indicative uncertainty in committed effective dose (CED) assessed from 1 ng DU measured in a 24-hour urine sample, comparing inhalation of DU and direct entry to blood (systemic). Ranges were obtained by changing rates from plasma to urinary bladder (U) and all rates into, within and out of bone (B) from 0.5U + 2B to 2U + 0.5B.

INDICATIVE UNCERTAINTY ANALYSIS OF DOSES ESTIMATED FROM URINE MEASUREMENTS USING THE ICRP SYSTEMIC MODEL AND RESPIRATORY TRACT MODEL
39
Table 10. Effect of changes in model parameter values on skeletal retention, urinary excretion and committed effective dose for 1 ng of DU measured in 24 hour urine samples, as a function of time after inhalation of DU. Ratios to default values are upper and lower values obtained by changing rates from plasma to urinary bladder (U) and all rates into, within and out of bone (B) from 0.5U + 2B to 2U + 0.5B
Ratios to standard model values
Skeletal retention Urinary excretion (24h) Committed Effective dose Time
d (y) 2U,0.5B 0.5U,2B 2U,0.5B 0.5U,2B 2U,0.5B 0.5U,2B
1 0.33 2.33 1.29 0.61 0.77 1.67
3 0.34 2.28 0.76 1.23 1.31 0.83
7 0.35 2.26 0.76 1.17 1.29 0.87
10 0.36 2.30 0.80 1.13 1.24 0.91
30 0.35 2.40 0.92 1.08 1.07 0.94
70 0.35 2.37 0.96 1.05 1.03 0.97
100 0.36 2.39 0.97 1.02 1.02 1.00
365 (1) 0.35 2.71 1.01 0.97 0.98 1.05
1825 (5) 0.34 2.40 0.74 1.79 1.34 0.57
3650 (10) 0.39 2.15 0.32 2.44 3.07 0.42
7300 (20) 0.44 1.87 0.38 2.60 2.57 0.39
Table 11. Effect of indicative uncertainties in respiratory tract and systemic model parameter values on committed effective dose for 1 ng of DU measured in 24 hour urine samples, as a function of time after inhalation of DU. Ratios to central values are for minimum and maximum values obtained by Bailey and Puncher (2007) considering uncertainties in respiratory tract parameter values and uncertainties in systemic model parameter values as in Table 10.
Committed effective dose: ratios to central values
Respiratory tract uncertainties Respiratory tract and systemic model
uncertainties Time d Minimum Maximum Range Minimum Maximum Range
10 0.07 69.0 960 0.06 82.8 1383 20 0.11 66.6 589 0.09 79.9 848 50 0.17 84.4 509 0.14 101.3 733 100 0.20 85.2 428 0.17 102.3 616 200 0.29 80.1 273 0.24 96.1 393 500 0.70 47.6 68 0.58 57.1 99 1000 0.78 15.6 20 0.60 20.3 34 2000 0.31 3.5 11 0.17 6.3 36 5000 0.14 2.4 17 0.05 7.3 152 10000 0.14 2.5 18 0.05 7.5 162

UNCERTAINTY ANALYSIS OF THE ICRP SYSTEMIC MODEL FOR URANIUM AS APPLIED TO INTERPRETATION OF BIOASSAY DATA FOR DEPLETED URANIUM
40
Figure 25. Indicative uncertainty in committed effective dose (CED) following inhalation of DU, assessed from 1 ng DU measured in a 24-hour urine sample, considering uncertainties in key respiratory tract parameter values. Figure A1 from Bailey and Puncher (2007).
Figure 26. Indicative uncertainty in committed effective dose (CED) following inhalation of DU, assessed from 1 ng DU measured in a 24-hour urine sample, considering uncertainties both in key respiratory tract parameter values and in systemic model parameter values.
1.0E-05
1.0E-04
1.0E-03
1.0E-02
1.0E-01
1.0E+00
1.0E+01
10 100 1000 10000
Time after intake (d)
CED
(mSv
) per
ng
mea
sure
d in
urin
e
MinimumMaximumCentralType MType S
1.0E-05
1.0E-04
1.0E-03
1.0E-02
1.0E-01
1.0E+00
1.0E+01
10 100 1000 10000
Tim e afte r intak e (d)
CED
(mSv
) per
ng
mea
sure
d in
urin
e
Minimum
Maximum
Central
Type M
Type S

PROBABILISTIC UNCERTAINTY ANALYSIS OF DOSES ESTIMATED FROM URINE MEASUREMENTS USING THE ICRP SYSTEMIC MODEL AND RESPIRATORY TRACT MODEL
41
12 PROBABILISTIC UNCERTAINTY ANALYSIS OF DOSES ESTIMATED FROM URINE MEASUREMENTS USING THE ICRP SYSTEMIC MODEL AND RESPIRATORY TRACT MODEL
Probabilistic uncertainty analyses were performed by Monte Carlo simulation, applying Latin Hypercube sampling techniques (Puncher and Birchall, 2007; Bailey and Puncher, 2007). As for the indicative analysis discussed above, consideration of uncertainties in the ICRP (1995a) systemic model was confined to the transfer of uranium from blood plasma to urinary bladder and rates into, within and from the skeleton. Initial constraints were set as urinary excretion of between 60 – 90% at one week after entry of uranium into blood and skeletal retention of 1 – 10% after one year. Following consultation with Leggett (personal communication), a more complex treatment of variations in bone rates was adopted than for the indicative uncertainty analysis. Thus, one factor was applied to variation in rates from bone surfaces and a separate and independent factor for rates to and from bone volume.
Following iterative analysis of the effect of variations in rates, the following ranges were used: plasma to urinary bladder was varied by a factor of 3 above and below the central value; all rates from bone surfaces were varied by a factor of 9 above and below the central value; and all rates to and from bone volume were varied by a factor of 2 above and below the central value. Assuming log normal distributions in each case resulted in urinary excretion at one week of 53 – 89% (95% confidence limits) and skeletal retention at one year of 1 – 10% (99% confidence limits). The rate from plasma to bone surfaces was fixed at the ICRP value, as varying this parameter value as well as the other rates resulted in a substantial violation of constraints.
Table 12. Probabilistic analysis of the effect of uncertainties in systemic model parameter values on committed effective dose for 1 ng of DU measured in 24 hour urine samples, as a function of time after intake to blood. Ratios to central values are for 2.5% and 97.5% values obtained by sampling from distributions on model parameter values for urinary excretion and retention in the skeleton (see text).
Committed effective dose Time, d 2.5% 97.5% Range
10 0.81 1.99 2.5 20 0.81 1.81 2.2 50 0.77 1.57 2.0 100 0.77 1.42 1.9 200 0.56 1.74 3.1 500 0.40 1.04 2.6 1000 0.67 1.68 2.5 2000 0.86 1.66 1.9 5000 0.94 1.42 1.5 10000 0.93 1.43 1.5

UNCERTAINTY ANALYSIS OF THE ICRP SYSTEMIC MODEL FOR URANIUM AS APPLIED TO INTERPRETATION OF BIOASSAY DATA FOR DEPLETED URANIUM
42
Table 12 and Figure 27 show the results of the probabilistic uncertainty analysis, considering committed effective dose following direct entry of DU to blood, assessed from a measurement of 1 ng of DU in urine. Two Monte Carlo runs were performed (5000 iterations each) to monitor convergence and showed agreement within 2%. Comparable results for the indicative uncertainty analysis are shown in Table 9 and Figure 21. Comparison shows that the overall range in dose estimates is generally around a factor of 2 – 3 or less in each case, with a tendency for the range from the probabilistic analysis to change less with time.
Figure 27. Probabilistic uncertainty in committed effective dose (CED) from direct entry into blood, assessed from 1 ng of DU measured in 24 hour urine samples. Ratios to central values are for 2.5% and 97.5% values obtained by sampling from distributions on model parameter values for urinary excretion and retention in the skeleton (see text).
Figures 28 and 29 and Table 13 present results of probabilistic uncertainty analyses, considering committed effective dose following inhalation of DU, assessed from a measurement of 1 ng of DU in urine. Figure 28 reproduces Figure 7 of Bailey and Puncher (2007), showing the results obtained considering uncertainties in the respiratory tract model only. Figure 29 shows the overall results of combined analysis of uncertainties in the respiratory tract and systemic models. Table 13 compares uncertainty ranges, considering respiratory tract model uncertainties (as in Figure 28) and combined uncertainties (as in Figure 29). As illustrated in Figures 28 and 29 and demonstrated by the comparison in Table 13, uncertainties in dose estimates are dominated by respiratory tract model uncertainties at all times. For measurements at early times up to about 6 months (200 days) after intake, the 2.5% – 97.5% range in dose estimates is a factor of about 50 – 70, independent of the inclusion of systemic model uncertainties. While the ranges shown in Table 13 are smaller for the combined analysis than for the analysis of respiratory tract model uncertainties alone, the
0.000001
0.00001
0.0001
0.001
0.01
0.1
10 100 1000 10000
Time after intake (d)
CED
(mSv
) per
ng
mea
sure
d in
urin
e
97.50%2.50%Median

PROBABILISTIC UNCERTAINTY ANALYSIS OF DOSES ESTIMATED FROM URINE MEASUREMENTS USING THE ICRP SYSTEMIC MODEL AND RESPIRATORY TRACT MODEL
43
Figure 28. Probabilistic uncertainty in committed effective dose (CED) following inhalation of DU, assessed from 1 ng of DU measured in 24 hour urine samples, considering uncertainties in key respiratory tract model parameter values. Figure 7 from Bailey and Puncher (2007).
Figure 29. Probabilistic uncertainty in committed effective dose (CED) following inhalation of DU, assessed from 1 ng of DU measured in 24 hour urine samples, considering uncertainties both in key respiratory tract model parameter values and in systemic model parameter values.
differences are not considered to be significant. The differences are consistent with observed variations between runs of the same Monte Carlo and there is no discernible
0.00001
0.0001
0.001
0.01
0.1
1
10
10 100 1000 10000
Time after intake (d)
CED
(mSv
) per
ng
mea
sure
d in
urin
e
97.50%2.50%Median
0.00001
0.0001
0.001
0.01
0.1
1
10
10 100 1000 10000
Time after intake (d)
CED
(mSv
) per
ng
mea
sure
d in
urin
e
97.50%2.50%Median

UNCERTAINTY ANALYSIS OF THE ICRP SYSTEMIC MODEL FOR URANIUM AS APPLIED TO INTERPRETATION OF BIOASSAY DATA FOR DEPLETED URANIUM
44
pattern in the 2.5% and 97.5% values in each case. For measurements at later times, from 3 years to approaching 30 years after intake, the range in uncertainties in dose estimates is reduced to < 10, considering uncertainties in respiratory tract model parameter values only. Systemic model uncertainties make their greatest contribution to overall uncertainties in dose estimates at the latest time-point considered, approaching 30 years after intake (10,000 days), but only increase the 2.5% - 97.5% range from 10 to 15.
Comparison of results obtained by probabilistic uncertainty analysis (Table 13) and indicative uncertainty analysis (Table 11) clearly shows the much larger ranges obtained in the indicative analysis. This is due partly to the necessarily simple and pessimistic way in which uncertainty ranges for the respiratory tract and systemic models were combined in the indicative analysis. The probabilistic analysis can be assumed to be more reliable. In both cases, consideration was limited to those parameter values in the models identified as having the greatest effect on urinary excretion. For the systemic model, consideration of other parameter values may be of importance in determining overall uncertainties in dose estimates. In addition, the assumption of a log normal distribution of values for each parameter is of unproven validity in the case of the systemic model, although this probably represents the most appropriate choice in the absence of information to the contrary.
Table 13. Probabilistic analysis of the effect of uncertainties in respiratory tract and systemic model parameter values on committed effective dose for 1 ng of DU measured in 24 hour urine samples, as a function of time after inhalation of DU, considering uncertainties in respiratory tract parameter values and uncertainties in systemic model parameter values.
Committed effective dose: ratios to central values
Respiratory tract uncertainties Respiratory tract and systemic model
uncertainties Time d 2.5% 97.5% Range 2.5% 97.5% Range
10 0.16 8.0 49.4 0.18 9.2 52.5 20 0.17 9.3 53.2 0.18 10.4 56.1 50 0.20 13.4 67.5 0.20 13.9 68.0 100 0.26 16.7 64.9 0.26 17.3 65.6 200 0.41 19.9 48.5 0.41 19.6 47.6 500 0.77 15.1 19.6 0.76 14.4 18.9 1000 0.76 7.8 10.2 0.75 8.4 11.1 2000 0.36 2.4 6.8 0.36 3.0 8.3 5000 0.29 2.0 6.7 0.27 2.6 9.7 10000 0.30 2.8 9.5 0.26 3.8 14.5

DISCUSSION
45
13 DISCUSSION
This report presents an analysis of the ICRP (1995a) model for the systemic biokinetics of uranium absorbed to blood. It identifies key model parameters that influence urinary excretion and considers variability and uncertainty in values for these parameters. The ranges obtained are used to determine corresponding ranges in committed effective dose assessed from measurements of DU in urine samples at times between 3 months and 30 years after intake to blood. Inhalation of DU is then considered, taking account of uncertainties in key respiratory tract model parameter values, obtained in a parallel study (Bailey and Puncher, 2007). Two types of uncertainty analysis were undertaken. In the first, upper and lower values were specified without consideration of the distribution of values within this range. This analysis of “indicative uncertainties” fulfilled the initial objectives of the study. However, software has since been developed that allowed comparison with results obtained using a probabilistic approach in which values were sampled from the chosen distributions using Monte Carlo techniques (Puncher and Birchall, 2007).
Analysis of the ICRP systemic model for uranium (ICRP, 1995a) shows that good use has been made of available human and animal data to develop a sophisticated model with reasonable physiological realism. It is essentially the same model as used for the alkaline earth elements, strontium, radium (ICRP, 1993) and calcium (ICRP, 1995b), reflecting the similarity in behaviour of uranyl (UO2
2+) and Ca2+ ions. The only structural difference in the models is the inclusion of a red blood cell compartment in the uranium model to allow for observed retention of uranium by circulating cells, not seen for the alkaline earth elements. For uranium, as for the alkaline earth elements, the most important site of long-term retention is the skeleton. However, the behaviour of uranium differs quantitatively from that of the alkaline earth elements, with notable differences being the rapidity of urinary excretion of uranium and the proportion of retained uranium accounted for by the kidneys.
A review of human data on the urinary excretion of uranium showed that all relevant data have been used to construct the ICRP systemic model. Additional data were identified on urinary excretion after oral administration, inhalation and absorption through skin but these did not provide information that could be used to improve quantitative estimates for modelling purposes. The ICRP systemic model took account of human data from studies in which uranium was administered intravenously, showing that typically two-thirds of injected uranium is excreted in urine in the first 24 hours and about a further 10% over the next 5 days. Similar results were obtained for baboons and dogs. The human and animal data indicate that most of the remaining uranium is excreted over a period of a few months, but a few percent of the amount injected may be retained for a period of years. The ICRP model predicts 90% urinary excretion after about 2 months and 95% after 1 year, considering uranium absorbed to blood.
The main site of long-term retention of uranium is the skeleton. ICRP model parameter values for uptake and retention in the skeleton were based on human data from injection studies and post-mortem measurements on environmentally and occupationally exposed individuals, animal data, analogy with the alkaline earth elements and

UNCERTAINTY ANALYSIS OF THE ICRP SYSTEMIC MODEL FOR URANIUM AS APPLIED TO INTERPRETATION OF BIOASSAY DATA FOR DEPLETED URANIUM
46
considerations of bone metabolism. The ICRP model predicts retention of about 4% of uranium reaching blood after 1 year and 1% after 20 years.
The report also includes an analysis of a biokinetic model for uranium developed by Wrenn et al. (1994) at around the same time as Leggett (1994) published the model that was used, with slight simplifications, by ICRP (1995a). Notable differences are lower uptake of uranium in the skeleton and soft tissues other than kidneys in the Wrenn model and a more rapid decline in retained activity at late times (by 10 years). The skeleton is a single compartment in the Wrenn model compared with the six compartments of the ICRP model which treat cortical and trabecular bone separately and considering bone surfaces, exchangeable bone volume and non-exchangeable bone volume in each case. It appears that the Wrenn model may substantially underestimate urinary excretion at later times, resulting from the release of the residual small proportion of retained uranium, mainly from the skeleton.
A sensitivity analysis was undertaken to identify the parameters in the ICRP systemic model that have the greatest effect on urinary excretion over the period from 100 to 10,000 days after entry to blood. This was done before undertaking an uncertainty analysis because of the complexity of the model. The sensitivity analysis showed that the most important transfer is that from blood plasma to the bladder, followed by all transfers into, from and within bone. Uncertainty analysis was therefore confined to changes in these rates, basing changes on reported data for ranges in urinary excretion and skeletal retention.
For the indicative uncertainty analysis, all bone rates were adjusted to the same extent on advice from Leggett (personal communication), and consistent with previous treatment of changes in bone metabolism affecting calcium and strontium retention in the skeleton during pregnancy (Fell et al. 2001). Analysis showed that the required ranges in urinary excretion and skeletal retention of uranium were obtained using ranges in rates from 0.5 times the urinary excretion rate combined with 2 times the bone rates to 2 times the urinary excretion rate combined with 0.5 times the bone rates. The resulting range in cumulative urinary excretion over the first week after entry to blood was 54 – 87%, consistent with the available human data and encompassing variability between individuals. The range in skeletal retention at 1 year was 1 – 10%, reasonably consistent with the available human and animal data and allowing for uncertainties in these data.
The next stage in the indicative analysis was to determine the effect of changes in the retention and excretion parameter values on doses from DU estimated on the basis of urine measurements at different times after intake to blood. Considering the committed effective dose assessed from 1 ng DU measured in a 24 hour urine sample, the overall range in estimated doses after intake to blood was shown to be less than a factor of ten for all measurement times, and more typically < 2. However, while this analysis gives an indication of the contribution of systemic model uncertainties to uncertainties in assessed doses, in reality uranium will not enter blood directly. The final stage was therefore to consider the inhalation of DU, with reference to the parallel study of Bailey and Puncher (2007). The analysis of Bailey and Puncher (2007) of respiratory tract model uncertainties for inhaled DU identified key parameters for aerosol size, breathing characteristics, absorption to blood and particle transport. They proposed central values

DISCUSSION
47
and ranges for each parameter and determined their combined effect on dose assessments. Central values for respiratory tract model parameters for inhaled DU, together with default systemic model assumptions, gave increasing estimates of dose from measurements of 1 ng DU d-1 in urine from about 0.2 μSv at 10 days to about 1 mSv at approaching 30 years (10,000 days). Combining the indicative uncertainty ranges obtained for assessed doses obtained on the basis of respiratory tract model uncertainties with those resulting from systemic model uncertainties showed that up to 2 – 3 years after intake the overall uncertainties are dominated by respiratory tract model uncertainties. For example, at 100 days (about 3 months) after intake, the minimum value was about a factor of 5 below the central value and the maximum was about a factor of 100 above the central value, with or without the inclusion of systemic model uncertainties. However, contributions to uncertainties from respiratory tract and systemic models were similar at later times. Thus, at times greater than 10 years after intake, the overall uncertainty range was about an order of magnitude greater with inclusion of systemic model uncertainties than when considering only respiratory tract model uncertainties (ie. about 200 compared with about 20).
For the probabilistic analysis, consideration of uncertainties was again confined to the transfer of uranium from blood plasma to urinary bladder and rates into, within and from the skeleton. Following consultation with Leggett (personal communication), a more complex treatment of variations in bone rates was adopted than for the indicative uncertainty analysis. Thus, one factor was applied to variation in rates from bone surfaces and a separate and independent factor for rates to and from bone volume. Following iterative analysis of the effect of variations in rates, the following ranges were used: plasma to urinary bladder was varied by a factor of 3 above and below the central value; all rates from bone surfaces were varied by a factor of 9 above and below the central value; and all rates to and from bone volume were varied by a factor of 2 above and below the central value. Assuming log normal distributions in each case resulted in urinary excretion at one week of 53 – 89% (95% confidence limits) and skeletal retention at one year of 1 – 10% (99% confidence limits), consistent with available human data. The rate from plasma to bone surfaces was fixed at the ICRP value, as varying this parameter value violated constraints.
Considering the committed effective dose assessed from 1 ng DU measured in a 24 hour urine sample following direct entry of DU into blood, the overall range in estimated doses (2.5% - 97.5% range) was around a factor of two (1.5 – 3) throughout the time range considered (10 – 10,000 days). Thus, the indicative and probabilistic analyses gave similar results, with a tendency for the range from the probabilistic analysis to change less with time.
Considering committed effective dose following inhalation of DU, assessed from a measurement of 1 ng of DU in urine, and the effect of combined probabilistic analysis of uncertainties in respiratory tract and systemic model parameter values, showed that uncertainties in dose estimates were dominated by respiratory tract model uncertainties at all times. For measurements at early times up to about 6 months (200 days) after intake, the 2.5% - 97.5% range in dose estimates was a factor of about 50 – 70, independent of the inclusion of systemic model uncertainties. For measurements at later times, from 3 years to approaching 30 years after intake, the range in uncertainties in dose estimates was reduced to < 10, considering uncertainties in respiratory tract

UNCERTAINTY ANALYSIS OF THE ICRP SYSTEMIC MODEL FOR URANIUM AS APPLIED TO INTERPRETATION OF BIOASSAY DATA FOR DEPLETED URANIUM
48
model parameter values only. Systemic model uncertainties made the greatest contribution to overall uncertainties in dose estimates at the latest time-point considered, approaching 30 years after intake (10,000 days), but only increase the 2.5% - 97.5% range from 10 to 15. The maximum assessed doses from 1 ng DU d-1 (97.5% values) were below 1 mSv up to about 14 years after intake but could exceed 3 mSv for measurements at times approaching 30 years after intake.
Comparison of results obtained by probabilistic uncertainty analysis and indicative uncertainty analysis clearly shows the much larger ranges obtained in the indicative analysis. While the probabilistic analysis can be assumed to be more reliable, in both cases consideration was limited to those parameter values in the models identified as having the greatest effect on urinary excretion. For the systemic model, consideration of other parameter values may be of importance in determining overall uncertainties in dose estimates. In addition, the assumption of a log-normal distribution of values for each parameter is of unproven validity in the case of the systemic model, although this probably represents the most appropriate choice in the absence of information to the contrary. It should also be recognised that this analysis did not include dosimetric uncertainties and other uncertainties inherent in the calculation of effective doses. As briefly mentioned in section 9 of the report, uncertainties in the skeletal model that have not been addressed here may be important contributors to uncertainties in dose estimates. Thus, uranium may show similarities to other actinide elements, including plutonium, as well as to the alkaline earth element in its deposition and retention in bone. The implication is that doses to bone surfaces and red bone marrow could be greater than currently estimated. Furthermore, there are uncertainties in the specification of these target tissues. Changes are under consideration by ICRP on the location and dimensions of targets in trabecular and cortical bone; these are considered likely to reduce doses from alpha-emitting radionuclides. In addition, there is evidence that the radiation weighting factor (wR) of 20 for alpha particles is inappropriately high when considering equivalent dose to red bone marrow and risks of leukaemia (Harrison and Muirhead, 2003). Similar considerations apply to dosimetric and risk related assumptions applied in the ICRP model of the respiratory tract, including source / target specification and the apportionment of contributions to dose and risk from bronchial, bronchiolar and alveolar regions of the lungs.
Bearing in mind the uncertainties that have not been considered, the analyses presented should be regarded as giving a good indication of the effect of biokinetic uncertainties on uncertainties in dose estimates based on measurements of DU in urine samples.
14 RECOMMENDATIONS FOR RESEARCH
The initial analysis in this study was an indicative uncertainty analysis. It was noted, however, that ideally the analysis should be repeated using probabilistic Monte Carlo techniques, and this was a recommendation during the development of the project. Although not a requirement of the initial project specification, software has since been developed for probabilistic uncertainty analyses and has been applied in this study as

REFERENCES
49
described above. This, the first recommendation for further work has been fulfilled within the project.
In preparation of this work for publication in the open literature, consideration will be given to a more extensive treatment of uncertainties in the systemic model. In particular, uncertainties in long-term retention of uranium in soft tissues, as well as in the skeleton, will be considered.
Both indicative and probabilistic uncertainty analyses of the systemic model resulted in narrow uncertainty ranges on dose estimates. Such small uncertainties do not in themselves strongly argue for further practical research. However, a case could be made for a volunteer study of the long-term retention and urinary excretion of uranium to test the validity of the results obtained in this study. A good experimental design would be to administer uranium simultaneously by inhalation and intravenous injection, using different isotopes. Modern techniques of mass spectrometry would enable measurements of urinary excretion to continue for decades after administration.
15 REFERENCES
Adams N and Spoor NL (1974). Kidney and bone retention functions in the human metabolism of uranium. Phys Med Biol 19, (4) 460-71.
Bailey, MR and Puncher M (2007). Uncertainty analysis of the ICRP Human Respiratory Tract Model for application to interpretation of bioassay data for depleted uranium. Chilton, HPA-RPD-023.
Bassett SH, Frankel A, Cedars N et al (1948). The excretion of hexavalent uranium following intravenous administration: II. Studies on human subjects. Rochester, New York, UR-37.
Bernard SR (1958). Maximum permissible amounts of natural uranium in the body, air and drinking water based on human experimental data. Health Phys 1, (3) 288-305.
Bernard SR, Muir JR and Royster Jr GW (1957). The distribution and excretion of uranium in man. IN Proceedings of the Health Physics Society First Annual Meeting 1956 33-48.
Bernard SR and Struxness EG (1957). A study of the distribution and excretion of uranium in man. An Interim Report. Tennessee, USA, ORNL 2304.
Bhattacharyya MH, Larsen RP, Cohen N et al (1989). Gastrointestinal absorption of plutonium and uranium in fed and fasted adult baboons and mice: application to humans. Radiat Prot Dosim 26, 159-165.
Bruenger FW, Atherton DR, Bates DS et al (1976). The early distribution and excretion of 233U in the Beagle . University of Utah College of Medicine, Salt Lake City, Report No. COO-119-251, pp194-202.
Butterworth A (1955). The significance and value of uranium in urine analysis. Transactions of the Association of Industrial Medical Officers 5, 36-43.
Byrne AR and Benedik L (1991). Uranium content of blood, urine and hair of exposed and non-exposed persons determined by radiochemical neutron activation analysis, with emphasis on quality control. Sci Total Environ 107, 143-157.
Campbell EE, McInroy JF and Schulte HF (1975). Uranium in the tissue of occupationally exposed workers. Conference on Occupational Health Experience with Uranium. Arlington VA 28 Apr. 1975-30 Apr. 1975 US ERDA 93, 324-350.
Cooper JR, Stradling GN, Smith H and Ham SE (1982). The behaviour of uranium-233 oxide and uranyl-233 nitrate in rats. Int J Radiat Biol 41, (4) 421-433.

UNCERTAINTY ANALYSIS OF THE ICRP SYSTEMIC MODEL FOR URANIUM AS APPLIED TO INTERPRETATION OF BIOASSAY DATA FOR DEPLETED URANIUM
50
Donoghue JK, Dyson ED, Hislop JS et al (1972). Human exposure to natural uranium. Br J Ind Med 29, 81-89.
Durbin PW (1984). Metabolic models for uranium. IN Proceedings of a colloquium: Biokinetics and analysis of uranium in man. 8 Aug. 1984-9 Aug. 1984 (Moore RH Ed). Richland, USA, United States Uranium Registry/Hanford Environmental Health Foundation. USUR-05 HEHF-47, Document No:PB86-203080, ppF1-F65.
Ellender M, Haines JW and Harrison JD (1995). The distribution and retention of plutonium, americium and uranium in CBA/H mice. Hum Exp Toxicol 14, 38-48.
Fell, T.P., Harrison, J.D. and Leggett, R.W. (2001) A model for the transfer of alkaline earth elements to the fetus. Radiat Prot Dosim 95, 309-321.
Fisenne IM and Perry PM (1985). Isotopic U concentration in human blood from New York City donors. Health Phys 49, (6) 1272-1275.
Fisenne IM, Perry PM and Harley NH (1988). Uranium in humans. Radiat Prot Dosim 24, (1-4) 127-131.
Fisenne IM and Welford GA (1986). Natural U concentrations in soft tissues and bone of New York City residents. Health Phys 50, (6) 739-46.
Fish BR and Bernard SR (1961). Unpublished data. Sixth Conference on Industrial Hygiene and Air Pollution and summarised in Industrial Hygiene News Reports IV 1
Fisher DR, Kathren RL and Swint MJ (1991). Modified biokinetic model for uranium from analysis of acute exposure to UF6. Health Phys 60, (3) 335-342.
Fisher DR, Swint MJ and Kathren RL (1990). Evaluation of health effects in Sequoyah Fuels Corporation workers from accidental exposure to uranium hexafluoride. Richland, USA, NUREG/CR-5566, PNL-7328.
Gonzales ER and McInroy JF (1991). Abstract WPM-A1: The distribution of uranium in two whole bodies. Health Phys 60 [Suppl 2], S51.
Harrison, J.D. and Muirhead, C.R. (2003) Quantitative comparisons of cancer induction in humans by internally deposited radionuclides and external radiation. Int J Radiat Biol 79, 1-13.
Heatherton RC and Huesing JA (1959). A uranium refinery and metal plant urine program and data. IN Symposium on occupational health experience and practices in the uranium industry 15 Oct. 1958-17 Oct. 1958 Washington, DC, Health and Safety Laboratory, United States Atomic Energy Commission, 69-76.
Hodgson A, Pellow PGD and Stradling GN (2007) Influence of nephrotoxicity on systemic behaviour of uranium. Chilton, HPA-RPD-025.
Hursh JB, Neuman WR, Toribara T et al (1969). Oral ingestion of uranium by man. Health Phys 17, 619-621.
Hursh JB and Spoor NL (1973). Data on Man. In: Uranium, plutonium, transplutonic elements. Handbook of Experimental Pharmacology Volume 36 (Hodge HC, Stannard JN, Hursh JB, Eds). New York. Springer-Verlag, pp 197-239.
ICRP (1959). Report of Committee II on Permissible Dose for Internal Radiation. ICRP Publication 2, Pergammon Press, Oxford.
ICRP (1975). Report of the Task Group on Reference Man. ICRP Publication 23, Pergammon Press, Oxford.
ICRP (1979). Limits for intakes of radionuclides by workers: Part 1. ICRP Publication 30. Annals of the ICRP 2, (3-4), Pergammon Press, Oxford.
ICRP (1993). Age-dependent doses to members of the public from intake of radionuclides: Part 2. Ingestion dose coefficients. ICRP Publication 67. Annals of the ICRP 23, (3-4), Elsevier Science Ltd., Oxford.
ICRP (1994a). Human respiratory tract model for radiological protection, ICRP Publication 66, Annals of the ICRP 24 (1-3), Elsevier Science Ltd., Oxford.

REFERENCES
51
ICRP (1994b). Dose coefficients for intakes of radionuclides by workers, ICRP Publication 68, Annals of the ICRP 24 (4), Elsevier Science Ltd., Oxford.
ICRP (1995a). Age dependent doses to members of the public from intake of radionuclides: Part 3 Ingestion coefficients. ICRP Publication 69. Annals of the ICRP 23, (1), Elsevier Science Ltd., Oxford.
ICRP (1995b). Age-dependent doses to members of the public from intake of radionuclides: Part 4 Inhalation dose coefficients. ICRP Publication 71. Annals of the ICRP 25, (3-4), Elsevier Science Ltd., Oxford.
ICRP (1997). Individual monitoring for internal exposure of workers, replacement of ICRP Publication 54, ICRP Publication 78, Annals of the ICRP 27 (3-4), Elsevier Science Ltd., Oxford.
ICRP (2002). Basic anatomical and physiological data for use in radiological Protection: Reference values. ICRP Publication 89. Annals of the ICRP 32, (3-4), Elsevier Science Ltd., Oxford.
Igarashi Y, Yamakawa A, Seki R and Ikeda N (1985). Determination of U in Japanese human tissues by the fission track method. Health Phys 49, 707-712.
Jones ES (1966). Microscopic and autoradiographic studies of distribution of uranium in the rat kidney. Health Phys 12, (10) 1437-51.
Kathren RL, McInroy JF, Moore RH and Dietert SE (1989). Uranium in the tissues of an occupationally exposed individual. Health Phys 57, 17-21.
Kathren RL and Moore RH (1986). Acute accidental inhalation of U: A 38 year follow-up. Health Phys 51 (5), 609-619.
Khursheed A and Fell TP (1997). Sensitivity analysis for the ICRP Publication 67 model for plutonium. Radiat Prot Dosim 74, (1-2).
Kisieleski WE, Faraghan WG, Norris WP and Arnold JS (1952). The metabolism of uranium233 in mice. J Pharmacol Exp Ther 104, (4) 459-67.
Larsen RP, Bhattacharyya MH, Oldham RD et al (1984). Gastrointestinal absorption and retention of plutonium and uranium in the baboon. Argonne, Illinois, ANL-83-100 Part II Environmental Research Division Annual Report. July 1982-June 1983, pp51-60.
Leggett RW (1989). The behavior and chemical toxicity of U in the kidney: a reassessment. Health Phys 57, (3) 365-83.
Leggett RW (1992). A generic age-specific biokinetic model for calcium-like elements. Radiat Prot Dosim 41, 183-198.
Leggett RW (1993). An age-specific kinetic model of lead metabolism in humans. Environ Health Perspect 101, (7) 598-616.
Leggett RW (1994). Basis for the ICRP's age-specific biokinetic model for uranium. Health Phys 67, 589-610.
Leggett RW (2001). Reliability of the ICRP's dose coefficients for members of the public. I. Sources of uncertainty in the biokinetic models. Radiat Prot Dosim 95, 199-213.
Leggett RW, Eckerman KF and Williams LR (1982). Strontium-90 in bone: A case study in age-dependent dosimetric modelling. Health Phys 43, (3) 307-322.
Leggett RW and Harrison JD (1995). Fractional absorption of ingested uranium in humans. Health Phys 68, (4) 484-498.
Leggett RW and Pellmar TC (2003). The biokinetics of uranium migrating from embedded DU fragments. J Environ Radioact 64, (2-3) 205-25.
Li WB, Roth P, Wahl W, Oeh U, Hollriegl V and Paretzke HG (2005) Biokinetic modelling of uranium in man after injection and ingestion. Radiat Environ Biophys 44, 29-40.
Lipsztein JL (1981). An improved model for uranium metabolism in the primate. PhD Dissertation, New York University.
Lucas HFJr and Markun F (1970). Thorium and uranium in blood, urine and cigarettes. Argonne, Illinois, ANL-7760 Part II Biology and Medicine. July 1969-June 1970, pp47-52.

UNCERTAINTY ANALYSIS OF THE ICRP SYSTEMIC MODEL FOR URANIUM AS APPLIED TO INTERPRETATION OF BIOASSAY DATA FOR DEPLETED URANIUM
52
Luessenhop AJ, Gallimore JC, Sweet WH et al (1958). The toxicity in man of hexavalent uranium following intravenous administration. Am J Roentgenol 79, (1) 83-100.
McDiarmid MA, Squibb K, and Engelhardt, SM (2004). Biologic monitoring for urinary uranium in Gulf War I veterans. Health Phys 87, 51-56.
Meddings DR and Haldimann M (2002). Depleted uranium in Kosovo: an assessment of potential exposure for aid workers, Health Phys 82, 467-472.
Morrow P, Gelein R, Beiter H et al (1982). Inhalation and intravenous studies of UF6/UO2F2 in dogs. Health Phys 43, (6) 859-874.
Muir JR, Fish BR, Jones ES et al (1960). Distribution and excretion of uranium. Oak Ridge, USA, Health Physics Division Annual Progress Report for period ending July 31, 1960. Report No. ORNL-2994.
Neuman WF (1949-1953). Deposition of uranium in bone. In: Pharmacology and toxicology of uranium compounds, (Voegtlin C, Hodge HC, Eds). USA. McGraw-Hill Book Company Inc.
Neuman WF, Fleming RW, Dounce AL et al (1948). The distribution and excretion of injected uranium. J Biol Chem 173, 737-748.
Ough EA, Lewis BJ, Andrews WS, Bennett LG, Hancock RG, and Scott K (2002). An examination of uranium levels in Canadian forces personnel who served in the Gulf War and Kosovo, Health Phys 82, 527-532.
Parrish RR, Thirlwall MF, Pickford C, Horstwood M, Gerdes A, Anderson J, and Coggon D (2006). Determination of 238U/235U, 236U/238U and uranium concentration in urine using SF-ICP-MS and MC-ICP-MS: an interlaboratory comparison, Health Phys 90, 127-38.
Portuguese Nuclear and Technological Institute, Radiological Protection and Nuclear Safety Department (2001). Report of the Portuguese Scientific Mission to Kosovo and to Bosnia-Herzegovina for assessment of radioactive contamination and of the radiological risk due to the use of depleted uranium ammunitions.
Priest ND, Howells GR, Green D and Haines JW ( 1982). Uranium in bone: metabolic and autoradiographic studies in the rat. Hum Toxicol 1, 97-114.
Puncher M and Birchall A (2007). Estimating uncertainties on dose assessments. Submitted to Radiat Prot Dosim.
Roberts AM, Coulston DJ and Bates TH (1977). Conformation of in vivo uranium-in chest survey by analysis of autopsy specimens. Health Phys 32, (5) 435-7.
Roth P, Werner E and Paretzke HG (2001). A study of uranium excreted in urine. An assessment of protective measures taken by the German Army KFOR Contingent. GSF - National Research Center for Environment and Health, Institute of Radiation Protection, Neuherberg, Germany. GSF Report 3/01. Available at www.nato.int/du/docu/ge010229a.pdf (2001). Accessed May 2006.
Rowland RE and Farnham JE (1969). The deposition of uranium in bone. Health Phys 17, (1) 139-44.
Royal Society (2001). The health Hazards of depleted uranium munitions. Part 1. The Royal Society, London.
Saltelli A, Chan K and Scott EM (2000). Sensitivity Analysis. John Wiley & Sons, Chichester, UK.
Sanotskii VA, Mikhailovich SM and Ivannikov AT (1963). Abstract No. 40513: The toxic effect of uranium compounds. Nucl Sci Abstra 17, 5450.
Sanotskii VA, Mikhailovich SM and Ivannikov AT (1964). The toxic effect of uranium compounds. IN Radiological Health and Safety in mining and milling of nuclear materials 26 Aug. 1963-31 Aug. 1963 Vienna, IAEA, 275-288.
Singh NP, Bennett DD, Wrenn ME and Saccomanno G (1987). Concentrations of alpha-emitting isotopes of U and Th in uranium miners' and millers' tissues. Health Phys 53, (3) 261-265.
Singh NP, Lewis LL and Wrenn ME (1986). Abstract THAM-E3: Uranium in human tissues of Colorado, Pennsylvania and Utah populations. Health Phys 50, [Supplement 1] S83.
Sontag W (1984). Long-term behaviour of 239Pu, 241Am and 233U in different bones of one-year-old rats: macrodistribution and macrodosimetry. Hum Toxicol 3, 469-483.

REFERENCES
53
Spoor NL and Hursh JB (1973). Protection Criteria. IN Uranium, plutonium, transplutonic elements. Handbook of Experimental Pharmacology Volume 36, (Hodge HC, Stannard JN, Hursh JB, Eds). New York. Springer-Verlag, pp 241-270.
Stevens W, Bruenger FW, Atherton DR et al (1980). The distribution and retention of hexavalent 233U in the Beagle. Radiat Res 83, 109-126.
Struxness EG, Luessenhop AJ, Bernard SR and Gallimore JC (1956). The distribution and excretion of hexavalent uranium in man. IN Proceedings of the international conference on the peaceful uses of atomic energy 8 Aug. 1955-20 Aug. 1955 New York, United Nations, 186-196.
Tannenbaum A. (1951) Toxicology of uranium: Survey and collected papers. New York, USA, McGraw-Hill Book Company Inc. National Nuclear Energy Series, Manhattan Project Technical Section.
Terepka AR, Toribara TY and Neuman WF (1964). Abstract 22: Skeletal retention of uranium in man. IN 46th meeting of the Endocrine Society 1964 33.
Ting, BT, Paschal DC, Jarrett JM, Pirkle JL, Jackson RJ, Sampson EJ, Miller DT and Caudill SP (1999). Uranium and thorium in urine of United States residents: Reference range concentrations. Environmental Research Section A 81, 45–51.
Voegtlin C, Hodge HC. (1949-1953) Pharmacology and toxicology of uranium compounds. USA, McGraw-Hill Book Company Inc. Notes: 4 volumes
Wilson RH (1959). The Hanford uranium bio-assay program. IN Symposium on occupational health experience and practices in the uranium industry 15 Oct. 1958-17 Oct. 1958 Washington, D.C., Health and Safety Laboratory, United States Atomic Energy Commission, 77-84.
Wood SK, Farnham JE and Marshall JH (1970). 45Ca, 133Ba, and 226Ra in 6- to 10-year-old Beagle dogs: a 100 day study. Argonne, Illinois, ANL-7760 Part II Biology and Medicine. July 1969-June 1970, pp110-132.
Wrenn ME, Bertelli L, Durbin PW et al (1994). A comprehensive metabolic model for uranium metabolism and dosimetry based on human and animal data. Radiat Prot Dosim 53, 255-258.