Embed Size (px)
Citation preview

Erin P. HubbardJacobs Technology Inc., Cleveland, Ohio
Uncertainty Analysis of the CE-22 AdvancedNozzle Test Facility
NASA/CR—2019-220065
March 2019

NASA STI Program . . . in Profi le
Since its founding, NASA has been dedicated to the advancement of aeronautics and space science. The NASA Scientifi c and Technical Information (STI) Program plays a key part in helping NASA maintain this important role.
The NASA STI Program operates under the auspices of the Agency Chief Information Offi cer. It collects, organizes, provides for archiving, and disseminates NASA’s STI. The NASA STI Program provides access to the NASA Technical Report Server—Registered (NTRS Reg) and NASA Technical Report Server—Public (NTRS) thus providing one of the largest collections of aeronautical and space science STI in the world. Results are published in both non-NASA channels and by NASA in the NASA STI Report Series, which includes the following report types: • TECHNICAL PUBLICATION. Reports of
completed research or a major signifi cant phase of research that present the results of NASA programs and include extensive data or theoretical analysis. Includes compilations of signifi cant scientifi c and technical data and information deemed to be of continuing reference value. NASA counter-part of peer-reviewed formal professional papers, but has less stringent limitations on manuscript length and extent of graphic presentations.
• TECHNICAL MEMORANDUM. Scientifi c
and technical fi ndings that are preliminary or of specialized interest, e.g., “quick-release” reports, working papers, and bibliographies that contain minimal annotation. Does not contain extensive analysis.
• CONTRACTOR REPORT. Scientifi c and technical fi ndings by NASA-sponsored contractors and grantees.
• CONFERENCE PUBLICATION. Collected papers from scientifi c and technical conferences, symposia, seminars, or other meetings sponsored or co-sponsored by NASA.
• SPECIAL PUBLICATION. Scientifi c,
technical, or historical information from NASA programs, projects, and missions, often concerned with subjects having substantial public interest.
• TECHNICAL TRANSLATION. English-
language translations of foreign scientifi c and technical material pertinent to NASA’s mission.
For more information about the NASA STI program, see the following:
• Access the NASA STI program home page at http://www.sti.nasa.gov
• E-mail your question to [email protected] • Fax your question to the NASA STI
Information Desk at 757-864-6500
• Telephone the NASA STI Information Desk at 757-864-9658 • Write to:
NASA STI Program Mail Stop 148 NASA Langley Research Center Hampton, VA 23681-2199

Erin P. HubbardJacobs Technology Inc., Cleveland, Ohio
Uncertainty Analysis of the CE-22 AdvancedNozzle Test Facility
NASA/CR—2019-220065
March 2019
National Aeronautics andSpace Administration
Glenn Research CenterCleveland, Ohio 44135
Prepared under Contract NNC15BA02B

Acknowledgments
This work was sponsored by the Aerosciences Evaluation and Test Capabilities (AETC) Portfolio at the NASA Glenn Research Center.
Available from
Trade names and trademarks are used in this report for identifi cation only. Their usage does not constitute an offi cial endorsement, either expressed or implied, by the National Aeronautics and
Space Administration.
Level of Review: This material has been technically reviewed by NASA expert reviewer(s).
This report contains preliminary fi ndings, subject to revision as analysis proceeds.
NASA STI ProgramMail Stop 148NASA Langley Research CenterHampton, VA 23681-2199
National Technical Information Service5285 Port Royal RoadSpringfi eld, VA 22161
703-605-6000
This report is available in electronic form at http://www.sti.nasa.gov/ and http://ntrs.nasa.gov/

Contents
List of Figures 2
List of Tables 3
1 Abstract 4
2 Facility Description 6
3 Critical Measurements and Calculations 8
4 Calibrations and Corrections 10
5 Data Reduction Calculations 125.1 Thrust Stand Calibration . . . . . . . . . . . . . . . . . . . . . . . . . . . . . . . . . . . . . . . 125.2 Tank pressure calibration . . . . . . . . . . . . . . . . . . . . . . . . . . . . . . . . . . . . . . . 155.3 Secondary line calibration . . . . . . . . . . . . . . . . . . . . . . . . . . . . . . . . . . . . . . . 165.4 Pressure tare calibration . . . . . . . . . . . . . . . . . . . . . . . . . . . . . . . . . . . . . . . . 175.5 ASME nozzle calibration . . . . . . . . . . . . . . . . . . . . . . . . . . . . . . . . . . . . . . . 185.6 Customer test . . . . . . . . . . . . . . . . . . . . . . . . . . . . . . . . . . . . . . . . . . . . . 18
6 Uncertainty approach 226.1 General Description . . . . . . . . . . . . . . . . . . . . . . . . . . . . . . . . . . . . . . . . . . 226.2 Elemental standard uncertainty estimates . . . . . . . . . . . . . . . . . . . . . . . . . . . . . . 23
6.2.1 Pressure measurements . . . . . . . . . . . . . . . . . . . . . . . . . . . . . . . . . . . . 236.2.2 Temperature measurements . . . . . . . . . . . . . . . . . . . . . . . . . . . . . . . . . . 246.2.3 Force measurements . . . . . . . . . . . . . . . . . . . . . . . . . . . . . . . . . . . . . . 256.2.4 Lengths and Areas . . . . . . . . . . . . . . . . . . . . . . . . . . . . . . . . . . . . . . . 276.2.5 Regression Uncertainty . . . . . . . . . . . . . . . . . . . . . . . . . . . . . . . . . . . . 27
6.3 Summary of uncertainty inputs . . . . . . . . . . . . . . . . . . . . . . . . . . . . . . . . . . . . 29
7 Results 317.1 P0, PT , DP25, NPR: Critical facility calculations . . . . . . . . . . . . . . . . . . . . . . . . . 31
7.1.1 Random Uncertainty . . . . . . . . . . . . . . . . . . . . . . . . . . . . . . . . . . . . . 317.1.2 Systematic and Combined uncertainty . . . . . . . . . . . . . . . . . . . . . . . . . . . . 32
7.2 M5ID: Ideal Mach number at station 5 . . . . . . . . . . . . . . . . . . . . . . . . . . . . . . . 337.2.1 Random uncertainty . . . . . . . . . . . . . . . . . . . . . . . . . . . . . . . . . . . . . . 337.2.2 Systematic uncertainty . . . . . . . . . . . . . . . . . . . . . . . . . . . . . . . . . . . . 347.2.3 Combined uncertainty . . . . . . . . . . . . . . . . . . . . . . . . . . . . . . . . . . . . . 35
7.3 FGY , FGZ, MX, MY , MZ: Gross forces and moments . . . . . . . . . . . . . . . . . . . . . 367.3.1 Random uncertainty . . . . . . . . . . . . . . . . . . . . . . . . . . . . . . . . . . . . . . 367.3.2 Systematic uncertainty . . . . . . . . . . . . . . . . . . . . . . . . . . . . . . . . . . . . 367.3.3 Combined uncertainty . . . . . . . . . . . . . . . . . . . . . . . . . . . . . . . . . . . . . 37
7.4 Uncertainty Sources . . . . . . . . . . . . . . . . . . . . . . . . . . . . . . . . . . . . . . . . . . 407.5 Example results for WP,CDN,FG and CFG: Mass flow, discharge coefficient, gross thrust and
thrust coefficient . . . . . . . . . . . . . . . . . . . . . . . . . . . . . . . . . . . . . . . . . . . . 43
8 What-If Scenario 448.1 Push-Pull Calibration: Test Matrix Optimization . . . . . . . . . . . . . . . . . . . . . . . . . . . 44
8.1.1 Scenario description . . . . . . . . . . . . . . . . . . . . . . . . . . . . . . . . . . . . . . 448.1.2 Scenario results . . . . . . . . . . . . . . . . . . . . . . . . . . . . . . . . . . . . . . . . 44
9 Conclusion 46
10 References 47
NASA/CR—2019-220065 1

List of Figures
1 CE-22 test facility overview . . . . . . . . . . . . . . . . . . . . . . . . . . . . . . . . . . . . . . 62 Thrust stand and sign convention . . . . . . . . . . . . . . . . . . . . . . . . . . . . . . . . . . . 73 Thrust stand with ASME nozzle installed . . . . . . . . . . . . . . . . . . . . . . . . . . . . . . 74 Airflow measurement locations for primary flow [1] . . . . . . . . . . . . . . . . . . . . . . . . . 85 CE-22 calibration progression (from bottom to top) . . . . . . . . . . . . . . . . . . . . . . . . . 106 Calibration flow chart . . . . . . . . . . . . . . . . . . . . . . . . . . . . . . . . . . . . . . . . . 107 Thrust stand load cell locations and critical distances . . . . . . . . . . . . . . . . . . . . . . . . 128 Data Reduction summary for sensitivity matrices [S] and [U] . . . . . . . . . . . . . . . . . . . . 139 Summary of calculations to determine coefficients σij . . . . . . . . . . . . . . . . . . . . . . . . 1310 Summary of calculations to determine coefficients µij . . . . . . . . . . . . . . . . . . . . . . . . 1411 Push-pull calibration example . . . . . . . . . . . . . . . . . . . . . . . . . . . . . . . . . . . . . 1412 Tank pressure calibration data reduction flow chart . . . . . . . . . . . . . . . . . . . . . . . . . 1513 Tank pressure calibration example . . . . . . . . . . . . . . . . . . . . . . . . . . . . . . . . . . 1514 Secondary line calibration data reduction flow chart . . . . . . . . . . . . . . . . . . . . . . . . . 1615 Secondary line pressure calibration example . . . . . . . . . . . . . . . . . . . . . . . . . . . . . 1616 Pressure tare calibration data reduction flow chart . . . . . . . . . . . . . . . . . . . . . . . . . . 1717 Pressure tare (ALS3) calibration example . . . . . . . . . . . . . . . . . . . . . . . . . . . . . . . 1818 ASME nozzle calibration: CF5C data reduction flow chart . . . . . . . . . . . . . . . . . . . . . 1919 ASME nozzle calibration: CD5C data reduction flow chart . . . . . . . . . . . . . . . . . . . . . 1920 Data reduction flow chart for gross force along the x-axis . . . . . . . . . . . . . . . . . . . . . . 2021 Data reduction flow chart for gross forces along the y- and z-axes and all gross moments . . . . . 2022 Data reduction flow chart for several airflow variables of interest . . . . . . . . . . . . . . . . . . 2123 Instrumentation level uncertainty analysis flow . . . . . . . . . . . . . . . . . . . . . . . . . . . . 2224 Systematic standard uncertainty estimate for ±15psid ESP system . . . . . . . . . . . . . . . . . 2425 Systematic standard uncertainty estimate for 45psid ESP system . . . . . . . . . . . . . . . . . . 2426 Systematic standard uncertainty estimate for 500psid ESP system . . . . . . . . . . . . . . . . . 2427 Example of thrust stand force uncertainty determination for bµ4,2
(see Figure 10) . . . . . . . . . 2628 ALS3 calibration/correction residuals and sALS3syx uncertainty estimate . . . . . . . . . . . . . . 2929 Synthetic error population example . . . . . . . . . . . . . . . . . . . . . . . . . . . . . . . . . . 2930 Expanded random uncertainty and UPC contributing to SNPR for PT = 45psia . . . . . . . . . . 3231 Expanded combined uncertainty for P0, PT , DP25, and NPR (UNPR shown for PT = 45psia) 3232 Expanded combined uncertainty in NPR for various PT settings . . . . . . . . . . . . . . . . . . 3333 Random UPC contributing to SM5ID for various nozzle sizes . . . . . . . . . . . . . . . . . . . . 3434 Expanded random uncertainty and UPC contributing to SM5ID for 40in2 nozzle . . . . . . . . . . 3435 Expanded systematic uncertainty, BM5ID, for various nozzle sizes . . . . . . . . . . . . . . . . . 3536 Expanded combined uncertainty, UM5ID, for various nozzle sizes . . . . . . . . . . . . . . . . . . 3537 UPC to random uncertainties in gross forces and moments . . . . . . . . . . . . . . . . . . . . . 3638 Expanded systematic uncertainty in directional gross forces FGY and FGZ . . . . . . . . . . . . 3739 Expanded systematic uncertainty in moments . . . . . . . . . . . . . . . . . . . . . . . . . . . . 3740 Expanded combined uncertainty in gross forces FGY and FGZ . . . . . . . . . . . . . . . . . . 3841 Expanded combined uncertainty in calculated moments . . . . . . . . . . . . . . . . . . . . . . . 3842 Tabulated results for expanded random, systematic and combined uncertainty in FGY, FGZ,MX,MY
and MZ . . . . . . . . . . . . . . . . . . . . . . . . . . . . . . . . . . . . . . . . . . . . . . . . 3943 Uncertainty sources and their levels of contribution to uP0, uPT , uDP25, uMX , uMY , uMZ , and
uM5ID . . . . . . . . . . . . . . . . . . . . . . . . . . . . . . . . . . . . . . . . . . . . . . . . . 4044 Uncertainty sources and their levels of contribution to uNPR . . . . . . . . . . . . . . . . . . . . 4145 Uncertainty sources and their levels of contribution to uFGY and uFGZ . . . . . . . . . . . . . . 4246 Example of expanded combined, random and systematic uncertainty in critical variables of interest 4347 Expanded systematic uncertainty in MX for proposed Push-Pull calibration test matrices . . . . . 4548 Expanded systematic uncertainty in MY for proposed Push-Pull calibration test matrices . . . . . 4549 Expanded systematic uncertainty in MZ for proposed Push-Pull calibration test matrices . . . . . 45
NASA/CR—2019-220065 2
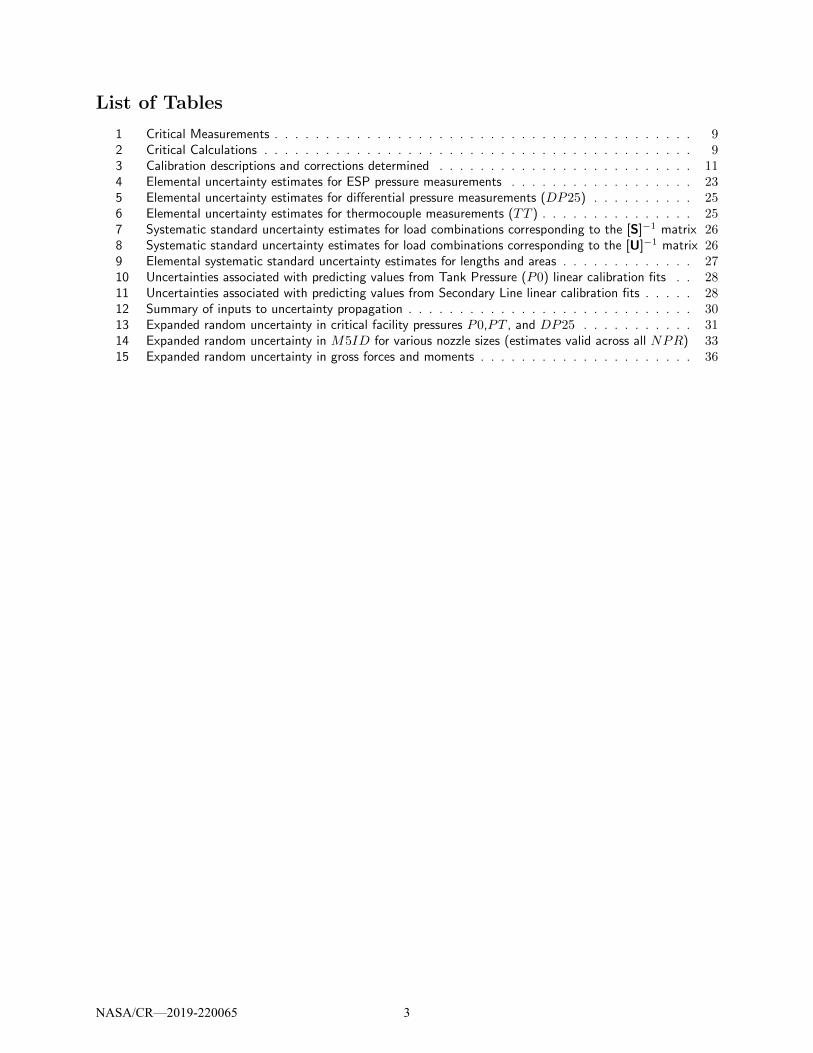
List of Tables
1 Critical Measurements . . . . . . . . . . . . . . . . . . . . . . . . . . . . . . . . . . . . . . . . . 92 Critical Calculations . . . . . . . . . . . . . . . . . . . . . . . . . . . . . . . . . . . . . . . . . . 93 Calibration descriptions and corrections determined . . . . . . . . . . . . . . . . . . . . . . . . . 114 Elemental uncertainty estimates for ESP pressure measurements . . . . . . . . . . . . . . . . . . 235 Elemental uncertainty estimates for differential pressure measurements (DP25) . . . . . . . . . . 256 Elemental uncertainty estimates for thermocouple measurements (TT ) . . . . . . . . . . . . . . . 257 Systematic standard uncertainty estimates for load combinations corresponding to the [S]−1 matrix 268 Systematic standard uncertainty estimates for load combinations corresponding to the [U]−1 matrix 269 Elemental systematic standard uncertainty estimates for lengths and areas . . . . . . . . . . . . . 2710 Uncertainties associated with predicting values from Tank Pressure (P0) linear calibration fits . . 2811 Uncertainties associated with predicting values from Secondary Line linear calibration fits . . . . . 2812 Summary of inputs to uncertainty propagation . . . . . . . . . . . . . . . . . . . . . . . . . . . . 3013 Expanded random uncertainty in critical facility pressures P0,PT , and DP25 . . . . . . . . . . . 3114 Expanded random uncertainty in M5ID for various nozzle sizes (estimates valid across all NPR) 3315 Expanded random uncertainty in gross forces and moments . . . . . . . . . . . . . . . . . . . . . 36
NASA/CR—2019-220065 3

1 Abstract
This paper presents methods and results of a detailed measurement uncertainty analysis that was performed for theAdvanced Nozzle Test Facility, CE-22, located at the NASA Glenn Research Center. Results for the uncertaintyin thrust and flow coefficients in addition to other variables of interest are provided. Results are presentedseparately as random uncertainty (characterizing errors inherent to instrument or measurement environment,impacting repeatability), systematic uncertainty (capturing inaccuracies due to measurement process, calibration,installation effects or other similar sources which may introduce bias), and total combined uncertainty. Thestatistical methods and engineering judgments used to estimate elemental uncertainties are described. MANTUS(Measurement ANalysis Tool for Uncertainty in Systems) was used to quantify instrumentation uncertainty, andstatistical analysis and engineering judgment were used to quantify other random and systematic uncertaintysources. The Monte Carlo method was used to propagate systematic and random elemental uncertainties todetermine the uncertainties of various calculated variables of interest.
NASA/CR—2019-220065 4
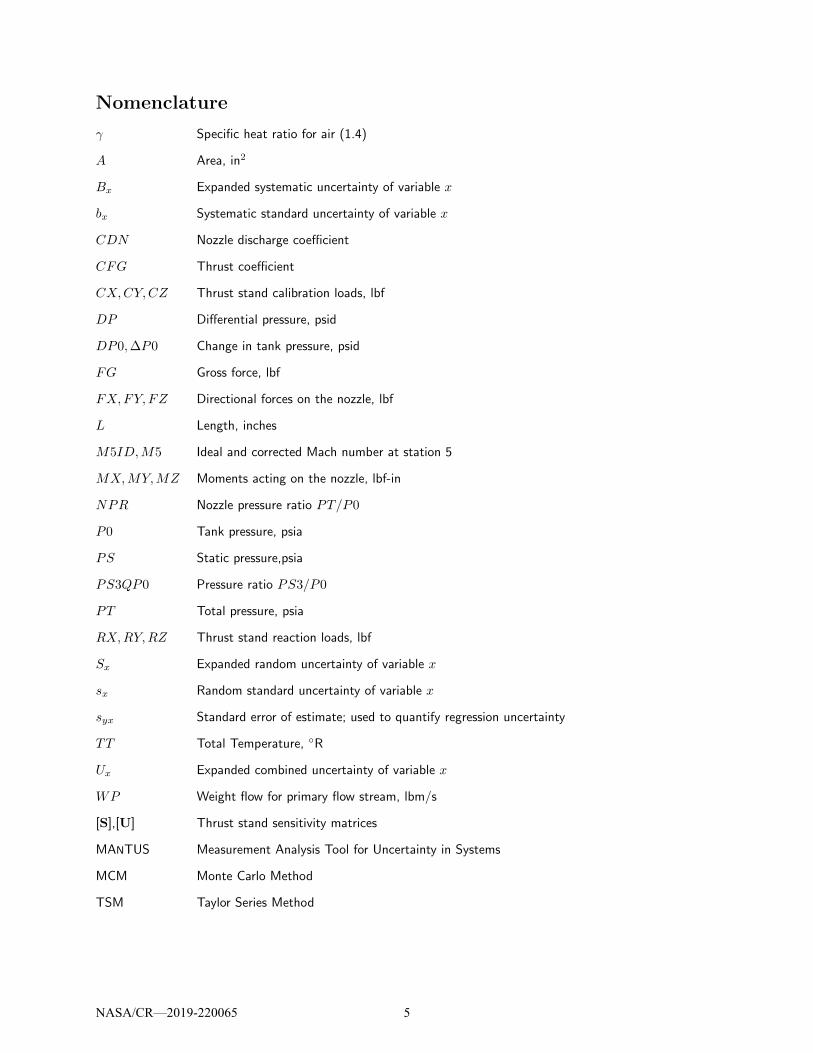
Nomenclature
γ Specific heat ratio for air (1.4)
A Area, in2
Bx Expanded systematic uncertainty of variable x
bx Systematic standard uncertainty of variable x
CDN Nozzle discharge coefficient
CFG Thrust coefficient
CX,CY,CZ Thrust stand calibration loads, lbf
DP Differential pressure, psid
DP0,∆P0 Change in tank pressure, psid
FG Gross force, lbf
FX,FY, FZ Directional forces on the nozzle, lbf
L Length, inches
M5ID,M5 Ideal and corrected Mach number at station 5
MX,MY,MZ Moments acting on the nozzle, lbf-in
NPR Nozzle pressure ratio PT/P0
P0 Tank pressure, psia
PS Static pressure,psia
PS3QP0 Pressure ratio PS3/P0
PT Total pressure, psia
RX,RY,RZ Thrust stand reaction loads, lbf
Sx Expanded random uncertainty of variable x
sx Random standard uncertainty of variable x
syx Standard error of estimate; used to quantify regression uncertainty
TT Total Temperature, ◦R
Ux Expanded combined uncertainty of variable x
WP Weight flow for primary flow stream, lbm/s
[S],[U] Thrust stand sensitivity matrices
MANTUS Measurement Analysis Tool for Uncertainty in Systems
MCM Monte Carlo Method
TSM Taylor Series Method
NASA/CR—2019-220065 5

2 Facility Description
CE-22 houses the Advanced Nozzle Test Facility test rig, located within the Engine Research Building at NASAGlenn Research Center in Cleveland, Ohio (Figure 1). Nozzle performance characteristics for nozzles ranging from6 to 40 square inch throat areas are determined by measurements from a 3-axis thrust stand (Figure 2) and severalprobes within the test rig[1].
Figure 1: CE-22 test facility overview [2]
The facility can achieve nozzle pressure ratios up to 50 while simulating altitudes from sea level to 48,000 feet.It also has various configuration options (swirl vane package, specific calibrations for nozzle sizes, various rangesof differential pressure transducers installed, etc.). For the purpose of this analysis, which quantifies uncertaintyon a general facility scale, the most standard facility configurations are assumed.a Figure 3 shows the thrust standwith an ASME nozzle installed.
aStandard facility configuration parameters: no swirl vane installed, full range ASME calibration, highest range differentialpressure transducers installed (5 psid), no secondary line usage.
NASA/CR—2019-220065 6

Figure 2: Thrust stand and sign convention [2]
Figure 3: Thrust stand with ASME nozzle installed [3]
NASA/CR—2019-220065 7

3 Critical Measurements and Calculations
Often times hundreds or even thousands of measurements are taken in test facilities; some for facility healthmonitoring, some for operations, some for redundancy, and some for calculation of key variables and criticalparameters. Figure 4 shows the station locations and arrangement of key measurements in this facility. Tables 1and 2 further describe key facility variables and the measurements upon which they rely.
Figure 4: Airflow measurement locations for primary flow [1]
NASA/CR—2019-220065 8

Variable
Name
Description
Numberofmeasu
rements
Instru
menta
tion
P0
Am
bie
nt
tan
kp
ress
ure
,p
sia
2E
SP
,15
psi
ran
gePT
Tot
alp
ress
ure
b,
psi
a15
ES
P,
45p
sira
nge
DP
25B
ellm
outh
diff
eren
tial
pre
ssu
re,
psi
d4
Sen
sote
cor
Bel
l&
How
ell
1,2
or
5p
sidc
PS
1,PS
2,PS
3,PS
5,PS
6S
tati
cp
ress
ure
atva
riou
sst
atio
ns,
psi
a2,
4,4,
4,2,
resp
ecti
vel
yE
SP
,45
psi
ran
gePS
302,PS
303
Sec
ond
ary
lin
ep
ress
ure
s,p
sia
1p
erli
ne
ES
P,
500p
sira
nge
TT
Tot
alte
mp
eratu
rein
pri
mar
yfl
ow,◦ R
5T
yp
eK
ther
moco
up
le,
refe
ren
ceov
enRX,RY,RZ
Rea
ctio
nlo
ad
s,lb
f2,
2,4,
resp
ecti
vely
2,00
0an
d4,
000
lbf
load
cell
sCX,CY,CZ
Cal
ibra
tion
load
s,lb
f2,
2,4,
resp
ecti
vely
2,00
0an
d4,
000
lbf
load
cell
sLY,L
R,L
P1,L
P2
Th
rust
stan
dm
om
ent
arm
sto
load
cell
loca
tion
sn
/aF
acil
ity
pro
vid
edA
5,ALS
1A
rea
atst
atio
n5
and
labyri
nth
seal
area
,in
2n
/aF
acil
ity
pro
vid
edA
8N
ozzl
eex
itar
ea,
in2
n/a
Cu
stom
erp
rovid
ed(u
nle
ssA
SM
E)
Tab
le1:
Desc
rip
tion
of
crit
ical
measu
rem
ents
Variable
Name
Description
f(x
)NPR
Noz
zle
pre
ssu
rera
tio
for
pri
mar
yst
ream
f(PT,P
0)M
5ID
Idea
lM
ach
nu
mb
erfo
rp
rim
ary
stre
amf
(PS
1,DP
25)
WP
Wei
ght
flow
for
pri
mar
yst
ream
,lb
m/s
ecf
(A5,P
0,PS
1,TT
6,DP
25)
FGX
Gro
ssax
ial
forc
eon
the
noz
zle,
lbf
f(RX,RY,RZ,PS
302,PS
303,P
0,PT,PS
1,PS
3,PS
5,PS
6,DP
25)
FGY,FGZ
Gro
ssoff
-axis
dir
ecti
onal
forc
eson
the
noz
zle,
lbf
f(RX,RY,RZ,PS
302,PS
303,P
0)MX,M
Y,M
ZM
omen
tsac
tin
gon
the
noz
zle,
lbf-
inf
(RX,RY,RZ,PS
302,PS
303,P
0)FG
Gro
ssfo
rce
onth
en
ozz
le,
lbf
f(FGX,FGY,FGZ
)CDN
Noz
zle
dis
char
geco
effici
ent
f(A
8,WP,M
5ID,PT,TT,γ
)CFG
Th
rust
coeffi
cien
tf
(FG,W
P,TT,N
PR,γ
)
Tab
le2:
Desc
rip
tion
of
crit
ical
calc
ula
ted
varia
ble
s
bT
his
valu
eis
corr
ecte
dif
swir
lvan
ep
ack
age
isu
sed
;si
nce
this
isn
ot
ast
an
dard
con
figu
rati
on
,th
isu
nce
rtain
tyan
aly
sis
does
not
incl
ud
eth
isco
rrec
tion
.cD
epen
din
gon
the
test
matr
ixan
dn
ozz
lesi
zes
bei
ng
test
ed,DP
25
con
figu
rati
on
may
vary
.F
or
this
an
aly
sis,
5p
sid
Bel
l&
How
ell
tran
sdu
cer
inst
allati
on
isass
um
ed.
NASA/CR—2019-220065 9

4 Calibrations and Corrections
A series of calibrations is performed to determine corrections for incidental forces that act upon the thrust standin order to isolate thrust produced by the test article. Figure 5 shows the calibration progression sequence, frombottom to top. Figure 6 additionally shows which calibrations are nested within one another, which is particularlyimportant to understand when considering the impact of how uncertainty from a calibration propagates throughsubsequent calibrations and ultimately impacts the customer test. Note that the deadweight check visible in Figure5 is merely a verification of some of the sensitivity matrix results. While it is an important step procedurally forverification, it does not impact the calculations of variables of interest and is therefore not incorporated into thisanalysis.
Load Cell Calibration
Thrust Stand Sensitivities Calibration
Tank Pressure Calibration
ASME
Calibration
Pressure
Tare
Calibration
Secondary
Line
Calibration
Deadweight
Check
Figure 5: CE-22 calibration progression (from bottom to top)
Thrust Stand
Sensitivities
Calibration
Tank Pressure (P0)
Calibration
Secondary
Line
Calibration
Pressure Tare (ALS3)
Calibration
ASME
Calibration
Customer
test
Figure 6: Calibration flow chart
Table 3 summarizes the calibrations and the resulting corrections, which are fully detailed in other publications[2][3][1].
NASA/CR—2019-220065 10

Calibra
tion
Name
Description
Calibra
ted
values
or
correction
facto
rsdeter-
mined
Th
rust
stan
dse
nsi
tivi-
ties
(“P
ush
-Pu
ll”)
cali
-b
rati
on
Vari
ou
sfo
rces
are
app
lied
toth
eth
rust
stan
dby
cali
bra
tion
load
cell
s(CX,CY,CZ
)in
du
cin
gfo
rces
and
mom
ents
inva
riou
sd
irec
tion
sex
per
ien
ced
by
the
thru
stst
and
reac
tion
load
cell
s(RX,RY,RZ
).S
ensi
tivit
ies
tolo
ads
are
det
erm
ined
by
the
slop
esof
the
reac
tion
vs.
cali
bra
tion
forc
es.
Sen
siti
vit
ym
atri
ces
[S]
an
d[U
]ar
eu
sed
toca
lcu
late
di-
rect
ion
alfo
rces
and
mom
ents
Tan
kP
ress
ure
(“P
0”)
cali
bra
tion
Wh
enth
eta
nk
vacu
um
sou
tto
low
pre
ssu
re,
tan
kd
eflec
tion
sex
ert
inci
den
tal
forc
esob
serv
edby
the
thru
stst
and
.S
ensi
tivit
ies
toch
ange
inta
nk
pre
ssure
(∆P
0)ar
ed
eter
min
edby
clos
ing
offth
eta
nk
exh
aust
and
fin
din
gsl
opes
ofre
acti
onlo
ads
vs.
∆P
0
FXP
0,FYP
0,FZP
0,MXP
0,MYP
0,MZP
0
Sec
ond
ary
lin
eca
lib
ra-
tion
Cu
stom
ers
hav
eth
eop
tion
tou
sese
con
dar
yli
nes
du
rin
gte
stin
g.T
his
corr
ecti
onis
det
erm
ined
toas
sure
any
forc
esex
erte
dth
rou
ghu
seof
the
seco
nd
ary
flow
lin
esar
eac
cou
nte
dfo
r.S
ensi
tivit
ies
tod
iffer
ence
inp
ress
ure
bet
wee
nth
ese
con
dar
yli
ne
pre
ssu
res
and
tan
kp
ress
ure
are
det
erm
ined
by
cap
pin
goff
the
seco
nd
ary
lin
ep
ipes
and
fin
din
gsl
opes
ofre
acti
onlo
ads
vs.
∆PS
302C
0an
d∆PS
303C
0
FX
302,FX
303,
FY
302,FY
303,
FZ
302,FZ
303,
MX
302,MX
303,
MY
302,MY
303,
MZ
302,MZ
303
Pre
ssu
reta
reca
lib
rati
on(“
AD
P”,
“A∆
P”,
“AL
S3”
)
Aco
rrec
tion
isd
eter
min
edw
hic
hac
cou
nts
for
the
fric
tion
alfo
rce
act-
ing
onth
ep
rim
ary
duct
asai
rex
its
thro
ugh
the
labyri
nth
seal
.T
his
corr
ecti
onis
det
erm
ined
by
bla
nkin
goff
the
du
ctju
std
own
stre
amof
the
labyri
nth
seal
atst
atio
n5,
pre
ssu
rizi
ng
the
mai
nli
ne,
and
ana-
lyzi
ng
the
reac
tion
load
s.
FTARE
AS
ME
cali
bra
tion
Th
eA
SM
Eca
lib
rati
onis
per
form
edto
form
are
lati
onsh
ipb
etw
een
thru
stst
an
dre
acti
ons
and
kn
own
noz
zle
char
acte
rist
icb
ehav
ior.
Du
rin
ga
cust
omer
test
,th
en
ozzl
ep
erfo
rman
ceca
nb
ed
eter
min
edth
rou
gh
com
mon
alit
ies
bet
wee
nth
ete
sted
noz
zle
and
kn
own
AS
ME
nozz
lep
erfo
rman
ce.
CD
5,CF
5
Tab
le3:
Cali
brati
on
desc
rip
tion
san
dcorrecti
on
sd
ete
rm
ined
NASA/CR—2019-220065 11

5 Data Reduction Calculations
The data reduction sequence from raw measurements through the calculation of critical variables of interest mustbe well understood and replicated within the Monte Carlo code environment in order to propagate uncertaintiesproperly. This section describes the data reduction for each test performed in CE-22 leading to and includinga customer test. Data reduction flow charts were developed for all tests to aid the engineer in tracking thesecalculations while developing the code. They are included in this report to depict the route from raw measurementsto variables of interest, as well as to show the sheer number of measurements that are included in final calculationsof critical variables.
5.1 Thrust Stand Calibration
For a perfect thrust stand, the applied loads would be exactly equal and in opposite direction to the reactionloads. However, as with any physical system, imperfections lead to off-axis loading, hysteresis, non-linearity andother effects. This calibration is meant to account for some of these imperfections so that directional forces canbe predicted from thrust stand reaction loads.
A series of loads exerted by the calibration load cells induce directional forces and moments on the thruststand. Sensitivities are developed when those exerted loads are plotted against the observed reaction loads andfirst order curves are fit to the data. Figure 7 shows the locations of calibration and reaction load cells. Figure 8shows a flow chart summary of the data reduction to obtain the load sensitivities. Figures 9 and 10 summarize theequations used to obtain all σ and µ values (slopes of the first order fits to calibration data). A full and detaileddescription of the test matrix and data reduction sequence, as well as the derivation of the sensitivity matrices[S] and [U], can be found in reference [3].
Figure 7: Thrust stand load cell locations and critical distances [3]
NASA/CR—2019-220065 12

Figure 8: Data Reduction summary for sensitivity matrices [S] and [U]
Figure 9: Summary of calculations to determine coefficients σij for the [S]−1 matrix [3]
NASA/CR—2019-220065 13

Figure 10: Summary of calculations to determine coefficients µij for the [U]−1 matrix [3]
An example of two plots produced from the Push-Pull calibration data (and subsequent slope/sensitivitydetermination using least-squares linear fits) is shown in Figure 11. This particular example shows the sensitivityof response loads in the x- and y-directions (RX1+RX2, RY 2) when x-directional forces are applied by calibrationload cells (FXapplied = CX1 + CX2). These plots show both on- and off-axis reaction sensitivities; ideally, on-axis slopes would be equivalent to 1 and off-axis would be 0. But as was previously mentioned, the thrust standis an imperfect physical system which is characterized by this calibration. The slope from the on-axis reactionload analysis falls into both the [S]−1 and [U]−1 matrices’ upper left hand entry, σ1,1 and µ1,1, while the off-axisslope shown from the RY 2 reaction load falls into σ3,1 and µ3,1 (see Figures 9 and 10). The rest of the [S]−1
and [U]−1 matrices are filled out with similar reaction load analyses.
-3000 -2000 -1000 0
FX = CX1+CX2, lbf (applied load)
-3000
-2500
-2000
-1500
-1000
-500
0
RX
1+
RX
2, lb
f (r
eact
ion
load
)
(A)
Calibration data
Linear fit, (RX1+RX2)/ FX = 0.998
-3000 -2000 -1000 0
FX = CX1+CX2, lbf (applied load)
-2
0
2
4
6
8
RY
2, lb
f (r
eact
ion
load
)
(B)
Calibration data
Linear fit, RY2/ FX = -0.0026
Figure 11: Push-pull calibration: Example determinations of on- (A) and off-axis (B) reaction load sensitivitiesfor [S]−1 and [U]−1 matrices (i.e., σ1,1 = µ1,1 = 0.998 and σ3,1 = µ3,1 = 0.− 0.0026)
NASA/CR—2019-220065 14

5.2 Tank pressure calibration
Since the thrust stand is mounted directly to the large outer pressure tank in the facility, minor deflections dueto change in tank pressure (∆P0) cause incidental forces to be observed by the thrust stand. Sensitivities fromthe [S] and [U] matrices previously determined are fed into this data reduction, depicted in Figure 12. Correctioncoefficients are determined by plotting reaction loads and moments versus change in tank pressure, ∆P0. Anexample of this for determination of slope CFXP0 is shown in Figure 13.
Figure 12: Tank pressure calibration data reduction flow chart
-20 -10 0 10 20
P0, psid
-5
0
5
FX
, lb
f
Calibration data
Linear fit, y = -0.302x + 0.349
Figure 13: Tank pressure calibration: Example determination of sensitivity coefficient for FXP0 (CFXP0 =−0.302lbf/psi)
NASA/CR—2019-220065 15

5.3 Secondary line calibration
Use of the 450psia secondary air lines cause loads to be exerted on the thrust stand. To account for this, correctioncoefficients are determined by plotting the reaction loads and moments versus the secondary line air pressuresPS302C and PS303C. Sensitivities from the [S] and [U] matrices as well as correction coefficients previouslydetermined from the tank pressure calibration are fed into this data reduction, depicted in Figure 14. An exampleof this is shown in Figure 15 for determination of CFXP302.
Figure 14: Secondary line calibration data reduction flow chart
0 100 200 300 400 500
PS302C, psia
-4
-2
0
2
4
6
8
FX
, lb
f
Calibration data
Linear fit, y = 0.025x - 4.8
Figure 15: Secondary line pressure calibration: Example determination of sensitivity coefficient for FX302(CFXP302C = 0.025lbf/psi)
NASA/CR—2019-220065 16
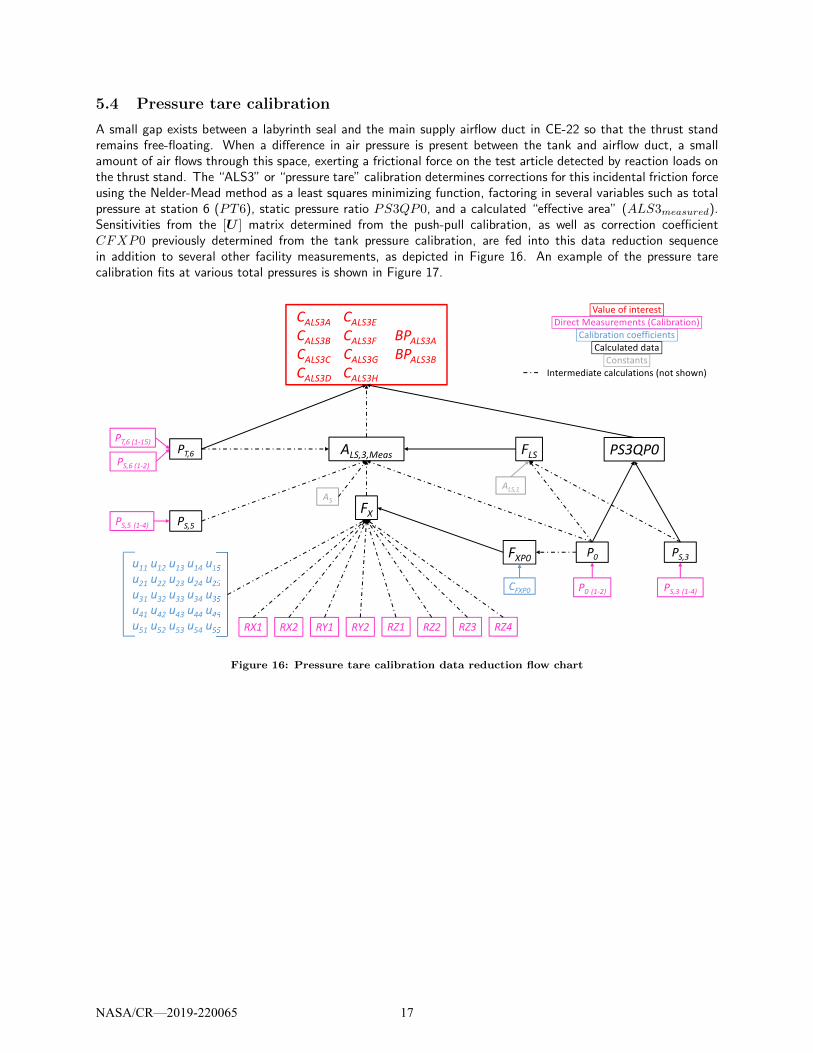
5.4 Pressure tare calibration
A small gap exists between a labyrinth seal and the main supply airflow duct in CE-22 so that the thrust standremains free-floating. When a difference in air pressure is present between the tank and airflow duct, a smallamount of air flows through this space, exerting a frictional force on the test article detected by reaction loads onthe thrust stand. The “ALS3” or “pressure tare” calibration determines corrections for this incidental friction forceusing the Nelder-Mead method as a least squares minimizing function, factoring in several variables such as totalpressure at station 6 (PT6), static pressure ratio PS3QP0, and a calculated “effective area” (ALS3measured).Sensitivities from the [U ] matrix determined from the push-pull calibration, as well as correction coefficientCFXP0 previously determined from the tank pressure calibration, are fed into this data reduction sequencein addition to several other facility measurements, as depicted in Figure 16. An example of the pressure tarecalibration fits at various total pressures is shown in Figure 17.
Figure 16: Pressure tare calibration data reduction flow chart
NASA/CR—2019-220065 17
0 5 10 15 20 25
PS3QP0
-0.5
0
0.5
1
1.5
2
2.5
3
AL
S3
, in
2
Calibration data ALS3M, PT ~ 15psia
Calibration data ALS3M, PT ~ 30psia
Calibration data ALS3M, PT ~ 45psia
ALS3 fit, PT = 15psia
ALS3 fit, PT = 30psia
ALS3 fit, PT = 45 psia
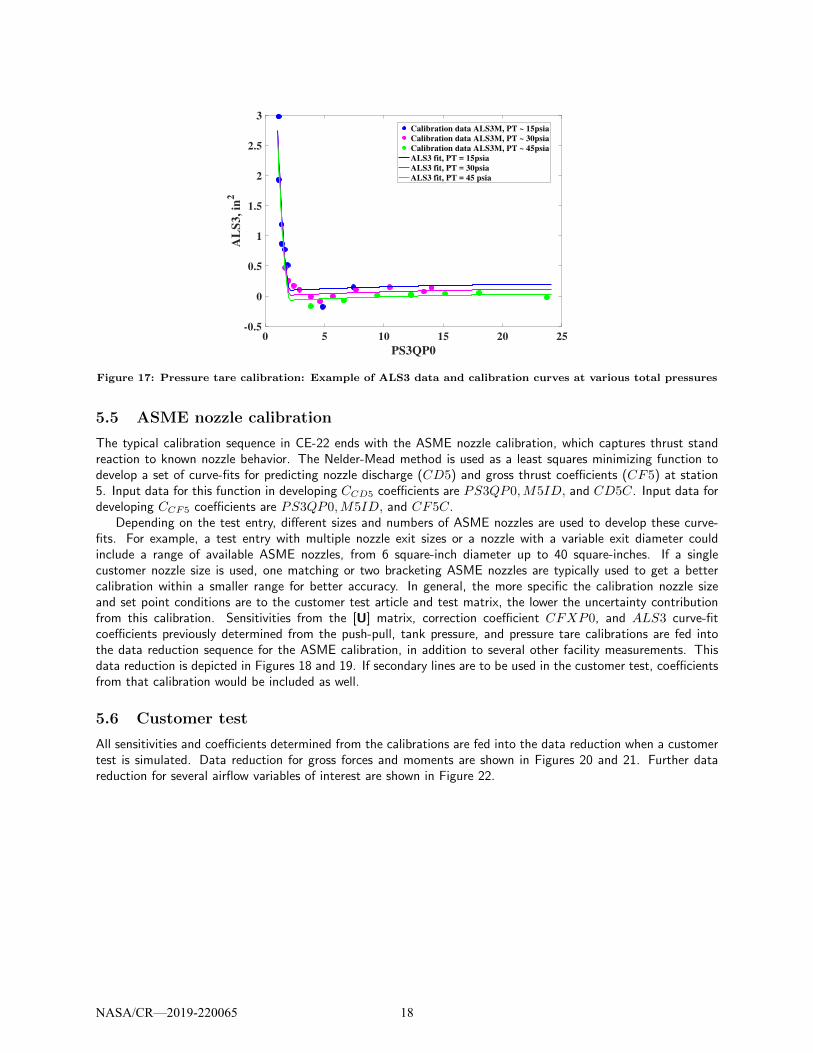
Figure 17: Pressure tare calibration: Example of ALS3 data and calibration curves at various total pressures
5.5 ASME nozzle calibration
The typical calibration sequence in CE-22 ends with the ASME nozzle calibration, which captures thrust standreaction to known nozzle behavior. The Nelder-Mead method is used as a least squares minimizing function todevelop a set of curve-fits for predicting nozzle discharge (CD5) and gross thrust coefficients (CF5) at station5. Input data for this function in developing CCD5 coefficients are PS3QP0,M5ID, and CD5C. Input data fordeveloping CCF5 coefficients are PS3QP0,M5ID, and CF5C.
Depending on the test entry, different sizes and numbers of ASME nozzles are used to develop these curve-fits. For example, a test entry with multiple nozzle exit sizes or a nozzle with a variable exit diameter couldinclude a range of available ASME nozzles, from 6 square-inch diameter up to 40 square-inches. If a singlecustomer nozzle size is used, one matching or two bracketing ASME nozzles are typically used to get a bettercalibration within a smaller range for better accuracy. In general, the more specific the calibration nozzle sizeand set point conditions are to the customer test article and test matrix, the lower the uncertainty contributionfrom this calibration. Sensitivities from the [U] matrix, correction coefficient CFXP0, and ALS3 curve-fitcoefficients previously determined from the push-pull, tank pressure, and pressure tare calibrations are fed intothe data reduction sequence for the ASME calibration, in addition to several other facility measurements. Thisdata reduction is depicted in Figures 18 and 19. If secondary lines are to be used in the customer test, coefficientsfrom that calibration would be included as well.
5.6 Customer test
All sensitivities and coefficients determined from the calibrations are fed into the data reduction when a customertest is simulated. Data reduction for gross forces and moments are shown in Figures 20 and 21. Further datareduction for several airflow variables of interest are shown in Figure 22.
NASA/CR—2019-220065 18
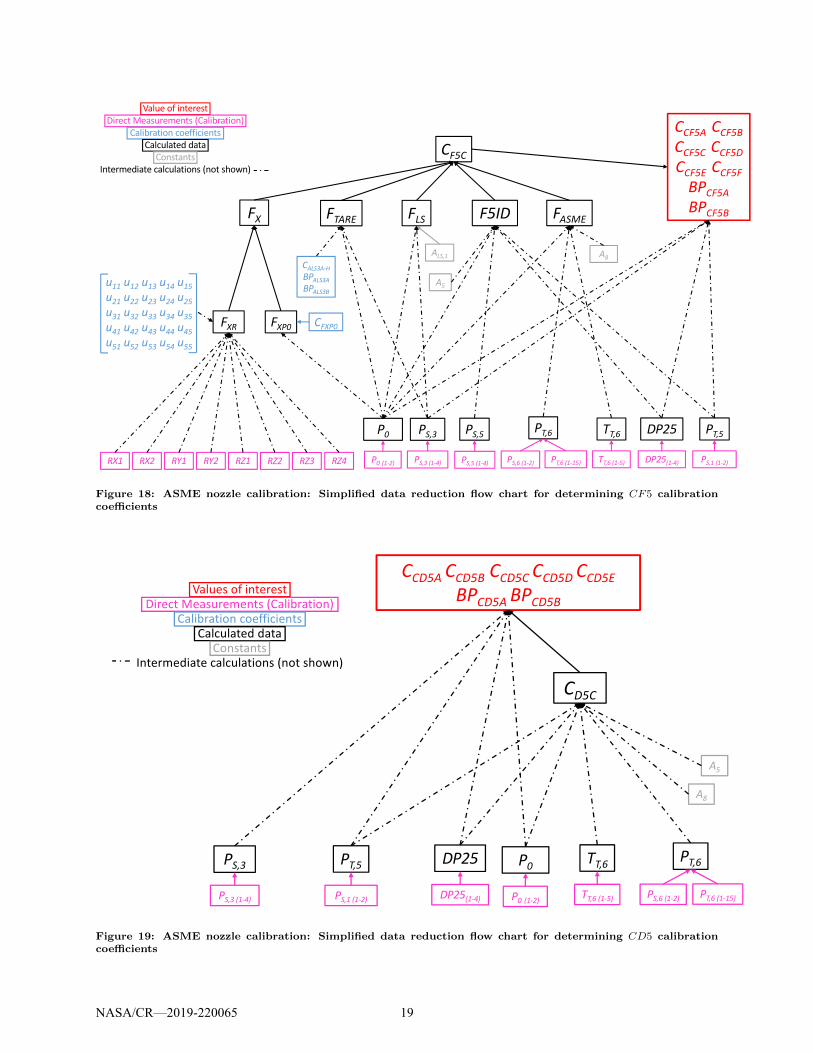
Figure 18: ASME nozzle calibration: Simplified data reduction flow chart for determining CF5 calibrationcoefficients
Figure 19: ASME nozzle calibration: Simplified data reduction flow chart for determining CD5 calibrationcoefficients
NASA/CR—2019-220065 19

Figure 20: Data reduction flow chart for gross force along the x-axis
Figure 21: Data reduction flow chart for gross forces along the y- and z-axes and all gross moments
NASA/CR—2019-220065 20
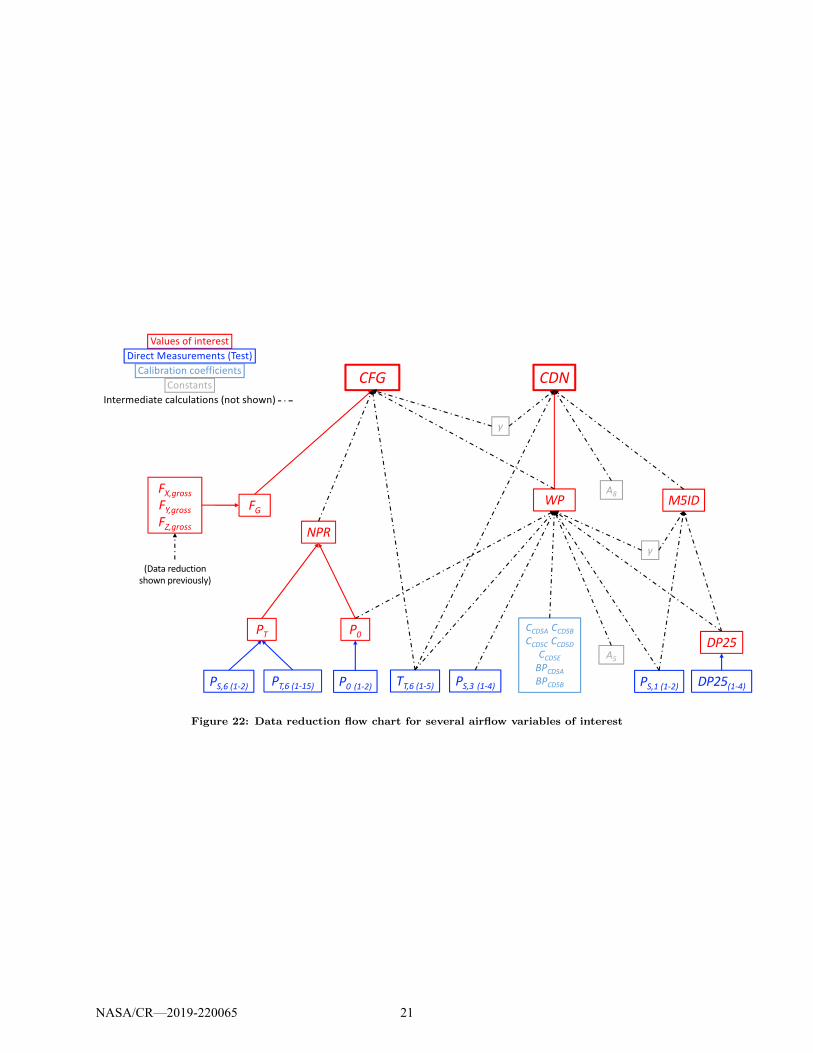
Figure 22: Data reduction flow chart for several airflow variables of interest
NASA/CR—2019-220065 21
6 Uncertainty approach
6.1 General Description
In order to capture systematic uncertainty effects from the calibration sequence referred to in Section 4, anuncertainty propagation approach has been selected to estimate uncertainty in several calculated variables ofinterest. Short term repeatability of various measurements are also estimated and propagated through to variablesof interest to obtain overall uncertainty estimates. (While long term reproducibility is also of interest, data tosupport this type of estimate is not available at this time.)
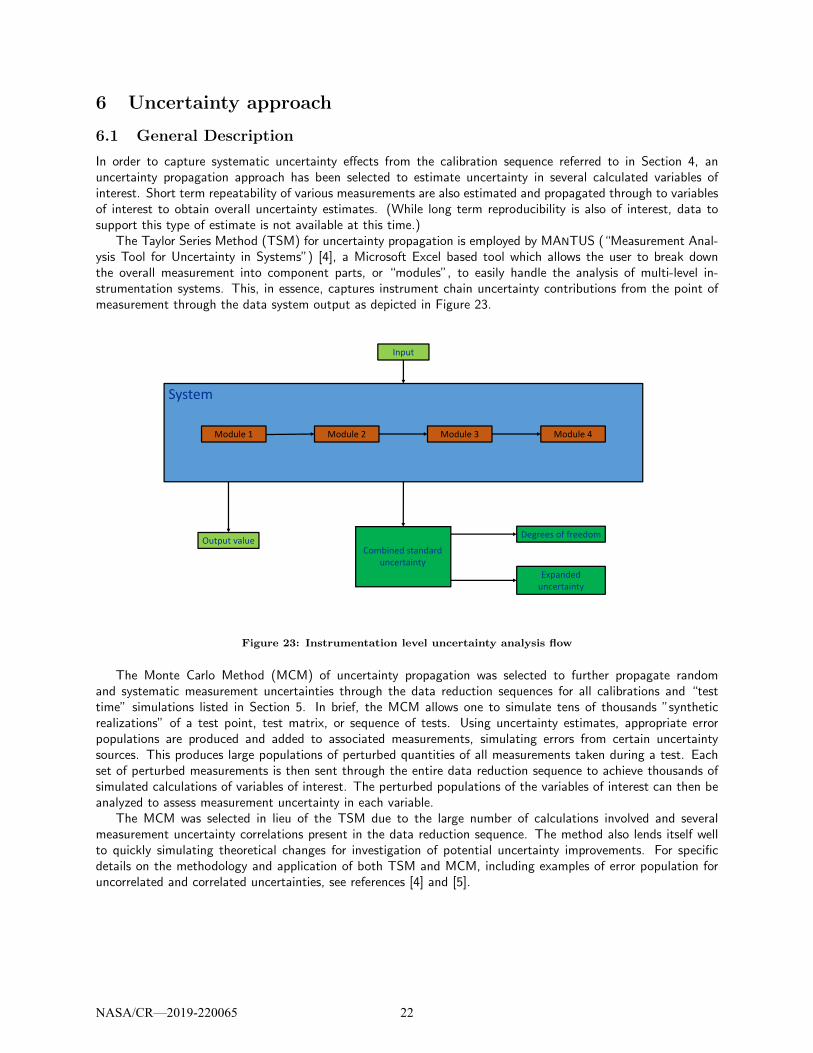
The Taylor Series Method (TSM) for uncertainty propagation is employed by MANTUS (“Measurement Anal-ysis Tool for Uncertainty in Systems”) [4], a Microsoft Excel based tool which allows the user to break downthe overall measurement into component parts, or “modules”, to easily handle the analysis of multi-level in-strumentation systems. This, in essence, captures instrument chain uncertainty contributions from the point ofmeasurement through the data system output as depicted in Figure 23.
System
Module 2 Module 3Module 1 Module 4
Input
Output valueCombined standard
uncertainty
Expanded
uncertainty
Degrees of freedom
Figure 23: Instrumentation level uncertainty analysis flow
The Monte Carlo Method (MCM) of uncertainty propagation was selected to further propagate randomand systematic measurement uncertainties through the data reduction sequences for all calibrations and “testtime” simulations listed in Section 5. In brief, the MCM allows one to simulate tens of thousands ”syntheticrealizations” of a test point, test matrix, or sequence of tests. Using uncertainty estimates, appropriate errorpopulations are produced and added to associated measurements, simulating errors from certain uncertaintysources. This produces large populations of perturbed quantities of all measurements taken during a test. Eachset of perturbed measurements is then sent through the entire data reduction sequence to achieve thousands ofsimulated calculations of variables of interest. The perturbed populations of the variables of interest can then beanalyzed to assess measurement uncertainty in each variable.
The MCM was selected in lieu of the TSM due to the large number of calculations involved and severalmeasurement uncertainty correlations present in the data reduction sequence. The method also lends itself wellto quickly simulating theoretical changes for investigation of potential uncertainty improvements. For specificdetails on the methodology and application of both TSM and MCM, including examples of error population foruncorrelated and correlated uncertainties, see references [4] and [5].
NASA/CR—2019-220065 22

6.2 Elemental standard uncertainty estimates
Using concepts from the ISO Guide to the Expression of Uncertainty in Measurement [6], Coleman and Steele[5] define an elemental standard uncertainty as ”an estimate of the standard deviation of the parent populationfrom which a particular elemental error originates.” All elemental standard uncertainty estimates, sources, andquantities which serve as inputs into the error propagation are detailed in this section (standard, 1-sigma uncer-tainty estimates are presented). Elemental standard uncertainty estimates for measurement x will be denotedas bx and sx, following standard nomenclature for systematic standard and random standard uncertainty cate-gorization, respectively. As best as possible, the Monte Carlo simulation implements error population properlybased on assumed error distributions, uncertainty correlations between measurements, and uncertainty correla-tions between test entries (each calibration is considered a separate test entry since they are separated by severaldays or months). Unless otherwise noted, a normal distribution of errors is assumed for elemental uncertaintiespropagated. Calibration cycles of all instruments involved in the data reduction are considered and accountedfor within the simulations. The specific heat ratio for air, γ, as well as gas constants used in the data reductionscheme are assumed to have negligible uncertainty contributions.
6.2.1 Pressure measurements
Most pressure measurements in CE22 are obtained by ±15psid, 45psid, and 500psid range pressure units withinthe S3200 Electronic Scanning Pressure (ESP) system. All pressures which share a common pressure calibrationunit (PCU) are calibrated to the same reference pressure, and are therefore considered to have fully correlatedsystematic errors for measurements obtained within a calibration cycle. A barometric pressure, Pbar, is alsomeasured by the ESP system which contains systematic uncertainty; the random uncertainty of the barometricpressure unit is considered negligible. Standard uncertainty estimates associated with ESP are listed in Table 4.
Uncertainty Label Standard Uncer-tainty Estimate
Source of Estimate
bPbar 0.00214 psi MANTUSbP,ESP15 See Figure 24 MANTUS
sP,ESP15Airflow offd 0.00054 psi
Short term variability observed[1]Airflow on 0.00067 psi
bP,ESP45 See Figure 25 MANTUS
sP,ESP45Airflow off 0.0039 psi
Short term variability observed[1]Airflow on 0.013 psi
bP,ESP500 See Figure 26 MANTUS
sP,ESP500Airflow off 0.00095 psi
Short term variability observed[1]Airflow on 0.0032 psi
Table 4: Elemental uncertainty estimates for ESP pressure measurements
dSome of the calibrations are performed with facility airflow off, such as the Push-Pull and Tank Pressure calibrations.Variability of measurements changes with airflow on/off conditions.
NASA/CR—2019-220065 23

-15 -10 -5 0 5 10 15
Pressure measurement P, psid
0
1
2
3
4
5
6
7
8
bP,
psi
d
10-3
-10 0 10 20 30 40 50
Pressure measurement P, psid
0
0.005
0.010
0.015
0.020
0.025
bP,
psi
d
Figure 24: Systematic standard uncertainty esti-mate for ±15psid ESP system
Figure 25: Systematic standard uncertainty esti-mate for 45psid ESP system
0 100 200 300 400 500
Pressure measurement P, psid
0
0.05
0.10
0.15
0.20
0.25
bP,
psi
d
Figure 26: Systematic standard uncertainty estimate for 500psid ESP system
There are additionally a set of 1psid, 2psid or 5psid differential pressure transducers installed to measurethe delta pressure between stations 2 and 5 (DP25). Based on the required set points of the test entry, theminimum DP range that can be used to satisfy all test conditions without risking over-ranging the transducers isinstalled. Systematic uncertainties are shown for all DP ranges in Table 5. A correlated and uncorrelated portionof uncertainty is shown for each transducer range; the correlated portion of uncertainty is propagated as a commonerror experienced by all measurements from these instruments, arising from use of a common signal conditioner.Since each transducer is calibrated separately, each also carries an uncorrelated portion of uncertainty. For thisanalysis, the 5psid DP uncertainty is propagated to provide the most conservative estimate of overall uncertaintyin selected variables of interest.
6.2.2 Temperature measurements
Temperature measurements in CE-22 are obtained using bi-metal Type K thermocouples connected to a referenceoven. Like the DP transducers, the thermocouples have both uncorrelated and correlated uncertainty components;the correlated portion results from the shared reference oven. Standard uncertainty estimates for temperaturemeasurements are shown in Table 6.
NASA/CR—2019-220065 24

Uncertainty Label and Description StandardUncertaintyEstimate
Source of Estimate
bDP25
1psidUncorrelated 0.00095 psi
MANTUS
Correlated 0.0003 psi
2psidUncorrelated 0.0020 psiCorrelated 0.00075 psi
5psidUncorrelated 0.0085 psiCorrelated 0.0015 psi
sDP25 (All DP ranges)Airflow off 0.00054 psi
Short term variability observed[1]Airflow on 0.00067 psi
Table 5: Elemental uncertainty estimates for differential pressure measurements (DP25)
Uncertainty Label and Description StandardUncertaintyEstimate
Source of Estimate
bTTUncorrelated 2.8◦R
MANTUSCorrelated 0.45◦R
sTT 0.25◦R Short term variability observed[1]
Table 6: Elemental uncertainty estimates for thermocouple measurements (TT )
6.2.3 Force measurements
The thrust stand uses both ±2,000lbf and ±4,000lbf load cells. While MANTUS quantifies uncertainties associatedwith these instrument measurement systems, the Push-Pull calibration has an extensive test matrix, providingwell-characterized information of the thrust stand behavior as a unit [3]. This is valuable data since mechanicalassemblies have inherent hysteresis and non-linearity characteristics, carrying uncertainties that would be neglectedif only the elemental uncertainties of the load cell measurements are directly propagated. Therefore, instead ofpropagating the systematic standard uncertainty of each individual load cell, data from the Push-Pull calibrationis used to estimate a systematic standard uncertainty for each combination of reaction loads that was used todevelop the thrust stand sensitivities.
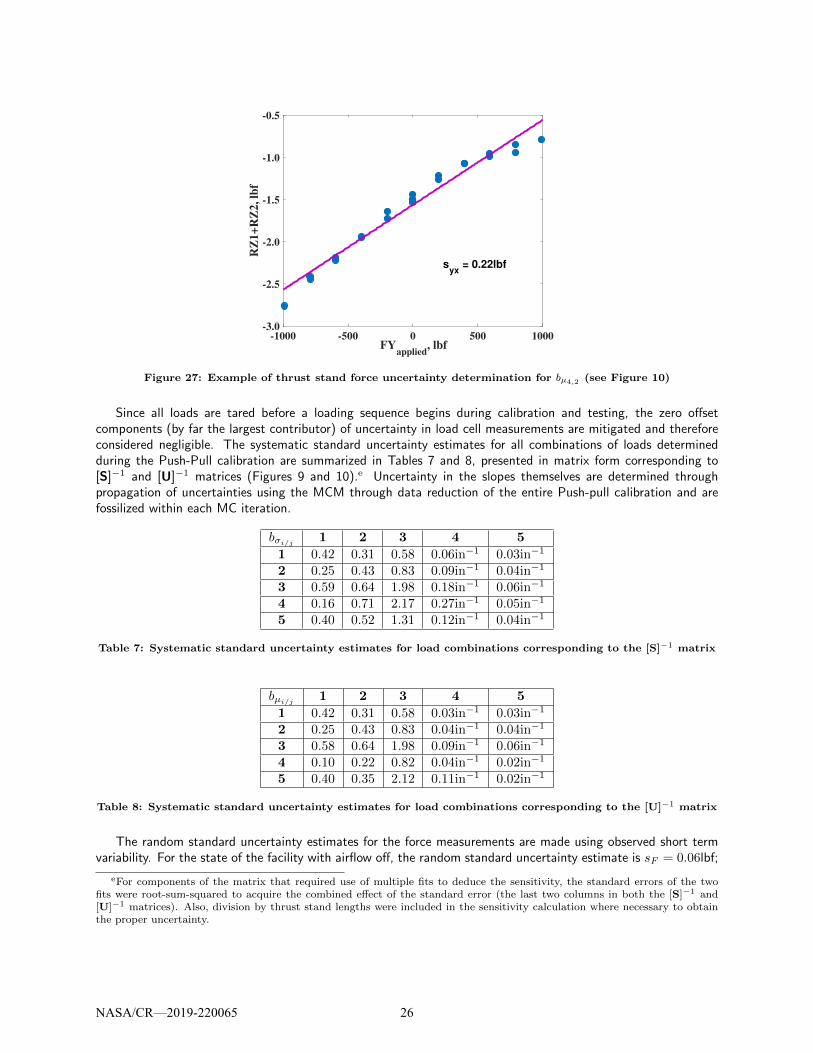
Figure 27 shows an example of data obtained from one loading sequence from the Push-Pull calibration testmatrix. This particular data set shows the combination of reaction loads RZ1 + RZ2 to the applied calibrationload FYapplied = CY 1 + CY 2 (see Figure 7 for load cell locations). The standard uncertainty estimate for thecombination of reaction loads is obtained by evaluating the standard error of the estimate, syx, using residualsfrom the linear least squares fit with Equation 1
syx =
√∑ki=1 (yi − yi)2
vsyx
(1)
where k is the number of (xi, yi) data pairs used to create the curve-fit, v represents the degrees of freedom insyx (for polynomials of fit order m, vsyx
= k − (m + 1)), and yi is the predicted value at xi [7]. This standarduncertainty estimate is essentially the standard deviation of the residuals from the fit, and propagating thisstandard uncertainty captures the variation in the force result predicted by the curve-fit. Uncertainty associatedwith the prediction of thrust stand forces as their combined effect is denoted bPPsyx within this document.
NASA/CR—2019-220065 25
-1000 -500 0 500 1000FY
applied, lbf
-3.0
-2.5
-2.0
-1.5
-1.0
-0.5
RZ
1+
RZ
2, lb
fs
yx = 0.22lbf
Figure 27: Example of thrust stand force uncertainty determination for bµ4,2 (see Figure 10)
Since all loads are tared before a loading sequence begins during calibration and testing, the zero offsetcomponents (by far the largest contributor) of uncertainty in load cell measurements are mitigated and thereforeconsidered negligible. The systematic standard uncertainty estimates for all combinations of loads determinedduring the Push-Pull calibration are summarized in Tables 7 and 8, presented in matrix form corresponding to[S]−1 and [U]−1 matrices (Figures 9 and 10).e Uncertainty in the slopes themselves are determined throughpropagation of uncertainties using the MCM through data reduction of the entire Push-pull calibration and arefossilized within each MC iteration.
bσi/j1 2 3 4 5
1 0.42 0.31 0.58 0.06in−1 0.03in−1
2 0.25 0.43 0.83 0.09in−1 0.04in−1
3 0.59 0.64 1.98 0.18in−1 0.06in−1
4 0.16 0.71 2.17 0.27in−1 0.05in−1
5 0.40 0.52 1.31 0.12in−1 0.04in−1
Table 7: Systematic standard uncertainty estimates for load combinations corresponding to the [S]−1 matrix
bµi/j1 2 3 4 5
1 0.42 0.31 0.58 0.03in−1 0.03in−1
2 0.25 0.43 0.83 0.04in−1 0.04in−1
3 0.58 0.64 1.98 0.09in−1 0.06in−1
4 0.10 0.22 0.82 0.04in−1 0.02in−1
5 0.40 0.35 2.12 0.11in−1 0.02in−1
Table 8: Systematic standard uncertainty estimates for load combinations corresponding to the [U]−1 matrix
The random standard uncertainty estimates for the force measurements are made using observed short termvariability. For the state of the facility with airflow off, the random standard uncertainty estimate is sF = 0.06lbf;
eFor components of the matrix that required use of multiple fits to deduce the sensitivity, the standard errors of the twofits were root-sum-squared to acquire the combined effect of the standard error (the last two columns in both the [S]−1 and[U]−1 matrices). Also, division by thrust stand lengths were included in the sensitivity calculation where necessary to obtainthe proper uncertainty.
NASA/CR—2019-220065 26

for airflow on conditions, the estimate is sF = 1.58lbf [1].f The airflow on condition variability is presumed to behigher due to the dynamic response of the thrust stand to the airflow.
6.2.4 Lengths and Areas
Other elemental uncertainty estimates that are propagated in this analysis include systematic uncertainties fromdistance measurements on the thrust stand (used primarily in the data reduction to calculate moments aboutthe X-, Y-, and Z-axes) and on diameters of facility ducts and test articles (used to determine critical areaswhich directly impact airflow related calculations). Table 9 shows the systematic standard uncertainty estimatespropagated in the analysis and the sources of the estimates. Random uncertainty is assumed to be negligible forall of these measurements.g
Uncertainty Label and Description StandardUncertaintyEstimate
Source of Es-timate
bL 0.005inFacility printsbA5
h 0.067in2
bALS1i 0.234in2
bA8,ASME
6in2 nozzle 0.0012in2
Calibration lab15in2 nozzle 0.0019in2
24in2 nozzle 0.0024in2
30in2 nozzle 0.0027in2
40in2 nozzle 0.0031in2
Table 9: Elemental systematic standard uncertainty estimates for lengths and areas
6.2.5 Regression Uncertainty
There are two aspects of uncertainty that need to be considered when dealing with regressions as part of the datareduction scheme. The first is the uncertainty that is fossilized within the calibration curve itself, which resultsfrom errors (random and systematic) that are present within the data set used to form the regression in the firstplace. These errors impact the regression curve in a systematic nature and are categorized as such. A MonteCarlo simulation of the calibration test through production of the regression equation, including propagation of alluncertainties involved, captures the uncertainty of the regression curve itself and represents how much the entirecurve-fit varies due to uncertainties present during the calibration test. (This is synonymous with the confidenceinterval of the regression fit. The TSM of this aspect of regression uncertainty is presented in Reference [5].)
The second aspect to be considered is the ability of the regression to predict a future value. This aspect ofthe estimate considers how well the data is characterized by the calibration curve, and provides an estimate ofthe uncertainty in the value predicted by the fit. This includes amount of random variability around the fit andgoodness-of-fit of the regression. By analyzing residuals, uncertainty estimates can be made to capture this aspectof uncertainty which is applied to a variable each time the curve is used to predict its value. When analyzingresiduals of a regression fit, it is typically fairly obvious by visual inspection whether the residuals are random innature (this can also be confirmed by statistical analysis) or if they are more systematic in nature (for example, if theactual response is a second-order behavior yet a first-order fit was selected). This distinction impacts uncertaintycategorization and the nature of the error distribution; the important thing to note is that propagation through
fUncertainty estimates made from random variation observations noted in reference [1] are deduced from ten back-to-backsamples taken at 1Hz. These are short term observations and are not expected to capture long term variation. Standarddeviations reported in the noted reference are divided by the square root of ten to reflect the expected variation of the mean often samples used to represent a steady state data point. σx = σx/
√10
gThese uncertainty estimates are based on drawing specifications and calibration lab quotes; it is assumed the quality controlof the measurements used to confirm specifications were repeatable to a negligible level.
hUncertainties in A5 and A8 are displayed in this chart as ”elemental” uncertainties but were in fact propagated fromuncertainty in the diameters.
iWhile the standard uncertainty in ALS1 is quoted here and formally propagated, the error term cancels out when datareduction is followed, resulting in no impact on any uncertainties of interest.
NASA/CR—2019-220065 27

the regression alone will not inherently account for this second aspect of regression uncertainty. This uncertaintymust be explicitly evaluated and propagated. This ”uncertainty in the prediction” is needed in addition to thefossilized uncertainty of the regression curve itself for proper evaluation of uncertainty of a future single data pointpredicted by the curve.
Elemental measurement uncertainties were propagated via Monte Carlo for each calibration test performed inCE-22 to develop the confidence interval for all curve-fits determined. Uncertainty estimates for the predictivequality of each regression fit were also made. For the Tank Pressure and Secondary Line calibrations, Equation1 was used for each calibration curve developed to obtain an uncertainty estimate for the value predicted bythe linear fit, the combined uncertainty from each denoted by sP0syx and sSECsyx. These standard uncertaintyestimates can be found in Tables 10 and 11, and are categorized as random uncertainties.
Uncertainty label Standard uncertainty estimatesFXP0 1.0 lbfsFY P0 0.6 lbfsFZP0 2.2 lbfsMXP0 23.3 lbf-insMY P0 2.9 lbf-insMZP0 5.2 lbf-in
Table 10: Uncertainties associated with predicting values from Tank Pressure (P0) linear calibration fits
Uncertainty label Standard uncertainty estimatesFXP302 0.2 lbfsFY P302 0.3 lbfsFZP302 0.2 lbfsMXP302 3.7 lbf-insMY P302 3.1 lbf-insMZP302 4.6 lbf-insFXP303 0.2 lbfsFY P303 0.1 lbfsFZP303 0.7 lbfsMXP303 11.8 lbf-insMY P303 22.1 lbf-insMZP303 2.6 lbf-in
Table 11: Uncertainties associated with predicting values from Secondary Line linear calibration fits
For the ALS3 (Pressure Tare) and ASME calibrations, the residuals were studied and representative uncertaintybands selected to estimate appropriate standard uncertainty intervals, denoted sALS3syx and bASMEsyx. Thismethod was selected in lieu of using Equation 1 because variability was not constant along the range of theseparticular fits. The standard and expanded uncertainty estimates for the regression performed for the ALS3correction is shown in Figure 28; the standard uncertainty estimate is categorized as random, and is defined by
sALS3syx =0.5
PS3QP0[in2] (2)
where PS3QP0 is the pressure ratio of PS3/P0. An example of an error population that was created using thisestimate for a single Monte Carlo iteration of the ALS3 test simulation is shown in Figure 29. The simulated errorpopulation compares favorably to the actual fit errors.
NASA/CR—2019-220065 28

Figure 28: ALS3 calibration/correctionresiduals and sALS3syx uncertainty estimate
Figure 29: Example of synthetic error pop-ulation produced by sALS3syx from a singleMC iteration when fit is used to predictALS3 values
The standard and expanded uncertainty estimates for predictions of CD5 and CF5 from the ASME calibrationare driven by the specific calibration performed pre-customer test. Due to the large variety of possible nozzle sizesand test conditions within individual test programs (along with the facility standard procedure to cater the ASMEcalibration accordingly), results for uncertainty estimates from this calibration are not generalized in this report.An example is presented in Section 7.5 showing results that can be generated post-ASME calibration. Note thatestimates given in the example for this uncertainty source are not to be generalized, as they vary widely based onthe specific calibration and test conditions.
6.3 Summary of uncertainty inputs
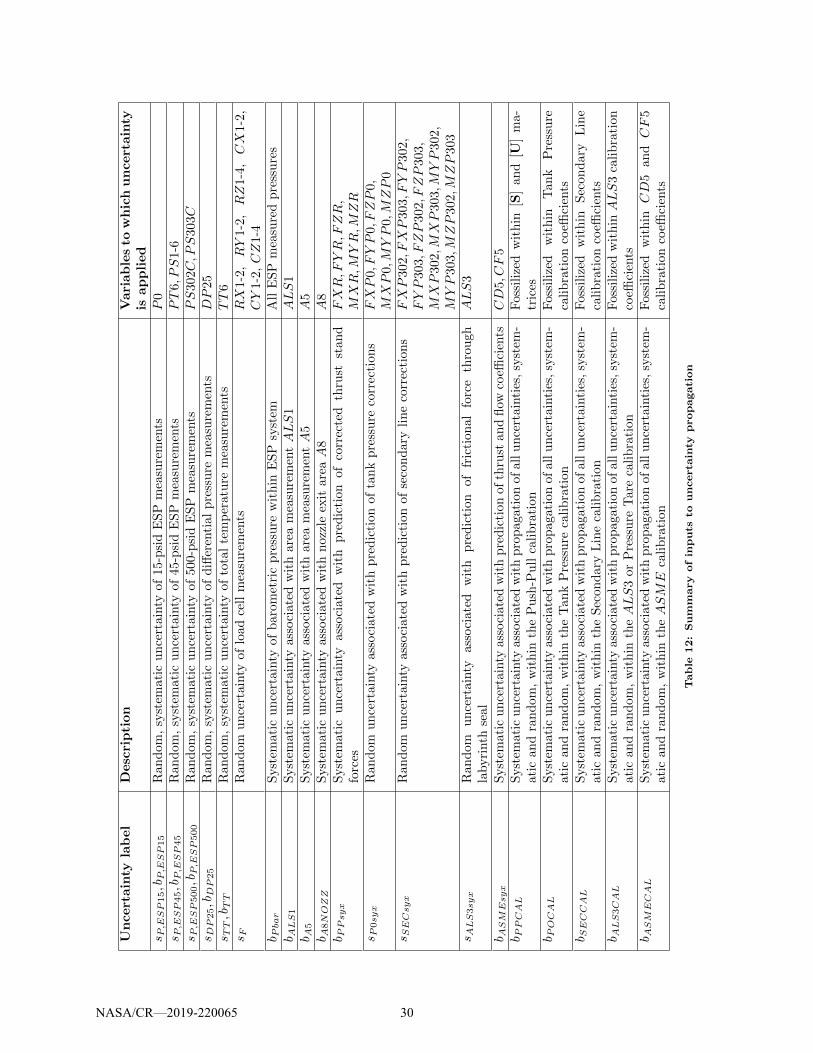
As a detailed uncertainty analysis is updated and refined, it is important to have a handle on what uncertaintieshave been estimated and propagated so that updates and changes can easily be made. Table 12 summarizes theuncertainties (detailed previously in this chapter) that were propagated and the nomenclature associated withthe estimates within this report so that in the results section, these uncertainty sources can be identified. Manyuncertainties of specific measurements and variables were grouped in the propagation code in order to expediterun time.
NASA/CR—2019-220065 29
Uncertainty
label
Description
Variablesto
whichuncertainty
isapplied
s P,ESP15,bP,ESP15
Ran
dom
,sy
stem
atic
un
cert
ainty
of15
-psi
dE
SP
mea
sure
men
tsP
0s P,ESP45,bP,ESP45
Ran
dom
,sy
stem
atic
un
cert
ainty
of45
-psi
dE
SP
mea
sure
men
tsPT
6,PS
1-6
s P,ESP500,bP,ESP500
Ran
dom
,sy
stem
atic
un
cert
ainty
of50
0-p
sid
ES
Pm
easu
rem
ents
PS
302C,PS
303C
s DP25,bDP25
Ran
dom
,sy
stem
atic
un
cert
ainty
ofd
iffer
enti
alp
ress
ure
mea
sure
men
tsDP
25s TT,bTT
Ran
dom
,sy
stem
atic
un
cert
ainty
ofto
tal
tem
per
atu
rem
easu
rem
ents
TT
6s F
Ran
dom
un
cert
ainty
oflo
adce
llm
easu
rem
ents
RX
1-2,
RY
1-2,
RZ
1-4,CX
1-2
,CY
1-2,CZ
1-4
b Pbar
Syst
emat
icu
nce
rtai
nty
ofb
arom
etri
cp
ress
ure
wit
hin
ES
Psy
stem
All
ES
Pm
easu
red
pre
ssu
res
b ALS1
Syst
emat
icu
nce
rtai
nty
asso
ciat
edw
ith
area
mea
sure
men
tALS
1ALS
1b A
5S
yst
emat
icu
nce
rtai
nty
asso
ciat
edw
ith
area
mea
sure
men
tA
5A
5b A
8NOZZ
Syst
emat
icu
nce
rtai
nty
asso
ciat
edw
ith
noz
zle
exit
areaA
8A
8b PPsyx
Syst
emat
icu
nce
rtai
nty
asso
ciat
edw
ith
pre
dic
tion
ofco
rrec
ted
thru
stst
and
forc
esFXR,FYR,FZR
,MXR,M
YR,M
ZR
s P0syx
Ran
dom
un
cert
ainty
asso
ciat
edw
ith
pre
dic
tion
ofta
nk
pre
ssu
reco
rrec
tion
sFXP
0,FYP
0,FZP
0,MXP
0,MYP
0,MZP
0s SECsyx
Ran
dom
un
cert
ainty
asso
ciat
edw
ith
pre
dic
tion
ofse
con
dar
yli
ne
corr
ecti
ons
FXP
302,FXP
303,FYP
302,
FYP
303,FZP
302,FZP
303,
MXP
302,MXP
303,MYP
302,
MYP
303,MZP
302,MZP
303
s ALS3syx
Ran
dom
un
cert
ainty
asso
ciat
edw
ith
pre
dic
tion
offr
icti
onal
forc
eth
rou
ghla
byri
nth
seal
ALS
3
b ASMEsyx
Syst
emat
icu
nce
rtai
nty
asso
ciat
edw
ith
pre
dic
tion
ofth
rust
and
flow
coeffi
cien
tsCD
5,CF
5b PPCAL
Syst
emat
icu
nce
rtai
nty
asso
ciat
edw
ith
pro
pag
atio
nof
allu
nce
rtai
nti
es,sy
stem
-at
ican
dra
nd
om,
wit
hin
the
Pu
sh-P
ull
cali
bra
tion
Fos
sili
zed
wit
hin
[S]
and
[U]
ma-
tric
esb POCAL
Syst
emat
icu
nce
rtai
nty
asso
ciat
edw
ith
pro
pag
atio
nof
allu
nce
rtai
nti
es,sy
stem
-at
ican
dra
nd
om,
wit
hin
the
Tan
kP
ress
ure
cali
bra
tion
Fos
sili
zed
wit
hin
Tan
kP
ress
ure
cali
bra
tion
coeffi
cien
tsb SECCAL
Syst
emat
icu
nce
rtai
nty
asso
ciat
edw
ith
pro
pag
atio
nof
allu
nce
rtai
nti
es,sy
stem
-at
ican
dra
nd
om,
wit
hin
the
Sec
ond
ary
Lin
eca
lib
rati
onF
ossi
lize
dw
ith
inS
econ
dary
Lin
eca
lib
rati
onco
effici
ents
b ALS3CAL
Syst
emat
icu
nce
rtai
nty
asso
ciat
edw
ith
pro
pag
atio
nof
allu
nce
rtai
nti
es,sy
stem
-at
ican
dra
nd
om,
wit
hin
theALS
3or
Pre
ssu
reT
are
cali
bra
tion
Fos
sili
zed
wit
hinALS
3ca
lib
rati
on
coeffi
cien
tsb ASMECAL
Syst
emat
icu
nce
rtai
nty
asso
ciat
edw
ith
pro
pag
atio
nof
allu
nce
rtai
nti
es,sy
stem
-at
ican
dra
nd
om,
wit
hin
theASME
cali
bra
tion
Fos
sili
zed
wit
hin
CD
5an
dCF
5ca
lib
rati
onco
effici
ents
Tab
le12:
Su
mm
ary
of
inp
uts
tou
ncerta
inty
prop
agati
on
NASA/CR—2019-220065 30

7 Results
Depending on the test being performed, researchers and customers are often interested in different aspects ofuncertainty. For example, customers refining a design element by comparing multiple test entry results with oneanother are primarily concerned with random uncertainty (or repeatability) and its effect on the results, whereasa systematic bias may be less consequential to the study at hand. However, customers seeking to confirm a CFDmodel with test results may be very concerned with systematic uncertainty effects. For this reason, combined(overall, all inclusive) uncertainty results are presented by variable of interest, and are also broken down intotheir random and systematic components. Further breakdowns by uncertainty percent contribution (UPC) areperformed for the random uncertainty results for each variable of interest.j
Uncertainty results are produced by running a system of Monte Carlo simulations of the entire calibrationsequence in addition to a ”test-time” simulation, representative of a customer test. Uncertainty results coveringa majority of the facility’s rangekwill be presented in this section with the exception of the following variables:WP,FXG,FG,CFG and CDN . Calculations of these variables occur ”downstream” of the ASME calibration,to which they are highly sensitive. For these listed variables, example results are shown in Section 7.5 forone specific ASME calibration and customer test sequence. It is standard facility practice to provide a specificcalibration for each test entry, catered to match or bracket conditions designed for that customer’s test. Becausethey are so very specific, uncertainty results for these variables should not be extrapolated or assumed to applyto all facility conditions or nozzle sizes. Uncertainty estimates for these critical variables will be made available tocustomers once the ASME calibration that is specifically catered to their test is complete. Pre-test entry estimatescan be provided upon request if data and information are available to support the request.
All uncertainty results are presented as expanded uncertainties, denoted by Sx, Bx, and Ux for random,systematic, and combined uncertainty respectively, and are presented with a 95% level of confidence.
7.1 P0, PT , DP25, NPR: Critical facility calculations
7.1.1 Random Uncertainty
Critical facility pressure calculations have expanded random uncertainties presented in Table 13. Propagatedestimates for variation in the 5-psid Sensotec differential measurements, 15-psid ESP measurements, and 45-psid ESP measurements are the sole contributors to uncertainty in calculated values for DP25, P0 and PT ,respectively. Figure 30 shows the dimensional expanded random uncertainty estimate for NPR (PT = 45psia)and the UPC of contributing uncertainty sources to NPR.
Variable x Random uncertainty, Sx, psiDP25 8.0x10⁻⁴
P0 9.4x10⁻⁴
PT 7.2x10⁻³
Table 13: Expanded random uncertainty in critical facility pressures P0,PT , and DP25
jUncertainty percent contribution for systematic uncertainty results are unable to be obtained for this analysis due tosome non-Gaussian distributions of results of individually propagated uncertainty sources. These non-Gaussian distributionswere brought about by the data reduction sequence; when all systematic sources are propagated together, a near-Gaussiandistribution is achieved so an appropriate symmetric uncertainty quote and coverage factor can be used.
kLower altitude conditions (below 40psia) were not included in this analysis.
NASA/CR—2019-220065 31

2 4 6 8 10 12 14 16 18 20 220
0.005
0.010
0.015
SN
PR
Expanded random uncertainty in NPRS
NPR total
from SP,ESP15
from SP,ESP45
2 4 6 8 10 12 14 16 18 20 22
NPR
0
20
40
60
80
100
% u
nc
NP
R
from SP,ESP15
from SP,ESP45
Figure 30: Expanded random uncertainty and UPC contributing to SNPR for PT = 45psia
7.1.2 Systematic and Combined uncertainty
Figure 31 shows the combined, random, and systematic uncertainty for calculated values DP25, P0, PT , andNPR. Note that the systematic portion of uncertainty greatly drives the combined uncertainty, as they lie on topof each other in several figures. Figure 32 shows how the uncertainty in NPR changes with the total pressure.
0 5 10 15 20
P0, psia
0
0.005
0.010
0.015
UP
0,
psi
Expanded uncertainty of P0
Random
Systematic
Combined
10 20 30 40 50
PT, psia
0
0.01
0.02
0.03
0.04
UP
T,
psi
Expanded uncertainty of PT
0 5 10 15 20 25
NPR
0
0.05
0.10
0.15
UN
PR
Expanded uncertainty of NPR
0 1 2 3 4
DP25, psid
0
0.005
0.010
UD
P25,
psi
Expanded uncertainty of DP25
Figure 31: Expanded combined uncertainty for P0, PT , DP25, and NPR (UNPR shown for PT = 45psia)
NASA/CR—2019-220065 32

0 5 10 15 20 25
NPR
0
0.05
0.1
0.15
0.2
0.25
0.3
0.35
0.4
0.45
0.5
UN
PR
Expanded uncertainty in NPR for various PT settings
PT = 15psia
PT = 20psia
PT = 25psia
PT = 30psia
PT = 35psia
PT = 40psia
PT = 45psia
Figure 32: Expanded combined uncertainty in NPR for various PT settings
7.2 M5ID: Ideal Mach number at station 5
7.2.1 Random uncertainty
Table 14 shows the expanded random uncertainty of M5ID (ideal Mach number at station 5) for nozzle areas6-24in2 and Figure 33 shows the UPC of contributing elemental random uncertainties for each. Figure 34 showsdimensional random uncertainty contributions as well as the UPC for the 40in2 nozzle.
Nozzle area A8, in2 SM5ID
6 2.2x10⁻⁴
15 8.4x10⁻⁵
24 6.9x10⁻⁵
Table 14: Expanded random uncertainty in M5ID for various nozzle sizes (estimates valid across all NPR)
NASA/CR—2019-220065 33

UPC for random uncertainties
contributing to sM5ID
A8 = 6in2
100%
UPC for random uncertainties
contributing to sM5ID
A8 = 15in2
5%
95%
UPC for random uncertainties
contributing to sM5ID
A8 = 24in2
24%
76%
from SP,ESP45
from SDP25
Figure 33: Random UPC contributing to SM5ID for various nozzle sizes
1 1.2 1.4 1.6 1.8 2 2.20
0.5
1
1.5
2
SM
5ID
10-4 Expanded random uncertainty in M5ID for A8 = 40in
2
SM5ID
total
from SP,ESP45
from SDP25
1 1.2 1.4 1.6 1.8 2 2.2
NPR
0
20
40
60
80
100
% u
nc
M5
ID
from SP,ESP45
from SDP25
Figure 34: Expanded random uncertainty and UPC contributing to SM5ID for 40in2 nozzle
7.2.2 Systematic uncertainty
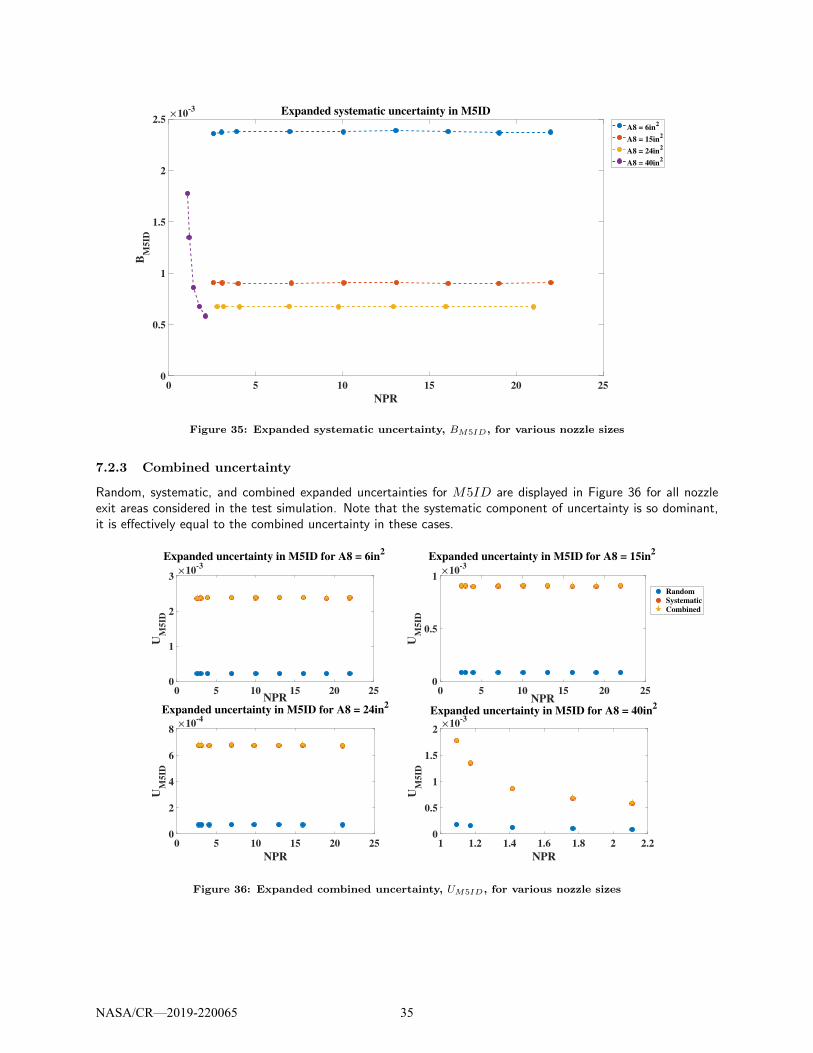
Expanded systematic uncertainty results for M5ID for several simulated nozzle exit areas are shown in Figure 35.
NASA/CR—2019-220065 34
0 5 10 15 20 25
NPR
0
0.5
1
1.5
2
2.5
BM
5ID
10-3 Expanded systematic uncertainty in M5ID
A8 = 6in2
A8 = 15in2
A8 = 24in2
A8 = 40in2
Figure 35: Expanded systematic uncertainty, BM5ID, for various nozzle sizes
7.2.3 Combined uncertainty
Random, systematic, and combined expanded uncertainties for M5ID are displayed in Figure 36 for all nozzleexit areas considered in the test simulation. Note that the systematic component of uncertainty is so dominant,it is effectively equal to the combined uncertainty in these cases.
0 5 10 15 20 25NPR
0
1
2
3
UM
5ID
10-3
Expanded uncertainty in M5ID for A8 = 6in2
0 5 10 15 20 25NPR
0
0.5
1
UM
5ID
10-3
Expanded uncertainty in M5ID for A8 = 15in2
Random
Systematic
Combined
0 5 10 15 20 25
NPR
0
2
4
6
8
UM
5ID
10-4
Expanded uncertainty in M5ID for A8 = 24in2
1 1.2 1.4 1.6 1.8 2 2.2
NPR
0
0.5
1
1.5
2
UM
5ID
10-3
Expanded uncertainty in M5ID for A8 = 40in2
Figure 36: Expanded combined uncertainty, UM5ID, for various nozzle sizes
NASA/CR—2019-220065 35
7.3 FGY , FGZ, MX, MY , MZ: Gross forces and moments
7.3.1 Random uncertainty
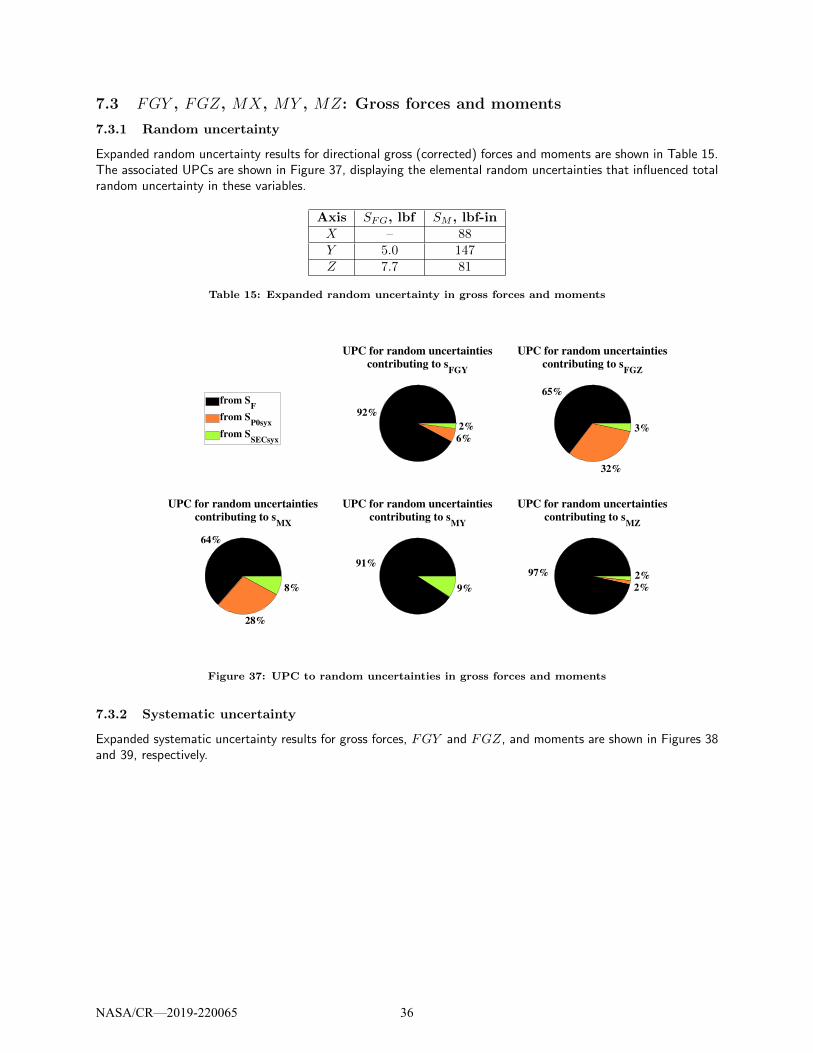
Expanded random uncertainty results for directional gross (corrected) forces and moments are shown in Table 15.The associated UPCs are shown in Figure 37, displaying the elemental random uncertainties that influenced totalrandom uncertainty in these variables.
Axis SFG, lbf SM , lbf-inX – 88Y 5.0 147Z 7.7 81
Table 15: Expanded random uncertainty in gross forces and moments
UPC for random uncertainties
contributing to sFGY
92%
6%
2%
from SF
from SP0syx
from SSECsyx
UPC for random uncertainties
contributing to sFGZ
65%
32%
3%
UPC for random uncertainties
contributing to sMX
64%
28%
8%
UPC for random uncertainties
contributing to sMY
91%
9%
UPC for random uncertainties
contributing to sMZ
97%
2%
2%
Figure 37: UPC to random uncertainties in gross forces and moments
7.3.2 Systematic uncertainty
Expanded systematic uncertainty results for gross forces, FGY and FGZ, and moments are shown in Figures 38and 39, respectively.
NASA/CR—2019-220065 36

0 2 4 6 8 10 12 14 16
DP0, psi
0
1
2
3
4
5
6
BF
, lb
f
Expanded systematic uncertainty in forcesFGY
FGZ
Figure 38: Expanded systematic uncertainty in directional gross forces FGY and FGZ
0 2 4 6 8 10 12 14 16
DP0, psi
0
1
2
3
4
5
6
7
8
9
10
BM
, lb
f-in
Expanded systematic uncertainty in momentsMX
MY
MZ
Figure 39: Expanded systematic uncertainty in moments
7.3.3 Combined uncertainty
Random, systematic, and combined expanded uncertainties for gross forces, FGY and FGZ, and moments areshown in Figures 40 and 41, respectively. Note that for moments, the random component of uncertainty is sodominant, it is effectively equal to the combined uncertainty for these variables.
NASA/CR—2019-220065 37
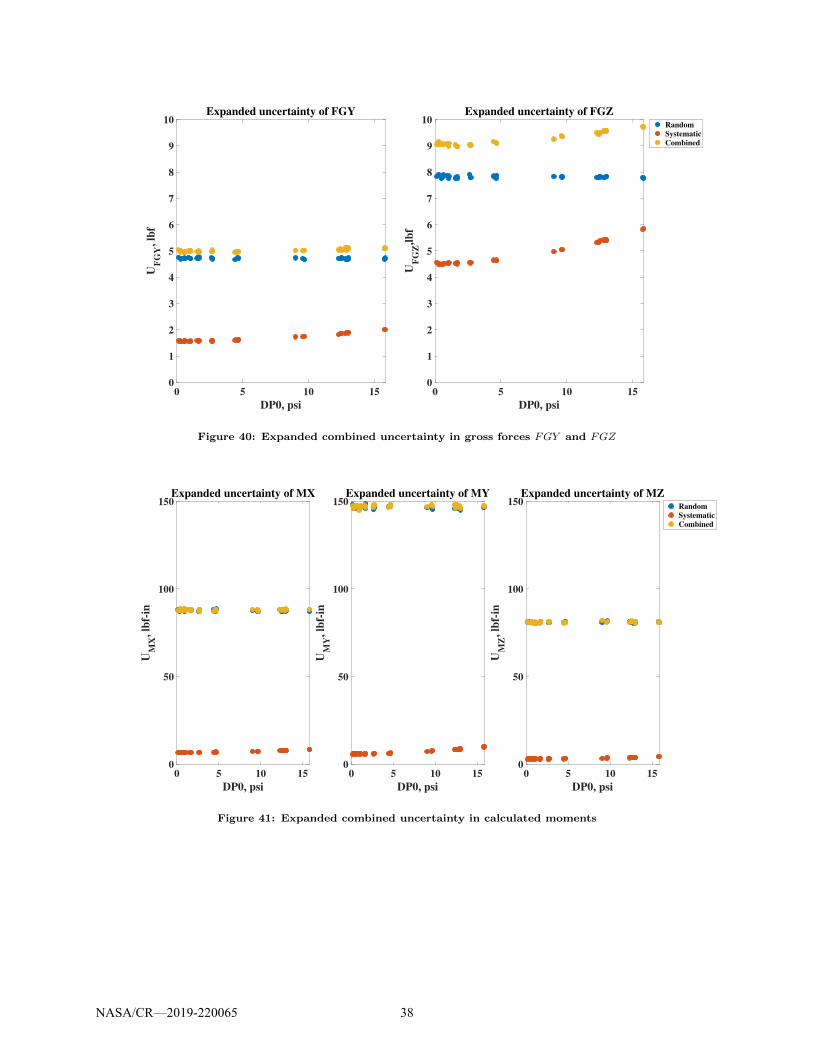
0 5 10 15
DP0, psi
0
1
2
3
4
5
6
7
8
9
10
UF
GY
, lb
f
Expanded uncertainty of FGY
0 5 10 15
DP0, psi
0
1
2
3
4
5
6
7
8
9
10
UF
GZ
,lb
f
Expanded uncertainty of FGZRandom
Systematic
Combined
Figure 40: Expanded combined uncertainty in gross forces FGY and FGZ
0 5 10 15
DP0, psi
0
50
100
150
UM
X,
lbf-
in
Expanded uncertainty of MX
0 5 10 15
DP0, psi
0
50
100
150
UM
Y,
lbf-
in
Expanded uncertainty of MY
0 5 10 15
DP0, psi
0
50
100
150U
MZ
, lb
f-in
Expanded uncertainty of MZRandom
Systematic
Combined
Figure 41: Expanded combined uncertainty in calculated moments
NASA/CR—2019-220065 38

Figure 42: Tabulated results for expanded random, systematic and combined uncertainty in FGY, FGZ,MX,MYand MZ
NASA/CR—2019-220065 39
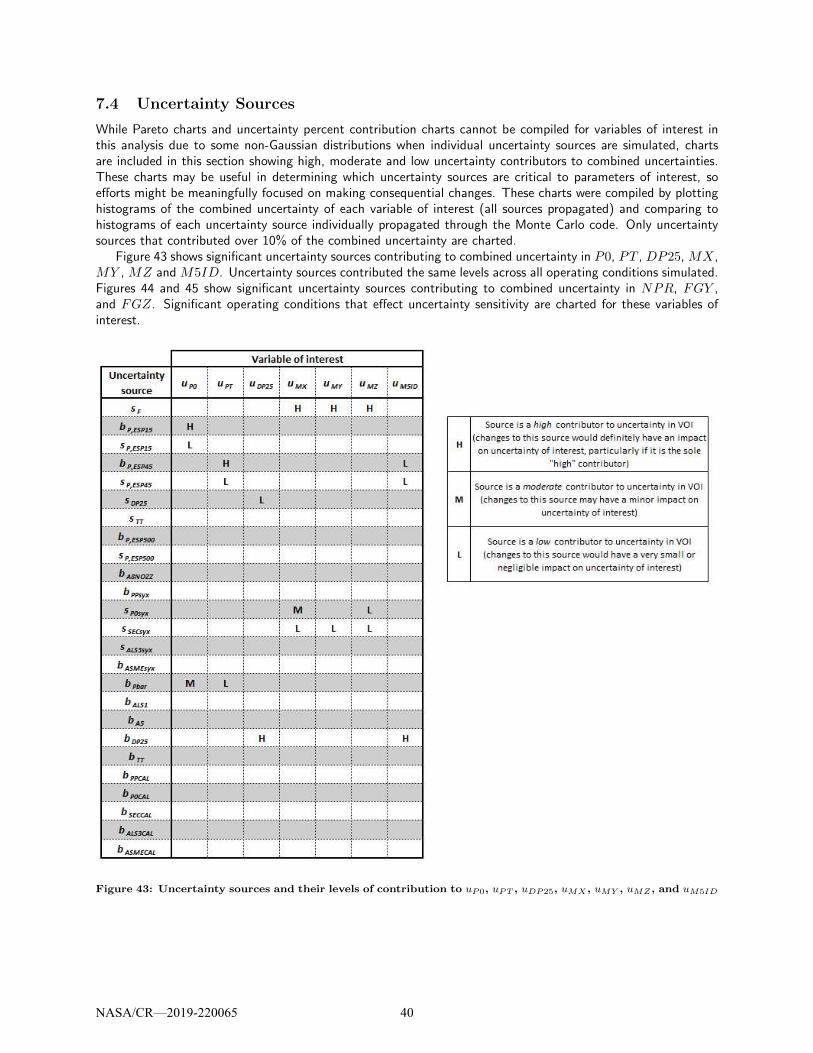
7.4 Uncertainty Sources
While Pareto charts and uncertainty percent contribution charts cannot be compiled for variables of interest inthis analysis due to some non-Gaussian distributions when individual uncertainty sources are simulated, chartsare included in this section showing high, moderate and low uncertainty contributors to combined uncertainties.These charts may be useful in determining which uncertainty sources are critical to parameters of interest, soefforts might be meaningfully focused on making consequential changes. These charts were compiled by plottinghistograms of the combined uncertainty of each variable of interest (all sources propagated) and comparing tohistograms of each uncertainty source individually propagated through the Monte Carlo code. Only uncertaintysources that contributed over 10% of the combined uncertainty are charted.
Figure 43 shows significant uncertainty sources contributing to combined uncertainty in P0, PT , DP25, MX,MY , MZ and M5ID. Uncertainty sources contributed the same levels across all operating conditions simulated.Figures 44 and 45 show significant uncertainty sources contributing to combined uncertainty in NPR, FGY ,and FGZ. Significant operating conditions that effect uncertainty sensitivity are charted for these variables ofinterest.
Figure 43: Uncertainty sources and their levels of contribution to uP0, uPT , uDP25, uMX , uMY , uMZ , and uM5ID
NASA/CR—2019-220065 40
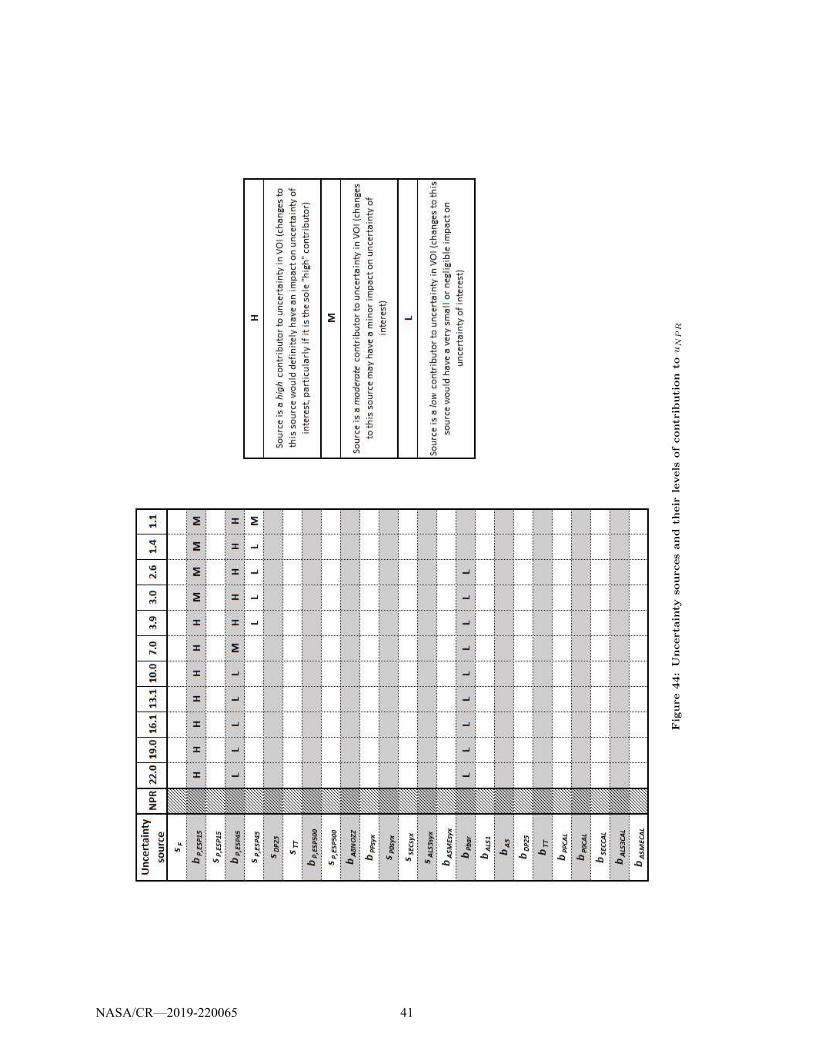
Fig
ure
44:
Un
certa
inty
sou
rces
an
dth
eir
levels
of
contr
ibu
tion
touNPR
NASA/CR—2019-220065 41

Fig
ure
45:
Un
certa
inty
sou
rces
an
dth
eir
levels
of
contr
ibu
tion
touFGY
an
duFGZ
NASA/CR—2019-220065 42

7.5 Example results for WP,CDN,FG and CFG: Mass flow, discharge coeffi-cient, gross thrust and thrust coefficient
An example of combined, systematic and random uncertainty results obtained for critical variables of interestFG,CFG,WP and CDN are presented in Figure 46.lAs has been extensively noted to this point, these resultsare only intended to provide an example of uncertainty outcomes based on a very specific ASME calibration. Forthis example, an ASME calibration using a nozzle size of 24in2 was performed at various altitude conditions, thenthe system of Monte Carlo propagation codes were executed using a simulated customer test matrix similar tothat of the calibration.
Since uncertainties in these variables have a high sensitivity to the ASME calibration, results should notbe assumed to apply (even with matching configuration and set conditions), and should not be generalized orextrapolated. Uncertainty estimates for these critical variables can be made available to customers once an ASMEcalibration specifically catered to their test is performed. (Pre-test entry estimates can be provided upon requestif sufficient data and information are available to support the request.)
0 5 10 15 20 25
NPR
0
2
4
6
8
UC
DN
10-4
Expanded uncertainty in CDN for
A8 = 24in2 and PT = 40psia
0 5 10 15 20 25
NPR
0
0.02
0.04
0.06
UW
P, lb
m/s
Expanded uncertainty in WP for
A8 = 24in2 and PT = 40psia
Random
Systematic
Combined
0 5 10 15 20 25
NPR
0
5
10
15
UF
G, lb
f
Expanded uncertainty in FG for
A8 = 24in2 and PT = 40psia
0 5 10 15 20 25
NPR
0
0.005
0.01
0.015
UC
FG
Expanded uncertainty in CFG for
A8 = 24in2 and PT = 40psia
Figure 46: Example of expanded combined, random and systematic uncertainty in critical variables of interestm
lEstimates of uCD5 = 1.3e− 4 and uCF5 = 5.0e− 4 are used as prediction uncertainties from the ASME calibration, basedon the specific calibration and data analysis used for this uncertainty propagation using methods presented in Section 6.2.5.Fossilized uncertainty from this specific ASME calibration also contributes to resulting uncertainties of interest as an artifactof other elemental uncertainties that were propagated through system of Monte Carlo codes. These estimates should also notbe generalized.
mUncertainty results for these variables are derived from a very specific ASME calibration simulation. They should not beextrapolated or generalized to apply to all facility conditions or nozzle sizes.
NASA/CR—2019-220065 43
8 What-If Scenario
Once the uncertainty propagation codes are established, it is beneficial to use them as a tool to explore potentialuncertainty improvement or cost-saving scenarios that do not compromise data quality. With minor adjustmentsto the existing simulation, information can be extracted regarding the degree of impact of such scenarios.
8.1 Push-Pull Calibration: Test Matrix Optimization
8.1.1 Scenario description
The current test matrix for the Push-Pull calibration involves sweeps of loads applied in nine different sets ofcombinations to obtain the thrust stand response characteristics. The main values of interest obtained are theslopes determined by performing a first-order fit of the response loads to the applied loads. Early on in thisanalysis, the facility researcher inquired about optimization of this test matrix. The question was, how manypoints are required during calibration to ensure quality results in the slopes but that might also provide a smallertest matrix which can be accomplished more quickly and cost effectively, without compromising uncertainty?
It is not at all uncommon for facilities to perform endpoint-only calibrations to identify sensitivity responsesfor thrust stands. In fact, the Propulsion Systems Laboratory (PSL) at NASA Glenn implements this approach fortheir Ormond thrust stand. In order to explore this scenario and quantify associated impact on uncertainty, threetheoretical test matrices are proposed: a three-point calibration per load sequence (including full-load endpointsand a midpoint, for each of the nine load combinations: 27 total points), a six-point calibration (the three-pointcalibration, repeated twice: 54 total points), and the full calibration test matrix (which includes approximately22-25 points per load combination: >200 total points).
These proposed test matrices were each run through the Monte Carlo simulation from beginning to end of theentire calibration sequence and test-time simulation to obtain comparative results. All systematic uncertaintieswere applied in these simulations, since the effect of the calibration is categorized as a fossilized systematicuncertainty, such that any errors present during the Push-Pull calibration have a trickle-down effect through allof the remaining calibrations and customer test. The results that follow, therefore, include the total impact ofthe size of the Push-Pull test matrix on customer test results.
8.1.2 Scenario results
The main variables of interest for this what-if scenario are the gross thrust, gross forces and moments, and thecoefficient of thrust. Simulation results for calculated moments are shown for the three-point, six-point and fullcalibrations in Figures 47-49. Some non-negligible increases in systematic uncertainty in the calculated momentsMY and MZ were noted with decrease in the size of the Push-Pull calibration test matrix. This may not beconsequential, since the random uncertainty component of uncertainty in these variables of interest completelydwarf any systematic uncertainty contribution.
While this simulation did show a very slight increase of uncertainties in calculated forces using the proposedsmaller test matrices, other contributors of systematic uncertainty have a much greater influence on the systematicuncertainty of these variables of interest. No appreciable differences in the uncertainty in gross thrust, thecoefficient of thrust, nor in any of the gross directional forces were found with alteration of the Push-Pullcalibration test matrix. We can conclude that for the purpose of thrust and force calculations, the smallest testmatrix is completely adequate without compromising uncertainty in these parameters.
NASA/CR—2019-220065 44

2 4 6 8 10 12 14 16
DP0, psi
0
1
2
3
4
5
6
7
8
9B
M,l
bf-
in
Expanded systematic uncertainty in MX
3-pt cal
6-pt cal
full cal
2 4 6 8 10 12 14 16
DP0, psi
0
2
4
6
8
10
12
BM
,lb
f-in
Expanded systematic uncertainty in MY
3-pt cal
6-pt cal
full cal
Figure 47: Expanded systematic uncertainty inMX for proposed Push-Pull calibration test ma-trices
Figure 48: Expanded systematic uncertainty inMY for proposed Push-Pull calibration test ma-trices
2 4 6 8 10 12 14 16
DP0, psi
0
1
2
3
4
5
BM
,lb
f-in
Expanded systematic uncertainty in MZ
3-pt cal
6-pt cal
full cal
Figure 49: Expanded systematic uncertainty in MZ for proposed Push-Pull calibration test matrices
NASA/CR—2019-220065 45

9 Conclusion
An uncertainty analysis was performed for the Advanced Nozzle Test Facility, CE-22, located at the NASA GlennResearch Center. All assumptions and elemental uncertainty estimates made for this analysis were detailed. TheMonte Carlo method of propagating uncertainty was used to achieve uncertainty estimation of several facilitycalculated variables of interest.
Throughout this document, uncertainties were classified as random and systematic to aid facility personneland researchers in determining which uncertainties are of interest for specific tests. Uncertainty sources weredetermined and elemental uncertainty estimates were made for all sources considered. Instrumentation uncertain-ties were estimated using MANTUS, a Microsoft Excel based tool tailored for modularized instrument systems todetermine the combined uncertainty of an instrument measurement system. Random uncertainties were estimatedusing short-term observations collected by frequent facility users. Uncertainty of values predicted by regressionfits were estimated using statistical analysis and were propagated whenever regressions were called on to predictvalues. All uncertainties considered in the analysis were propagated from the point of measurement through theinstrumentation, data system, calibrations and final customer test data reduction sequence to obtain combineduncertainty results for several variables of interest. Random uncertainty results were analyzed and broken downso that a comprehensive understanding of driving random uncertainty sources could be determined.
Simulating the entire calibration sequence and customer test proved to be more difficult than anticipated.Due to the large number of measurements, uncertainty sources, calculations, uncertainty correlations within andbetween tests, and use of the Nelder-Mead minimizing function, the propagation code length was great andrun-time was very high. To mitigate this, it was necessary to group some uncertainty sources and propagatemultiple sources at once, limiting the discreteness in results that could be achieved. Also, some error distributionsof calculated variables of interest had skewed or multimodal characteristics, making it impossible to create UPCcharts. Driving factors to uncertainty were instead identified using visual inspection of histograms that weregenerated by propagating only individual or small groups of uncertainty sources at a time.
A scenario was developed and simulated to deduce its potential impact on uncertainty. These types of scenariosand exploration enable facility personnel to make educated improvements as they consider facility upgrades andplan future calibration and customer tests. One such scenario that was explored indicated there would be little tono impact on the uncertainty if endpoint-only loads were applied during the Push-Pull calibration test (instead ofthe current extensive test matrix), which would provide a time-saving technique without compromising uncertainty.
To continue refinement of uncertainty estimates in CE-22, it would be worthwhile to build some repeatabilityinto ASME calibrations. Repeat data can be used to verify current random uncertainty results (or refine themas needed) by performing statistical analysis of directly calculated variables of interest such as CDN and CFG.Random uncertainty results deduced from uncertainty propagation can become inflated if there are unknowncorrelations that are not properly understood and accounted for. Additionally, due to the sensitivity of criticalvariables of interest to the ASME calibration and its specificity to each test program, facility personnel and theuncertainty team will continue to collaborate as ASME calibrations occur so that customers can be provided withaccurate uncertainty estimates that directly pertain to their tests on an ongoing basis.
NASA/CR—2019-220065 46

10 References
[1] John D. Wolter. “Advanced Nozzle Test Facility Technical Guide”. Technical guide, National Aeronauticsand Space Administration, Document in progress.
[2] Roger A. Werner and John D. Wolter. “Calibration for Thrust and Airflow Measurements in the CE-22Advanced Nozzle Test Facility”. Technical Memorandum NASA/TM-2010-216771, National Aeronautics andSpace Administration, November 2010.
[3] Kin C. Wong. “Derivation of the Data Reduction Equations for the Calibration of the Six-Component ThrustStand in the CE-22 Advanced Nozzle Test Facility”. Technical Memorandum NASA/TM-2003-212326, Na-tional Aeronautics and Space Administration, April 2003.
[4] J. Stephens, E. Hubbard, J. Walter, and T. McElroy. “Uncertainty Analysis of the NASA Glenn 8x6 SupersonicWind Tunnel”. Contractor Report NASA/CR-2016-219411, National Aeronautics and Space Administration,2016.
[5] H. W. Coleman and W. G. Steele. Experimentation, Validation and Uncertainty Analysis for Engineers. JohnWiley and Sons, Inc., Third edition, 2009.
[6] Joint Committee for Guides in Metrology. “Evaluation of Measurement Data - Guide to the Expression ofUncertainty in Measurement”. Guide JCGM 100:2008, International Organization for Standardization, 2008.
[7] S. Castrup and H.T. Castrup. “Measurement Uncertainty Analysis Principles and Methods: NASA Measure-ment Quality Assurance Handbook - ANNEX 3”. Handbook NASA HDBK 8739.19-3, National Aeronauticsand Space Administration, 2010.
NASA/CR—2019-220065 47