Embed Size (px)
Citation preview
* Corresponding author. Tel: 03463 – 253132 E-mail addresses: [email protected] , [email protected] (A. K. Baksi) © 2013 Growing Science Ltd. All rights reserved. doi: 10.5267/j.uscm.2013.08.002
Uncertain Supply Chain Management 1 (2013) 115–132
Contents lists available at GrowingScience
Uncertain Supply Chain Management
homepage: www.GrowingScience.com/uscm
Examining the moderating effects of CRM on retail atmospherics-shopping behavior link
Arup Kumar Baksi*
Assistant Professor, Department of Management Science, Bengal Institute of Technology & Management, PIN-731236, WEST BENGAL, India C H R O N I C L E A B S T R A C T
Article history: Received June 10, 2013 Received in revised format 19 July 2013 Accepted August 9 2013 Available online August 10 2013
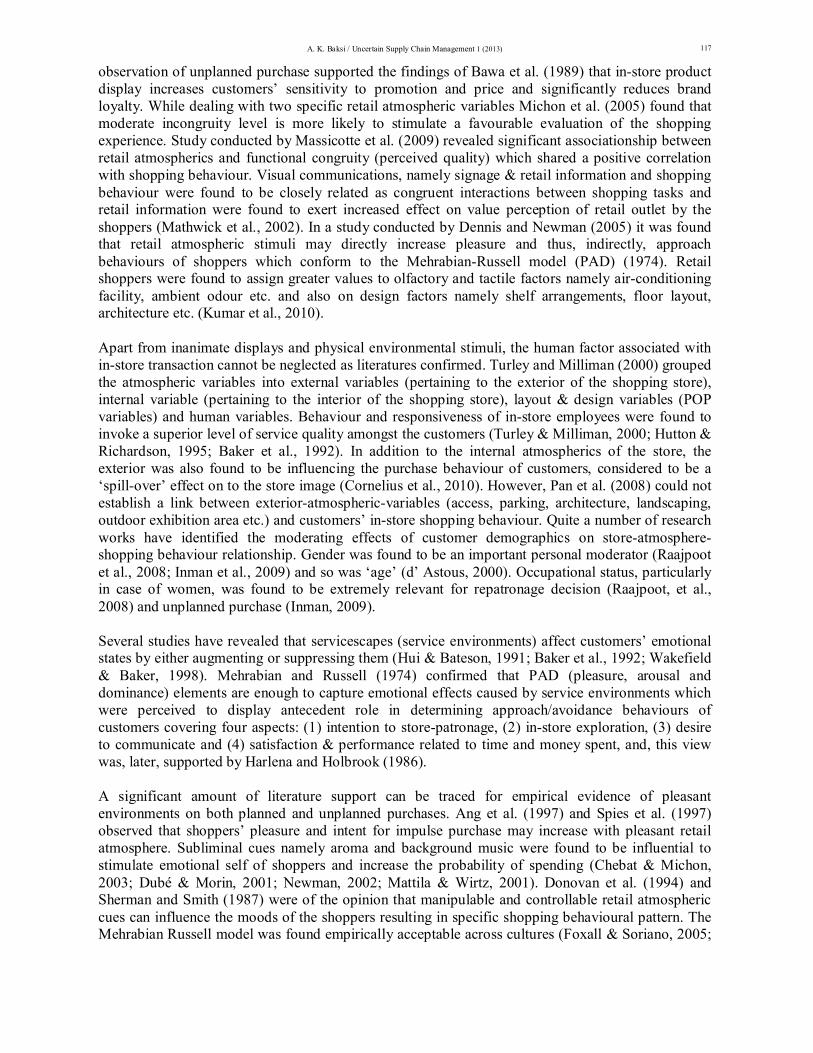
Retail atmospherics have been well studied to have both functional and emotional impact on the behavioural intent of shoppers. The usage of well-orchestrated retail servicescape with its expanding canvas, both inside and outside the retail premise, has been targeted to induce subliminal perception of comfort and convenience in the mind of shoppers. Modern retail practice has incorporated customer relationship management (CRM), a pivotal business analytical process, to strengthen their interaction with shoppers. This paper attempts to gather empirical evidence on the possible mediating effects of CRM dimensional performance on the emotional orientation of shoppers, apprehended to be antecedent to favourable shopping behaviour. Appropriate statistical applications, following adequate literature survey, were deployed to test the hypotheses and the robustness of the default model. The results were indicative of strong moderating impact of CRM dimensional performance in augmenting emotional behaviour of customers to induce a fovourable behavioural intent. The default model also holds good confirming the causal convergence of constructs.
© 2013 Growing Science Ltd. All rights reserved.
Keywords: Retail Atmospherics Emotion CRM Shopping behaviour
1. Introduction
Retail scenario in India has underwent a sea change specifically in terms of experiential shopping which has compelled the organized retail sector to delve deep into retail atmospherics as it became deterministic to emotionally satisfied shopping. This has also put the practicing retailers at the crossroad of product/brand value addition and retailscape value addition. The retail atmospherics has been conceptualized to be a spectrum of tangible and intangible dispositions intertwined to frame meaningful stimuli (Markin et al., 1970) that generate response across the social, psychological, economic, cultural, ethnic and religious life-styles of consumers because of concordance with prevailing trends. Retail atmospheric cues may function as antecedents to develop both threshold and subliminal perception culminating into evaluation and predisposition when it comes to purchase (shopping) behaviour. In fact, retail atmospherics can generate a chain of attributes, benefits and emotions of pleasure-displeasure, attraction-distraction, high-low confidence, motivational layers and desire (Kumar et al., 2010). The retail atmospherics consist of factors namely olfactory, tactile, tangible and intangible which operate on the cognitive process of shoppers resulting in specific

116
behavioural pattern both short-term (purchase intention, purchase decision) and long-term (patronage, advocacy) in nature. Retail displays are not mere agglomeration of products but a harmonious ensemble and arrangement of brands compatible to retailscape whereby transposition of abiotic brand components to its biotic personified form and the communication of the same with the shoppers is ensured. The strategic usage of atmospherics in multi-branded retail malls is now well witnessed. The sole purpose of using the atmospheric cues is to stimulate the cognitive emotions of the shoppers which are expected to generate favourable shopping behaviour. The integration of customer relationship management (CRM), as an adjunct business process, with the retail operations has enabled the retail operators to segment shoppers in a better way, which is likely to help them design effective communication and display of merchandise. The quantifiable influence of retail atmospheric cues on cognitive domain of shoppers is a problematic issue to be addressed because of which the proper atmospheric-mix is difficult to identify. In addition to this, the CRM dimensional elements, which are also likely to intervene in the relationship between retail atmospherics and shopping behaviour link, have not been perfected for a retail set-up. The objective of this study is to understand the causal relationship between the retail atmospherics and shopping behaviour and to their apprehended modification under the mediating influence of CRM dimensional performances. The study also attempts to identify the mediating effects of emotional behaviour of shoppers on the shopping behaviour under the impact of CRM dimensional elements. Further to this the study proposes a default model involving all the constructs. 2. Review of literature
While prescribing the term ‘atmospherics’, Kotler (1974) was of the opinion that buying environment can be designed to generate desired level of emotional effects in shoppers, culminating into increased probability of purchasing. Later Donovan and Rossiter (1982) used the Mehrabian-Russell framework (Mehrabian & Russell, 1974) and presented supportive views that favourable environmental conditions and impact of intervening variables are deterministic in retail shopping behavior. The practicing retailers have identified a number of subliminal cues generated that appeals to the emotional self of shoppers and stimulate purchasing behavior. Over the years the researchers have empirically explored the retail atmospheric variables namely music (Milliman, 1982; Morin et al., 2007; Yaleh & Spangenberg, 2000; Jain & Bagdare, 2011; Smith & Curnow, 1996; Spangenberg et al., 2005; Oakes & North, 2008; Bailey & Arenis, 2006; Garlin & Owen, 2006; Broekemier et al., 2008), colour (Bellizzi & Hite, 1992; Turley & Milliman, 2000; Babin et al., 2003; Ng, 2003; Chebat & Morrin, 2007; Lawes, 2008), odour/scent (Bone & Ellen, 1999; Sprangenberg et al., 1996; Baron, 1997; Michon et al., 2005; Hirsch, 1995; Morrin & Ratneswar, 2000; Fiore et al., 2000; Knasko, 1993; Eroglu & Machleit, 1990), use of illumination (Levy & Weitz, 2004; Ng, 2003; Underhill, 1999; Areni & Kim, 1995), crowding (Machleit et al., 2000; Machleit & Mantel, 2001; Whiting, 2009; Li et al., 2009; Hofstede, 2011), temperature and touch (Jacobs, 1984; Areni & Kim, 1994; d’Astous, 2000), visual communication (Levy & Weitz, 2004; Din, 2000) and store layout (Woodruffe-Burton & Wakenshaw, 2011) to be having significant impact on shopping behaviour and perceived image of the retail outlet. Several studies demonstrated that shoppers’ behaviour can be attributed to their perceived inferences about the quality of merchandise displayed, using the retail atmospheric signals (Espinoza et al., 2004; Baker et al., 2002). In-store display or point-of-purchase (POP) displays was also reported to be significant strategic initiatives (Levy & Weitz, 2009), although adequate study of their psychological impact on customers’ cognitive decision making was not asserted. Inman et al. (2009) observed that product display and in-store POP usage induced unplanned purchase behaviour, specifically for products that are frequently purchased. This
A. K. Baksi / Uncertain Supply Chain Management 1 (2013)
117
observation of unplanned purchase supported the findings of Bawa et al. (1989) that in-store product display increases customers’ sensitivity to promotion and price and significantly reduces brand loyalty. While dealing with two specific retail atmospheric variables Michon et al. (2005) found that moderate incongruity level is more likely to stimulate a favourable evaluation of the shopping experience. Study conducted by Massicotte et al. (2009) revealed significant associationship between retail atmospherics and functional congruity (perceived quality) which shared a positive correlation with shopping behaviour. Visual communications, namely signage & retail information and shopping behaviour were found to be closely related as congruent interactions between shopping tasks and retail information were found to exert increased effect on value perception of retail outlet by the shoppers (Mathwick et al., 2002). In a study conducted by Dennis and Newman (2005) it was found that retail atmospheric stimuli may directly increase pleasure and thus, indirectly, approach behaviours of shoppers which conform to the Mehrabian-Russell model (PAD) (1974). Retail shoppers were found to assign greater values to olfactory and tactile factors namely air-conditioning facility, ambient odour etc. and also on design factors namely shelf arrangements, floor layout, architecture etc. (Kumar et al., 2010). Apart from inanimate displays and physical environmental stimuli, the human factor associated with in-store transaction cannot be neglected as literatures confirmed. Turley and Milliman (2000) grouped the atmospheric variables into external variables (pertaining to the exterior of the shopping store), internal variable (pertaining to the interior of the shopping store), layout & design variables (POP variables) and human variables. Behaviour and responsiveness of in-store employees were found to invoke a superior level of service quality amongst the customers (Turley & Milliman, 2000; Hutton & Richardson, 1995; Baker et al., 1992). In addition to the internal atmospherics of the store, the exterior was also found to be influencing the purchase behaviour of customers, considered to be a ‘spill-over’ effect on to the store image (Cornelius et al., 2010). However, Pan et al. (2008) could not establish a link between exterior-atmospheric-variables (access, parking, architecture, landscaping, outdoor exhibition area etc.) and customers’ in-store shopping behaviour. Quite a number of research works have identified the moderating effects of customer demographics on store-atmosphere-shopping behaviour relationship. Gender was found to be an important personal moderator (Raajpoot et al., 2008; Inman et al., 2009) and so was ‘age’ (d’ Astous, 2000). Occupational status, particularly in case of women, was found to be extremely relevant for repatronage decision (Raajpoot, et al., 2008) and unplanned purchase (Inman, 2009). Several studies have revealed that servicescapes (service environments) affect customers’ emotional states by either augmenting or suppressing them (Hui & Bateson, 1991; Baker et al., 1992; Wakefield & Baker, 1998). Mehrabian and Russell (1974) confirmed that PAD (pleasure, arousal and dominance) elements are enough to capture emotional effects caused by service environments which were perceived to display antecedent role in determining approach/avoidance behaviours of customers covering four aspects: (1) intention to store-patronage, (2) in-store exploration, (3) desire to communicate and (4) satisfaction & performance related to time and money spent, and, this view was, later, supported by Harlena and Holbrook (1986). A significant amount of literature support can be traced for empirical evidence of pleasant environments on both planned and unplanned purchases. Ang et al. (1997) and Spies et al. (1997) observed that shoppers’ pleasure and intent for impulse purchase may increase with pleasant retail atmosphere. Subliminal cues namely aroma and background music were found to be influential to stimulate emotional self of shoppers and increase the probability of spending (Chebat & Michon, 2003; Dubé & Morin, 2001; Newman, 2002; Mattila & Wirtz, 2001). Donovan et al. (1994) and Sherman and Smith (1987) were of the opinion that manipulable and controllable retail atmospheric cues can influence the moods of the shoppers resulting in specific shopping behavioural pattern. The Mehrabian Russell model was found empirically acceptable across cultures (Foxall & Soriano, 2005;

118
Foxall & Pearson, 2002) as it proved that pleasure (Chebat & Michon, 2003) and arousal, to certain extent, (Russell & Pratt, 1980) were found influential in determining shopping responses. The ‘human’ variable assumed to be a significant in-store atmospheric variable, has been expanded functionally to incorporate the elements related to customer relationship management (CRM). In a study conducted by Dargah and Golrokhsari (2012) it was found that CRM can be instrumental in segmenting in-store customers and thereby providing in-store employees opportunity to customize communication-pattern with the customers to meet their specific requirements. One of the major applications of CRM in retail environment focuses on the use of technology to capture consumer data (Payne, 2009) which becomes the foundation for customization strategy for individual customer. Majority of the studies involving CRM were targeted to identify the same as an antecedent to customer satisfaction and retention (Mithas et al., 2005; Verhoef, 2003; Gustaffson et al., 2005). Mithas et al. (2005) also observed that CRM can also induce better consumption experience for the customers. Salespeople are leveraging the use of CRM (Widmier et al., 2002) in improving their relationships with customers thereby enhancing the capability of sales forecasting, lead management and personalization (Rigny & Ledingham, 2004). Further to this, as salespeople are operating at the organisation-customer interface, CRM enables them to add value proposition for the customers (Beverland, 2001) while managing the buyer-seller dyadic relationship (Reynolds and Arnold, 2000). In a study conducted by Gilaninia and Ghashlagh (2012) it was found that relationship marketing can pacify transaction related anxiety in customers and that retail atmospherics (including store employees) had a significant role to play in it. Study of extant literatures revealed that implementation of CRM necessarily involved four specific activities: (a) focusing on key customers (Schmid & Weber, 1998; Srivastava et al., 1999; Sheth et al., 2000; Ryals & Knox, 2001; Armstrong & Kotler, 2003; Vandermerwe, 2004; Srinivasan et al., 2002, Jain & Singh, 2002) which encompassed the view of a customer-centric organizational structure with dyadic interactive points targeted towards identification of key or valued customers through lifetime value computations, (b) organizing around CRM (Brown, 2000; Homburg et al., 2000; Ahmed & Rafique, 2003), which emphasized on customer-centric organizational functions with an objective to ensure value proposition to customers, (c) managing knowledge (Peppard, 2000; , Freeland, 2003; Stefanou et al., 2003; Stringfellow et al., 2004, Yim et al., 2004; Plessis & Boon, 2004; Brohman et al., 2003) whereby customer-information are effectively transformed into customer-knowledge and disseminated across the organizational hierarchy which will equip salespeople with better understanding of customers’ requirements and (d) adopting CRM-based technology (Butler, 2000; Pepperd, 2000; Vrechopoulos, 2004; Widmier et al., 2002) to optimize communication with customers, accurate service delivery with back-up and supportive information, managing customer-knowledge by data warehousing and data mining and providing customized services. However, there has been a dearth of research in identifying these CRM dimensions in the context of retail industry. The major findings from the existing literature are:
existing research found strong support to correlate retail-atmospheric elements to be deterministic of customers’ in-store shopping experience and behaviour.
the retail-atmospheric elements are instrumental in emotional influence of customers CRM has been identified as a critical customer-retention tool, which can be additionally used
to augment the value proposition of customers.
2.1 Research gap identified
But literature remained absolutely inconclusive regarding the moderating impact of CRM dimensions on retail atmospherics-shopping behaviour link, whereas, it is absolutely critical to assess the impact considering the fact that the retail outlets are spending much on CRM implementation.

A. K. Baksi / Uncertain Supply Chain Management 1 (2013)
119
2.2 Formulation of hypothesis
Apropos to the review of literature, the researcher aimed to identify the causal relationship between retail atmospheric elements, emotional behavioural response of the shoppers and shopping behaviours. Therefore it was hypothesized that:
H1: External retail atmospheric elements (RAE) influence emotional behaviour (EB) of shoppers. H2: Internal retail atmospheric elements (RAE) influence emotional behaviour (EB) of shoppers. H3: Layout & design retail atmospheric elements (RAE) influence emotional behaviour (EB) of shoppers. H4: POP retail atmospheric elements (RAE) influence emotional behaviour (EB) of shoppers. H5: Human retail atmospheric elements (RAE) influence emotional behaviour (EB) of shoppers. H6: External retail atmospheric elements (RAE) influence shopping behaviour (SB) of shoppers. H7: Internal retail atmospheric elements (RAE) influence shopping behaviour (SB) of shoppers. H8: Layout & design retail atmospheric elements (RAE) influence shopping behaviour (SB) of shoppers. H9: POP retail atmospheric elements (RAE) influence shopping behaviour (SB) of shoppers. H10: Human retail atmospheric elements (RAE) influence shopping behaviour (SB) of shoppers. H11: Shopping behaviour (SB) is dependent on emotional orientation (EB) of shoppers. One of the major objectives of the researcher was to estimate the moderating impact of CRM dimensional performance (CRMDP) on the links apprehended to be existing between retail atmospheric elements, emotional behaviour and shopping behaviour of shoppers. Therefore the hypotheses formulated are as follows:
H12: CRMDP is likely to have an impact on retail atmospheric states-emotional behaviour link.
H13: CRMDP is likely to have an impact on retail atmospheric states-shopping behaviour link.
H14: CRMDP is likely to have an impact on emotional behavioural states-shopping behaviour link.
2.3 Proposed default model
The proposed default model was constructed by taking into consideration the hypotheses formulated and was represented in Fig.1.
Fig. 1. The proposed default model [Legends used: RAE- retail atmospheric elements, EB- emotional behaviour, SB- shopping behaviour, CRMD-Customer relationship management dimension]
RAE
EB
SB
CRMD
H1- H5 H6- H10
H12 H13 H14
H11

120
3. Methodology
The study used quantitative survey method and was comprised of two phases. Phase-I involved a pilot study to refine the survey instrument with rectification of question ambiguity, refinement of research protocol and confirmation of scale reliability was given special emphasis (Teijlingen & Hundley, 2001). FGI was administered among twenty five (25) selected personnel representing retail shoppers, academicians and researchers. Cronbach’s α coefficient (>0.7) established scale reliability (Nunnally & Bernstein, 1994). The structured questionnaire thus obtained after refinement contained five sections. Section-1 was targeted for the shoppers to generate response about the perceptual impact of retail atmospherics. Section-2 was designed to assess shoppers’ emotional state of mind. Section-3 was intended to generate response regarding the attitude of the shoppers. Section-4 was targeted for the employees of retail outlets to realize the CRM initiatives that were deployed from their end and section-5 was designed to generate the demographic profile of the respondents. The second phase of the cross-sectional study was conducted in 15 retail malls spreading over the Burdwan district in West Bengal, India. Retailer sales data were eschewed to avoid anomalies caused by adverse climatic conditions, fluctuating pricing and interest rates and promotional initiatives by the competitor retailers. Convenience sampling technique was administered through mall-intercept process as was used in comparing shopping malls by Howard (1992) and Hackett and Foxall (1994) and was supposed to provide data accuracy (Bush & Hair, 1985). A total number of 6000 questionnaires was used which generated 43898 usable responses with a response rate of 81.63% (approximately). A 7 point Likert scale was used to generate response across the items of the constructs (Alkibisi & Lind, 2011) 3.1 Factor constructs measurement To develop a measure for the perception of retail atmospheric environment, the 57 item scale developed by Turley and Milliman (2000) was used. The emotional behaviour of the shoppers was measured by using the Mehrabian-Russell model (1974) and its PAD items (pleasure, arousal and dominance). This measurement also drew inspiration from the studies of Lin and Chiang (2010), Sautter et al (2004), Wolfinbarger and Gilly (2002) and Baksi and Parida (2012). Responses to the seventeen bipolar adjective scales adaptive from Donovan and Russell's (1982) scales were factor analyzed. The Pleasure dimension consisted of contented-depressed, happy-unhappy, satisfied-unsatisfied, annoyed-pleased, bored-interested, hopeful-despairing. Responses to these items were summed and considered a measure of positive and negative mood during the task. The second factor was labeled Arousal and was composed of the items relaxed-stimulated, calm-excited, aroused-unaroused, and frenzied-sluggish. The third dimension was Dominance and included responses to three items, controlled-in control, dominant-submissive, and influenced-influential. But, unlike Donovan and Rossiter (1982), the bipolar adjective distributions of pleasure, arousal and dominance items were fitted into a interval (Likert) scale to understand the variations (the intermediate values) in moods. The measurement of shopping behaviour was estimated with the help of a 4 item scale adopted from Sautter et al., 2004; Sweeny and Wyber, 2002 and Donovan and Rossiter, 1982. Lastly, to develop a measure for CRM performance three CRM process elements namely CRM initiation, CRM maintenance, and CRM termination (Reinartz et al., 2004) and four CRM dimensions namely customer orientation ,CRM organization , knowledge management, and CRM technology (Abdullateef et al., 2010) were identified for the study. The CRM performance items thus obtained were subsequently modified to suit the study. 3.2 Reliability and validity test Exploratory factor analysis (EFA) was deployed using principal axis factoring procedure with orthogonal rotation through VARIMAX process with an objective to assess the reliability and validity of all factor constructs. Factors loading with Cronbach’s α value ˂.6 were sumptuously discarded.

A. K. Baksi / Uncertain Supply Chain Management 1 (2013)
121
Secondly confirmatory factor analysis (CFA) was used to understand the convergence, discriminant validity and dimensionality for each construct to determine whether all the items measure the construct adequately as they had been assigned for. Finally, LISREL 8.80 programme was used to conduct the Structural Equation Modeling (SEM) and Maximum Likelihood Estimation (MLE) was applied to estimate the CFA models.
4. Data analysis and interpretation
The demographic distribution of the sample was represented in Table 1.
Table 1 Personal characteristics of the participants
Demographic Variables Factors Frequency %
Gender Male 3176 64.84% Female 1722 35.16%
Age
≤ 21 years 101 2.06% 22-32 years 1762 35.97% 33-43 years 2114 43.16% 44-54 years 825 16.84% ≥ 55 years 96 1.96%
Income (per month) ≤ 20000.00 152 3.10%
˃20000.00≤ 35000.00 2461 50.24% ˃35000.00≤ 50000.00 1298 26.50%
˃50000.00 987 20.15%
Occupation
Service [govt./prv] 2422 49.45% Self employed 979 19.99% Professionals 291 5.94%
Student 62 1.27% Housewives 1144 23.36%
Educational qualification High school 29 0.59%
Graduate 3398 69.38% Postgraduate 1345 27.46%
Doctorate & others (CA, fellow etc) 155 3.16% To assess the reliability and validity of the constructs, the researcher applied exploratory factor analysis (EFA) using principal axis factoring procedure with orthogonal rotation through VARIMAX process. The results of the EFA were displayed in Table 2. The Cronbach;s Coefficient alpha was found significant enough, as it measure >.7 (Nunnally & Bernstein, 1994) for all constructs and therefore it is reasonable to conclude that the internal consistency of the instruments used were adequate. Each accepted construct displayed an acceptable construct reliability with estimates well over .6 (Hair et al., 1998). Further to this the average variance extracted (AVE) surpassed minimum requirement of .5 (Haier et al., 1998). The KMO measure of sample adequacy (0.907) indicated a high-shared variance and a relatively low uniqueness in variance (Kaiser & Cerny, 1979). Barlett’s sphericity test (Chi-square=652.118, df=389, p<0.001) indicated that the distribution is ellipsoid and amenable to data reduction (Cooper & Schindler, 1998). The initial 57 items related to retail atmospherics were reduced to 21 items with items having factor loading scores of <0.6 were discarded. The items related to emotional behaviour of shoppers were significantly loaded on 8 items, while the 3 items of shopping behaviour revealed significant factor loading. The items related to ‘dominance’ scored an alpha score of .521 and therefore summarily rejected. The emotional behaviour will be represented by two factor constructs: pleasure and arousal. The omission of ‘dominance’ related items confirms the findings of Donovan and Rossiter (1982). The CRM dimensional items completed loading in 20 items.

122
Table 2 Measurement of reliability and validity of the variables
Items FL** t-value α** AVE** CRMD
Our organization establishes and monitors customer-centric performance standards at all customer touch 0.651 19.09 0.931 0.799 Our organization has established clear business goals related to customer acquisition, development, retention and reactivation. (CRMD2)
0.669 20.28 0.931 0.799 Our organization has the sales and marketing expertise and resources to succeed in CRM (CRMD3) 0.611 12.11 0.931 0.799 Our employee training programme has been designed to develop the skills required for acquiring and deepening customer relationships. (CRMD4)
0.677 23.67 0.931 0.799 Employee performance is measured and rewarded based on meeting customer needs and on successfully serving the customer. (CRMD5)
0.618 15.28 0.931 0.799 Our organizational structure has been designed to foster customer centricity. (CRMD6) 0.616 14.28 0.931 0.799 Our organization commits t ime and resources to manage customer relationships. (CRMD7) 0.619 16.62 0.931 0.799 Our organization has apt softwares to serve our customers. (CRMD8) 0.659 20.27 0.931 0.799 Our organization has required hardwares to serve our customers. (CRMD9) 0.688 26.29 0.931 0.799 Our organization has the proper technical personnel to provide technical support to our CRM executives. (CRMD10)
0.633 14.72 0.931 0.799 Our organization maintains a comprehensive database of our customers. (CRMD11) 0.659 18.09 0.931 0.799 Individual customer information is available at every point of contact (CRMD12) 0.606 10.02 0.931 0.799 Our organization provides customized services to our key customers. (CRMD13) 0.647 17.02 0.931 0.799 Our organization communicates with key customers to customize our offerings on demand. (CRMD14) 0.618 10.48 0.931 0.799 Our organization makes an effort to find out what the key customer requirements are (CRMD15) 0.602 10.76 0.931 0.799 Our employees make coordinated efforts to deliver customize service once a customer places a demand for 0.649 24.55 0.931 0.799 Each and every employee of our organization treats customers with great care. (CRMD17) 0.628 17.41 0.931 0.799 Our organization provides channels to enable ongoing two-way communication between our key customers and us. (CRMD18)
0.674 16.81 0.931 0.799 Our customers can expect exactly when services will be performed (CRMD19) 0.613 12.99 0.931 0.799 Our organization fully understands the requirements of our key customers and us. (CRMD20) 0.606 11.03 0.931 0.799
RAE Exterior display windows are extremely attractive and well laid out (RAE1) 0.701 20.91 0.946 0.801 Adequate parking space is available (RAE2) 0.722 24.32 0.946 0.801 The architectural ambience of the retail-building is attractive (RAE3) 0.699 19.17 0.946 0.801 The surrounding areas of the retail building have been well groomed and maintained (RAE4) 0.704 21.12 0.946 0.801 The colour schemes used for the interior décor of the retail outlet is extremely soothing (RAE5) 0.688 17.89 0.946 0.801 The use of l ighting to highlight the store displays and the alleys is apt (RAE6) 0.629 12.05 0.946 0.801 The odour inside the retail outlet is carbolic-free, devoid of claustrophobic smell and extremely pacifying (RAE7)
0.608 10.01 0.946 0.801 The width of the aisles are adequate to avoid congestion while moving (RAE8) 0.622 11.16 0.946 0.801 The temperature of the retail outlet has been maintained to ensure physical comfort (RAE9) 0.667 15.65 0.946 0.801 The grouping of the merchandise is logical and easy for search (RAE10) 0.647 15.28 0.946 0.801 The space and design allocation of the retail outlet has been done aesthetically and to provide convenience to shoppers (RAE11)
0.616 13.65 0.946 0.801 The placement of equipment namely self-dispensing carts etc. is convenient for the shoppers (RAE12) 0.716 31.27 0.946 0.801 The department location on the basis of assortment of products/services are logically and conveniently laid out (RAE13)
0.722 33.17 0.946 0.801 The traffic flow inside the retail outlet has been well controlled to avoid crowding and congestion (RAE14) 0.673 23.91 0.946 0.801 The point-of-purchase displays are well used and symbolic (RAE15) 0.619 11.86 0.946 0.801 The signage inside the retail outlet are well marked and visible (RAE16) 0.638 18.92 0.946 0.801 The usage and informative instructions in the form of leaflets, take-away and display board are easily visible and accessible (RAE17)
0.624 15.10 0.946 0.801 The certificates assuring quality of goods and services are well displayed (RAE18) 0.644 14.42 0.946 0.801 The employees of the retail outlet are extremely courteous and helpful (RAE19) 0.627 9.03 0.946 0.801 The employees of the retail outlet are extremely knowledgeable about the goods and services displayed (RAE20)
0.625 10.29 0.946 0.801 The employees of the retail outlet are well groomed (RAE21) 0.637 12.45 0.946 0.801
EB I am happy with my retail experience (EB1). 0.624 21.84 0.942 0.773 I am satisfied with my retail experience (EB2). 0.665 29.65 0.942 0.773 The shopping experience was interesting (EB3) 0.621 20.01 0.942 0.773 I am pleased with my retail experience (EB4). 0.611 19.44 0.942 0.773 I felt relaxed while shopping in my retail outlet (EB5) 0.642 26.23 0.942 0.773 I was excited to shop in my retail outlet (EB6) 0.616 19.98 0.942 0.773 I was aroused by the retail display while shopping in my retail outlet (EB7) 0.652 27.84 0.942 0.773 I felt frenzied while shopping in my retail outlet (EB8) 0.637 25.06 0.942 0.773
SB I desire to continue shopping in my retail outlet (SB1) 0.725 28.92 0.924 0.769 I desire to recommend my retail outlet to others (SB2) 0.768 32.08 0.924 0.769 I desire to increase the gamut of shopping via my retail outlet (SB3) 0.723 26.63 0.924 0.769
Cronbach’s α = 0.928 Chi-Square = 652.188 df = 389 Sig. p<0.001
**FL- Factor loadings, α - Cronbach’s α, AVE – Average variance extracted
The dimensions of CRM and RAE have been nomenclated as per the component wise factor loadings (shown by colour grade in Table-2) in Table 3.
Table 3 Dimensions of CRM and RAE
Sl. No. Variable Items as per factor loadings post EFA Dimension name 1
CRM
CRMD1 – CRMD7 Organizing around CRM 2 CRMD8 – CRMD12 Technology integration 3 CRMD13 – CRMD17 Key customer focus 4 CRMD18 – CRMD20 Managing knowledge 1
RAE
RAE1 – RAE4 Exteriors 2 RAE5 – RAE10 Interiors 3 RAE11 – RAE15 Layout & Design 4 RAE16 – RAE18 POP displays 5 RAE19 – RAE21 Human interface 1 EB EB1 – EB4 Pleasure 2 EB5-EB8 Arousal 1 SB SB1 – SB2 Approach

A. K. Baksi / Uncertain Supply Chain Management 1 (2013)
123
Bivariate correlations were obtained to assess the relationship between the constructs. The results were displayed in Table-4. Correlation results revealed that CRMD performance shared strong, positive and significant correlationship with RAE (r=.899**, p<.001), EB (r=.846**, p<.001) and SB (r=.729**, p<.001) while RAE, too, displayed strong correlationship with both EB (r=.805**, p<.001) and SB (r=.536**, p<.001). EB revealed a strong and positive correlationship with SB (r=.664**, p<.001). Table 4 Results of bivariate correlation between the constructs
CRMD RAE EB SB
CRMD Pearson Correlation 1 Sig. (2-tailed) N 4898
RAE Pearson Correlation .899** 1 Sig. (2-tailed) .000 N 4898 4898
EB Pearson Correlation .846** .805** 1 Sig. (2-tailed) .000 .000 N 4898 4898 4898
SB Pearson Correlation .729** .536** .664** 1
Sig. (2-tailed) .000 .000 .000 N 4898 4898 4898 4898
**. Correlation is significant at the 0.01 level (2-tailed)
Multiple regression analysis was applied to test hypotheses H1- H5. To conduct the analysis (i) the composite mean score against each dimensions of RAE were obtained from the responses generated by scaling technique and (ii) dimensional (taking pleasure and arousal into consideration in combination) composite mean score was obtained which represented EB of shoppers. The results of the multiple regression analysis were displayed in Table-5a, 5b and 5c. The R square (.381) value indicated that the dimensions of RAE measured 38.10% of the variation in EB, which is considered to be significant enough for predictability of the model (Draper and Smith, 1998). The results of ANOVA established that the variation showed by dimensions of RAE was significant at 1% level (f=601.950, p<.001). The standardised regression coefficient results confirmed that the predictive capacity of the items of RAE, namely EXTD (exterior dimension - β=.692, t=11.201, p<.001), INTD (interior dimension - β=.402, t=11.201, p<.001), LDD(layout & design dimension - β=.118, t=4.558, p<.005), POPD(point-of-purchase dimension - β=.281, t=7.115, p<.001) and HID (human interface dimension - β=.692, t=11.201, p<.001) to predict the nature of EB has statistical significance (β=.471, t=29.119, p<.001). The VIF values were low enough to confirm absence of multicollinearity (Hair et al., 1998, Coakes, 2005). The results of regression analysis lend support to H1 to H5. Table 5a Model summary
Model R R2 Adjusted R2 Std. Error of the Estimate
Change Statistics
R2 Change F Change df1 df2 Sig. F Change
1 .617a .381 .380 .95415 .381 601.950 5 4892 0.000 a. Predictors: (Constant), HID, LDD, POPD, INTD, EXTD b. Dependent Variable: EB
Table 5b ANOVA
Model Sum of Squares df Mean Square F Sig.
1 Regression 2740.084 5 548.017 601.950 .000b Residual 4453.691 4892 .910
Total 7193.775 4897 a. Dependent Variable: EB b. Predictors: (Constant), HID, LDD, POPD, INTD, EXTD
124
Table 5c Regression coefficients
Model Unstandardized Standardized t Sig. Collinearity Statistics B Std. Error Beta Tolerance VIF
1
(Constant) 1.600 .050 31.995 .000 EXTD .113 .011 .158 9.838 .000 .490 2.043 INTD .023 .013 .402 11.806 .000 .469 2.128 LDD .030 .020 .118 4.558 .004 .548 1.824
POPD .043 .006 .281 7.115 .000 .967 1.034 HID .293 .010 .471 29.119 .000 .483 2.071
a. Dependent Variable: EB
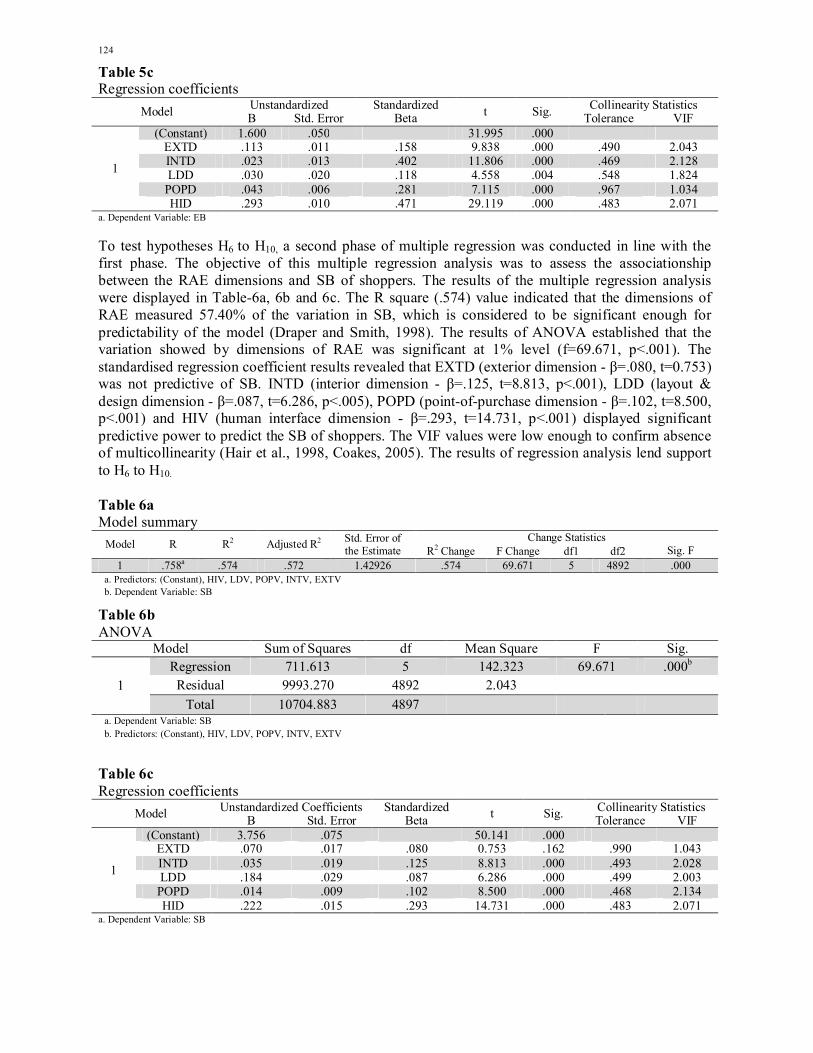
To test hypotheses H6 to H10, a second phase of multiple regression was conducted in line with the first phase. The objective of this multiple regression analysis was to assess the associationship between the RAE dimensions and SB of shoppers. The results of the multiple regression analysis were displayed in Table-6a, 6b and 6c. The R square (.574) value indicated that the dimensions of RAE measured 57.40% of the variation in SB, which is considered to be significant enough for predictability of the model (Draper and Smith, 1998). The results of ANOVA established that the variation showed by dimensions of RAE was significant at 1% level (f=69.671, p<.001). The standardised regression coefficient results revealed that EXTD (exterior dimension - β=.080, t=0.753) was not predictive of SB. INTD (interior dimension - β=.125, t=8.813, p<.001), LDD (layout & design dimension - β=.087, t=6.286, p<.005), POPD (point-of-purchase dimension - β=.102, t=8.500, p<.001) and HIV (human interface dimension - β=.293, t=14.731, p<.001) displayed significant predictive power to predict the SB of shoppers. The VIF values were low enough to confirm absence of multicollinearity (Hair et al., 1998, Coakes, 2005). The results of regression analysis lend support to H6 to H10. Table 6a Model summary
Model R R2 Adjusted R2 Std. Error of the Estimate
Change Statistics R2 Change F Change df1 df2 Sig. F
Change 1 .758a .574 .572 1.42926 .574 69.671 5 4892 .000 a. Predictors: (Constant), HIV, LDV, POPV, INTV, EXTV b. Dependent Variable: SB
Table 6b ANOVA
Model Sum of Squares df Mean Square F Sig.
1 Regression 711.613 5 142.323 69.671 .000b Residual 9993.270 4892 2.043
Total 10704.883 4897 a. Dependent Variable: SB b. Predictors: (Constant), HIV, LDV, POPV, INTV, EXTV
Table 6c Regression coefficients
Model Unstandardized Coefficients Standardized t Sig. Collinearity Statistics B Std. Error Beta Tolerance VIF
1
(Constant) 3.756 .075 50.141 .000 EXTD .070 .017 .080 0.753 .162 .990 1.043 INTD .035 .019 .125 8.813 .000 .493 2.028 LDD .184 .029 .087 6.286 .000 .499 2.003
POPD .014 .009 .102 8.500 .000 .468 2.134 HID .222 .015 .293 14.731 .000 .483 2.071
a. Dependent Variable: SB

A. K. Baksi / Uncertain Supply Chain Management 1 (2013)
125
To test H11, simple regression was applied to assess the strength of associationship between EB and SB and to examine the predictive power of EB to predict SB of shoppers. The results of the simple regression analysis were tabulated in Table-7. The R square value (.643) confirmed an adequate measurement of 64.30% of EB in SB. The results of ANOVA established that the variation showed by EB was significant at 1% level (f=177.560, p<.001). The standardised regression coefficient results (β=.502, t=13.325, p<.001) revealed that EB was predictive of SB of shoppers. H11 was accepted. Table 7 Results of simple regression analysis
Model summary ANOVA Coefficients
Model R R2 Adjusted R2 F Sig.
Unstandardized Coefficients
Standardized Coefficients t Sig.
Collinearity Statistics
B Std. Error
Beta Tolerance VIF
1 .802a .643 .640 177.56 .000b 1.561 .177 8.812 .000
1.000 1.000 .562 .042 .502 13.325 .000
Hierarchical regression analysis was deployed, to test H12 to H14, by considering the dimensional summated composite mean values of the items of the factor constructs: (a) RAE as the independent variable, (b) EB and SB as the dependent variables and (c) CRMD as the mediating variable. For providing empirical evidence to our hypotheses, we proposed an ordinary least square (OLS) regression for our dependent variables EB and SB. The following models were constructed: EB = β0 + β1×RAE + β2×CRMD + β3×CRMD×RAE + εi (1) SB = β0 + β1×RAE + β2×EB +β3×CRMD + β4×CRMD×RAE + β5×CRMD×EB + β6×CRMD×RAE×EB + εi
(2)
The regression models were displayed in Table 8. For Eq. (1) two & for Eq. (2) three regression models were established. For Eq. (1), Model 1 depicted the direct effects of CRMD and RAE on EB and model 2 revealed the binary interaction effects of CRMD and RAE on EB. For Eq. (2), Model 1 depicted the direct effects of CRMD, RAE and EB on SB of shoppers, model 2 established the binary interaction effects of CRMD & RAE and CRMD & EB on SB and model 3 represented the ternary interaction between CRMD, RAE and EB on SB. Standardization was applied to avoid interference with regression coefficients arising out of Multicollinearity between interaction variables (Irwin and McClellan, 2001; Aiken & West, 1991). The VIF (variance inflation factor) corresponding to each independent variable is less than 5, indicating that VIF is well within acceptable limit of 10 (Ranaweera & Neely, 2003). Table 8, for model-1, revealed that the direct effects of CRMD and RAE were significant and predictive of EB, as CRMD was found to have a positive and significant effect on EB (β = .198, t=4.266 p<0.01) and so was RAE (β = .218, t=6.544 p<0.05). Model-1 further disclosed that RAE (β = .757, t=26.416 p<0.01), EB (β = .141, t=3.259 p<0.01) and CRMD (β = .973, t=19.866 p<0.01) were strongly associated with SB and that SB of shoppers can be predicted on the basis of the same. Model-2 revealed that the binary interaction between CRMD and RAE indicated that CRMD had a strong intervening effect on EB (β =.249, t=8.187 p<0.01) and SB (β =.873, t=39.968 p<0.01). Model-3 represented the ternary interaction and revealed that with the increase in the mediating effect of CRMD performance (β = -.172, t=12.32, p<0.01), the combined impact of RAE and EB increases on SB. The results of hierarchical regression supported H12, H13 and H14.
Confirmatory factor analysis (CFA) was applied to assess the convergence, discriminant validity and dimensionality for each construct to determine whether all the 52 items (Table-2) measure the construct adequately as they had been assigned for. LISREL 9.90 programme was used to conduct the Structural Equation Modeling (SEM) and Maximum Likelihood Estimation (MLE) was applied to estimate the CFA models. A number of fit-statistics were obtained (Table-9) for the default (proposed) model. The comparative fit indices namely CFI (0.983), NFI (0.989) and TLI (0.974) were found significant enough to accept the fitness of the default (proposed) model (Schreiber et al., 2006,

126
Bentler, 1992). The Parsimonious fit indices (PNFI=0.769, PCFI=0.787, PGFI=0.747) also confirmed robustness of the model and indicated an absolute fit (Schreiber et al., 2006). The GFI (0.978) and AGFI (0.975) scores for all the constructs were found to be consistently >.900 indicating that a significant proportion of the variance in the sample variance-covariance matrix is accounted for by the model and a good fit has been achieved (Hair et al., 1998; Baumgartner and Homburg, 1996; Hulland et al., 1996; Kline, 1998; Holmes-Smith, 2002, Byrne, 2001).
Table 8 Hierarchical regression models testing the interaction effects between constructs Independent/Mediating
Variables
Dependent variable: EB Model-1 β /t /Sig.
Model-2 β/t/Sig.
Model-3 β/t/Sig. Tolerance VIF
RAE .218/6.544/.000 .426 2.342 CRMD .198/4.266/.000 .448 2.229
Binary interaction effects CRMD×RAE .249/8.187/.000 .367 2.719
R square .487 .423 F 12.365 8.705
Sig. .000 .000 Dependent variable: SB
RAE .757/26.416/.000 .497 2.009 EB .141/3.259/.001 .464 2.154
CRMD .973/19.866/.000 .477 2.093 Binary interaction effects
CRMD×RAE .873/39.968/.000 .506 1.974 CRMD×EB .026/.909/.364 .438 2.278
Ternary interaction effects CRMD×RAE×EB .781/18.665/.000 .503 1.987
R2 .492 .579 .760 F 10.624 361.239 552.943
Sig. .001 .000 .000
The expected cross-validation index was found to be small enough (ECVI=0.0019) to confirm the superiority of the default model to the saturated and independence model. The RMSEA value obtained (0.047) is < 0.08 for an adequate model fit (Hu & Bentler, 1999). The RMR value (0.003) is small enough (close to 0.00) to assure a robust-fit of the model. The SRMR value was also indicative of good fit (0.0287 which is ≤.08) (Schreiber et al., 2006, Anglim, 2007). The probability value of Chi-square (χ2=176.11, df=93, p=0.000) is more than the conventional 0.05 level (P=0.02) indicating an absolute fit of the model to the data and the χ2/df value is ≤ 2 (1.89) suggesting its usefulness to justify the default model as the nested model. Table 9 Fit indices for the default model
Absolute predictive fit Comparative fit Parsimonious fit Others χ2 df P ECVI NFI TLI CFI PNFI PCFI PGFI GFI AGFI RMR SRMR RMSEA
176.11 93 0.02 0.0019 0.989 0.974 0.993 0.769 0.787 0.747 0.978 0.975 0.003 0.0287 0.047 To construct the nomological network structural equation modeling (SEM) was used to test the nomological validity of the proposed research model. Composite CRMD, SQ, CS, CR, RI and SC scores across individual items were obtained by summating the ratings on the scale provided in the survey instrument items which were used as indicators of their latent version.

A. K. Baksi / Uncertain Supply Chain Management 1 (2013)
127
Structural Equation Modeling (SEM) was used to test the relationship among the constructs. All the 16 paths (including direct and indirect effects) and 10 paths (depicting moderating effects) drawn were found to be significant at both p<0.01 and p<0.05 levels. The research model holds well (Fig.2) as the fit-indices supported adequately the model fit to the data. The double-curved arrows indicated correlation between the exogenous and endogenous observed variables which was found significant. The residual variables (error variances) are indicated by Є1, Є2, Є3, etc. The regression weights are represented by λ. The relationship between the exogenous variables was represented by β. One of the factor loading was fixed to ‘1’ to provide the latent factors an interpretable scale (Hox & Bechger).
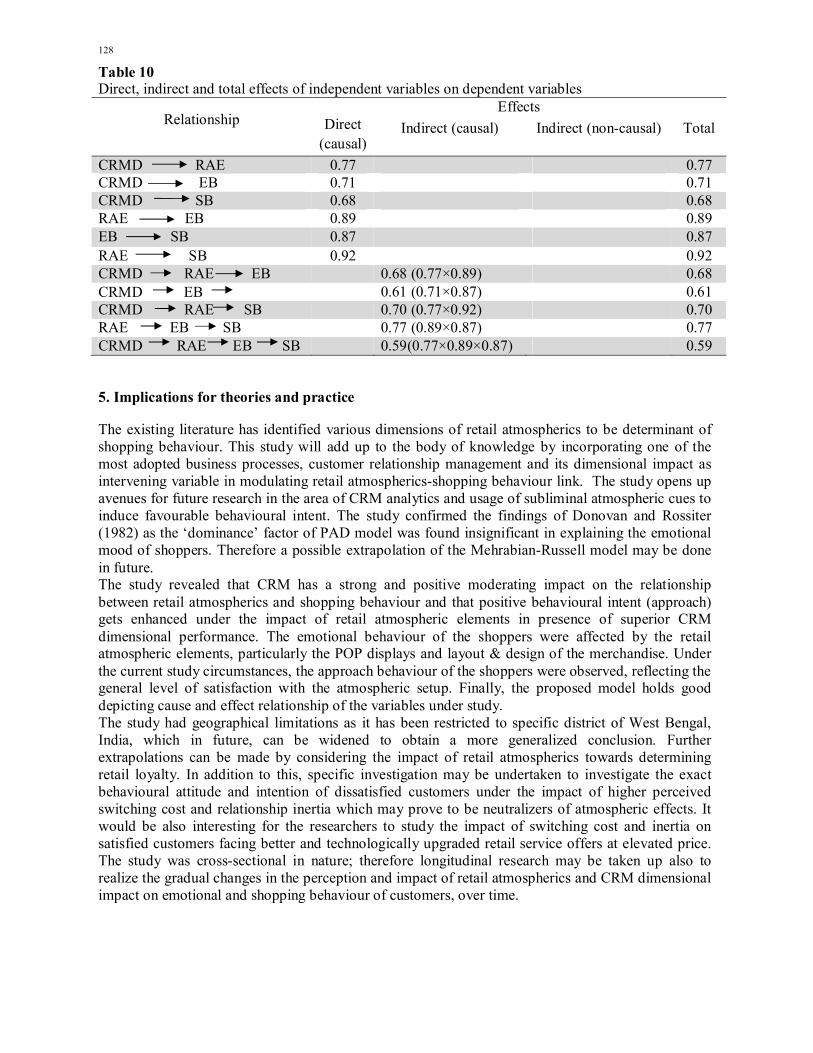
Fig. 2. Structural model showing the path analysis Indicates mediating effects The direct and indirect effects of the constructs were calculated and tabulated in Table-10. Since there was an absence of indirect non-causal effect, model respecification was not required (Hair et al., 2010).
EB1
EB
SB
EB2
EB3
SB1
SB2
SB3
CRMD
Є5-1.18
Є6-1.20
Є7-1.27
Є8-1.23
Є9-1.16
λ4=0.89
λ5=0.81
λ6=0.85
λ7=0.91
λ8=0.88
λ9=0.86
γ1=0.89
γ2=0.87
γ3=0.92
RAE
RAE1
RAE2
RAE3
Є1-1.32
Є2-1.29
Є3-1.19
Є4-1.41
λ1=1.00
λ3=0.91
λ2=0.94
β1=0.93
β2=0.91
β3=0.88
β4=0.90
β5=0.87
β6=0.91
β7=0.75
β8=0.71
β=0.249, t=8.187, p<0.01
β=0.873, t=39.968, p<0.01
not significant
γ4=0.77
γ6=0.68
γ5=0.71
128
Table 10 Direct, indirect and total effects of independent variables on dependent variables
Relationship Effects
Direct (causal)
Indirect (causal) Indirect (non-causal) Total
CRMD RAE 0.77 0.77 CRMD EB 0.71 0.71 CRMD SB 0.68 0.68 RAE EB 0.89 0.89 EB SB 0.87 0.87 RAE SB 0.92 0.92 CRMD RAE EB 0.68 (0.77×0.89) 0.68 CRMD EB 0.61 (0.71×0.87) 0.61 CRMD RAE SB 0.70 (0.77×0.92) 0.70 RAE EB SB 0.77 (0.89×0.87) 0.77 CRMD RAE EB SB 0.59(0.77×0.89×0.87) 0.59
5. Implications for theories and practice
The existing literature has identified various dimensions of retail atmospherics to be determinant of shopping behaviour. This study will add up to the body of knowledge by incorporating one of the most adopted business processes, customer relationship management and its dimensional impact as intervening variable in modulating retail atmospherics-shopping behaviour link. The study opens up avenues for future research in the area of CRM analytics and usage of subliminal atmospheric cues to induce favourable behavioural intent. The study confirmed the findings of Donovan and Rossiter (1982) as the ‘dominance’ factor of PAD model was found insignificant in explaining the emotional mood of shoppers. Therefore a possible extrapolation of the Mehrabian-Russell model may be done in future. The study revealed that CRM has a strong and positive moderating impact on the relationship between retail atmospherics and shopping behaviour and that positive behavioural intent (approach) gets enhanced under the impact of retail atmospheric elements in presence of superior CRM dimensional performance. The emotional behaviour of the shoppers were affected by the retail atmospheric elements, particularly the POP displays and layout & design of the merchandise. Under the current study circumstances, the approach behaviour of the shoppers were observed, reflecting the general level of satisfaction with the atmospheric setup. Finally, the proposed model holds good depicting cause and effect relationship of the variables under study. The study had geographical limitations as it has been restricted to specific district of West Bengal, India, which in future, can be widened to obtain a more generalized conclusion. Further extrapolations can be made by considering the impact of retail atmospherics towards determining retail loyalty. In addition to this, specific investigation may be undertaken to investigate the exact behavioural attitude and intention of dissatisfied customers under the impact of higher perceived switching cost and relationship inertia which may prove to be neutralizers of atmospheric effects. It would be also interesting for the researchers to study the impact of switching cost and inertia on satisfied customers facing better and technologically upgraded retail service offers at elevated price. The study was cross-sectional in nature; therefore longitudinal research may be taken up also to realize the gradual changes in the perception and impact of retail atmospherics and CRM dimensional impact on emotional and shopping behaviour of customers, over time.
A. K. Baksi / Uncertain Supply Chain Management 1 (2013)
129
References
Ang, S.H., Leong, S.M., & Lim, J. (1997). The mediating influence of pleasure and arousal on layout and signage effects. Journal of Retailing and Consumer Services, 4(1), 13-24.
Ahmed, P.K., & Rafiq, M. (2003). Internal marketing issues and challenges. European Journal of Marketing, 37(9), 1177-1186
Areni, C. S., & Kim, D. (1993), The influence of background music on shopping behavior: Classical versus top-forty music in a wine store, Advances in consumer research, Leigh McAlister and Michael L. Rothschild (Eds.), Provo, UT: Association for Consumer Research: 336-340.
Areni, C. S., & Kim, D. (1995). The Influence of In-Store Lighting on Consumers’ Examination of Merchandise in a Wine Store. International Journal of Research in Marketing, 11 (4), 117-125.
Armstrong, G., & Kotler, P. (2003). Marketing: An introduction, 6th ed., Upper Saddle River, NJ: Prentice Hall.
d’ Astous, A. (2000). Irritating aspects of the shopping environment. Journal of Business Research, 49(2), 149-156
Babin, B.J., Hardesty, D.A., & Suter, T. (2003). Color and shopping intentions: the intervening effect of price fairness and perceived affect. Journal of Business Research, 56(July), 541– 251.
Bailey, N., & Areni, C. (2006). When a few minutes sound like a lifetime: does atmospheric music expand or contract perceived time? Journal of Retailing, 82(3), 189-202.
Baker, J., Parasuraman, A., Grewal, D., & Voss, G.B. (2002). The influence of multiple store environment cues on perceived merchandise value and patronage intention. Journal of Marketing, 66(2), 120-141.
Baron, R.A., Rea, M.S., & Daniels, S.G. (1992). Effects of indoor lighting (illuminance and spectral distribution) on the performance of cognitive task and interpersonal behaviors: The potential mediating role of positive effect. Motivation and Emotion, 1, 1-33.
Baker, J., Grewal, D., & Parasuraman, A. (1994). The influence of store environment on quality inferences and store image. Journal of Academy of Marketing Science, 22(4), 328-339.
Bawa, K., Landwehr, J.T. & Krishna, A.A. (1989). Consumer response to retailers’ marketing environments: an analysis of coffee purchase data. Journal of Retailing, 65(4), 471-495
Bellizzi, J., & Hite, R. (1992). Environmental colour, consumer feelings and purchase likelihood. Psychology and Marketing, 9(5), 347-363.
Beverland, M. (2001). Contextual influences and the adoption and practice of relationship selling in a business-to-business setting: An exploratory study. Journal of Personal Selling & Sales Management, 21, (3), 207-15.
Bone, P.F., & Ellen, P.S. (1989) Scents in the marketplace: explaining a fraction of olfaction. Journal of Retailing, 75(2), 243–262.
Broekemier, G., Marquardt, R., & Gentry, J. (2008). An exploration of happy/sad and liked/disliked music effects on shopping intentions in a woman’s clothing store service setting. Journal of Services Marketing, 22(1), 59-67.
Brown, S.A. (2000). Customer relationship management: A strategic imperative in the world of e-business. Canada, John-Wiley & Sons.
Brohman, M.K., Richard T. Watson, Gabriele Piccoli, and A. Parasuraman (2003). Data completeness: A key to effective net-based customer service systems. Communications of the ACM, 46 (6), 47–51.
Butler, S. (2000). Changing the game: CRM in the E-world. Journal of Business Strategy, 21(2), 13-14.
Chebat, J.C., & Michon, R. (2003). Impact of ambient odors on mall shoppers’ emotions, cognition and spending: a test of competitive causal theories. Journal of Business Research, 56, 529-539
Cornelius, B., Natter, M., and Faure, C. (2010). How store front displays influence retail store image. Journal of Retail and Consumer Services, 17, 143-151.
Dargah, D.B., & Golrokhsari, H. (2012). The application of CRM system in retail industry. Journal of Advanced Social Research, 2(5), 260-268.

130
Dennis, C., & Newman, A. (2005). Modeling the effects of mall atmospherics and shoppers’ approach behaviours. Brunel Business School Working Paper Series: Special issue on Marketing, 2, 1-32.
Din,R. (2000). NewRetail. London: Conran Octopus. Donovan, R.J., & Rossiter, J. (1982). Store atmosphere: An environmental psychology approach.
Journal of Retailing, 58, 34-57. Donovan, R.J., Rossiter, R.J., Marcoolyn, G., & Nesdale, A. (1994). Store atmosphere and purchasing
behaviour. Journal of Retailing, 70(3), 283-294. Dubé, L., & Morin, S. (2001). Background music pleasure and store evaluation: intensity effects and
psychological mechanisms. Journal of Business Research, 54(2), 107-113. Eroglu, S.A., & Machleit, K.A. (1990). An empirical study of retail crowding: Antecedents and
consequences. Journal of Retailing, 66, 201–221. Espinoza, F., Liberali, G., & D’Angelo, A. (2004). Testing the influence of retail atmosphere on store
choice criteria, perceived value and patronage intention. Winter Educators’ Conference Proceedings, American Marketing Association, Scottsdale, USA, 15, 120-125.
Fiore, A.M., Yah, X., & Yoh, E. (2000). Effects of a product display and environmental fragrancing on approach responses and pleasurable experiences. Psychology Marketing, 17(1), 27 – 54.
Foxall, G.R., & Soriano, M.Y. (2005). Situational influences on consumers’ attitudes and behaviour. Journal of Business Research, 58(4), 518-525.
Freeland, J. (2003). HBR case commentary: What can Barry do to save the project? Harvard Business Review, 81(12), 38.
Foxall, G. R. (2002). Consumer Behavior Analysis: Critical Perspectives, Routledge. Garlin, F., & Owen, K. (2006). Setting the tone with the tune: A meta-analytic review of the effects
of background music in retail settings. Journal of Business Research, 59, 755-764. Gilaninia, S., & Ghashlagh, B.G. (2012). Relationship marketing system and its impact on customer
buying behavior. Journal of Basic Applied Science and Research, 2(3), 2473-2480. Gustafsson, A., Johnson, M.D. & Roos, I. (2005). The effects of customer satisfaction, relationship
commitment dimensions, and triggers on customer retention. Journal of Marketing, 69 (October), 210–18.
Hirsch, A.R. (1995). Effects of ambient odors on slot machine usage in a Las Vegas casino. Psychological Marketing, 12(7), 585– 594.
Hofstede, G. (2011). Cultural Dimensions.com Available at: http://www.geert-hofstede.com/hofstede_taiwan.shtml [Accessed February, 27th , 2013].
Homburg, C., Workman, J.P., & Jensen, O. (2000). Fundamental changes in marketing organization: The movement towards a customer-focused organizational structure. Journal of the Academy of Marketing Science, 28(4), 459-478
Hui, M., & Bateson, J. (1991). Perceived control and the effects of crowding and consumer choice on the service experience. Journal of Consumer Research, 18, 174-184.
Hutton, J.D. & Richardson, L.D. (1995). Healthscapes: the role of the facility and physical environment on consumer attitudes, satisfaction, quality assessments, and behaviors. Health Care Management Review, 20(2), 48-61
Inman, J.J., Winer, R.S. & Ferraro, R. (2009). The interplay among category characteristics, customer characteristics, and customer activities on instore decision making. Journal of Marketing, 73(5), 19-29.
Jain, D. and Singh, S.S. (2002). Customer lifetime value research in marketing: A review and future directions. Journal of Interactive Marketing, 16(2), 34-46.
Knasko, S.C. (1993) Lingering time in a museum in the presence of congruent and incongruent odors. Chemical Senses 18(October), 581.
Kotler, P. (1974). Atmospherics as a marketing tool. Journal of Retailing, 49, 48-64. Kumar, I., Garg, R. and Rahman, Z. (2010). Influence of retail atmospherics on customer value in an
emerging market condition. Great Lakes Herald, 4(1), 1-9.

A. K. Baksi / Uncertain Supply Chain Management 1 (2013)
131
Kumar, S. A., Mani, B. T., Mahalingam, S., and Vanjikovan, M. (2010). Influence of Service Quality on Attitudinal Loyalty in Private Retail Banking: an empirical study. IUP Journal of Management Research, 9(4), 21-38.
Levy, M. & Weitz, B.A. (2009). Retailing Management. 7th ed., Boston, USA: Irwin. Li, J, G.T., Kim, J. O. & Lee, S.Y. (2009). An empirical examination of perceived retail crowding,
emotions, and retail outcomes. Service Industries Journal, 29(5), 635-652. Machleit, K.A., Eroglu, S.A., & Powell, M. S. (2000). Perceived retail crowding and shopping
satisfaction: what modifies this relationship? Journal of Consumer Psychology, 9(1), 29– 42. Machleit, K.A. and Mantel, S.P. (2001). Emotional response and shopping satisfaction:
Moderating effects of shopper attributions. Journal of Business Research, 54(2), 97-106. Massicotte, M., Michon, R., Chebat, J., Sirgy, M.J., & Borges, A. (2011). Effects of mall
atmosphere on mall evaluation: Teenage versus adult shoppers. Journal of Retailing and Consumer Services, 18, 74-80.
Mathwick, C., Malhotra, N.K., & Rigdon, E. (2002). The effect of dynamic retail experience on experimental perception of value: an internet and catalogue comparison. Journal of Retailing, 78, 51-60.
Mattila, A.S., & Wirtz, J. (2001). Congruency of scent and music as a driver of in-store evaluations and behaviour. Journal of Retailing, 77(2), 273-289.
Mehrabian, A., & Russell, J. (1974). An approach to environmental psychology. Cambridge, MA: MIT Press.
Michon, R., Chebat, J.C., & Turley, L.W. (2005). Mall atmospherics: The interaction effects of the mall environment on shopping behaviour. Journal of Business Research, 58(5), 576-583.
Milliman, R. (1982). Using background music to affect the behaviour of supermarket shoppers. Journal of Marketing, 46, 86-91.
Mithas, S., Jones, J. L., Krishnan, M. S., & Fornell, C. (2005). A theoretical integration of technology adoption and business value literature: The case of CRM systems. Working paper, Ross School of Business, Univ. Michigan.
Morin, S., Dube, L., & Chebat, J. (2007). The role of pleasant music in servicescapes: A test of the dual model of environmental perception. Journal of Retailing, 83, 115-130.
Morrin, M., & Ratneshwar, R. (2000). The impact of ambient scent on evaluation, attention and memory for familiar and unfamiliar brands. Journal of Business Research,49(2),157– 66.
Newman, A.J. (2002). Some manipulable elements of service setting and their impact on company image and reputation. International Journal of New Product Development and Innovation Management, 4(3), 287-304
Ng, C.F. (2003). Satisfying shoppers’ psychological needs: From public market to cyber mall. Environmental Psychological, 23, 439-455.
Oakes, S. & North, A.C. (2008). Using music to influence cognitive and affective responses in queues of low and high crowd density. Journal of Marketing Management, 24(5-6), 589-602
Pan, F. C., Su, S. J., & Chiang, C. C. (2008). Dual attractiveness of winery: atmospheric cues on purchasing. International Journal of Wine Business Research, 20(2), 95-110.
Payne, A. (2009). Handbook of CRM: Achieving Excellence in Customer Management. Oxford: Butterworth-Heinemann.
Pepperd, J. (2000). Customer relationship management (CRM) in financial services. European Management Journal, 18(3), 312-327.
Plessis, M. D., & Boon, J. A. (2004). Knowledge management in eBusiness and customer relationship management: South African case study findings. International Journal of Information Management, 24(1), 73-86.
Raajpoot, N.A., Sharma, A. & Chebat, J. C. (2008). The role of gender and work status in shopping center patronage. Journal of Business Research, 61(8), 825-833.
Rigby, D., & Ledingham, D. (2004). CRM done right. Harvard Business Review, 80(2), 101-109. Russell, J.A., & Pratt, G. (1980). A description of the affective quality attributed to environments.
Journal of Personality and Social Psychology, 38(2), 311-322.

132
Ryals, L., & Knox, S. (2001). Cross-functional issues in the implementation of relationship marketing through customer relationship management. European Management Journal, 19(5), 534-542.
Sheth, J.N., Sisodia, R.S., & Sharma, A. (2000). The antecedents and consequences of customer centric marketing. Journal of the Academy of Marketing Science, 28(1), 55-66.
Sherman, E., & Smith, R.B. (1987). Mood states of shoppers and store image: promising interactions and possible behavioural effect. Advances in Consumer Research, 14(1), 251-254
Spangenberg, E.R., Crowley, A, & Henderson, P.W. (1996). Improving the store environment: do olfactory cues affect evaluations and behaviors? Journal of Marketing, 60, 67– 80 [April].
Spangenberg, E., Grohmann, B., & Sprott, D. (2005). It’s beginning to smell (and sound) a lot like Christmas: The interactive effects of ambient scent and music in a retail setting. Journal of Business Research, 58, 1583-1589.
Spies, K., Hesse, F., & Loesch, K. (1997). Store atmosphere, mood and purchasing behaviour. International Journal of Research in Marketing, 14, 1-17.
Smith, P.C., & Curnow, R. (1996). Arousal hypotheses and the effects of music on purchasing behavior. Journal of Applied Psychology, 50(3), 255-256.
Srinivasan, S.S., Anderson, R.E., & Ponnavolu, K. (2002). Customer loyalty in e-commerce: An exploration of its antecedents and consequences. Journal of Retailing, 78(1), 41-50
Srivastava, R.K., Tasadduq, A.S., & Fahey, L. (1999). Marketing, business processes and shareholder value: An organizationally embedded view of marketing activities and the discipline of marketing. Journal of Marketing, 63(4), 168-179
Schmid, J. and Weber, A. (1998). Desktop database marketing. IL: NIC Business Books. Stefanou, C., Sarmaniotis, C., & Stafyla, A. (2003). CRM and customer centric knowledge
management: An empirical research. Business Process Management Journal, 9(5), 617-634. Stringfellow, A., Nie, W., & Bowen, D.E. (2004). Profiting from understanding customer needs.
Business Horizons, 47(5), 45-52. Turley, L.W., & Milliman, R.E. (2000). Atmospheric effects on shopping behaviour: review of the
experimental evidence. Journal of Business Research, 49, 193-211. Underhill, P. (1999). Why we buy, the science of shopping. New York: Simon & Schuster. Vandermerwe, S. (2004). Achieving deep customer focus. MIT Sloan Management Review, 45(3),
26-34. Verhoef, P.C. (2003). Understanding the Effect of Customer Relationship Management Efforts on
Customer Retention and Customer Share Development. Journal of Marketing, 67, 30–45. Vrechopoulos, A.P. (2004). Mass customization challenges in internet retailing through information
management. International Journal of Information Management, 24, 59-71. Wakefield, K.I., & Baker, J. (1998). Excitement at the mall: determinants and effects on shopping
response. Journal of Retail, 74(4), 515-539 Whiting, A. (2009). Push, scream, or leave: how do consumers cope with crowded retail stores?
Journal of Services Marketing, 23(6-7), 487- 494 Widmier, S, M., Jackson, D.W., & Mccabe, D.B. (2002). Infusing technology into personal selling.
Journal of Personal Selling & Sales Management, 22(3), 189-198. Woodruffe-Burton, H., & Wakenshaw, S. (2011). Revisiting experimental values of shopping:
consumers’ self and identity. Marketing Intelligence and Planning, 29(1), 69-85. Yaleh, R., & Spangenberg, E. (2000). The effects of music in a retail setting on real and perceived
shopping times. Journal of Business Research, 49, 139-147. Yim, F.H.K., Anderson, R.E., & Swaminathan, S. (2004). Customer relationship management: Its
dimensions and effect on customer outcomes. Journal of Personal Selling & Sales Management, 25(4), 265-280.