Embed Size (px)
Citation preview
1
UNC Student Research on Natural Disasters and Vulnerability in Beaufort County, NC
ENST 698
Instructor: David Salvesen
April 25, 2014
Emily Bowe, Chelsea Fizer, Ben Gellman, Maddie Hindenlang, Michelle Kurkowski, Daniel
Sebastian, Natalie Thomas and Audrey Willis
2
Acknowledgements
We would like to thank our partners in Beaufort County, without whom our project would not
have been possible, for welcoming us into their community, and for all of their work and
support. In particular, John Pack (Emergency Management Coordinator), Lisa Respess
(Emergency Services Specialist), Randell Woodruff (Beaufort County Manager), Marty Dail
from the Belhaven Senior Resource Center, Carolyne Everett from the Grace Martin Harwell
Senior Center, Gray Hodges (Transportation Manager for Beaufort County Area Transit), Chris
Kiricoples (CEO of Beaufort County Developmental Center), Esperanza Ornelas from Social
Services, Blair Bergevin (Executive Director of The Blind Center of North Carolina), Patricia
Patterson (Program Coordinator for The Blind Center), the North Carolina State Highway Patrol,
Adam Congleton (Program Director of LifeQuest), Jeff Bell from Country Living Group Homes,
Ted Wallace (Emergency Supervisor for PotashCorp Aurora), Curtis Avery (Beaufort County
Fire Marshal), Gwen Leverett (Belhaven Town Manager) , Peter Budge (Belhaven Building
Inspector), Phillip Nepper (Rail Switch Operator) and all those interviewed who provided
assistance and input that facilitated our project.
This project would not have been possible without the support and guidance of Dr. David
Salvesen and Carl Kolosna.

3
Executive Summary
Located on the coast of North Carolina, Beaufort County is exposed to a number of different
natural hazards that threaten the safety and well-being of its residents. Flooding and hurricanes
are among the most frequent and damaging of these hazards. Our team was asked by Beaufort
County Emergency Management to identify areas and populations in the county that are most
vulnerable to coastal hazards, sea level rise and manmade hazards such as freight train accidents.
We used a combination of geospatial data and primary data from focus groups and key informant
interviews to draw conclusions about the county’s vulnerability.
Our project focused mainly on social vulnerability, or the risks people face as a result of their
socioeconomic circumstances. Since we are concerned with natural and manmade disasters in
Beaufort County, social vulnerability in this context refers to the ways in which social factors
exacerbate risks to disasters. We were also tasked by the County Emergency Management
Coordinator with identifying major sources of physical risk from train derailments and cargo
spills.
In order to assess social vulnerability within the county, we constructed a vulnerability index that
provided a way to quantify an otherwise fairly abstract topic. For this index, we worked with five
indicators of social vulnerability: age, disability status, minority status, median income and
access to transportation. We also created a map of the train routes in the county to identify areas
that might be affected in the case of a derailment. This map included buffers of different
distances drawn around the tracks where we knew that dangerous chemicals were shipped. We
complemented that quantitative data by conducting two focus groups with residents and
interviewing seven key informants.
Overall from our discussions with residents, we concluded that Hurricane Irene from 2011 was a
turning point for the county as far as damage and disaster awareness. After this storm, people
realized the danger that hurricanes posed to them and their homes. Many people began to
recognize the importance of evacuation and safety precautions. The county started implementing
more methods to mitigate future disasters, such as raising the homes in Belhaven.
During the focus groups, we identified several key factors that influence Beaufort County’s
vulnerability to natural and manmade hazards. We learned about practical reasons why people
would stay in their homes rather than heed warnings to evacuate in the event of a natural disaster.
Some of these include not wanting to leave their pets or possessions, not wanting to deal with
law enforcement (in the case of undocumented residents), and not believing that they are in
significant danger. According to the participants, the people who had recently moved to the area
ended up being hardest hit by natural disasters such as hurricanes. One point that came up

4
repeatedly was the idea of autonomy. Many people in the focus groups expressed the belief that
although the county had resources available to help in the event of a disaster, in the end they had
to rely on themselves.
From our interviews and focus groups, we were able to conclude that the most vulnerable
populations are those with disabilities, the elderly, non-English speakers and new residents.
However, the vulnerability of individuals in these groups is lessened if they have family or
friends to rely on and heightened if they do not.
We found that the county has already taken many steps to assist individuals during natural
disasters. We also found that, as expected, the vulnerabilities to train derailment were low. In
addition, there has never been a train crash reported in Beaufort County. However, we
pinpointed several sources of vulnerability in Beaufort County and were able to recommend
several courses of action relating to assistance for non-English speakers, communication between
state and county governments and means for preventing train accidents.
One of our greatest limitations was the availability of Census data. Had data for indicators of
social vulnerability been available on a block or block-group level, we would have been able to
better pinpoint specific areas of vulnerability. Additionally, we were limited by time, resources
and distance from our client in this project.
We came into our focus groups and interviews with pre-determined ideas of which groups were
vulnerable and asked a lot of leading questions that did not always allow residents to describe the
groups that they personally saw as vulnerable. We initially saw vulnerability as a black or white
designation; however, we found from talking with residents that vulnerability is much more of a
spectrum. We found that certain groups, such as elderly individuals with personal vehicles, were
less vulnerable than expected, whereas other groups, such as new residents, were hidden pockets
of vulnerability. In addition, showing pre-determined maps of social vulnerability limited the
amount of feedback that we were able to receive from our key informant interviews. In the
future, we would attempt to enter into our conversations with residents without any bias on who
we believed to be vulnerable, and simply use information gathered to draw maps of social
vulnerability.

5
Introduction
Project Description
Located on the coast of North Carolina, Beaufort County is exposed to a number of different
natural hazards that threaten the safety and well-being of its residents. Our team was asked by
Beaufort County Emergency Management to identify the areas that are most vulnerable to
coastal hazards, sea level rise and manmade hazards such as freight train accidents. We used a
combination of geospatial data and primary data from focus groups and key informant interviews
to draw conclusions about the county’s vulnerability.
Our project focused mainly on social vulnerability, which refers to the risks people face as a
result of their socioeconomic circumstances. There are a variety of possible ways to define social
vulnerability. In general, it refers to the social circumstances that place an individual or group of
people at a heightened risk. In general, vulnerability is related to risk for loss, something that
depends on social circumstances (Cutter et al., 2003). Since we are concerned with natural and
manmade disasters in Beaufort County, social vulnerability in this context refers to the ways in
which social factors exacerbate risks to disasters. Social vulnerability is typically related to a
number of indicators: age, minority status, disability status, education, income, English
proficiency, and access to transportation (Ibid.).
We were also tasked by the County Emergency Management Coordinator with identifying major
sources of physical risk from train derailments and cargo spills. We focused on the railroads in
the county and their cargo, and through mapping and research we attempted to identify
populations that would be particularly vulnerable to rail accidents.
Ideally, the results from this project will help the county generate new knowledge that can
inform current policy and will enhance the resilience of the county to future disasters. The results
of the vulnerability analyses are displayed in maps that visually answer the question of which
areas of the county contain higher percentages of people who would be particularly vulnerable if
a natural or manmade disaster were to happen.
Through the focus groups we tried to get a sense of how individuals in groups that we identified
as vulnerable perceive their own ability to avoid harm in a natural disaster. Resident input was a
crucial consideration in determining which areas of the county are at the greatest risk. The focus
groups were an attempt to address this question of perceived vulnerability by talking to the
residents about their experiences with natural hazards, their perceived vulnerability and about
any steps that they have taken to reduce their risk.

6
Beaufort County
Beaufort County spans 959 square miles and contains seven incorporated municipalities:
Washington, Washington Park, Pantego, Aurora, Belhaven, Bath, and Chocowinity (see Figure 1
above). It is a unique county in that the Tar-Pamlico River effectively divides it into northern and
southern halves. The total county population increased from 42,283 in 1990 to 44,958 in 2000
and 47,759 in 2010. These modest population increases were mostly due to growth in the
county’s unincorporated areas. Notably, the population is aging; Beaufort County’s age 55 and
older population grew faster than the county as a whole from 1990 to 2010. The unemployment
rate in Beaufort County is higher than that the statewide average and increased from 8.6% to
9.7% between 2003 and 2013, while the rate in North Carolina increased from 6.5% to 8.0%. Per
capita income increased by 16.1% for the county between 1990 and 2000 and grew closer to the
overall per capita income for North Carolina, but fell by 5.8% from 2000 to 2010.
Year 1990 2000 2010
County Population 42,283 44,958 47,759
Percent Population Age 55+ 25.3% 27.4% 34.0%
County Unemployment Rate 3.8% 8.6% (2003) 9.7% (2013)
NC Unemployment Rate 3.1% 6.5% (2003) 8.0% (2013)
Per capita Income (2010
Dollars)
$18,855 $21,887 $20,615

7
Because of its proximity to the Tar-Pamlico and Pungo Rivers and the Atlantic coast, the county
is at risk for a variety of natural disasters. According to the 2010 Beaufort County Hazard
Mitigation Plan, severe winter storms pose the greatest risk to county residents, followed by
hurricanes, tornadoes, thunderstorms and flooding. Water accounts for almost 14% of the county
by area. The county has 780.1 miles of shoreline, the most of any county in the state, which
explains the vulnerability of homes and other buildings to flooding, especially in river valleys
and along the coast. These risks are thoroughly explained in the county’s Hazard Mitigation
Plan, which was created in 2010. In this report, we expand on the existing body of information
provided by the Hazard Mitigation Plan by examining social vulnerability of the population of
Beaufort County.
Methods
Maps
Social Vulnerability Maps
In order to assess social vulnerability within the county, we constructed a vulnerability index that
provided a way to quantify an otherwise fairly abstract topic. For this index, we worked with five
indicators of social vulnerability: age, disability status, minority status, median income and
access to transportation. We chose these factors because they have been established to be a
useful measure for social vulnerability (Cutter et. al., 2003; Patterson et. al., 2009). These are
factors that, in theory, could increase an individual’s vulnerability in the event of a natural
disaster. The data were obtained at the census tract level from the 2010 United States Census and
the 2012 American Community Survey. All five indicators were split into four categories and
assigned a numerical value of 0-3, with 3 indicating highest vulnerability and 0 corresponding to
minimal vulnerability from that factor (see Appendix Table 1). For each of these variables, we
created an individual map to display the spatial variation of that particular indicator within the
county (figures 2-6).

8
Figure 2: Elderly population Figure 3: Persons with disabilities
Figure 4: Median income Figure 5: Minority population
Figure 6: Vehicle ownership

9
The integer values from each of these five indicators were then added together and combined
into one index. As each indicator had a minimum value of 0 and a maximum value of 3, the total
index ranges from 0 to 15, with higher numbers corresponding to higher vulnerability. In the
map shown in Figure 7 below, these numbers are further assigned various values in order to
qualify their meaning (see Appendix, Table 2).
Figure 7
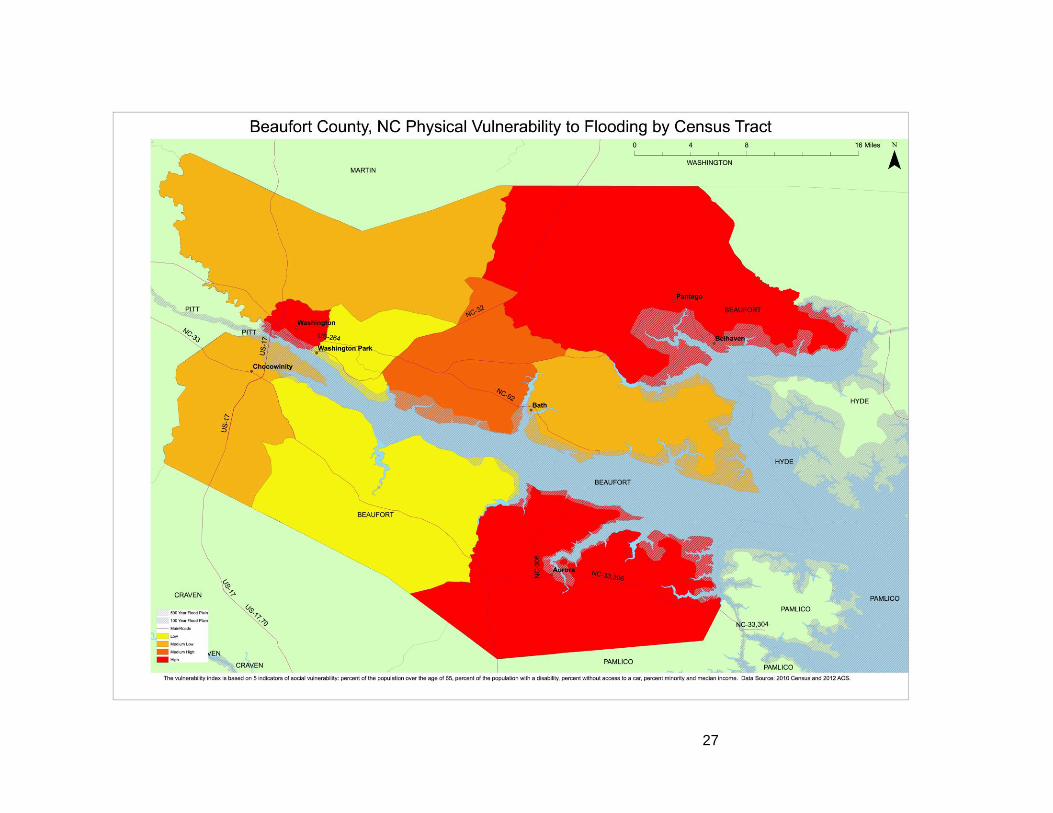
Since Beaufort County is particularly at risk for flooding, we thought it was important to indicate
the physical vulnerability to flooding throughout the county. We did this by including the 100-
year and 500-year flood plains according to data from the US Federal Emergency Management
Agency (FEMA). The 100-year and 500-year floodplains represent the areas that have a 1%
chance and a 0.2% chance of experiencing a flood each year, respectively. This was all combined
into one final map showing how the socially vulnerable locations are distributed within the
county, the areas of greatest physical vulnerability to flooding, and the implications of the
overlap of these two. As expected, we found that the most vulnerable areas of the county were
census tracts including Washington, Belhaven and Aurora. Beaufort County is unusual among
North Carolina coastal counties in that vulnerable populations are generally concentrated in the
east. Because of the coarse nature of our census data, it is difficult to identify specific
communities or towns that are vulnerable to natural disasters. From the map of physical
vulnerability, it is clear that there are four Beaufort County municipalities within the 100-year

10
floodplain: Belhaven, Aurora, Bath and Washington Park.
Figure 8
Train Maps
In order to investigate Beaufort County’s vulnerability to train cargo, we created a series of
buffers around railroad tracks where we knew that dangerous chemicals were shipped. During
our February 21st, 2014 meeting with Ted Wallace, Security and Emergency Response
Supervisor for PotashCorp Aurora, we were told that trains going to and from the plant did not
cross a bridge to the northern half of the county. In response to this information, we decided to
focus our analysis solely on the southern half of the county. Buffer distances were chosen
according to CDC guidelines for evacuations in the event of a large anhydrous ammonia spill,
which we identified as the most potentially hazardous chemical shipped to or from PotashCorp’s
facility. The first buffer of 200 feet represented the immediate area around the spill, followed by
evacuations of 0.4 miles downwind of the spill during the day and 1.4 miles downwind of the
spill at night. The CDC also specified a 1-mile evacuation in all directions in the event of a rail
car fire involving anhydrous ammonia. We then counted the number of parcels with their
centroid inside of each of these buffers and identified vulnerable sites within the buffers, such as
schools, medical facilities, public groundwater wells and water treatment facilities.

11
It should be noted that there has never been a train derailment or other major rail accident in
Beaufort County, but key informants told us about past car malfunctions that could pose a threat,
such as an overheated ball bearing that caused a small fire and a rail slip that did not cause
derailment. Mr. Wallace of PotashCorp Aurora told us that every train carrying anhydrous
ammonia carries at least one car containing water that could be used either to fight a fire or to
hydrate the ammonia, which would prevent it from traveling as far.
Interviews and Focus Groups
In order to examine social vulnerability in Beaufort County, we conducted two focus groups with
residents and interviews with seven key informants. This qualitative data complemented the
quantitative data collected and represented on the maps we produced.
Key Informants:
For this project we interviewed key informants that either worked with vulnerable populations or
had expertise regarding natural disasters in Beaufort County. Specific questions tailored to each
person were written for the interviews (See Questions for each key informant in Appendix).
Key informants included:
Randell Woodruff, County Manager

12
Gray Hodges, Transportation Manager for Beaufort County Area Transit
Chris Kiricoples, CEO of Beaufort County Development Center
Patricia Patterson, Program Coordinator, The Blind Center of North Carolina
Adam Congleton, Program Director, LifeQuest
Jeff Bell, Country Living Group Homes Staff
Esperanza Ornelas, Beaufort County Social Services Interpreter
Phillip Nepper, Rail Switch Operator
We also met with Lisa Respess, an Emergency Services Specialist with Emergency
Management, the first time that we traveled to the county. She provided an overview of natural
hazards in the county and traveled with us when we visited with individuals in both Washington
and Belhaven. Gwen Leverett, the Belhaven Town Manager and Peter Budge, the Building
Inspector, discussed hazards specific to Belhaven and the process of raising houses after
flooding. Curtis Avery, the Fire Marshal, met with us in Washington and spoke with us about
emergency procedures. He then accompanied us to Aurora to tour PotashCorp. Ted Wallace
from PotashCorp led the tour and provided us general information on the facilities, the workers
and the main supplies that came in and out on a daily basis.
Key informant interviews are utilized in the social sciences to gain a more thorough
understanding of research topics across multiple disciplines and to form local perspectives. The
goal of these interviews was to better understand socially vulnerable groups, emergency service
operations, and local perspectives on past disasters. Another use of key informant interviews was
to provide feedback on the maps of social vulnerability. Key informants were able to give
general comments regarding the maps’ readability as well as comment on the possible existence
of vulnerable areas that were not represented on the maps.
Focus groups:
Focus groups are conducted to gather qualitative information from a diverse set of individuals on
a specific question or topic. Using this type of data collection allowed us to get a sense of
participants' opinions on different topics. It also gave us a glimpse of motivations for behaviors
during disasters and how those disasters impacted personal lives. By conducting a focus group
consisting of people from different backgrounds, observations can be made regarding how the
group dynamic affects individual perceptions and how individuals respond to other’s responses.
For our focus groups regarding social vulnerability to natural disasters in Beaufort County, we
were interested in talking to individuals who may fall into a socially vulnerable category, such as
the elderly, or have knowledge of those that do. The goal of the focus groups was to gain
anecdotal support to accompany our maps and to shed light on vulnerable areas we may not have
previously considered.
In order to conduct the focus groups, we first identified possible groups of people for which a
13
focus group layout may provide beneficial information. Groups identified included people that
were Spanish-speaking, elderly, and/or low-income. Given constraints on time and resources, we
were only able to conduct two traditional focus groups. The first focus group took place in the
City of Washington and consisted of elderly individuals who were recruited with the help of the
director of the Washington Senior Center. The second focus group began at the Belhaven Senior
Center and continued at Fish Hooks Café and included elderly individuals from Belhaven and
surrounding areas who were recruited with the help of Ms. Marty Dale. We also conducted a
third, unconventional set of focus groups onboard public transport vans.
Building on background research, we created focus group questions to guide the discussions (See
Focus Group Guide in Appendix). Questions were created with the understanding that
participants may not have extensive knowledge regarding vulnerability or natural disasters. The
focus group format and questions were designed in order to ensure participants felt comfortable
and privacy was protected. We submitted all focus group information, including questions used,
to UNC Chapel Hill’s Institutional Review Board (IRB) for approval. The IRB granted an
exemption and all responses were kept anonymous. Prior to the start of the focus groups all
participants were informed that all responses would be kept anonymous and that they could
choose not to answer any questions presented.
Findings
Focus Groups
In general, the findings from the focus groups with senior citizens in Washington and in
Belhaven were very similar. The elderly individuals that we talked to were more or less self-
sufficient when it came to disasters, especially hurricanes. Most were able to evacuate
themselves in case of a natural disaster and did not rely on the state or federal government for
assistance. In fact, many residents felt very disenchanted with the federal government because of
negative past experiences. However, they felt that the county government did all that it could to
help residents during hurricanes. Notably, participants felt the county government did its best
when preparing for and responding to natural disasters given constraints on personnel and other
resources. Residents noted that the large county size, physical division of the county by the river,
and shortage of staff made any kind of response to a natural disaster on a county scale difficult.
Additionally, participants felt the bureaucratic process requiring a county to petition the state to
declare an emergency cripples rapid response time. In the words of one resident, “They’re sitting
up there in Raleigh...they’re not drowning in water.” Despite institutional blocks, residents told
us that the county government and county-level institutions provide necessary services in the
event of a disaster. For example, the Belhaven Senior Center had the contact information of all
members and checked up on them in the event of a disaster. According to the participants, the

14
people who had recently moved to the area ended up being hardest hit by natural disasters such
as hurricanes. The long-term residents knew to put their belongings high enough to avoid
floodwaters, and two Belhaven residents that we talked to owned homes that had been raised.
The focus groups conducted on the buses yielded fewer findings as time was very limited, but in
general the riders we interviewed did not feel that they were particularly vulnerable — even
those that had disabilities, such as ones that required the use of a wheelchair. All of the people
interviewed were from Washington and had never experienced significant damage or had to
evacuate, although the county had prepared them for potential disasters.
Key Informant Interviews
In our key informant interviews we found that the government of Beaufort county, along with
many non-governmental organizations were more prepared for natural disasters than we
originally thought. They also had a good idea of the areas of social vulnerability that we
identified through our maps. A general recommendation that we got from our key informants
was for information regarding natural hazards be more available to people living Beaufort.
We found that the Blind Center of North Carolina never had to evacuate because the attendees
did not come to the center in bad weather. The blind individuals that we spoke with did not feel
particularly vulnerable to events such as hurricanes and flooding—but that was because they had
family who cared for them, not because the county had any specific services in place to help
them in the event of a disaster. One blind woman who we spoke to stated that she lived with her
sister and mother and they had a car if they needed to evacuate. She also shared that she had a
pacemaker and one particular challenge for her was getting medical assistance during Hurricane
Irene. Additionally, the director of the center mentioned that it is particularly difficult for blind
individuals to collect medicine and supplies in preparation for a disaster such as a hurricane.
County Manager Randell Woodruff provided helpful feedback on our train maps by mentioning
that we should add governmental buildings such as schools when designing our maps. He shared
that when the town of Washington experiences flooding, the jail has to be evacuated because it is
located below ground. In addition, he stated that the poorest areas are on the Eastern side of the
county. This information confirmed what we had found in our assessment of social vulnerability.
We interviewed both Adam Congleton, Program Director at LifeQuest, and Jeff Bell, staff at
Country Living. Mr. Bell explained that Country Living manages several group homes near the
City of Washington, and Mr. Congleton explained that LifeQuest is a psychosocial rehabilitation
facility for individuals over the age of 18 who have been diagnosed with a severe mental
disorder. Many of the individuals receiving care at LifeQuest also have developmental
disabilities and/or substance abuse issues. Most clients have limited driving capabilities but are
generally cared for by relatives, who are informed about safety and potential disasters at

15
LifeQuest. However, Congleton was most concerned about those individuals who lived alone
but could not self-medicate or evacuate independently. Due to budget cuts, many people who had
difficulty living on their own had been forced to leave group housing. Any difficulties people
had living independently were magnified during disasters. After speaking with Mr. Bell, we
found that group homes in Beaufort County were located far enough inland that they never had
issues with flooding or evacuation, although they did have monthly emergency drills.
Finally, we met with Esperanza Ornelas from Beaufort County Social Services. She is the only
Spanish interpreter in Social Services, and one of the few within the county. She expressed the
problems that members of the Hispanic community, particularly non-English speakers, face in
the event of a natural disaster. There is a limited amount of information on the news or on
posters in Spanish. For this reason, Social Services is the gateway for information about natural
hazards for this population. Many individuals who are undocumented are especially vulnerable
since they often think that they are not eligible for federal assistance. In reality, as long as there
is a citizen in the household, which many of the children are, they can get help from the federal
government. Finally, she mentioned that the Mexican consulate in Raleigh is helpful for
individuals who cannot or will not get federal assistance. She expressed the changes that need to
be made in the county in order to help this community which include providing more interpreters
and making more information available in Spanish.
Train Map Findings
We found that, as expected, the vulnerabilities to train derailment were low. First, as Beaufort
County is very rural, there were generally few people around tracks, with a few exceptions near
Chocowinity (See Figure 9). Tracks only passed a few densely populated areas, primarily
around Chocowinity. We identified the PotashCorp’s Aurora facility as the originator of the
highest expected damage cargo transported by train (defined as probability of derailment
multiplied by magnitude of damage). While the probability of derailment for any one car is very
low (no derailments have ever occurred in Beaufort), PotashCorp has trains of 25-40 cars
arriving and leaving the facility daily, increasing the opportunities for derailment. The
company’s trains only travel along the southern part of the county and do not cross the river
because the bridge is not rated for the length and weight of those trains. The only trains that cross
the river carry wood chips, which pose very little danger other than spilling in a derailment. The
trains that leave PotashCorp Aurora carry feed grade phosphate and phosphoric acid. The feed
grade phosphate poses very little danger, but the phosphoric acid could be more dangerous in a
spill. The Material Safety Data Sheet (MSDS) from PotashCorp for phosphoric acid describes it
as very corrosive. In case of a large spill, the MSDS directs responders to stop the flow of the
acid and to neutralize it with lime or soda ash. This will result in an exothermic reaction that will
release a large amount of heat.
The most dangerous chemical being transported by rail in the county is anhydrous ammonia,

16
which enters the PotashCorp facility to be used in processing the phosphate. Anhydrous
ammonia as a gas poses the greatest danger—it is flammable, toxic and can travel distances of a
mile or more, given low wind speeds which allows for less mixing with ambient air. The CDC
has created an Emergency Response sheet where it recommends three different radii of
evacuations in the event of a large anhydrous ammonia spill. The first buffer of 200 feet
represented the immediate area around the spill, followed by evacuations of 0.4 miles downwind
of the spill during the day and 1.4 miles downwind of the spill at night. While the CDC does not
specify similar evacuation standards in the event of a large phosphoric acid spill, the guidelines
for anhydrous ammonia will be sufficient, given the MSDS from PotashCorp also does not say
evacuations are essential. We found that there were over 11,000 parcels within a 1.4 mile buffer
all along the entire stretch of tracks in Beaufort County. We also found that there were five
schools, twenty four medical facilities, seventeen groundwater wells and three water treatment
plants within the buffers.
We were surprised by all of the planning and systems in place to reduce risks from derailment.
First, Ted Wallace, Security and Emergency Response Supervisor for PotashCorp Aurora, was
very forthcoming about what chemicals they used and how they used them. This kind of
information sharing is important to ensure clear and effective communication between Beaufort
County Emergency Management and PotashCorp. Second, we found out that all trains leaving
PotashCorp Aurora carry at least one water tanker, containing water that could be used by
firefighting crews in the event of a fire. This water would be used to hydrate the ammonia, and
therefore cause it to precipitate. Third, Philip Nepper, the Bridge Operator in Beaufort County,
informed us that there are Sperry cars that inspect the rails regularly using x-rays and inform the
rail owners of any defects in the tracks. The Sperry car, named after its inventor, is the standard
method of railroad defect detection
One unexpected finding was that there were much more dangerous chemicals being transported
through the county by tractor-trailers than by railcars. One of these chemicals was Silicon
Tetrafluoride (STF), produced by PotashCorp. STF, used in microchip manufacturing, is both
extremely toxic and reacts violently with water vapor in the air and moisture in membranes, such
as skin. This is such a dangerous chemical that the company has held emergency training
seminars in every county along the rail line between Beaufort County and the final destination in
Texas. Another source of dangerous chemicals are the fertilizers that are used by farmers in the
county. These fertilizers are toxic and can even be explosive. What makes these chemicals even
more dangerous is that the farmers that purchase them are often responsible for transport from
store to farm. These farmers may not be aware of the proper procedures for storage and
movement and contingencies for spills.

17
Lessons Learned
From our numerous interviews, focus groups and map consultations, we learned more about the
most vulnerable populations in Beaufort County and gained insight into residents’ opinions about
vulnerability, autonomy and the decision to evacuate.
Focus groups
We identified several key factors that influence Beaufort County’s vulnerability to natural and
manmade hazards. One point that came up repeatedly was the idea of autonomy. Many people in
the focus groups expressed the belief that although the county had resources available to help in
the event of a disaster, in the end they had to rely on themselves. In our focus group at the
Washington Senior Center, one individual stated: "The only thing I know is that when these
disasters hit, you don't depend on anyone else to take care of your problems." Because of this,
many people knew how to get information and where to go in the event of a severe natural
disaster. Therefore, many believed that if a person does not evacuate, the damage they incur is no
one’s fault but their own. Many individuals we spoke to were able to rely on family or friends to
help in the event of a natural disaster. For vulnerable populations, such as those who have
disabilities, autonomy is possible only if this is the case; if an individual lives alone, he or she
would have to rely on help from the county.
During the focus groups, we also learned about practical reasons why people would stay in their
homes rather than heed warnings to evacuate in the event of a natural disaster. Of course, for
many, it simply comes down to not wanting to leave their home, possessions, and animals
behind. People are concerned about looters and losing everything they have. For undocumented
individuals, it is common to resist evacuating in order to avoid interacting with law enforcement
officials. Most people said that they knew exactly what to do in the event of an evacuation, but
we learned that this is not necessarily the case for members of the Hispanic community who do
not speak English. In the county, there is limited translated information available, so it can be
difficult for people to get the information they need in a language they understand. Finally,
sometimes people choose not to evacuate because they do not think that they are in significant
danger. For this reason, we found that an especially vulnerable population in the county that we
had not previously considered is those who have recently moved there. This is because they are
the ones least likely to know how to prepare for and deal with natural disasters that are common
to the area, and have no memory of certain events to motivate action. We concluded that
Hurricane Irene from 2011 was somewhat of a turning point for the county as far as damage and
disaster awareness.
In particular, we found that Beaufort County was a unique case study in terms of vulnerability
and natural disasters. The county is divided physically north and south by the Tar-Pamlico River
18
and socio-economically from east to west. Beaufort County is unique in that there are generally
higher levels of poverty in the eastern regions, closer to the coast (whereas in other counties, the
wealthier regions tend to be along the coast). Because of this, there is a difference between
perceived and actual vulnerability. Some of the people we spoke to in Washington did not feel
that the county was at risk for extreme damage from natural disasters, and this is probably
largely due to the fact that Washington does not usually experience as much damage as other,
more coastal municipalities. As expected, some individuals who fit into groups that we had
identified as vulnerable did not see themselves as such. Still, we were able to conclude that the
most vulnerable populations are those with disabilities, the elderly, non-English speakers and
new residents. Again, the vulnerability of individuals in these groups can be mitigated if they
have family or friends to rely on and accentuated if they do not.
We had mixed results with the focus groups. The focus group of eight senior citizens held at the
Senior Center in Washington went very well; all of the participants spoke and while one or two
dominated the conversation we were able to get through all of our questions and stay on track.
There did seem to be some segregation among the participants so if we conducted a similar
group in the future it might be helpful to assign seats in advance or use a smaller table so that
such separation would not be possible. The focus group held at the Senior Center in Belhaven
only had four participants and we did not have as much time to ask them questions due to
scheduling, but once it started we did get some valuable information.
Mapping
We did not get as much feedback on the maps as we would have liked, especially for the map
showing the train routes in Beaufort County. We found that the people that we interviewed did
not have much knowledge about train routes in the county and therefore were not able to critique
or comment on the map. Similarly, because the social vulnerability map was made at the census
tract level, we were not able to get any feedback on the specific locations of vulnerable
populations in the county. In the future, we would develop the maps using data at the block or
block group level, if it was available. This would allow us to identify more specific areas of
vulnerability. As it was, we were limited by what was available from the most recent census.
Furthermore, it may be more informative to allow individuals to use a blank map of the county to
identify vulnerability “hot spots,” in other words, specific areas that are especially vulnerable to
hazards or disasters, that we could not identify based on our knowledge of the county or census-
level data. For example, there may be vulnerable areas or populations within a census tract that
is otherwise considered to be less vulnerable to the effects of hazards. When we asked during
our interviews, most people simply gave positive feedback without any suggestions for
improvement. In our construction of the maps, we inherently assumed that the combination of
data we used was accurate and relevant. However, the metrics we developed were not necessarily
perfectly applicable: for example, at the beginning of the project we decided upon specific

19
indicators that we believed best-represented social vulnerability in Beaufort County. As a result,
we focused our energy certain vulnerable populations—but by doing so, there were additional
populations that we did not identify, such as new residents. Additionally, just because an
individual belongs to a group of people considered to be vulnerable, such as the elderly, he or
she may be well equipped to deal with a disaster. However, there is no such thing as an ideal data
set. To aid in our mapmaking process, we would have liked to include more public participation
during the making of the maps: for example, getting input and feedback from residents—such as
those in our focus groups.
Interviews
If we were to repeat this project, there are some changes that we would make in our methodology
in order to improve the study. Overall, our interviews with professionals were very informative.
We found it was difficult to keep some individuals on topic. If we did interviews in the future for
a similar project, we might send the interviewees the questions in advance so that they would
know exactly what we wanted to speak with them about.
Finally, we found that simply talking to the citizens in the county while we were eating lunch,
getting coffee, etc. was very beneficial. We were able to make a contact with an individual who
knew a train conductor that we could meet with and interview. This contact ended up being very
valuable and therefore we would suggest for groups conducting similar research that conversing
with unplanned individuals in the county of the study could be extremely useful.
Limitations and Recommendations
Limitations
Overall, we found that many individuals who we would have identified as vulnerable did not see
themselves that way, which made us rethink the way that we studied and thought about
vulnerability as a whole. We saw vulnerability as a black or white designation that we could
assign by looking at specific factors found in the literature. However, we found from talking with
residents that vulnerability is much more of a spectrum and that certain groups were less
vulnerable than expected (such as elderly individuals with personal vehicles) whereas other
groups (such as new residents) were hidden pockets of vulnerability. We came into our focus
groups and interviews with pre-determined ideas of which groups were vulnerable and asked a
lot of leading questions that did not always allow residents to describe the groups that they
personally saw as vulnerable. In addition, showing pre-determined maps of social vulnerability
limited the amount of feedback that we were able to receive from our key informant interviews.
In the future, we would attempt to enter into our conversations with residents without any bias on

20
who we believed to be vulnerable, and simply use information gathered to draw maps of social
vulnerability.
As we mentioned previously, we were limited by the availability of Census data. Had data for
indicators of social vulnerability been available on a block or block-group level, we would have
been able to better pinpoint specific areas of vulnerability.
Finally, we were limited both by time and resources in this project. Had we had several months
we would have been able to reach out to more people and municipalities. We would have been
able to talk to more diverse and larger populations. Additionally, the physical distance between
us and our client meant that we were only able to visit the county in person twice during the
course of this project. This limited the amount of personal contact that we had with residents of
Beaufort County.
Recommendations
Our research provided valuable insights about vulnerability in Beaufort County. We were asked
by Beaufort County officials to analyze vulnerability to natural and manmade hazards. This led
us to specifically study social and physical vulnerability to natural disasters and train derailment
within the county. We found that the county has already taken many steps to assist individuals
during natural disasters. For example, it has implemented the BATS system and a cell phone
emergency alert system. There is also a large support system of friends and family in the county
that generally aids disabled individuals. Additionally, from all sources we spoke to, the trains in
the county are managed in a way that historically has minimized risk of derailment. The train
lines operating to and from the PotashCorp Aurora facility are the property of the train
companies, CSX and Norfolk Southern (NS), and are well maintained according to informants
who interact with the trains on both a professional and day-to-day (informal) basis. However, we
pinpointed several sources of vulnerability in Beaufort County and recommend the following
courses of action:
1. Implement means of educating new residents of the dangers of natural disasters and how to
prepare for an emergency.
2. Hire Spanish-speaking 911 correspondents and create Spanish television news advisories
about disasters and posters showing shelter locations.
3. Inform Hispanic residents that they can get federal disaster aid, even if they are
undocumented.
4. Improve communication between the Beaufort County government and the state
government in Raleigh.
5. Improve the speed at which the state declares official disasters.
6. Conduct further studies to collect more detailed information on populations that may be
vulnerable, but are not identified by traditional vulnerability indicators. One example would be

21
new residents.
7. Create incentives for people who have paid off their home mortgage to continue purchasing
flood insurance, even though they are no longer required.
8. Encourage residents that have raised their homes to continue standard emergency
preparedness procedures in order to reduce any false sense of security that they may have.
9. Ensure processes are in place to prevent contamination of groundwater sources and water
treatment plants within the area of concern around railroad tracks with cars carrying dangerous
chemicals.
10. Determine schedule of federal Sperry train track inspection cars to understand when Beaufort
County railroad tracks will be inspected.
11. Create a contingency plan in case of a derailment showing which emergency responders and
fire stations will be responsible for various sections of track.
12. Conduct a further study of chemicals (STF, fertilizers, etc.) transported in the county by
tractor-trailer rather than by train.
We have enjoyed spending this semester working with Beaufort County in order to assist them in
their Emergency Management protocol. Even though we faced limitations in our research
project, we were able to make valuable connections in the County and we hope that our study
will result in practical and concrete solutions in the realm of Beaufort County hazard mitigation.

22
Appendix
Table 1. The five indicators used to create the vulnerability index, corresponding census
variables and numerical ranges of the each quartile of that variable.
Indicator Census
Variable
Category 1 Category 2 Category 3 Category
4
Age Percent of
Population over
65
12.1%-
13.6%
13.7%-
16.3%
16.4%-
22.5%
22.6%-
28.7%
Disability Percent of
Population with
Disability
Status
12.8%-
12.9%
13.0%-
15.5%
15.6%-
19.1%
19.2%-
24.6%
Minority Percent
Minority
5%-11% 12%-26% 27%-37% 38%-56%
Income Median Income $50,052-
$51,429
$43,250-
$46,090
$34,942-
$38,243
$26,344-
$27,625
Transportation Percent of
Population
without
ownership of a
vehicle
4.3%-5.3% 5.4%-7.4% 7.5%-10.9% 11.0%-
22.2%
Table 2: Qualifications assigned to numerical values of the social vulnerability index.
Assignment Values
Low 2-4
Medium-low 4-7
Medium-high 7-9
High 9-13

23
References
Cutter, S.L., B.J. Boruff and W.L. Shirley. 2003. Social Vulnerability to Environmental Hazards.
Social Science Quarterly (84,2).
Meier, Andrea. Using Focus Groups in Health Behavior Research-Session 1: Focus Groups as a
Data Collection Method. CHAI Core Intervention Research Workshop Series.
Holland Consulting Planners. Beaufort County Hazard Mitigation Plan. Dec, 2010.
City of Washington 2023 Comprehensive Plan. 1 February 2013.
Patterson, Lauren A. and Doyle, Martin W. 2009. Assessing Effectiveness of National Floor
Policy Through Spatiotemporal Monitoring of Socioeconomic Exposure. Journal of the
American Water Resources Association (45,1).
24
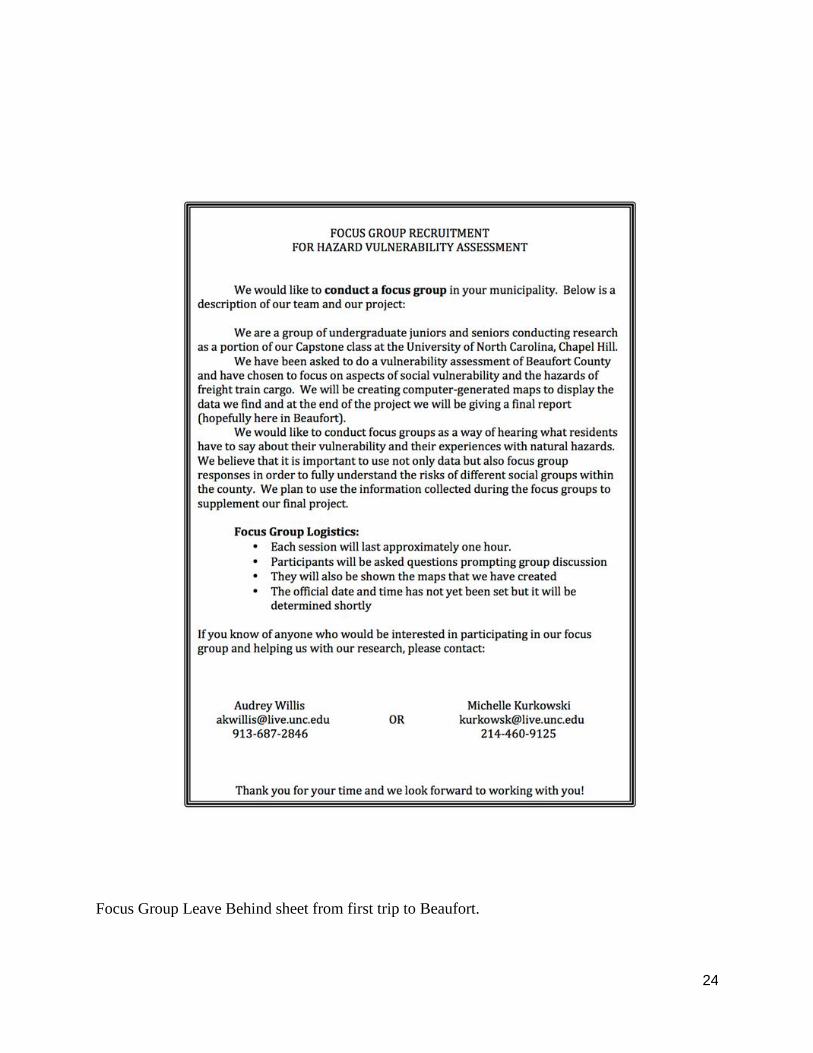
Focus Group Leave Behind sheet from first trip to Beaufort.

25
Focus Groups question sheet for second trip.

26
27

28

29

30

31

32

33