Embed Size (px)
Citation preview

Unaudited Semi-Annual Report Credit Suisse Real Estate Fund InternationalInvestment fund under Swiss law of the “Real estate funds” category for qualified investorsJune 30, 2018

Credit Suisse Real Estate Fund International • Unaudited Semi-Annual Report as at June 30, 2018
2
Contents
Information in Brief 3Management and Statutory Bodies 4 Information on Third Parties 5Statement of Assets 6Statement of Income 7Appendix 8Mortgages 10Loans / Transactions between Funds 12Land Purchases and Sales / Transactions with Related Parties / Tenants Accounting for over 5% of Rental Income / Real Estate Companies in the Fund / Overview of Units of other Investment Funds / Units in Circulation 13Capital Gains/Losses on Currencies 14Further Information on Off-Balance-Sheet Business 15Schedule of Properties in Swiss Francs / General Information about the Properties / Financial Data on the Properties / Breakdown of Residential / Commercial Premises 16Schedule of Properties (Local Currencies) / Financial Data on the Properties 20Brief Report 22Notes to the Unaudited Semi-Annual Report 24Valuation Report 25
This report is an English translation of the original German version. In case of discrepancies the original version takes precedence.

Credit Suisse Real Estate Fund International • Unaudited Semi-Annual Report as at June 30, 2018
3
Information in Brief
Key Data 30/6/2018 31/12/2017 31/12/2016 3)
Swiss security no. 1 968 511Fund units issued 359 695 228 897 –Fund units redeemed – – – Number of units in circulation 2 877 562 2 517 867 2 288 970Net asset value per unit (incl. distribution) CHF 1 085.85 1 097.42 1 053.89Issue price per unit CHF 1 100.00 1 115.00 1 070.00Redemption price per unit CHF 1 030.00 1 040.00 1 000.00Closing price (bid price) CHF 1 120.00 1 255.00 1 180.00Highest price (in review period) CHF 1 275.00 1 270.00 1 235.00Lowest price (in review period) CHF 1 095.00 1 180.00 1 120.00Market capitalization (MV) CHF 3 222.9 mio. 3 159.9 mio. 2 701.0 mio.Premium 3.15% 14.36% 11.97%
Statement of Assets 30/6/2018 31/12/2017 31/12/2016 3)
Market value of properties CHF 3 491.5 mio. 3 312.9 mio. 2 837.0 mio.Acquisition costs of properties CHF 3 032.3 mio. 2 886.6 mio. 2 547.8 mio.Total assets CHF 4 044.6 mio. 3 556.5 mio. 3 057.7 mio.Third-party borrowings: 1)
– in % of investment costs 20.90% 18.10% 15.38%– in % of aggregate market value 18.15% 15.77% 13.81%Debt as a percentage of total assets 22.75% 22.31% 20.98%Interest on borrowed funds 2.75% 2.46% 2.62%Remaining term to maturity of borrowed funds Years 3.45 2.26 2.97 Net asset value attributable to the unitholders of the Fund CHF 3 124.6 mio. 2 763.2 mio. 2 412.3 mio.
Return and Performance Data 30/6/2018 31/12/2017 31/12/2016 3)
Distribution CHF n/a 42.00 42.00Distribution yield n/a 3.35% 3.56%Distribution ratio n/a 99.92% 95.38%Return on equity (ROE) attributable to the unitholders of the Fund 2.78% 2) 8.15% 4.80%
Return on invested capital (ROIC) 2.50% 2) 6.94% 4.32%Return on investment 2.85% 2) 8.41% 5.14%Performance –6.97% 2) 11.52% 9.02%EBIT margin 68.49% 71.75% 72.73%Total expense ratio Gross Asset Value (TERREF GAV) 0.90% 0.90% 0.85%Total expense ratio Market Value (TERREF MV) 1.01% 0.97% 0.92%Price/earnings ratio (P/E Ratio) 17.80 14.42 23.58Price/cash flow ratio 64.98 52.86 38.87
Statement of Income 30/6/2018 30/6/2017 30/6/2016Net income total CHF 56.3 mio. 51.4 mio. 49.0 mio.Realized capital gains/losses CHF –31.9 mio. 40.2 mio. 11.2 mio.Rental income CHF 91.9 mio. 82.3 mio. 79.4 mio.Rental losses 11.42% 6.46% 4.57%Maintenance expense CHF 9.0 mio. 6.9 mio. 5.3 mio.1) Maximum permissible charge: one third of the market value (Art. 65 para. 2 CISA / Art. 96 para. 1 CISO)2) Calculation for six months (1/1/–30/6/2018)3) Key financial figures have been adjusted in line with the new SFAMA specialist information sheet for real estate funds (status September 13, 2016).

Credit Suisse Real Estate Fund International • Unaudited Semi-Annual Report as at June 30, 2018
4
Management and
Statutory Bodies
Management and Statutory Bodies
Management CompanyCredit Suisse Funds AG, Zurich
Board of Directors– Dr. Thomas Schmuckli, Chairman– Luca Diener, Vice-Chairman– Ruth Bültmann, Member– Gebhard Giselbrecht, Member, Managing Director,
Credit Suisse Asset Management (Switzerland) Ltd., Zurich– Jürg Roth, Member, Managing Director, Credit Suisse (Switzerland) Ltd., Zurich– Christian Schärer, Member, Managing Director, Credit Suisse (Switzerland) Ltd., Zurich– Dr. Christoph Zaborowski, Member
– Petra Reinhard Keller (until April 4, 2018), Member, Managing Director, Credit Suisse (Switzerland) Ltd., Zurich
Executive Board– Thomas Schärer, Chief Executive Officer– Patrick Tschumper, Deputy CEO and Head Fund Solutions– Gilbert Eyb, Member, Legal– Thomas Federer, Member, Performance & Risk Management– Tim Gutzmer, Member, Fund Services– Hans Christoph Nickl, Member, COO– Thomas Vonaesch, Member, Real Estate Fund Management– Gabriele Wyss, Member, Compliance
Custodian BankCredit Suisse (Switzerland) Ltd., Zurich
Audit CompanyKPMG AG, Zurich

Credit Suisse Real Estate Fund International • Unaudited Semi-Annual Report as at June 30, 2018
5
Information on Third Parties
Accredited valuation experts– Andreas Ammann, architect (ETH/SIA degree), Wüest Partner AG, Zurich– Marco Feusi, architect (HTL degree), Wüest Partner AG, Zurich– Gino Fiorentin, architect (HTL degree), Wüest Partner AG, Zurich– Pascal Marazzi-de Lima, architect (ETH degree), Wüest Partner AG, Zurich
Delegation of Further ResponsibilitiesThe fund management company has delegated the investment decisions to Credit Suisse Asset Manage-ment (Switzerland) Ltd., Zurich, as asset manager.The fund management company has delegated certain fund administration duties to the following group companies of Credit Suisse Group AG:– Credit Suisse AG, Switzerland: specific tasks such as providing legal and compliance advice, facility man-
agement and the Management Information System (MIS).– Credit Suisse (Switzerland) Ltd., Switzerland: specific duties in relation to the provision of compliance ad-
vice, human resources, collateral management, IT services and first line of defense support (FLDS).– Credit Suisse Asset Management (Switzerland) Ltd., Switzerland: real estate administration (including fund
and real estate accounting and estate management).– Credit Suisse Services Ltd., Switzerland: specific tasks in relation to the provision of compliance advice,
managing the fund management company’s finances and tax advice.– Credit Suisse Fund Services (Luxembourg) S.A., Luxembourg: specific tasks in relation to fund accounting.– Credit Suisse (Poland) Sp.z.o.o., Poland: specific tasks in relation to fund accounting, information manage-
ment (including product master data, price publications, fact sheet production, KIID production and report preparation), legal reporting and other support tasks.
Precise details of how the remit is to be fulfilled are laid down in an agreement between the fund manage-ment company and the aforementioned group companies. Further specific tasks may be delegated to the aforementioned group companies.
Real estate management and technical maintenance tasks are delegated to the following companies:
Australia CBRE (C) Pty Ltd., Jones Lang LaSalle (QLD) Pty Ltd., Jones Lang LaSalle (SA) Pty Ltd., Jones Lang LaSalle (VIC) Pty Ltd., Multiplex Property Services Pty Ltd.
Chile CBRE Chile S.A.Germany BNP Paribas Real Estate Property Management GmbH, STRABAG Property and Facility Services GmbHGreat Britain BNP Paribas Real Estate Advisory & Property Management UK Ltd.Ireland Jones Lang LaSalle Ltd.Japan Savills Asset Advisory Co., Ltd., EGW Asset Management Inc.Canada Canderel Management Inc., Colliers Macaulay Nicolls Inc., Swissreal Real Estate Services Ltd.New Zealand CBRE Ltd.Netherlands Jones Lang LaSalle B.V.
USA CBRE Inc., Cushman & Wakefield of Massachusetts Inc., Cushman & Wakefield U.S. Inc., LPC West LLC., Tishman Speyer Properties L.P.
For certain accounting, tax advice and administration tasks undertaken by group companies the following service providers are involved:Alter Domus, CBRE Inc., CBRE Chile S.A., Citco Nederland B.V., Colliers Macaulay Nicolls Inc., Cushman & Wakefield of Pennsylvania, Cushman & Wakefield of Texas, Cushman & Wakefield of Massachussets, Cushman & Wakefield of Oregon, Ernst & Young S.A., J&A Garrigues S.L.P., Gowling WLG (Canada) LLP, Morrison & Foerster, PricewaterhouseCoopers und Savills Asset Advisory Co., Ltd.
Details on the execution of the order are laid down in separate agreements.
Information on
Third Parties

Credit Suisse Real Estate Fund International • Unaudited Semi-Annual Report as at June 30, 2018
6
Statement of Assets as at June 30, 2018
Details from previous yearsNet assets Net asset value per unit
30/6/2018 3 124 596 748 1 085.8531/12/2017 2 763 168 594 1 097.4231/12/2016 2 412 323 407 1 053.89
Conversion rate as at 30/6/2018 as at 31/12/2017CAD/CHF 0.754837 0.777791EUR/CHF 1.159319 1.170248GBP/CHF 1.310942 1.318294100 JPY/CHF 0.896448 0.865010AUD/CHF 0.733641 0.762213USD/CHF 0.992950 0.974500NZD/CHF 0.672277 0.693064100 CLP/CHF 0.152492 0.158460100 CLP/USD 0.153575 0.162606UF/CHF 41.414952 42.464333
30/6/2018 31/12/2017
Market value Market value CHF CHFAssetsCash holdings, balances on postal and bank accounts at sight including fiduciary investments with third-party banks 300 280 182 170 921 415Cash at time, including fiduciary investments with third-party banks 16 380 124 17 073 622Sites – Commercial properties 3 422 013 586 3 054 626 476– Development land (incl. properties for demolition) and schemes under construction 69 479 926 258 266 291Total sites 3 491 493 512 3 312 892 767
Mortgages and other mortgage-backed liabilities 160 200 000 0Derivative financial instruments 17 778 978 –6 996 472Other assets 58 480 497 62 638 970Total assets 4 044 613 293 3 556 530 302
LiabilitiesShort-term liabilities– Short-term interest-bearing mortgages and other mortgage-backed liabilities 0 157 542 348– Short-term interest-bearing loans 0 0– Other short-term liabilities 118 540 882 98 492 273Total short-term liabilities 118 540 882 256 034 621
Long-term liabilities– Long-term interest-bearing mortgages and other mortgage-backed liabilities 633 836 170 364 933 358Total long-term liabilities 633 836 170 364 933 358
Total liabilities 752 377 052 620 967 979
Net assets before estimated liquidation taxes 3 292 236 241 2 935 562 323Estimated liquidation taxes 167 639 493 172 393 729Net assets 3 124 596 748 2 763 168 594– of which attributable to minority interests 0 0– of which attributable to the unitholders of the Fund 3 124 596 748 2 763 168 594
Number of units in circulation 2 877 562 2 517 867Net asset value per unit 1 085.85 1 097.42 Less distribution for financial year 2017 (coupon no. 13) 0.00 42.00 Net asset value per unit after distribution 1 085.85 1 055.42
Change in the net asset value of the unitholders of the FundNet assets at beginning of financial year 2 763 168 594 2 412 323 407Distribution –105 750 414 –96 136 740Balance from sales and purchases of units, excl. equalization on the issue of units and payouts of current income on the redemption of units 379 870 292 231 481 247Total income 87 308 276 215 500 680Balance of deposit/withdrawal of reserves for repairs 0 0Net assets at end of financial year 3 124 596 748 2 763 168 594

Credit Suisse Real Estate Fund International • Unaudited Semi-Annual Report as at June 30, 2018
7
Statement of Income as at June 30, 2018 (ending June 30, 2018)
Average conversion rates for 1/1/–30/6/2018 for 1/1/– 30/6/2017 CAD/CHF 0.753836 0.740870EUR/CHF 1.165212 1.077530GBP/CHF 1.325000 1.253325100 JPY/CHF 0.890625 0.881657AUD/CHF 0.741405 0.746968USD/CHF 0.966367 0.984942NZD/CHF 0.686812 0.703118100 CLP/CHF 0.157028 0.149245100 CLP/USD 0.162493 0.151526UF/CHF 42.383034 39.559719
1/1/2018 1/1/2018 1/1/2017 1/1/2017 to 30/6/2018 to 30/6/2018 to 30/6/2017 to 30/6/2017
CHF CHF CHF CHFIncomeIncome from postal and bank accounts 438 415 247 650Negative interest –5 190 –50 706Rental income (gross income generated) 91 917 305 82 297 942Income from mortgages and other mortgage-backed liabilities 0 45 856Other income 892 305 64 368Current income paid in by new subscribers 7 147 140 4 598 541Total income 100 389 975 87 203 651
ExpensesMortgage interest and interest on mortgage-backed liabilities 5 919 341 5 055 234Other interest due 824 512 883 988Ground rent 494 228 470 784Repairs and maintenance 8 979 071 6 908 100Taxes and charges– Taxes on capital and profits 7 097 414 5 368 738Valuation and auditing expenses 1 082 298 912 903Writedowns on properties (tenant fit-outs) 4 021 297 3 569 407Remuneration (as per fund regulations) for– the fund management company 10 669 591 9 173 009– the custodian bank 414 475 361 849– the property management companies 1 631 056 689 909Costs for annual report 14 263 10 508Fees payable to supervisory bodies 2 750 750Other expenses 2 979 673 2 372 787Net current income paid out on redemption of units 0 0 Total expenses 44 129 969 44 129 969 35 777 966 35 777 966
Net income 56 260 006 51 425 685– of which attributable to minority interests 0 –116– of which attributable to the unitholders of the Fund 56 260 006 51 425 801
Realized capital gains and losses from investments 20 058 165 3 853 738Realized capital gains and losses from currency –51 964 123 36 323 974Realized income 24 354 048 91 603 397– of which attributable to minority interests 0 –116– of which attributable to the unitholders of the Fund 24 354 048 91 603 513
Unrealized capital gains and losses from investments 55 378 129 45 310 646Unrealized capital gains and losses from currency 2 821 863 –67 019 546Change in liquidation taxes 4 754 236 –10 356 939Total income 87 308 276 59 537 558– of which attributable to minority interests 0 –116– of which attributable to the unitholders of the Fund 87 308 276 59 537 674

Credit Suisse Real Estate Fund International • Unaudited Semi-Annual Report as at June 30, 2018
8
Appendix as per June 30, 2018
30/6/2018 31/12/2017
Value of depreciation account CHF 0.0 mio. 0.0 mio.Value of reserves account for future repairs CHF 48.3 mio. 48.3 mio.Balance on account of earnings retained for reinvestment CHF 0.0 mio. 0.0 mio.Total insurance value of assets CHF 2 609.0 mio. 2 522.7 mio.Number of units due be redeemed at end of next financial year none none
Key Financial Figures30/6/2018 31/12/2017
Rental losses 11.42% 6.58%Third-party borrowings in % of aggregate 18.15% 15.77%Distribution yield n/a 3.35%Distribution ratio n/a 99.92%EBIT margin 68.49% 71.75%Total expense ratio Gross Asset Value (TERREF GAV) 0.90% 0.90%Total expense ratio Market Value (TERREF MV) 1.01% 0.97%Return on equity (ROE) 2.78%1) 8.15%Return on invested capital (ROIC) 2.50%1) 6.94%Premium 3.15% 14.36%Performance –6.97%1) 11.52%Return on investment 2.85%1) 8.41%
1) Calculation for six months (1/1/–30/6/2018)
Information on derivatives
For detailed information on forward foreign exchange transactions, please see pages 14–15.
Valuation principles / basis for calculation of the net asset value
The asset value of a unit represents the market value of the Fund’s assets, less any liabilities of the Fund and the likely taxes and duties incurred on liquidation of the Fund’s assets, divided by the number of units in circulation.
Under Art. 88 para. 2 CISA, Arts. 92 and 93 CISO and the SFAMA guidelines for real estate funds, the Fund’s properties are regu-larly valued by independent appraisers accredited by the supervisory authority using a dynamic capitalized income value method. The property values stated are the prices that would probably be obtained upon a diligent sale at the time of appraisal. Properties under construction and construction projects are likewise valued at market value. Upon the purchase or sale of properties contained in the Fund’s assets and at the close of each accounting year, the appraisers must review the market value of the real estate contained in the Fund’s assets. The market value of the individual properties represents the price that would probably be achieved in customary business transactions and on the assumption of diligent conduct by the purchaser and vendor. In individual cases, and especially on the purchase or sale of Fund properties, possible opportunities arising will be used in the best interests of the Fund. This may result in deviations from the valuations given.
Further comments on the market values may be found in the valuation report of the real estate appraiser as per the corresponding semi-annual statement.

Credit Suisse Real Estate Fund International • Unaudited Semi-Annual Report as at June 30, 2018
9
Information on actual compensation rates where maximum rates are indicated in the Fund Regulations
30/6/2018 31/12/2017Actual Maximum Actual Maximum
a) Payments to the Management Company– Annual fee for the management of the Real Estate Fund, asset management, and the
distribution of the Real Estate Fund, on the basis of total fund assets at the beginning of the accounting year 0.60% 1.50% 0.60% 1.50%
– Fee for activities in the construction of properties, as well as renovation and conversion projects, on the basis of construction costs incurred 2.00% 2.00% 2.00% 2.00%
– Compensation for work involved in the purchase and sale of properties, on the basis of the purchase or sale price (unless a third party was entrusted with this task) 2.00% 3.00% 2.00% 3.00%
– Compensation for the management of properties during the reporting period, on the basis of gross rental income (incl. ground rent income) 1.77% 5.00% 1.81% 5.00%
– Issuing commission to cover costs in connection with the placement of new units, on the basis of the net asset value of the newly issued units 1.50% 5.00% 1.50% 5.00%
– Redemption commission to cover costs in connection with the redemption of new units, on the basis of the net asset value of the newly issued units 0.00% 5.00% 0.00% 5.00%
b) Payments to the Custodian Bank– Fee for the safekeeping of fund assets, handling of payment transactions for the
Real Estate Fund, and performance of the other tasks listed in § 4 of the fund contract, on the basis of net fund assets at the beginning of the accounting year 0.03% 0.20% 0.03% 0.20%
– Fee in respect of distribution of annual income to investors 0.00% 0.50% 0.00% 0.50%
Overall amount of contractual payment obligations after the balance sheet date for purchases of plots of land as well as construction orders and investments in properties
30/6/2018 31/12/2017
Purchases of plots of land CHF 158.0 mio. 179.2 mio.Construction orders and investments properties CHF 9.0 mio. 21.3 mio.
Long-term liabilities, broken down by maturity (1 to 5 years, and more than five years)
30/6/2018 31/12/2017
1 to 5 years CHF 633.8 mio. 364.9 mio.> 5 years CHF 0.0 mio. 0.0 mio.
Investments
30/6/2018 31/12/2017
Investments quoted on a stock exchange or on another regulated market open to the public:valued at the prices paid on the main market; in accordance with Art. 84 para. 2 lit. a CISO-FINMA CHF n/a n/aInvestments for which no prices pursuant to lit. a are available: valued on the basis of parame-ters observable on the market; in accordance with Art. 84 para. 2 lit. b CISO-FINMAFor details, see unrealized capital gains and losses on currencies, page 15 CHF 17.8 mio. –7.0 mio.Investments valued on the basis of parameters which are not observable on the market using appropriate valuation models taking account of current market conditions; in accordance with Art. 84 para. 2 lit. c CISO-FINMA.For details, see inventory of properties from page 16For details, see Transactions between Funds, page 12
CHFCHF
3 491.5 mio.160.2 mio.
3 312.9 mio.0.0 mio.
Total investments CHF 3 669.5 mio. 3 305.9 mio.
General observation:You can obtain further information in the “Information in Brief” section.
Credit Suisse Real Estate Fund International • Unaudited Semi-Annual Report as at June 30, 2018
10
MortgagesCurrent Mortgages and Fixed Advances (as at 30/6/2018) Type of loan from
Termto
Currency
Amountin foreign currency
Exchange rateas at 30/6/2018
Amount in CHF Interest rate
Fixed-rate mortgage 17/10/2014 17/10/2019 AUD 118 950 000 0.733641 87 266 597 4.985%Fixed-rate mortgage 1) 27/04/2010 27/04/2020 CLP 7 641 756 289 0.152492 11 653 067 5.610%Fixed-rate mortgage 2) 07/07/2015 07/07/2020 JPY 400 000 000 0.896448 3 585 792 0.794%Fixed-rate mortgage 2) 07/07/2015 07/07/2020 JPY 2 637 000 000 0.896448 23 639 334 0.908%Fixed-rate mortgage 3) 18/12/2015 18/12/2020 JPY 500 000 000 0.896448 4 482 240 0.656%Fixed-rate mortgage 3) 18/12/2015 18/12/2020 JPY 3 205 000 000 0.896448 28 731 158 0.771%Fixed-rate mortgage 4) 22/04/2016 22/04/2021 JPY 4 725 000 000 0.896448 42 357 168 0.600%Fixed-rate mortgage 5) 22/04/2016 22/04/2021 JPY 2 598 750 000 0.896448 23 296 442 0.750%Fixed-rate mortgage 6) 15/05/2014 15/05/2021 CLP 32 120 035 149 0.152492 48 980 484 3.760%Fixed-rate mortgage 7) 31/01/2017 31/01/2022 JPY 2 121 275 000 0.896448 19 016 127 0.429%Fixed-rate mortgage 8) 25/06/2018 25/05/2022 NZD 24 000 000 0.672277 16 134 648 5.020%Fixed-rate mortgage 9) 25/06/2018 25/05/2022 NZD 41 000 000 0.672277 27 563 357 5.020%Fixed-rate mortgage 8) 01/07/2018 01/06/2022 NZD 24 000 000 0.672277 16 134 648 5.040%Fixed-rate mortgage 9) 01/07/2018 01/06/2022 NZD 41 000 000 0.672277 27 563 357 5.040%Fixed-rate mortgage 10) 28/06/2017 28/06/2022 USD 46 000 000 0.992950 45 675 700 3.340%Fixed-rate mortgage 11) 29/09/2017 29/09/2022 JPY 2 703 570 000 0.896448 24 236 099 0.585%Fixed-rate mortgage 12) 26/03/2018 26/03/2023 GBP 64 900 000 1.310942 85 080 136 2.930%Fixed-rate mortgage 13) 29/06/2018 30/06/2023 EUR 41 221 645 1.159319 47 789 036 1.060%Fixed-rate mortgage 13) 29/06/2018 30/06/2023 EUR 11 510 029 1.159319 13 343 795 1.060%Fixed-rate mortgage 13) 29/06/2018 30/06/2023 EUR 32 180 086 1.159319 37 306 985 1.060%Total current mortgages and fixed advances 633 836 170
1) The mortgage for the property Magdalena in Santiago de Chile was concluded in the accounting currency Unidad de Fomento (UF) and originally amounted to UF 425 000. By the balance sheet date, UF 143 627 had been repaid, of which UF 12 787 during the current financial year. The net debt was converted into CLP at the exchange rate applicable on the reference date.
2) The mortgages were concluded on July 7, 2015 with the purchase of the property in Tokyo for a total of JPY 3 212 500 000. By the balance sheet date, JPY 175 500 000 had been repaid, of which JPY 29 250 000 during the current financial year.
3) The mortgages were concluded on December 18, 2015 with the purchase of the property in Nagoya for a total of JPY 3 800 000 000. By the balance sheet date, JPY 95 000 000 had been repaid, of which JPY 19 000 000 during the current financial year.
4) The mortgages were concluded on April 22, 2016 with the purchase of the property KM Building in Osaka for a total of JPY 5 000 000 000. By the balance sheet date, JPY 275 000 000 had been repaid, of which JPY 75 000 000 during the current financial year.
5) The mortgages were concluded on April 22, 2016 with the purchase of the property YM Building in Osaka for a total of JPY 2 750 000 000. By the balance sheet date, JPY 151 250 000 had been repaid, of which JPY 41 250 000 during the current financial year.
6) The mortgage for the property Apoquindo in Santiago de Chile was concluded in the accounting currency Unidad de Fomento (UF) and originally amounted to UF 1 299 710. By the balance sheet date, UF 116 974 had been repaid, of which UF 38 991 during the current financial year. The net debt was converted into CLP at the exchange rate applicable on the reference date.
7) The mortgage for the property in Fukuoka was concluded on January 31, 2017 for a total of JPY 2 140 000 000. By the balance sheet date, JPY 18 725 000 had been repaid, of which JPY 7 490 000 during the current financial year.
8) The mortgages for the property Lambton Quay in Wellington were concluded on June 25, and July 1, 2018 for a total of NZD 48 000 000. 9) The mortgages for the property Aitken Street in Wellington were concluded on June 25, and July 1, 2018 for a total of NZD 82 000 000.10) The mortgages were concluded on June 28, 2017 with the purchase of the property in Portland for a total of USD 46 000 000.11) The mortgages were concluded on September 29, 2017 with the purchase of the property in Honmachi for a total of JPY 2 829 768 000.
By the balance sheet date, JPY 20 430 000 had been repaid, of which JPY 20 430 000 during the current financial year. The rollover mortgage of JPY 105 768 000 maturing on October 31, 2018 was repaid early on May 31, 2018.
12) The mortgage was concluded on March 26, 2018 with the purchase of the property Monument in London for a total of GBP 64 900 000.13) On June 29, 2018, the portfolio mortgage for two properties in Berlin and one property in Munich was refinanced with three separate mortgages totaling EUR 97 800 000.
The first portion of EUR 84 911 760 was paid out on June 29, 2018. The second payment of EUR 12 888 240 will be released on September 28, 2018.

Credit Suisse Real Estate Fund International • Unaudited Semi-Annual Report as at June 30, 2018
11
Expired Mortgages and Fixed Advances (1/1/ to 30/6/2018) Type of loan from
Termto
Currency
Amountin foreign currency Interest rate
Fixed-rate mortgage 31/01/2014 29/06/2018 EUR 84 450 000 2.211%Fixed advance 20/06/2018 22/06/2018 CHF 208 700 000 1.500%Fixed advance 18/06/2018 20/06/2018 CHF 237 600 000 1.500%Fixed advance 15/06/2018 18/06/2018 CHF 240 000 000 1.500%Fixed advance 08/06/2018 15/06/2018 CHF 241 400 000 1.500%Fixed advance 07/06/2018 08/06/2018 CHF 10 100 000 1.500%Fixed advance 04/06/2018 08/06/2018 CHF 15 700 000 1.500%Fixed advance 31/05/2018 08/06/2018 CHF 215 500 000 1.500%Rollover mortgage 11) 29/09/2017 31/05/2018 JPY 105 768 000 0.569%Fixed advance 28/05/2018 31/05/2018 CHF 71 155 000 1.500%Fixed advance 25/05/2018 31/05/2018 CHF 148 800 000 1.500%Fixed advance 23/05/2018 25/05/2018 CHF 158 800 000 1.500%Fixed advance 18/05/2018 23/05/2018 CHF 155 200 000 1.500%Fixed advance 17/05/2018 18/05/2018 CHF 101 700 000 1.500%Fixed advance 08/05/2018 17/05/2018 CHF 101 600 000 1.500%Fixed advance 25/04/2018 08/05/2018 CHF 101 500 000 1.500%Fixed advance 20/04/2018 25/04/2018 CHF 70 000 000 1.500%Fixed advance 19/04/2018 20/04/2018 CHF 21 000 000 1.500%Fixed advance 13/04/2018 19/04/2018 CHF 72 470 000 1.500%Fixed advance 12/04/2018 13/04/2018 CHF 112 670 000 1.500%Fixed advance 11/04/2018 12/04/2018 CHF 112 660 000 1.500%Fixed advance 29/03/2018 11/04/2018 CHF 112 600 000 1.500%Fixed advance 28/03/2018 29/03/2018 CHF 2 100 000 1.500%Fixed advance 27/03/2018 29/03/2018 CHF 125 500 000 1.500%Fixed advance 20/03/2018 27/03/2018 CHF 125 000 000 1.500%Fixed advance 16/03/2018 20/03/2018 CHF 137 500 000 1.500%Fixed advance 09/03/2018 16/03/2018 CHF 138 000 000 1.500%Fixed advance 28/02/2018 09/03/2018 CHF 14 000 000 1.500%Fixed advance 23/02/2018 09/03/2018 CHF 124 000 000 1.500%Fixed advance 20/02/2018 28/02/2018 CHF 13 500 000 1.500%Fixed advance 07/02/2018 20/02/2018 CHF 38 600 000 1.500%Fixed advance 31/01/2018 07/02/2018 CHF 38 600 000 1.500%Fixed advance 26/01/2018 31/01/2018 CHF 53 500 000 1.500%Fixed advance 23/01/2018 26/01/2018 CHF 51 500 000 1.500%Fixed advance 23/01/2018 26/01/2018 CHF 2 000 000 1.500%Fixed advance 19/01/2018 23/01/2018 CHF 51 500 000 1.500%Fixed advance 12/01/2018 19/01/2018 CHF 48 600 000 1.500%Fixed advance 09/01/2018 12/01/2018 CHF 48 600 000 1.500%Fixed advance 20/12/2017 09/01/2018 CHF 56 000 000 1.500%Fixed advance 22/12/2017 09/01/2018 CHF 1 800 000 1.500%
Interest rates for fixed-rate mortgages are always set for the entire term.Interest rates for rollover mortgages are adapted based on the 3-month LIBOR (London Interbank Offered Rate) or the 3-month TIBOR (Tokyo Interbank Offered Rate).

Credit Suisse Real Estate Fund International • Unaudited Semi-Annual Report as at June 30, 2018
12
LoansCurrent Loans (as at 30/6/2018) Type of loan from
Termto
Currency
Amountin foreign currency
Exchange rateas at 30/6/2018
Amount in CHF Interest rate
None
Expired Loans (1/1/ to 30/6/2018) Type of loan from
Termto
Currency
Amountin foreign currency Interest rate
None
Transactions between FundsDuring the first six months of the 2018 fiscal year, Credit Suisse Real Estate Fund International made the following investments (pursuant to Art. 86 prov. 3a CISO) in the real estate funds Credit Suisse Real Estate Fund Hospitality, Credit Suisse Real Estate Fund Interswiss, Credit Suisse Real Estate Fund LivingPlus and Credit Suisse Real Estate Fund Green Property:
Current Other Investments (as at 30/6/2018) Type of loan from
Termto
Amount in CHF
Interest rate
Credit 25/06/2018 25/07/2018 45 000 000 0.525%Credit 22/06/2018 20/07/2018 60 000 000 0.300%Credit 22/06/2018 20/07/2018 30 000 000 0.300%Credit 22/06/2018 20/07/2018 20 000 000 0.300%Credit 29/06/2018 05/07/2018 5 200 000 0.525%Total current other investments 160 200 000
Expired Other Investments (1/1/ to 30/6/2018) Kreditart from
Termto
Amount in CHF
Interest rate
None
The applied interest rates were average, current market rates between the prevailing rates for fixed advances and fixed-term de-posits or similar investments respectively. The interest rates are always set for the entire term.
Credit Suisse Real Estate Fund International did not receive any loans from other real estate funds of Credit Suisse Funds AG during the first six months of the 2018 fiscal year.

Credit Suisse Real Estate Fund International • Unaudited Semi-Annual Report as at June 30, 2018
13
Land Purchases and SalesStatement of Land Purchases and Sales in Financial Year 2018 (as at 30/6/2018)Purchases Country Building class Site area m2
London, “Monument”, 11 Monument Street Great Britain Commercial property 1 076Wellington, “HSBC Tower”, 195 Lambton Quay New Zealand Commercial property 1 200
Sales Country Building class Site area m2
Sydney, “Latitude East Building”, 52 Goulburn Street Australia Commercial property 1 832 1)
1) Co-ownership 50/100 = 1 832 m2 (total site area = 3 663 m2)
Transactions with Related PartiesThe management company confirms that there has not been any transfer of real estate assets to related parties and that other transactions with related parties were concluded at the usual market conditions (section 18 of the Guidelines for Real Estate Funds of the Swiss Funds & Asset Management Association SFAMA dated April 2, 2008, status as at September 13, 2016).
Tenants Accounting for over 5% of Rental IncomeTenant Property location Percentage of rental incomeAustralian Tax Office Sydney and Brisbane 5.37%
Real Estate Companies in the Fundn Credit Suisse Real Estate Fund International Holding AG, Zugn CS REFI Chile Fund Holding AG, Zug
The two holding companies in Zug and all but one of their national companies are wholly owned by Credit Suisse Real Estate Fund International.
Overview of Units of Other Investment FundsIn Accordance with Fund Contract § 8 Section 2 c in Conjunction with § 15 Section 4 d
No purchases or sales of units in other real estate funds or real estate investment companies were effected during the first six months of fiscal 2018.
Units in CirculationStatus as at January 1, 2018 2 517 867 unitsRedemptions 0 unitsIssues (June 2018) 359 695 unitsStatus as at June 30, 2018 2 877 562 units
Credit Suisse Real Estate Fund International • Unaudited Semi-Annual Report as at June 30, 2018
14
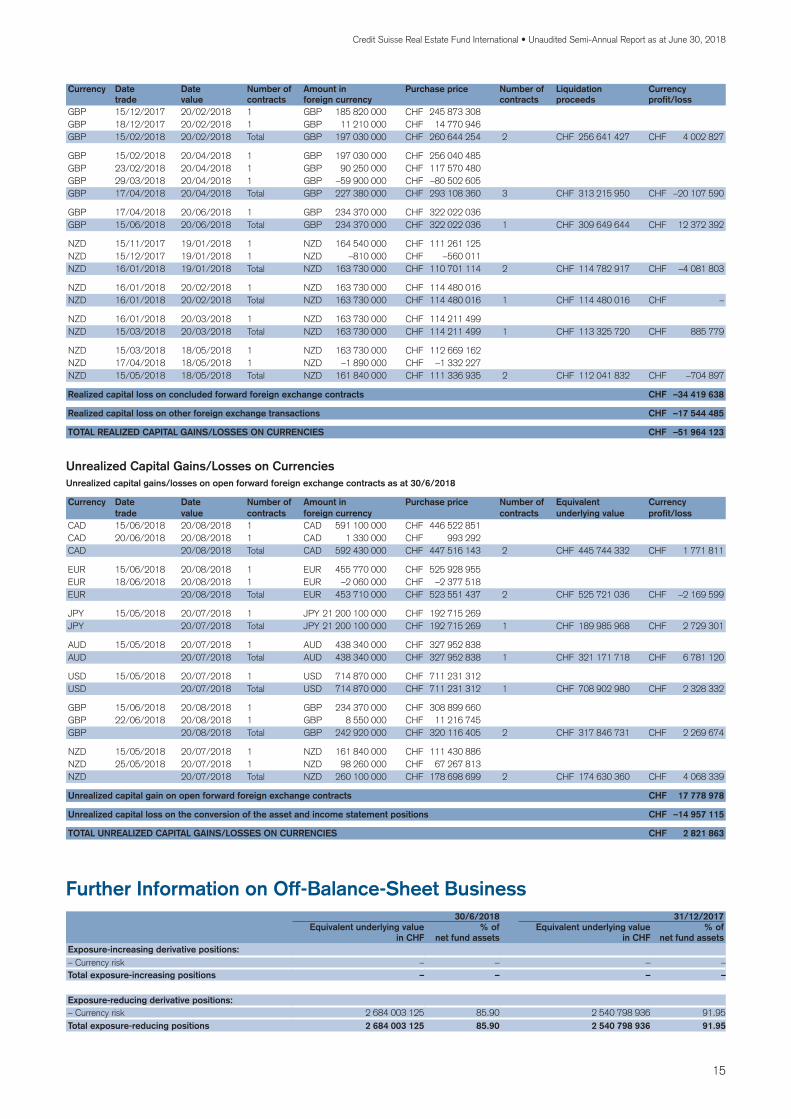
Capital Gains/Losses on CurrenciesRealized Capital Gains/Losses on CurrenciesRealized capital gains/losses on concluded forward foreign exchange contracts (1/1/ to 30/6/2018)
Currency Datetrade
Datevalue
Number ofcontracts
Amount inforeign currency
Purchase price Number ofcontracts
Liquidationproceeds
Currencyprofit/loss
CAD 15/12/2017 20/02/2018 1 CAD 537 330 000 CHF 414 267 997 CAD 22/12/2017 20/02/2018 1 CAD 2 060 000 CHF 1 593 534 CAD 23/01/2018 20/02/2018 1 CAD 2 470 000 CHF 1 895 690 CAD 15/02/2018 20/02/2018 Total CAD 541 860 000 CHF 417 757 221 3 CHF 401 480 330 CHF 16 276 891
CAD 15/02/2018 20/04/2018 1 CAD 541 860 000 CHF 399 892 680 CAD 28/02/2018 20/04/2018 1 CAD 1 840 000 CHF 1 352 958 CAD 27/03/2018 20/04/2018 1 CAD 760 000 CHF 558 839 CAD 17/04/2018 20/04/2018 Total CAD 544 460 000 CHF 401 804 477 3 CHF 416 784 130 CHF –14 979 653
CAD 17/04/2018 20/06/2018 1 CAD 586 730 000 CHF 447 428 563 CAD 22/05/2018 20/06/2018 1 CAD 4 370 000 CHF 3 405 593 CAD 15/06/2018 20/06/2018 Total CAD 591 100 000 CHF 450 834 156 2 CHF 448 349 350 CHF 2 484 806
EUR 15/12/2017 20/02/2018 1 EUR 402 760 000 CHF 468 651 536 EUR 15/02/2018 20/02/2018 Total EUR 402 760 000 CHF 468 651 536 1 CHF 465 518 063 CHF 3 133 473
EUR 15/02/2018 20/04/2018 1 EUR 402 760 000 CHF 465 187 800 EUR 17/04/2018 20/04/2018 Total EUR 402 760 000 CHF 465 187 800 1 CHF 479 203 848 CHF –14 016 048
EUR 17/04/2018 20/06/2018 1 EUR 434 560 000 CHF 516 724 432 EUR 04/06/2018 20/06/2018 1 EUR 12 950 000 CHF 14 944 119 EUR 06/06/2018 20/06/2018 1 EUR 8 260 000 CHF 9 607 644 EUR 15/06/2018 20/06/2018 Total EUR 455 770 000 CHF 541 276 195 3 CHF 526 277 619 CHF 14 998 576
JPY 15/11/2017 19/01/2018 1 JPY 20 812 400 000 CHF 181 812 964 JPY 15/12/2017 19/01/2018 1 JPY 471 200 000 CHF 4 144 030 JPY 16/01/2018 19/01/2018 Total JPY 21 283 600 000 CHF 185 956 994 2 CHF 185 507 858 CHF 449 136
JPY 16/01/2018 20/02/2018 1 JPY 21 283 600 000 CHF 185 387 605 JPY 16/01/2018 20/02/2018 Total JPY 21 283 600 000 CHF 185 387 605 1 CHF 185 387 605 CHF –
JPY 16/01/2018 20/03/2018 1 JPY 21 283 600 000 CHF 185 273 738 JPY 15/03/2018 20/03/2018 Total JPY 21 283 600 000 CHF 185 273 738 1 CHF 189 785 861 CHF –4 512 123
JPY 15/03/2018 18/05/2018 1 JPY 21 283 600 000 CHF 189 570 897 JPY 17/04/2018 18/05/2018 1 JPY –83 500 000 CHF –750 313 JPY 15/05/2018 18/05/2018 Total JPY 21 200 100 000 CHF 188 820 584 2 CHF 192 939 990 CHF –4 119 406
AUD 15/11/2017 19/01/2018 1 AUD 531 740 000 CHF 396 265 942 AUD 15/12/2017 19/01/2018 1 AUD –1 710 000 CHF –1 293 018 AUD 16/01/2018 19/01/2018 Total AUD 530 030 000 CHF 394 972 924 2 CHF 406 607 214 CHF –11 634 290
AUD 16/01/2018 20/02/2018 1 AUD 530 030 000 CHF 405 631 959 AUD 16/01/2018 20/02/2018 Total AUD 530 030 000 CHF 405 631 959 1 CHF 405 631 959 CHF –
AUD 16/01/2018 20/03/2018 1 AUD 530 030 000 CHF 404 778 611 AUD 15/03/2018 20/03/2018 Total AUD 530 030 000 CHF 404 778 611 1 CHF 394 231 014 CHF 10 547 597
AUD 15/03/2018 18/05/2018 1 AUD 530 030 000 CHF 392 158 596 AUD 12/04/2018 18/05/2018 1 AUD –51 260 000 CHF –38 108 683 AUD 17/04/2018 18/05/2018 1 AUD 25 120 000 CHF 18 756 652 AUD 18/04/2018 18/05/2018 1 AUD –65 550 000 CHF –49 106 586 AUD 15/05/2018 18/05/2018 Total AUD 438 340 000 CHF 323 699 979 4 CHF 329 640 447 CHF –5 940 468
USD 15/11/2017 19/01/2018 1 USD 688 980 000 CHF 676 475 013 USD 15/12/2017 19/01/2018 1 USD 19 380 000 CHF 19 068 893 USD 22/12/2017 19/01/2018 1 USD 1 490 000 CHF 1 470 205 USD 16/01/2018 19/01/2018 Total USD 709 850 000 CHF 697 014 111 3 CHF 684 721 310 CHF 12 292 801
USD 16/01/2018 20/02/2018 1 USD 711 480 000 CHF 684 756 811 USD 16/01/2018 20/02/2018 Total USD 711 480 000 CHF 684 756 811 1 CHF 684 756 811 CHF –
USD 16/01/2018 20/03/2018 1 USD 711 480 000 CHF 683 383 655 USD 30/01/2018 20/03/2018 1 USD –15 380 000 CHF –14 323 010 USD 15/03/2018 20/03/2018 Total USD 696 100 000 CHF 669 060 645 2 CHF 658 092 940 CHF 10 967 705
USD 15/03/2018 18/05/2018 1 USD 696 410 000 CHF 654 733 344 USD 17/04/2018 18/05/2018 1 USD 21 130 000 CHF 20 286 575 USD 15/05/2018 18/05/2018 Total USD 717 540 000 CHF 675 019 919 2 CHF 717 755 262 CHF –42 735 343
Credit Suisse Real Estate Fund International • Unaudited Semi-Annual Report as at June 30, 2018
15
Currency Datetrade
Datevalue
Number ofcontracts
Amount inforeign currency
Purchase price Number ofcontracts
Liquidationproceeds
Currencyprofit/loss
GBP 15/12/2017 20/02/2018 1 GBP 185 820 000 CHF 245 873 308 GBP 18/12/2017 20/02/2018 1 GBP 11 210 000 CHF 14 770 946 GBP 15/02/2018 20/02/2018 Total GBP 197 030 000 CHF 260 644 254 2 CHF 256 641 427 CHF 4 002 827
GBP 15/02/2018 20/04/2018 1 GBP 197 030 000 CHF 256 040 485 GBP 23/02/2018 20/04/2018 1 GBP 90 250 000 CHF 117 570 480 GBP 29/03/2018 20/04/2018 1 GBP –59 900 000 CHF –80 502 605 GBP 17/04/2018 20/04/2018 Total GBP 227 380 000 CHF 293 108 360 3 CHF 313 215 950 CHF –20 107 590
GBP 17/04/2018 20/06/2018 1 GBP 234 370 000 CHF 322 022 036 GBP 15/06/2018 20/06/2018 Total GBP 234 370 000 CHF 322 022 036 1 CHF 309 649 644 CHF 12 372 392
NZD 15/11/2017 19/01/2018 1 NZD 164 540 000 CHF 111 261 125 NZD 15/12/2017 19/01/2018 1 NZD –810 000 CHF –560 011 NZD 16/01/2018 19/01/2018 Total NZD 163 730 000 CHF 110 701 114 2 CHF 114 782 917 CHF –4 081 803
NZD 16/01/2018 20/02/2018 1 NZD 163 730 000 CHF 114 480 016 NZD 16/01/2018 20/02/2018 Total NZD 163 730 000 CHF 114 480 016 1 CHF 114 480 016 CHF –
NZD 16/01/2018 20/03/2018 1 NZD 163 730 000 CHF 114 211 499 NZD 15/03/2018 20/03/2018 Total NZD 163 730 000 CHF 114 211 499 1 CHF 113 325 720 CHF 885 779
NZD 15/03/2018 18/05/2018 1 NZD 163 730 000 CHF 112 669 162 NZD 17/04/2018 18/05/2018 1 NZD –1 890 000 CHF –1 332 227 NZD 15/05/2018 18/05/2018 Total NZD 161 840 000 CHF 111 336 935 2 CHF 112 041 832 CHF –704 897
Realized capital loss on concluded forward foreign exchange contracts CHF –34 419 638
Realized capital loss on other foreign exchange transactions CHF –17 544 485
TOTAL REALIZED CAPITAL GAINS/LOSSES ON CURRENCIES CHF –51 964 123
Unrealized Capital Gains/Losses on CurrenciesUnrealized capital gains/losses on open forward foreign exchange contracts as at 30/6/2018
Currency Datetrade
Datevalue
Number ofcontracts
Amount inforeign currency
Purchase price Number ofcontracts
Equivalentunderlying value
Currencyprofit/loss
CAD 15/06/2018 20/08/2018 1 CAD 591 100 000 CHF 446 522 851 CAD 20/06/2018 20/08/2018 1 CAD 1 330 000 CHF 993 292 CAD 20/08/2018 Total CAD 592 430 000 CHF 447 516 143 2 CHF 445 744 332 CHF 1 771 811
EUR 15/06/2018 20/08/2018 1 EUR 455 770 000 CHF 525 928 955 EUR 18/06/2018 20/08/2018 1 EUR –2 060 000 CHF –2 377 518 EUR 20/08/2018 Total EUR 453 710 000 CHF 523 551 437 2 CHF 525 721 036 CHF –2 169 599
JPY 15/05/2018 20/07/2018 1 JPY 21 200 100 000 CHF 192 715 269 JPY 20/07/2018 Total JPY 21 200 100 000 CHF 192 715 269 1 CHF 189 985 968 CHF 2 729 301
AUD 15/05/2018 20/07/2018 1 AUD 438 340 000 CHF 327 952 838 AUD 20/07/2018 Total AUD 438 340 000 CHF 327 952 838 1 CHF 321 171 718 CHF 6 781 120
USD 15/05/2018 20/07/2018 1 USD 714 870 000 CHF 711 231 312 USD 20/07/2018 Total USD 714 870 000 CHF 711 231 312 1 CHF 708 902 980 CHF 2 328 332
GBP 15/06/2018 20/08/2018 1 GBP 234 370 000 CHF 308 899 660 GBP 22/06/2018 20/08/2018 1 GBP 8 550 000 CHF 11 216 745 GBP 20/08/2018 Total GBP 242 920 000 CHF 320 116 405 2 CHF 317 846 731 CHF 2 269 674
NZD 15/05/2018 20/07/2018 1 NZD 161 840 000 CHF 111 430 886 NZD 25/05/2018 20/07/2018 1 NZD 98 260 000 CHF 67 267 813 NZD 20/07/2018 Total NZD 260 100 000 CHF 178 698 699 2 CHF 174 630 360 CHF 4 068 339
Unrealized capital gain on open forward foreign exchange contracts CHF 17 778 978
Unrealized capital loss on the conversion of the asset and income statement positions CHF –14 957 115
TOTAL UNREALIZED CAPITAL GAINS/LOSSES ON CURRENCIES CHF 2 821 863
Further Information on Off-Balance-Sheet Business
Equivalent underlying value in CHF
30/6/2018% of
net fund assetsEquivalent underlying value
in CHF
31/12/2017% of
net fund assetsExposure-increasing derivative positions:– Currency risk – – – – Total exposure-increasing positions – – – –
Exposure-reducing derivative positions:– Currency risk 2 684 003 125 85.90 2 540 798 936 91.95 Total exposure-reducing positions 2 684 003 125 85.90 2 540 798 936 91.95

Credit Suisse Real Estate Fund International • Unaudited Semi-Annual Report as at June 30, 2018
16
Dwelling units Commercial premises Location, address
Number
Country of buildings
Totalrental
premises
Totallettable
area (m2)
Site area
(m2)
Year of
construction
Acquisition
date
Ownership type
Acquisition
costs
Market value
Projected
rental income 1)
Rental losses 1)
as per- in CHF centage
Gross income(net rentalincome) 1)
Rooms
1–1.5 2–2.5 3–3.5 4–4.5 5+
Total dwelling units
No. m2 %
Parking
Retail outlets
No. m2
Offices, practices etc.
No. m2
Cinemas/hotels/restaurants
No. m2
Storerooms
No. m2
Other commer- cial premises
No. m2
Total commercial premises excl. parking
No. m2 %Residential buildingsTotal I – – – – – – – – – – – – – – – – – – – – – – – – – – – – – – – –
Commercial properties Adelaide, “G25”, 25 Grenfell Street Australia 1 80 25 276 1 956 1975 / 2007 05/01/2017 Sole ownership 101 706 286 98 307 894 3 276 344 1 242 598 37.93 2 033 746 – – – – – – – – 30 11 1 112 31 24 072 – – 3 92 5 – 50 25 276 100.00 Amsterdam, “Teleport Towers”, Kingsfordweg 151–241 Netherlands 1 152 12 319 5 065 2001 20/03/2008 Sole ownership on leased site 48 481 131 29 214 839 1 478 024 162 491 10.99 1 315 533 – – – – – – – – 127 – – 24 11 889 – – 1 430 – – 25 12 319 100.00 Amsterdam, “MediArena”, Mediarena 1–8 Netherlands 1 487 19 515 4 571 2010 01/09/2010 Sole ownership on leased site 77 865 524 60 284 588 3 263 942 – – 3 263 942 – – – – – – – – 480 – – 7 19 515 – – – – – – 7 19 515 100.00 Arnheim, Koningstraat 26–37 Netherlands 1 441 10 402 4 718 1969/2015 15/10/2007 Sole ownership 58 936 636 32 345 000 1 183 859 426 376 36.02 757 483 – – – – – – – – 412 3 1 889 16 7 810 – – 8 703 2 – 29 10 402 100.00 Berlin, Invalidenstrasse 91 Germany 1 40 6 438 1 379 2011 01/07/2011 Sole ownership 25 559 142 32 576 864 809 479 – – 809 479 – – – – – – – – 28 – – 11 6 438 – – – – 1 – 12 6 438 100.00 Berlin, “Kant Center”, Wilmersdorfer Str. 108–111, Kantstr. 112–114, Krumme Str. 48–49 Germany 2 309 20 380 6 211 1930/1993/2004 15/07/2011 Sole ownership 71 814 632 86 137 402 2 436 395 – – 2 436 395 – – – – – – – – 288 9 17 098 6 2 226 – – 6 1 056 – – 21 20 380 100.00
Boston, “Independence Wharf”, 470 Atlantic Avenue USA 1 134 31 249 3 361 1927/2001 25/09/2009 Sole ownership 114 845 809 210 505 400 5 089 587 388 472 7.63 4 701 115 – – – – – – – – 110 2 407 21 30 566 – – – – 1 276 24 31 249 100.00 Brisbane, 55 Elizabeth Street Australia 1 68 19 756 1 998 2013 17/06/2011 Sole ownership 121 479 574 178 274 763 5 424 072 – – 5 424 072 – – – – – – – – 50 3 622 14 18 627 – – 1 507 – – 18 19 756 100.00 Brisbane, 99 Melbourne Street Australia 1 50 6 393 2 706 2004 30/10/2015 Sole ownership 32 600 631 27 144 717 1 481 300 42 340 2.86 1 438 960 – – – – – – – – 39 2 355 7 6 038 – – – – 2 – 11 6 393 100.00 Bristol, “Temple Quay”, 3 Rivergate Great Britain 1 82 7 021 2 569 2002 06/08/2009 Sole ownership 30 244 174 33 953 398 1 093 887 – – 1 093 887 – – – – – – – – 75 – – 7 7 021 – – – – – – 7 7 021 100.00 Cardiff, 5 Callaghan Square Great Britain 1 41 4 909 2 450 2008 25/10/2011 Sole ownership 19 395 125 19 926 318 708 202 – – 708 202 – – – – – – – – 31 – – 10 4 909 – – – – – – 10 4 909 100.00 Chicago, 1333 North Kingsbury Street USA 1 95 9 296 5 342 1920/2015 17/02/2017 Sole ownership 27 927 807 28 299 075 1 303 019 97 740 7.50 1 205 279 – – – – – – – – 82 – – 11 9 296 – – – – 2 – 13 9 296 100.00 Chicago, 250 South Wacker Drive USA 1 89 22 757 1 811 1957/2007 15/12/2011 Sole ownership 94 966 410 99 295 000 3 275 772 184 641 5.64 3 091 131 – – – – – – – – 58 1 927 23 21 327 1 503 – – 6 – 31 22 757 100.00 The Hague,, Anna van Saksenlaan 69/71 Netherlands 1 113 9 324 4 510 2003 29/09/2006 Sole ownership on leased site 46 487 353 29 214 839 1 167 209 – – 1 167 209 – – – – – – – – 107 – – 6 9 324 – – – – – – 6 9 324 100.00 Dublin, “La Touche House”, IFSC Ireland 1 170 9 437 4 117 1990 01/05/2013 Sole ownership 42 382 196 91 354 337 2 387 773 61 108 2.56 2 326 665 – – – – – – – – 152 – – 15 9 285 – – 3 152 – – 18 9 437 100.00 Fukuoka, 1-12-64 Daimyo, Chuo-ku Japan 1 4 1 494 592 2005 22/12/2011 Sole ownership 40 223 284 42 142 020 891 609 – – 891 609 – – – – – – – – – 4 1 494 – – – – – – – – 4 1 494 100.00 Glendale, 207 Goode Avenue USA 1 12 17 569 4 168 2009 29/06/2017 Sole ownership 60 885 161 61 860 785 2 100 711 559 992 26.66 1 540 719 – – – – – – – – – – – 11 17 569 – – – – 1 – 12 17 569 100.00 Hanover, “Kontorhaus”, Ernst-August-Platz 3–3A Germany 1 29 11 065 2 848 1850/2002 01/08/2005 Sole ownership 33 592 078 39 069 050 1 042 896 7 357 0.71 1 035 539 – – – – – – – – – 2 5 296 13 4 027 – – 13 1 362 1 380 29 11 065 100.00 Houston, 919 Milam Street USA 1 478 50 439 5 806 1956/1992/2006 23/05/2013 Sole ownership 123 997 442 104 259 750 5 435 839 815 175 15.00 4 620 664 – – – – – – – – 366 10 1 356 59 46 033 6 1 437 28 1 376 9 237 112 50 439 100.00 Leeds, “One Leeds City Office Park”, Meadow Lane Great Britain 1 202 5 234 5 388 1996 16/09/2009 Sole ownership 21 368 172 16 255 681 958 259 – – 958 259 – – – – – – – – 198 – – 4 5 234 – – – – – – 4 5 234 100.00 Leeds, “Princes Exchange”, Princes Square Great Britain 1 180 10 087 6 810 1999 12/05/2016 Sole ownership 55 126 291 50 209 079 1 751 568 – – 1 751 568 – – – – – – – – 171 – – 6 9 625 – – 2 462 1 – 9 10 087 100.00 London, “Earl Place”, 15 Appold Street Great Britain 1 17 8 736 1 936 1991 10/02/2010 Sole ownership 66 913 876 104 219 889 2 258 277 – – 2 258 277 – – – – – – – – 7 – – 10 8 736 – – – – – – 10 8 736 100.00 London, “Monument”, 11 Monument Street Great Britain 1 11 8 454 1 076 2016 27/02/2018 Sole ownership 155 412 461 154 691 156 2 141 702 – – 2 141 702 – – – – – – – – – 1 319 10 8 135 – – – – – – 11 8 454 100.00 Mayence, “Römerpassage”, Adolf-Kolping-Strasse Germany 2 321 16 641 4 945 2003 28/12/2006 Sole ownership 81 725 192 85 569 335 2 448 384 65 111 2.66 2 383 273 – 29 7 – – 36 2 685 16,13 181 44 6 643 17 4 784 5 553 34 1 974 4 2 104 13 956 83.87 Melbourne, “Zurich House”, 505 Little Collins Street Australia 1 120 18 078 1 894 1991 30/04/2008 Sole ownership 73 194 996 97 574 253 2 894 613 235 807 8.15 2 658 806 – – – – – – – – 99 4 668 15 17 410 – – – – 2 – 21 18 078 100.00 Montreal, “Place du Canada”, 1010 Rue de la Gauchetière West Canada 1 477 37 093 2 907 1967 30/06/2006 Sole ownership 74 258 571 76 993 374 2 796 742 504 962 18.06 2 291 780 – – – – – – – – 353 10 932 74 34 902 – – 36 1 259 4 – 124 37 093 100.00 Munich, “Laimer Würfel”, Landsberger Strasse 300 Germany 1 197 24 718 5 353 2007 10/02/2012 Sole ownership 90 690 592 104 547 387 2 829 948 38 535 1.36 2 791 413 – – – – – – – – 161 1 344 11 19 516 3 1 924 19 1 709 2 1 225 36 24 718 100.00 Nagoya, “Glass City Sakae”, 3-11-31 Sakae, Naka-ku Japan 1 125 9 914 1 979 2008 18/12/2015 Sole ownership 68 265 593 68 936 851 1 504 689 1 692 0.11 1 502 997 – – – – – – – – 96 3 1 441 25 8 473 – – – – 1 – 29 9 914 100.00 Osaka, “Edge Honmachi”, 2-3-12 Minami-Honmachi 2-chrome, Chuo-ku, Osaka-shi Japan 1 76 7 387 3 996 1989/2017 29/09/2017 Sole ownership 54 817 581 54 862 618 1 211 390 15 791 1.30 1 195 599 – – – – – – – – 33 1 231 13 6 598 3 393 8 165 18 – 43 7 387 100.00 Osaka, “KM Building”, 20-1, 7-Chome, Fukushima, Fukushima-ku Japan 1 141 14 724 3 001 1995 22/04/2016 Sole ownership 90 196 462 91 025 330 2 058 241 136 467 6.63 1 921 774 – – – – – – – – 105 1 912 31 13 392 – – 1 53 3 367 36 14 724 100.00 Osaka, “YM Building”, 15-3, 15-4, 15-5, 15-6, 15-7, 7-Chome, Fukushima, Fukushima-ku Japan 1 95 9 968 2 872 1991 22/04/2016 Sole ownership 49 885 915 51 725 050 1 125 437 36 354 3.23 1 089 083 – – – – – – – – 59 2 936 31 9 012 – – 1 20 2 – 36 9 968 100.00
Perth, 190 St Georges Terrace Australia 1 75 9 631 1 832 1982 05/02/2016 Sole ownership 52 115 387 42 771 270 2 218 587 461 373 20.80 1 757 214 – – – – – – – – 44 1 293 26 9 338 – – – – 4 – 31 9 631 100.00 Portland, 1320 SW Broadway USA 1 84 16 324 3 696 1974 20/04/2017 Sole ownership 95 827 040 94 826 725 2 131 206 122 456 5.75 2 008 750 – – – – – – – – 67 – – 10 16 055 2 198 3 71 2 – 17 16 324 100.00 Rotterdam, “The Corner”, Binnenwegplein 26–68 Netherlands 1 12 13 639 3 013 1959/1999 12/09/2006 Sole ownership 43 276 308 46 836 488 1 519 950 – – 1 519 950 – – – – – – – – – 9 13 168 – – 1 378 2 93 – – 12 13 639 100.00 Santiago de Chile, Apoquindo 5400, Las Condes Chile 2 767 22 265 4 069 2014 15/05/2014 Condominium 68 653 699 91 112 894 3 530 013 446 899 12.66 3 083 114 – – – – – – – – 653 3 709 26 20 742 – – 85 814 – – 114 22 265 100.00 Santiago de Chile, “Edificio Magdalena Norte”, Magdalena 181, Las Condes Chile 1 284 8 651 2 025 2010 27/04/2010 Sole ownership 21 229 151 41 414 952 1 515 370 20 845 1.38 1 494 525 – – – – – – – – 226 1 88 21 8 296 – – 36 267 – – 58 8 651 100.00 Sydney*, “Latitude East Building”, 52 Goulburn Street Australia 1 474 652 – – 1 474 652 Tokyo, “Toranomon 1-chome”, 1-16-16 Toranomon, Minato-ku Japan 1 24 4 298 582 1964/2005 22/09/2006 Sole ownership 78 186 731 47 162 129 1 109 458 203 372 18.33 906 086 – – – – – – – – 4 – – 10 3 660 – – 6 638 4 – 20 4 298 100.00 Toronto, 121 Bloor Street East Canada 1 227 22 664 2 104 1982 15/02/2005 Sole ownership on leased site 42 343 650 58 952 770 2 198 337 3 437 0.16 2 194 900 – – – – – – – – 157 1 37 38 21 752 – – 21 875 10 – 70 22 664 100.00 Toronto, 160 Bloor Street East Canada 1 369 35 348 4 593 1982 15/02/2005 Sole ownership 64 549 157 136 625 497 3 618 323 13 431 0.37 3 604 892 – – – – – – – – 304 7 1 513 32 33 161 2 305 17 369 7 – 65 35 348 100.00 Vancouver, “The Exchange”, 475 Howe Street, 819-829 West Pender Street Canada 2 200 34 578 1 739 1929/2018 01/08/2011 Sole ownership 163 109 481 241 547 840 5 500 006 5 383 681 97.89 116 325 – – – – – – – – 158 4 671 26 23 128 11 10 417 – – 1 362 42 34 578 100.00 Washington, 1099 New York Avenue USA 1 169 16 460 1 610 2008 21/09/2009 Sole ownership 96 451 982 173 766 250 5 832 237 169 721 2.91 5 662 516 – – – – – – – – 137 1 211 21 15 511 1 517 8 221 1 – 32 16 460 100.00 Wellington, “Justice Centre”, 19 Aitken Street, Mulgrave Street & Kat Sheppard Place, Thorndon New Zealand 1 158 35 267 5 365 1966/2009/2011 15/11/2012 Sole ownership 112 243 794 114 959 367 4 940 358 – – 4 940 358 – – – – – – – – 132 3 277 18 34 097 – – 3 819 2 74 26 35 267 100.00
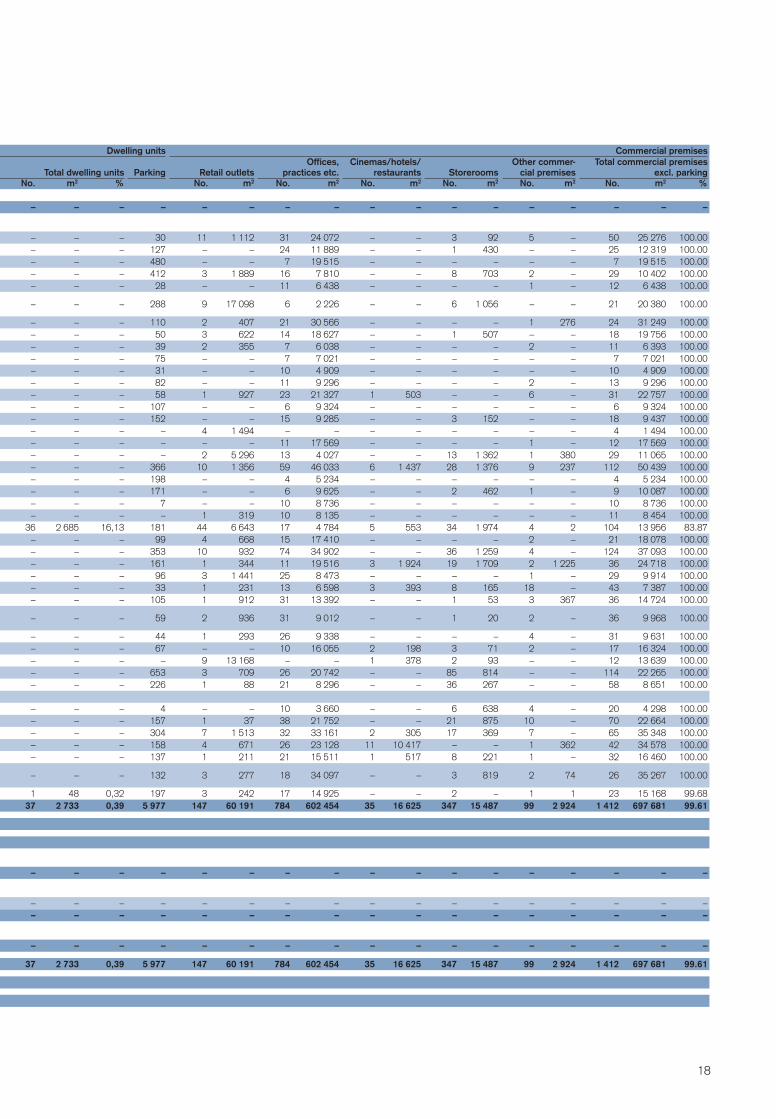
Wellington, “HSBC Tower”, 195 Lambton Quay New Zealand 1 221 15 216 1 200 2002 31/05/2018 Sole ownership 70 875 643 71 261 362 347 863 – – 347 863 – 1 – – – 1 48 0,32 197 3 242 17 14 925 – – 2 – 1 1 23 15 168 99.68 Total II 47 7 426 700 414 140 163 2 964 108 120 3 422 013 586 103 765 529 11 848 224 11.42 91 917 305 – 30 7 – – 37 2 733 0,39 5 977 147 60 191 784 602 454 35 16 625 347 15 487 99 2 924 1 412 697 681 99.61
Of which in condominium ownership 68 653 699 91 112 894 3 530 013 446 899 12.66 3 083 114
Of which under leasehold 215 177 658 177 667 036 8 107 512 165 928 2.05 7 941 584
Mixed-use properties Total III – – – – – – – – – – – – – – – – – – – – – – – – – – – – – – – –
Development land (incl. properties for demolition) and schemes under construction Cardiff, 2 Central Square Great Britain 1 – – 2 300 2018 11/10/2017 Sole ownership 68 145 826 69 479 926 – – – – – – – – – – – – – – – – – – – – – – – – – –Total IV 1 – – 2 300 68 145 826 69 479 926 – – – – – – – – – – – – – – – – – – – – – – – – – –
Lots under leasehold Total V – – – – – – – – – – – – – – – – – – – – – – – – – – – – – – – –
Total 48 7 426 700 414 142 463 3 032 253 946 3 491 493 512 103 765 529 11 848 224 11.42 91 917 305 – 30 7 – – 37 2 733 0,39 5 977 147 60 191 784 602 454 35 16 625 347 15 487 99 2 924 1 412 697 681 99.61
Of which in condominium ownership 68 653 699 91 112 894 3 530 013 446 899 12.66 3 083 114
Of which under leasehold 215 177 658 177 667 036 8 107 512 165 928 2.05 7 941 584
* Property sold during the period under review1) Non-annualized
Schedule of Properties in Swiss Francs (CHF) General Information about the Proper-ties / Financial Data on the Properties / Breakdown of Residential / Commercial PremisesOther investments in accordance with Art. 84 para. 2 lit. c CISO-FINMA

Dwelling units Commercial premises Location, address
Number
Country of buildings
Totalrental
premises
Totallettable
area (m2)
Site area
(m2)
Year of
construction
Acquisition
date
Ownership type
Acquisition
costs
Market value
Projected
rental income 1)
Rental losses 1)
as per- in CHF centage
Gross income(net rentalincome) 1)
Rooms
1–1.5 2–2.5 3–3.5 4–4.5 5+
Total dwelling units
No. m2 %
Parking
Retail outlets
No. m2
Offices, practices etc.
No. m2
Cinemas/hotels/restaurants
No. m2
Storerooms
No. m2
Other commer- cial premises
No. m2
Total commercial premises excl. parking
No. m2 %Residential buildingsTotal I – – – – – – – – – – – – – – – – – – – – – – – – – – – – – – – –
Commercial properties Adelaide, “G25”, 25 Grenfell Street Australia 1 80 25 276 1 956 1975 / 2007 05/01/2017 Sole ownership 101 706 286 98 307 894 3 276 344 1 242 598 37.93 2 033 746 – – – – – – – – 30 11 1 112 31 24 072 – – 3 92 5 – 50 25 276 100.00 Amsterdam, “Teleport Towers”, Kingsfordweg 151–241 Netherlands 1 152 12 319 5 065 2001 20/03/2008 Sole ownership on leased site 48 481 131 29 214 839 1 478 024 162 491 10.99 1 315 533 – – – – – – – – 127 – – 24 11 889 – – 1 430 – – 25 12 319 100.00 Amsterdam, “MediArena”, Mediarena 1–8 Netherlands 1 487 19 515 4 571 2010 01/09/2010 Sole ownership on leased site 77 865 524 60 284 588 3 263 942 – – 3 263 942 – – – – – – – – 480 – – 7 19 515 – – – – – – 7 19 515 100.00 Arnheim, Koningstraat 26–37 Netherlands 1 441 10 402 4 718 1969/2015 15/10/2007 Sole ownership 58 936 636 32 345 000 1 183 859 426 376 36.02 757 483 – – – – – – – – 412 3 1 889 16 7 810 – – 8 703 2 – 29 10 402 100.00 Berlin, Invalidenstrasse 91 Germany 1 40 6 438 1 379 2011 01/07/2011 Sole ownership 25 559 142 32 576 864 809 479 – – 809 479 – – – – – – – – 28 – – 11 6 438 – – – – 1 – 12 6 438 100.00 Berlin, “Kant Center”, Wilmersdorfer Str. 108–111, Kantstr. 112–114, Krumme Str. 48–49 Germany 2 309 20 380 6 211 1930/1993/2004 15/07/2011 Sole ownership 71 814 632 86 137 402 2 436 395 – – 2 436 395 – – – – – – – – 288 9 17 098 6 2 226 – – 6 1 056 – – 21 20 380 100.00
Boston, “Independence Wharf”, 470 Atlantic Avenue USA 1 134 31 249 3 361 1927/2001 25/09/2009 Sole ownership 114 845 809 210 505 400 5 089 587 388 472 7.63 4 701 115 – – – – – – – – 110 2 407 21 30 566 – – – – 1 276 24 31 249 100.00 Brisbane, 55 Elizabeth Street Australia 1 68 19 756 1 998 2013 17/06/2011 Sole ownership 121 479 574 178 274 763 5 424 072 – – 5 424 072 – – – – – – – – 50 3 622 14 18 627 – – 1 507 – – 18 19 756 100.00 Brisbane, 99 Melbourne Street Australia 1 50 6 393 2 706 2004 30/10/2015 Sole ownership 32 600 631 27 144 717 1 481 300 42 340 2.86 1 438 960 – – – – – – – – 39 2 355 7 6 038 – – – – 2 – 11 6 393 100.00 Bristol, “Temple Quay”, 3 Rivergate Great Britain 1 82 7 021 2 569 2002 06/08/2009 Sole ownership 30 244 174 33 953 398 1 093 887 – – 1 093 887 – – – – – – – – 75 – – 7 7 021 – – – – – – 7 7 021 100.00 Cardiff, 5 Callaghan Square Great Britain 1 41 4 909 2 450 2008 25/10/2011 Sole ownership 19 395 125 19 926 318 708 202 – – 708 202 – – – – – – – – 31 – – 10 4 909 – – – – – – 10 4 909 100.00 Chicago, 1333 North Kingsbury Street USA 1 95 9 296 5 342 1920/2015 17/02/2017 Sole ownership 27 927 807 28 299 075 1 303 019 97 740 7.50 1 205 279 – – – – – – – – 82 – – 11 9 296 – – – – 2 – 13 9 296 100.00 Chicago, 250 South Wacker Drive USA 1 89 22 757 1 811 1957/2007 15/12/2011 Sole ownership 94 966 410 99 295 000 3 275 772 184 641 5.64 3 091 131 – – – – – – – – 58 1 927 23 21 327 1 503 – – 6 – 31 22 757 100.00 The Hague,, Anna van Saksenlaan 69/71 Netherlands 1 113 9 324 4 510 2003 29/09/2006 Sole ownership on leased site 46 487 353 29 214 839 1 167 209 – – 1 167 209 – – – – – – – – 107 – – 6 9 324 – – – – – – 6 9 324 100.00 Dublin, “La Touche House”, IFSC Ireland 1 170 9 437 4 117 1990 01/05/2013 Sole ownership 42 382 196 91 354 337 2 387 773 61 108 2.56 2 326 665 – – – – – – – – 152 – – 15 9 285 – – 3 152 – – 18 9 437 100.00 Fukuoka, 1-12-64 Daimyo, Chuo-ku Japan 1 4 1 494 592 2005 22/12/2011 Sole ownership 40 223 284 42 142 020 891 609 – – 891 609 – – – – – – – – – 4 1 494 – – – – – – – – 4 1 494 100.00 Glendale, 207 Goode Avenue USA 1 12 17 569 4 168 2009 29/06/2017 Sole ownership 60 885 161 61 860 785 2 100 711 559 992 26.66 1 540 719 – – – – – – – – – – – 11 17 569 – – – – 1 – 12 17 569 100.00 Hanover, “Kontorhaus”, Ernst-August-Platz 3–3A Germany 1 29 11 065 2 848 1850/2002 01/08/2005 Sole ownership 33 592 078 39 069 050 1 042 896 7 357 0.71 1 035 539 – – – – – – – – – 2 5 296 13 4 027 – – 13 1 362 1 380 29 11 065 100.00 Houston, 919 Milam Street USA 1 478 50 439 5 806 1956/1992/2006 23/05/2013 Sole ownership 123 997 442 104 259 750 5 435 839 815 175 15.00 4 620 664 – – – – – – – – 366 10 1 356 59 46 033 6 1 437 28 1 376 9 237 112 50 439 100.00 Leeds, “One Leeds City Office Park”, Meadow Lane Great Britain 1 202 5 234 5 388 1996 16/09/2009 Sole ownership 21 368 172 16 255 681 958 259 – – 958 259 – – – – – – – – 198 – – 4 5 234 – – – – – – 4 5 234 100.00 Leeds, “Princes Exchange”, Princes Square Great Britain 1 180 10 087 6 810 1999 12/05/2016 Sole ownership 55 126 291 50 209 079 1 751 568 – – 1 751 568 – – – – – – – – 171 – – 6 9 625 – – 2 462 1 – 9 10 087 100.00 London, “Earl Place”, 15 Appold Street Great Britain 1 17 8 736 1 936 1991 10/02/2010 Sole ownership 66 913 876 104 219 889 2 258 277 – – 2 258 277 – – – – – – – – 7 – – 10 8 736 – – – – – – 10 8 736 100.00 London, “Monument”, 11 Monument Street Great Britain 1 11 8 454 1 076 2016 27/02/2018 Sole ownership 155 412 461 154 691 156 2 141 702 – – 2 141 702 – – – – – – – – – 1 319 10 8 135 – – – – – – 11 8 454 100.00 Mayence, “Römerpassage”, Adolf-Kolping-Strasse Germany 2 321 16 641 4 945 2003 28/12/2006 Sole ownership 81 725 192 85 569 335 2 448 384 65 111 2.66 2 383 273 – 29 7 – – 36 2 685 16,13 181 44 6 643 17 4 784 5 553 34 1 974 4 2 104 13 956 83.87 Melbourne, “Zurich House”, 505 Little Collins Street Australia 1 120 18 078 1 894 1991 30/04/2008 Sole ownership 73 194 996 97 574 253 2 894 613 235 807 8.15 2 658 806 – – – – – – – – 99 4 668 15 17 410 – – – – 2 – 21 18 078 100.00 Montreal, “Place du Canada”, 1010 Rue de la Gauchetière West Canada 1 477 37 093 2 907 1967 30/06/2006 Sole ownership 74 258 571 76 993 374 2 796 742 504 962 18.06 2 291 780 – – – – – – – – 353 10 932 74 34 902 – – 36 1 259 4 – 124 37 093 100.00 Munich, “Laimer Würfel”, Landsberger Strasse 300 Germany 1 197 24 718 5 353 2007 10/02/2012 Sole ownership 90 690 592 104 547 387 2 829 948 38 535 1.36 2 791 413 – – – – – – – – 161 1 344 11 19 516 3 1 924 19 1 709 2 1 225 36 24 718 100.00 Nagoya, “Glass City Sakae”, 3-11-31 Sakae, Naka-ku Japan 1 125 9 914 1 979 2008 18/12/2015 Sole ownership 68 265 593 68 936 851 1 504 689 1 692 0.11 1 502 997 – – – – – – – – 96 3 1 441 25 8 473 – – – – 1 – 29 9 914 100.00 Osaka, “Edge Honmachi”, 2-3-12 Minami-Honmachi 2-chrome, Chuo-ku, Osaka-shi Japan 1 76 7 387 3 996 1989/2017 29/09/2017 Sole ownership 54 817 581 54 862 618 1 211 390 15 791 1.30 1 195 599 – – – – – – – – 33 1 231 13 6 598 3 393 8 165 18 – 43 7 387 100.00 Osaka, “KM Building”, 20-1, 7-Chome, Fukushima, Fukushima-ku Japan 1 141 14 724 3 001 1995 22/04/2016 Sole ownership 90 196 462 91 025 330 2 058 241 136 467 6.63 1 921 774 – – – – – – – – 105 1 912 31 13 392 – – 1 53 3 367 36 14 724 100.00 Osaka, “YM Building”, 15-3, 15-4, 15-5, 15-6, 15-7, 7-Chome, Fukushima, Fukushima-ku Japan 1 95 9 968 2 872 1991 22/04/2016 Sole ownership 49 885 915 51 725 050 1 125 437 36 354 3.23 1 089 083 – – – – – – – – 59 2 936 31 9 012 – – 1 20 2 – 36 9 968 100.00
Perth, 190 St Georges Terrace Australia 1 75 9 631 1 832 1982 05/02/2016 Sole ownership 52 115 387 42 771 270 2 218 587 461 373 20.80 1 757 214 – – – – – – – – 44 1 293 26 9 338 – – – – 4 – 31 9 631 100.00 Portland, 1320 SW Broadway USA 1 84 16 324 3 696 1974 20/04/2017 Sole ownership 95 827 040 94 826 725 2 131 206 122 456 5.75 2 008 750 – – – – – – – – 67 – – 10 16 055 2 198 3 71 2 – 17 16 324 100.00 Rotterdam, “The Corner”, Binnenwegplein 26–68 Netherlands 1 12 13 639 3 013 1959/1999 12/09/2006 Sole ownership 43 276 308 46 836 488 1 519 950 – – 1 519 950 – – – – – – – – – 9 13 168 – – 1 378 2 93 – – 12 13 639 100.00 Santiago de Chile, Apoquindo 5400, Las Condes Chile 2 767 22 265 4 069 2014 15/05/2014 Condominium 68 653 699 91 112 894 3 530 013 446 899 12.66 3 083 114 – – – – – – – – 653 3 709 26 20 742 – – 85 814 – – 114 22 265 100.00 Santiago de Chile, “Edificio Magdalena Norte”, Magdalena 181, Las Condes Chile 1 284 8 651 2 025 2010 27/04/2010 Sole ownership 21 229 151 41 414 952 1 515 370 20 845 1.38 1 494 525 – – – – – – – – 226 1 88 21 8 296 – – 36 267 – – 58 8 651 100.00 Sydney*, “Latitude East Building”, 52 Goulburn Street Australia 1 474 652 – – 1 474 652 Tokyo, “Toranomon 1-chome”, 1-16-16 Toranomon, Minato-ku Japan 1 24 4 298 582 1964/2005 22/09/2006 Sole ownership 78 186 731 47 162 129 1 109 458 203 372 18.33 906 086 – – – – – – – – 4 – – 10 3 660 – – 6 638 4 – 20 4 298 100.00 Toronto, 121 Bloor Street East Canada 1 227 22 664 2 104 1982 15/02/2005 Sole ownership on leased site 42 343 650 58 952 770 2 198 337 3 437 0.16 2 194 900 – – – – – – – – 157 1 37 38 21 752 – – 21 875 10 – 70 22 664 100.00 Toronto, 160 Bloor Street East Canada 1 369 35 348 4 593 1982 15/02/2005 Sole ownership 64 549 157 136 625 497 3 618 323 13 431 0.37 3 604 892 – – – – – – – – 304 7 1 513 32 33 161 2 305 17 369 7 – 65 35 348 100.00 Vancouver, “The Exchange”, 475 Howe Street, 819-829 West Pender Street Canada 2 200 34 578 1 739 1929/2018 01/08/2011 Sole ownership 163 109 481 241 547 840 5 500 006 5 383 681 97.89 116 325 – – – – – – – – 158 4 671 26 23 128 11 10 417 – – 1 362 42 34 578 100.00 Washington, 1099 New York Avenue USA 1 169 16 460 1 610 2008 21/09/2009 Sole ownership 96 451 982 173 766 250 5 832 237 169 721 2.91 5 662 516 – – – – – – – – 137 1 211 21 15 511 1 517 8 221 1 – 32 16 460 100.00 Wellington, “Justice Centre”, 19 Aitken Street, Mulgrave Street & Kat Sheppard Place, Thorndon New Zealand 1 158 35 267 5 365 1966/2009/2011 15/11/2012 Sole ownership 112 243 794 114 959 367 4 940 358 – – 4 940 358 – – – – – – – – 132 3 277 18 34 097 – – 3 819 2 74 26 35 267 100.00
Wellington, “HSBC Tower”, 195 Lambton Quay New Zealand 1 221 15 216 1 200 2002 31/05/2018 Sole ownership 70 875 643 71 261 362 347 863 – – 347 863 – 1 – – – 1 48 0,32 197 3 242 17 14 925 – – 2 – 1 1 23 15 168 99.68 Total II 47 7 426 700 414 140 163 2 964 108 120 3 422 013 586 103 765 529 11 848 224 11.42 91 917 305 – 30 7 – – 37 2 733 0,39 5 977 147 60 191 784 602 454 35 16 625 347 15 487 99 2 924 1 412 697 681 99.61
Of which in condominium ownership 68 653 699 91 112 894 3 530 013 446 899 12.66 3 083 114
Of which under leasehold 215 177 658 177 667 036 8 107 512 165 928 2.05 7 941 584
Mixed-use properties Total III – – – – – – – – – – – – – – – – – – – – – – – – – – – – – – – –
Development land (incl. properties for demolition) and schemes under construction Cardiff, 2 Central Square Great Britain 1 – – 2 300 2018 11/10/2017 Sole ownership 68 145 826 69 479 926 – – – – – – – – – – – – – – – – – – – – – – – – – –Total IV 1 – – 2 300 68 145 826 69 479 926 – – – – – – – – – – – – – – – – – – – – – – – – – –
Lots under leasehold Total V – – – – – – – – – – – – – – – – – – – – – – – – – – – – – – – –
Total 48 7 426 700 414 142 463 3 032 253 946 3 491 493 512 103 765 529 11 848 224 11.42 91 917 305 – 30 7 – – 37 2 733 0,39 5 977 147 60 191 784 602 454 35 16 625 347 15 487 99 2 924 1 412 697 681 99.61
Of which in condominium ownership 68 653 699 91 112 894 3 530 013 446 899 12.66 3 083 114
Of which under leasehold 215 177 658 177 667 036 8 107 512 165 928 2.05 7 941 584
* Property sold during the period under review1) Non-annualized
18
Dwelling units Commercial premises Location, address
Number
Country of buildings
Totalrental
premises
Totallettable
area (m2)
Site area
(m2)
Year of
construction
Acquisition
date
Ownership type
Acquisition
costs
Market value
Projected
rental income 1)
Rental losses 1)
as per- in CHF centage
Gross income(net rentalincome) 1)
Rooms
1–1.5 2–2.5 3–3.5 4–4.5 5+
Total dwelling units
No. m2 %
Parking
Retail outlets
No. m2
Offices, practices etc.
No. m2
Cinemas/hotels/restaurants
No. m2
Storerooms
No. m2
Other commer- cial premises
No. m2
Total commercial premises excl. parking
No. m2 %Residential buildingsTotal I – – – – – – – – – – – – – – – – – – – – – – – – – – – – – – – –
Commercial properties Adelaide, “G25”, 25 Grenfell Street Australia 1 80 25 276 1 956 1975 / 2007 05/01/2017 Sole ownership 101 706 286 98 307 894 3 276 344 1 242 598 37.93 2 033 746 – – – – – – – – 30 11 1 112 31 24 072 – – 3 92 5 – 50 25 276 100.00 Amsterdam, “Teleport Towers”, Kingsfordweg 151–241 Netherlands 1 152 12 319 5 065 2001 20/03/2008 Sole ownership on leased site 48 481 131 29 214 839 1 478 024 162 491 10.99 1 315 533 – – – – – – – – 127 – – 24 11 889 – – 1 430 – – 25 12 319 100.00 Amsterdam, “MediArena”, Mediarena 1–8 Netherlands 1 487 19 515 4 571 2010 01/09/2010 Sole ownership on leased site 77 865 524 60 284 588 3 263 942 – – 3 263 942 – – – – – – – – 480 – – 7 19 515 – – – – – – 7 19 515 100.00 Arnheim, Koningstraat 26–37 Netherlands 1 441 10 402 4 718 1969/2015 15/10/2007 Sole ownership 58 936 636 32 345 000 1 183 859 426 376 36.02 757 483 – – – – – – – – 412 3 1 889 16 7 810 – – 8 703 2 – 29 10 402 100.00 Berlin, Invalidenstrasse 91 Germany 1 40 6 438 1 379 2011 01/07/2011 Sole ownership 25 559 142 32 576 864 809 479 – – 809 479 – – – – – – – – 28 – – 11 6 438 – – – – 1 – 12 6 438 100.00 Berlin, “Kant Center”, Wilmersdorfer Str. 108–111, Kantstr. 112–114, Krumme Str. 48–49 Germany 2 309 20 380 6 211 1930/1993/2004 15/07/2011 Sole ownership 71 814 632 86 137 402 2 436 395 – – 2 436 395 – – – – – – – – 288 9 17 098 6 2 226 – – 6 1 056 – – 21 20 380 100.00
Boston, “Independence Wharf”, 470 Atlantic Avenue USA 1 134 31 249 3 361 1927/2001 25/09/2009 Sole ownership 114 845 809 210 505 400 5 089 587 388 472 7.63 4 701 115 – – – – – – – – 110 2 407 21 30 566 – – – – 1 276 24 31 249 100.00 Brisbane, 55 Elizabeth Street Australia 1 68 19 756 1 998 2013 17/06/2011 Sole ownership 121 479 574 178 274 763 5 424 072 – – 5 424 072 – – – – – – – – 50 3 622 14 18 627 – – 1 507 – – 18 19 756 100.00 Brisbane, 99 Melbourne Street Australia 1 50 6 393 2 706 2004 30/10/2015 Sole ownership 32 600 631 27 144 717 1 481 300 42 340 2.86 1 438 960 – – – – – – – – 39 2 355 7 6 038 – – – – 2 – 11 6 393 100.00 Bristol, “Temple Quay”, 3 Rivergate Great Britain 1 82 7 021 2 569 2002 06/08/2009 Sole ownership 30 244 174 33 953 398 1 093 887 – – 1 093 887 – – – – – – – – 75 – – 7 7 021 – – – – – – 7 7 021 100.00 Cardiff, 5 Callaghan Square Great Britain 1 41 4 909 2 450 2008 25/10/2011 Sole ownership 19 395 125 19 926 318 708 202 – – 708 202 – – – – – – – – 31 – – 10 4 909 – – – – – – 10 4 909 100.00 Chicago, 1333 North Kingsbury Street USA 1 95 9 296 5 342 1920/2015 17/02/2017 Sole ownership 27 927 807 28 299 075 1 303 019 97 740 7.50 1 205 279 – – – – – – – – 82 – – 11 9 296 – – – – 2 – 13 9 296 100.00 Chicago, 250 South Wacker Drive USA 1 89 22 757 1 811 1957/2007 15/12/2011 Sole ownership 94 966 410 99 295 000 3 275 772 184 641 5.64 3 091 131 – – – – – – – – 58 1 927 23 21 327 1 503 – – 6 – 31 22 757 100.00 The Hague,, Anna van Saksenlaan 69/71 Netherlands 1 113 9 324 4 510 2003 29/09/2006 Sole ownership on leased site 46 487 353 29 214 839 1 167 209 – – 1 167 209 – – – – – – – – 107 – – 6 9 324 – – – – – – 6 9 324 100.00 Dublin, “La Touche House”, IFSC Ireland 1 170 9 437 4 117 1990 01/05/2013 Sole ownership 42 382 196 91 354 337 2 387 773 61 108 2.56 2 326 665 – – – – – – – – 152 – – 15 9 285 – – 3 152 – – 18 9 437 100.00 Fukuoka, 1-12-64 Daimyo, Chuo-ku Japan 1 4 1 494 592 2005 22/12/2011 Sole ownership 40 223 284 42 142 020 891 609 – – 891 609 – – – – – – – – – 4 1 494 – – – – – – – – 4 1 494 100.00 Glendale, 207 Goode Avenue USA 1 12 17 569 4 168 2009 29/06/2017 Sole ownership 60 885 161 61 860 785 2 100 711 559 992 26.66 1 540 719 – – – – – – – – – – – 11 17 569 – – – – 1 – 12 17 569 100.00 Hanover, “Kontorhaus”, Ernst-August-Platz 3–3A Germany 1 29 11 065 2 848 1850/2002 01/08/2005 Sole ownership 33 592 078 39 069 050 1 042 896 7 357 0.71 1 035 539 – – – – – – – – – 2 5 296 13 4 027 – – 13 1 362 1 380 29 11 065 100.00 Houston, 919 Milam Street USA 1 478 50 439 5 806 1956/1992/2006 23/05/2013 Sole ownership 123 997 442 104 259 750 5 435 839 815 175 15.00 4 620 664 – – – – – – – – 366 10 1 356 59 46 033 6 1 437 28 1 376 9 237 112 50 439 100.00 Leeds, “One Leeds City Office Park”, Meadow Lane Great Britain 1 202 5 234 5 388 1996 16/09/2009 Sole ownership 21 368 172 16 255 681 958 259 – – 958 259 – – – – – – – – 198 – – 4 5 234 – – – – – – 4 5 234 100.00 Leeds, “Princes Exchange”, Princes Square Great Britain 1 180 10 087 6 810 1999 12/05/2016 Sole ownership 55 126 291 50 209 079 1 751 568 – – 1 751 568 – – – – – – – – 171 – – 6 9 625 – – 2 462 1 – 9 10 087 100.00 London, “Earl Place”, 15 Appold Street Great Britain 1 17 8 736 1 936 1991 10/02/2010 Sole ownership 66 913 876 104 219 889 2 258 277 – – 2 258 277 – – – – – – – – 7 – – 10 8 736 – – – – – – 10 8 736 100.00 London, “Monument”, 11 Monument Street Great Britain 1 11 8 454 1 076 2016 27/02/2018 Sole ownership 155 412 461 154 691 156 2 141 702 – – 2 141 702 – – – – – – – – – 1 319 10 8 135 – – – – – – 11 8 454 100.00 Mayence, “Römerpassage”, Adolf-Kolping-Strasse Germany 2 321 16 641 4 945 2003 28/12/2006 Sole ownership 81 725 192 85 569 335 2 448 384 65 111 2.66 2 383 273 – 29 7 – – 36 2 685 16,13 181 44 6 643 17 4 784 5 553 34 1 974 4 2 104 13 956 83.87 Melbourne, “Zurich House”, 505 Little Collins Street Australia 1 120 18 078 1 894 1991 30/04/2008 Sole ownership 73 194 996 97 574 253 2 894 613 235 807 8.15 2 658 806 – – – – – – – – 99 4 668 15 17 410 – – – – 2 – 21 18 078 100.00 Montreal, “Place du Canada”, 1010 Rue de la Gauchetière West Canada 1 477 37 093 2 907 1967 30/06/2006 Sole ownership 74 258 571 76 993 374 2 796 742 504 962 18.06 2 291 780 – – – – – – – – 353 10 932 74 34 902 – – 36 1 259 4 – 124 37 093 100.00 Munich, “Laimer Würfel”, Landsberger Strasse 300 Germany 1 197 24 718 5 353 2007 10/02/2012 Sole ownership 90 690 592 104 547 387 2 829 948 38 535 1.36 2 791 413 – – – – – – – – 161 1 344 11 19 516 3 1 924 19 1 709 2 1 225 36 24 718 100.00 Nagoya, “Glass City Sakae”, 3-11-31 Sakae, Naka-ku Japan 1 125 9 914 1 979 2008 18/12/2015 Sole ownership 68 265 593 68 936 851 1 504 689 1 692 0.11 1 502 997 – – – – – – – – 96 3 1 441 25 8 473 – – – – 1 – 29 9 914 100.00 Osaka, “Edge Honmachi”, 2-3-12 Minami-Honmachi 2-chrome, Chuo-ku, Osaka-shi Japan 1 76 7 387 3 996 1989/2017 29/09/2017 Sole ownership 54 817 581 54 862 618 1 211 390 15 791 1.30 1 195 599 – – – – – – – – 33 1 231 13 6 598 3 393 8 165 18 – 43 7 387 100.00 Osaka, “KM Building”, 20-1, 7-Chome, Fukushima, Fukushima-ku Japan 1 141 14 724 3 001 1995 22/04/2016 Sole ownership 90 196 462 91 025 330 2 058 241 136 467 6.63 1 921 774 – – – – – – – – 105 1 912 31 13 392 – – 1 53 3 367 36 14 724 100.00 Osaka, “YM Building”, 15-3, 15-4, 15-5, 15-6, 15-7, 7-Chome, Fukushima, Fukushima-ku Japan 1 95 9 968 2 872 1991 22/04/2016 Sole ownership 49 885 915 51 725 050 1 125 437 36 354 3.23 1 089 083 – – – – – – – – 59 2 936 31 9 012 – – 1 20 2 – 36 9 968 100.00
Perth, 190 St Georges Terrace Australia 1 75 9 631 1 832 1982 05/02/2016 Sole ownership 52 115 387 42 771 270 2 218 587 461 373 20.80 1 757 214 – – – – – – – – 44 1 293 26 9 338 – – – – 4 – 31 9 631 100.00 Portland, 1320 SW Broadway USA 1 84 16 324 3 696 1974 20/04/2017 Sole ownership 95 827 040 94 826 725 2 131 206 122 456 5.75 2 008 750 – – – – – – – – 67 – – 10 16 055 2 198 3 71 2 – 17 16 324 100.00 Rotterdam, “The Corner”, Binnenwegplein 26–68 Netherlands 1 12 13 639 3 013 1959/1999 12/09/2006 Sole ownership 43 276 308 46 836 488 1 519 950 – – 1 519 950 – – – – – – – – – 9 13 168 – – 1 378 2 93 – – 12 13 639 100.00 Santiago de Chile, Apoquindo 5400, Las Condes Chile 2 767 22 265 4 069 2014 15/05/2014 Condominium 68 653 699 91 112 894 3 530 013 446 899 12.66 3 083 114 – – – – – – – – 653 3 709 26 20 742 – – 85 814 – – 114 22 265 100.00 Santiago de Chile, “Edificio Magdalena Norte”, Magdalena 181, Las Condes Chile 1 284 8 651 2 025 2010 27/04/2010 Sole ownership 21 229 151 41 414 952 1 515 370 20 845 1.38 1 494 525 – – – – – – – – 226 1 88 21 8 296 – – 36 267 – – 58 8 651 100.00 Sydney*, “Latitude East Building”, 52 Goulburn Street Australia 1 474 652 – – 1 474 652 Tokyo, “Toranomon 1-chome”, 1-16-16 Toranomon, Minato-ku Japan 1 24 4 298 582 1964/2005 22/09/2006 Sole ownership 78 186 731 47 162 129 1 109 458 203 372 18.33 906 086 – – – – – – – – 4 – – 10 3 660 – – 6 638 4 – 20 4 298 100.00 Toronto, 121 Bloor Street East Canada 1 227 22 664 2 104 1982 15/02/2005 Sole ownership on leased site 42 343 650 58 952 770 2 198 337 3 437 0.16 2 194 900 – – – – – – – – 157 1 37 38 21 752 – – 21 875 10 – 70 22 664 100.00 Toronto, 160 Bloor Street East Canada 1 369 35 348 4 593 1982 15/02/2005 Sole ownership 64 549 157 136 625 497 3 618 323 13 431 0.37 3 604 892 – – – – – – – – 304 7 1 513 32 33 161 2 305 17 369 7 – 65 35 348 100.00 Vancouver, “The Exchange”, 475 Howe Street, 819-829 West Pender Street Canada 2 200 34 578 1 739 1929/2018 01/08/2011 Sole ownership 163 109 481 241 547 840 5 500 006 5 383 681 97.89 116 325 – – – – – – – – 158 4 671 26 23 128 11 10 417 – – 1 362 42 34 578 100.00 Washington, 1099 New York Avenue USA 1 169 16 460 1 610 2008 21/09/2009 Sole ownership 96 451 982 173 766 250 5 832 237 169 721 2.91 5 662 516 – – – – – – – – 137 1 211 21 15 511 1 517 8 221 1 – 32 16 460 100.00 Wellington, “Justice Centre”, 19 Aitken Street, Mulgrave Street & Kat Sheppard Place, Thorndon New Zealand 1 158 35 267 5 365 1966/2009/2011 15/11/2012 Sole ownership 112 243 794 114 959 367 4 940 358 – – 4 940 358 – – – – – – – – 132 3 277 18 34 097 – – 3 819 2 74 26 35 267 100.00
Wellington, “HSBC Tower”, 195 Lambton Quay New Zealand 1 221 15 216 1 200 2002 31/05/2018 Sole ownership 70 875 643 71 261 362 347 863 – – 347 863 – 1 – – – 1 48 0,32 197 3 242 17 14 925 – – 2 – 1 1 23 15 168 99.68 Total II 47 7 426 700 414 140 163 2 964 108 120 3 422 013 586 103 765 529 11 848 224 11.42 91 917 305 – 30 7 – – 37 2 733 0,39 5 977 147 60 191 784 602 454 35 16 625 347 15 487 99 2 924 1 412 697 681 99.61
Of which in condominium ownership 68 653 699 91 112 894 3 530 013 446 899 12.66 3 083 114
Of which under leasehold 215 177 658 177 667 036 8 107 512 165 928 2.05 7 941 584
Mixed-use properties Total III – – – – – – – – – – – – – – – – – – – – – – – – – – – – – – – –
Development land (incl. properties for demolition) and schemes under construction Cardiff, 2 Central Square Great Britain 1 – – 2 300 2018 11/10/2017 Sole ownership 68 145 826 69 479 926 – – – – – – – – – – – – – – – – – – – – – – – – – –Total IV 1 – – 2 300 68 145 826 69 479 926 – – – – – – – – – – – – – – – – – – – – – – – – – –
Lots under leasehold Total V – – – – – – – – – – – – – – – – – – – – – – – – – – – – – – – –
Total 48 7 426 700 414 142 463 3 032 253 946 3 491 493 512 103 765 529 11 848 224 11.42 91 917 305 – 30 7 – – 37 2 733 0,39 5 977 147 60 191 784 602 454 35 16 625 347 15 487 99 2 924 1 412 697 681 99.61
Of which in condominium ownership 68 653 699 91 112 894 3 530 013 446 899 12.66 3 083 114
Of which under leasehold 215 177 658 177 667 036 8 107 512 165 928 2.05 7 941 584
* Property sold during the period under review1) Non-annualized


Credit Suisse Real Estate Fund International • Unaudited Semi-Annual Report as at June 30, 2018
20
Schedule of Properties (Local Currencies) Financial Data on the Properties
Location, address
Country
Acquisition costs
in national currency
Market value
in national currency
Projected rental income 1)
in national currency
Rental losses 1) � as per� in national currency centage
Gross income(net rental income)
in national currency 1)
Yen (JPY)Fukuoka, 1-12-64 Daimyo, Chuo-ku Japan 4 486 962 377 4 701 000 000 100 110 480 – – 100 110 480 Nagoya, “Glass City Sakae”, 3-11-31 Sakae, Naka-ku Japan 7 615 120 268 7 690 000 000 168 947 521 190 000 0.11 168 757 521 Osaka, “Edge Honmachi”, 2-3-12 Minami-Honmachi 2-chrome, Chuo-ku, Osaka-shi Japan 6 114 976 075 6 120 000 000 136 015 702 1 772 980 1.30 134 242 722 Osaka, “KM Building”, 20-1, 7-Chome, Fukushima, Fukushima-ku Japan 10 061 538 639 10 154 000 000 231 100 735 15 322 562 6.63 215 778 173 Osaka, “YM Building”, 15-3, 15-4, 15-5, 15-6, 15-7, 7-Chome, Fukushima, Fukushima-ku Japan 5 564 841 995 5 770 000 000 126 364 854 4 081 816 3.23 122 283 038 Tokyo, “Toranomon 1-chome”, 1-16-16 Toranomon, Minato-ku Japan 8 721 836 723 5 261 000 000 124 570 738 22 834 800 18.33 101 735 938 Total JPY 42 565 276 077 39 696 000 000 887 110 030 44 202 158 4.98 842 907 872
Euro (EUR)Amsterdam, “Teleport Towers”, Kingsfordweg 151–241 Netherlands 41 818 629 25 200 000 1 268 459 139 452 10.99 1 129 007 Amsterdam, “MediArena”, Mediarena 1–8 Netherlands 67 164 882 52 000 000 2 801 157 – – 2 801 157 Arnheim, Koningstraat 26–37 Netherlands 50 837 290 27 900 000 1 016 003 365 921 36.02 650 082 Berlin, Invalidenstrasse 91 Germany 22 046 686 28 100 000 694 705 – – 694 705 Berlin, “Kant Center”, Wilmersdorfer Str. 108–111, Kantstr. 112–114, Krumme Str. 48–49 Germany 61 945 532 74 300 000 2 090 946 – – 2 090 946 The Hague,, Anna van Saksenlaan 69/71 Netherlands 40 098 845 25 200 000 1 001 714 – – 1 001 714 Dublin, “La Touche House”, IFSC Ireland 36 557 838 78 800 000 2 049 218 52 444 2.56 1 996 774 Hanover, “Kontorhaus”, Ernst-August-Platz 3–3A Germany 28 975 699 33 700 000 895 027 6 314 0.71 888 713 Mayence, “Römerpassage”, Adolf-Kolping-Strasse Germany 70 494 137 73 810 000 2 101 235 55 879 2.66 2 045 356 Munich, “Laimer Würfel”, Landsberger Strasse 300 Germany 78 227 470 90 180 000 2 428 698 33 071 1.36 2 395 627 Rotterdam, “The Corner”, Binnenwegplein 26–68 Netherlands 37 329 077 40 400 000 1 304 441 – – 1 304 441 Total EUR 535 496 085 549 590 000 17 651 603 653 081 3.70 16 998 522
Canadian dollar (CAD)Montreal, “Place du Canada”, 1010 Rue de la Gauchetière West Canada 98 376 962 102 000 000 3 710 014 669 857 18.06 3 040 157 Toronto, 121 Bloor Street East Canada 56 096 416 78 100 000 2 916 201 4 560 0.16 2 911 641 Toronto, 160 Bloor Street East Canada 85 514 034 181 000 000 4 799 881 17 817 0.37 4 782 064 Vancouver, “The Exchange”, 475 Howe Street, 819–829 West Pender Street Canada 216 085 699 320 000 000 7 296 025 7 141 714 97.89 154 311 Total CAD 456 073 111 681 100 000 18 722 121 7 833 948 41.84 10 888 173
Pound sterling (GBP)Bristol, “Temple Quay”, 3 Rivergate Great Britain 23 070 566 25 900 000 825 575 – – 825 575 Cardiff, 5 Callaghan Square Great Britain 14 794 800 15 200 000 534 492 – – 534 492 Cardiff, 2 Central Square Great Britain 51 982 335 53 000 000 – – – –Leeds, “One Leeds City Office Park”, Meadow Lane Great Britain 16 299 861 12 400 000 723 214 – – 723 214 Leeds, “Princes Exchange”, Princes Square Great Britain 42 050 900 38 300 000 1 321 938 – – 1 321 938 London, “Earl Place”, 15 Appold Street Great Britain 51 042 591 79 500 000 1 704 360 – – 1 704 360 London, “Monument”, 11 Monument Street Great Britain 118 550 219 118 000 000 1 616 379 – – 1 616 379 Total GBP 317 791 272 342 300 000 6 725 958 – – 6 725 958
Australian dollar (AUD)Adelaide, “G25”, 25 Grenfell Street Australia 138 632 227 134 000 000 4 419 101 1 676 004 37.93 2 743 097 Brisbane, 55 Elizabeth Street Australia 165 584 494 243 000 000 7 315 937 – – 7 315 937 Brisbane, 99 Melbourne Street Australia 44 436 763 37 000 000 1 997 963 57 108 2.86 1 940 855 Melbourne, “Zurich House”, 505 Little Collins Street Australia 99 769 500 133 000 000 3 904 226 318 054 8.15 3 586 172 Perth, 190 St Georges Terrace Australia 71 036 634 58 300 000 2 992 409 622 295 20.80 2 370 114 Sydney*, “Latitude East Building”, 52 Goulburn Street Australia 1 988 997 – – 1 988 997 Total AUD 519 459 618 605 300 000 22 618 633 2 673 461 11.82 19 945 172
US dollar (USD)Boston, “Independence Wharf”, 470 Atlantic Avenue USA 115 661 221 212 000 000 5 266 723 401 993 7.63 4 864 730 Chicago, 1333 North Kingsbury Street USA 28 126 096 28 500 000 1 348 369 101 142 7.50 1 247 227 Chicago, 250 South Wacker Drive USA 95 640 677 100 000 000 3 389 780 191 067 5.64 3 198 713 Glendale, 207 Goode Avenue USA 61 317 449 62 300 000 2 173 823 579 481 26.66 1 594 342 Houston, 919 Milam Street USA 124 877 831 105 000 000 5 625 025 843 545 15.00 4 781 480 Portland, 1320 SW Broadway USA 96 507 417 95 500 000 2 205 380 126 718 5.75 2 078 662 Washington, 1099 New York Avenue USA 97 136 796 175 000 000 6 035 220 175 628 2.91 5 859 592 Total USD 619 267 487 778 300 000 26 044 320 2 419 574 9.29 23 624 746
Chilean pesos (CLP)Santiago de Chile, Apoquindo 5400, Las Condes Chile 45 021 179 000 59 749 294 000 2 248 015 000 284 598 400 12.66 1 963 416 600 Santiago de Chile, “Edificio Magdalena Norte”, Magdalena 181, Las Condes Chile 13 921 485 000 27 158 770 000 965 032 000 13 275 000 1.38 951 757 000 Total CLP 58 942 664 000 86 908 064 000 3 213 047 000 297 873 400 9.27 2 915 173 600
New Zealand dollar (NZD)Wellington, “Justice Centre”, 19 Aitken Street, Mulgrave Street & Kat Sheppard Place, Thorndon New Zealand 166 960 634 171 000 000 7 193 174 – – 7 193 174 Wellington, “HSBC Tower”, 195 Lambton Quay New Zealand 105 426 250 106 000 000 506 489 – – 506 489 Total NZD 272 386 884 277 000 000 7 699 663 – – 7 699 663
1) Non-annualized* Property sold during the period under review

Credit Suisse Real Estate Fund International • Unaudited Semi-Annual Report as at June 30, 2018
21
Location, address
Country
Acquisition costs
in national currency
Market value
in national currency
Projected rental income 1)
in national currency
Rental losses 1) � as per� in national currency centage
Gross income(net rental income)
in national currency 1)
Yen (JPY)Fukuoka, 1-12-64 Daimyo, Chuo-ku Japan 4 486 962 377 4 701 000 000 100 110 480 – – 100 110 480 Nagoya, “Glass City Sakae”, 3-11-31 Sakae, Naka-ku Japan 7 615 120 268 7 690 000 000 168 947 521 190 000 0.11 168 757 521 Osaka, “Edge Honmachi”, 2-3-12 Minami-Honmachi 2-chrome, Chuo-ku, Osaka-shi Japan 6 114 976 075 6 120 000 000 136 015 702 1 772 980 1.30 134 242 722 Osaka, “KM Building”, 20-1, 7-Chome, Fukushima, Fukushima-ku Japan 10 061 538 639 10 154 000 000 231 100 735 15 322 562 6.63 215 778 173 Osaka, “YM Building”, 15-3, 15-4, 15-5, 15-6, 15-7, 7-Chome, Fukushima, Fukushima-ku Japan 5 564 841 995 5 770 000 000 126 364 854 4 081 816 3.23 122 283 038 Tokyo, “Toranomon 1-chome”, 1-16-16 Toranomon, Minato-ku Japan 8 721 836 723 5 261 000 000 124 570 738 22 834 800 18.33 101 735 938 Total JPY 42 565 276 077 39 696 000 000 887 110 030 44 202 158 4.98 842 907 872
Euro (EUR)Amsterdam, “Teleport Towers”, Kingsfordweg 151–241 Netherlands 41 818 629 25 200 000 1 268 459 139 452 10.99 1 129 007 Amsterdam, “MediArena”, Mediarena 1–8 Netherlands 67 164 882 52 000 000 2 801 157 – – 2 801 157 Arnheim, Koningstraat 26–37 Netherlands 50 837 290 27 900 000 1 016 003 365 921 36.02 650 082 Berlin, Invalidenstrasse 91 Germany 22 046 686 28 100 000 694 705 – – 694 705 Berlin, “Kant Center”, Wilmersdorfer Str. 108–111, Kantstr. 112–114, Krumme Str. 48–49 Germany 61 945 532 74 300 000 2 090 946 – – 2 090 946 The Hague,, Anna van Saksenlaan 69/71 Netherlands 40 098 845 25 200 000 1 001 714 – – 1 001 714 Dublin, “La Touche House”, IFSC Ireland 36 557 838 78 800 000 2 049 218 52 444 2.56 1 996 774 Hanover, “Kontorhaus”, Ernst-August-Platz 3–3A Germany 28 975 699 33 700 000 895 027 6 314 0.71 888 713 Mayence, “Römerpassage”, Adolf-Kolping-Strasse Germany 70 494 137 73 810 000 2 101 235 55 879 2.66 2 045 356 Munich, “Laimer Würfel”, Landsberger Strasse 300 Germany 78 227 470 90 180 000 2 428 698 33 071 1.36 2 395 627 Rotterdam, “The Corner”, Binnenwegplein 26–68 Netherlands 37 329 077 40 400 000 1 304 441 – – 1 304 441 Total EUR 535 496 085 549 590 000 17 651 603 653 081 3.70 16 998 522
Canadian dollar (CAD)Montreal, “Place du Canada”, 1010 Rue de la Gauchetière West Canada 98 376 962 102 000 000 3 710 014 669 857 18.06 3 040 157 Toronto, 121 Bloor Street East Canada 56 096 416 78 100 000 2 916 201 4 560 0.16 2 911 641 Toronto, 160 Bloor Street East Canada 85 514 034 181 000 000 4 799 881 17 817 0.37 4 782 064 Vancouver, “The Exchange”, 475 Howe Street, 819–829 West Pender Street Canada 216 085 699 320 000 000 7 296 025 7 141 714 97.89 154 311 Total CAD 456 073 111 681 100 000 18 722 121 7 833 948 41.84 10 888 173
Pound sterling (GBP)Bristol, “Temple Quay”, 3 Rivergate Great Britain 23 070 566 25 900 000 825 575 – – 825 575 Cardiff, 5 Callaghan Square Great Britain 14 794 800 15 200 000 534 492 – – 534 492 Cardiff, 2 Central Square Great Britain 51 982 335 53 000 000 – – – –Leeds, “One Leeds City Office Park”, Meadow Lane Great Britain 16 299 861 12 400 000 723 214 – – 723 214 Leeds, “Princes Exchange”, Princes Square Great Britain 42 050 900 38 300 000 1 321 938 – – 1 321 938 London, “Earl Place”, 15 Appold Street Great Britain 51 042 591 79 500 000 1 704 360 – – 1 704 360 London, “Monument”, 11 Monument Street Great Britain 118 550 219 118 000 000 1 616 379 – – 1 616 379 Total GBP 317 791 272 342 300 000 6 725 958 – – 6 725 958
Australian dollar (AUD)Adelaide, “G25”, 25 Grenfell Street Australia 138 632 227 134 000 000 4 419 101 1 676 004 37.93 2 743 097 Brisbane, 55 Elizabeth Street Australia 165 584 494 243 000 000 7 315 937 – – 7 315 937 Brisbane, 99 Melbourne Street Australia 44 436 763 37 000 000 1 997 963 57 108 2.86 1 940 855 Melbourne, “Zurich House”, 505 Little Collins Street Australia 99 769 500 133 000 000 3 904 226 318 054 8.15 3 586 172 Perth, 190 St Georges Terrace Australia 71 036 634 58 300 000 2 992 409 622 295 20.80 2 370 114 Sydney*, “Latitude East Building”, 52 Goulburn Street Australia 1 988 997 – – 1 988 997 Total AUD 519 459 618 605 300 000 22 618 633 2 673 461 11.82 19 945 172
US dollar (USD)Boston, “Independence Wharf”, 470 Atlantic Avenue USA 115 661 221 212 000 000 5 266 723 401 993 7.63 4 864 730 Chicago, 1333 North Kingsbury Street USA 28 126 096 28 500 000 1 348 369 101 142 7.50 1 247 227 Chicago, 250 South Wacker Drive USA 95 640 677 100 000 000 3 389 780 191 067 5.64 3 198 713 Glendale, 207 Goode Avenue USA 61 317 449 62 300 000 2 173 823 579 481 26.66 1 594 342 Houston, 919 Milam Street USA 124 877 831 105 000 000 5 625 025 843 545 15.00 4 781 480 Portland, 1320 SW Broadway USA 96 507 417 95 500 000 2 205 380 126 718 5.75 2 078 662 Washington, 1099 New York Avenue USA 97 136 796 175 000 000 6 035 220 175 628 2.91 5 859 592 Total USD 619 267 487 778 300 000 26 044 320 2 419 574 9.29 23 624 746
Chilean pesos (CLP)Santiago de Chile, Apoquindo 5400, Las Condes Chile 45 021 179 000 59 749 294 000 2 248 015 000 284 598 400 12.66 1 963 416 600 Santiago de Chile, “Edificio Magdalena Norte”, Magdalena 181, Las Condes Chile 13 921 485 000 27 158 770 000 965 032 000 13 275 000 1.38 951 757 000 Total CLP 58 942 664 000 86 908 064 000 3 213 047 000 297 873 400 9.27 2 915 173 600
New Zealand dollar (NZD)Wellington, “Justice Centre”, 19 Aitken Street, Mulgrave Street & Kat Sheppard Place, Thorndon New Zealand 166 960 634 171 000 000 7 193 174 – – 7 193 174 Wellington, “HSBC Tower”, 195 Lambton Quay New Zealand 105 426 250 106 000 000 506 489 – – 506 489 Total NZD 272 386 884 277 000 000 7 699 663 – – 7 699 663
1) Non-annualized* Property sold during the period under review

Credit Suisse Real Estate Fund International • Unaudited Semi-Annual Report as at June 30, 2018
22
Brief report for the period January 1 – June 30, 2018
Credit Suisse Real Estate Fund International is the first real estate fund under Swiss law to undertake direct investment in foreign real estate. The Fund grants qualified investors access to an internationally diversified portfolio of high-quality commercial properties. The custodian bank performs off-floor trading for the Fund.
Despite a slight slowdown in the momentum of economic growth compared with the second half of 2017, particularly in Europe, the global economic environment remained solid in the first half of 2018. In the euro-zone, real economic growth remained close to 2% p.a. and was supported by a positive labor market trend. Ireland, Spain and the Netherlands are continuing to enjoy higher-than-average growth, while real economic activity in Germany and France is supported by the domestic market. In the first half of 2018, core inflation remained close to 1%, which is well below the European Central Bank›s inflation target. At its June meeting, the ECB therefore announced that it did not intend to raise interest rates until at least mid-2019.
Developments in the UK are still hampered by the uncertainties surrounding the implementation of Brexit. These are reflected in lower, but still positive growth rates.
By contrast, the US economy has been booming and saw a further acceleration in economic activity. The labor market is continuing to power ahead and corporate sentiment remained optimistic thanks to the tax cuts, although toward the end of the first half of 2018 uncertainties emerged over the impact of the trade dispute between the United States and other economic blocs. In the first half of 2018, the Fed continued its program of interest rate rises, and key rates are now within the target range of 1.75–2.00%. The Fed is expected to hike rates by a further 50 basis points by the end of 2018.
Much like Europe, Canada and Japan saw a slight slowdown in momentum in the first half of 2018. Austra-lia and New Zealand continued to grow at broadly the same rate as the previous year. In Canada a further 25-basis-point rate rise is expected by the end of 2018, while rates in Japan and Australia should remain unchanged.
Credit Suisse economists expect the world economy to perform solidly this year, with global growth of 3.3%. The US should grow significantly faster than Europe in 2018, with projected real GDP growth of 2.8%. In the eurozone, Britain and Japan, 2018 is expected to see slightly lower growth than in 2017, i.e. 2.2%, 1.3% and 1.2% respectively. Canada, Australia and New Zealand are expected to post growth rates of 2.0%, 2.8% and 2.9% respectively. 2018 should see Chile›s economic growth rate more than double compared 2017, with estimates predicting 3.7% growth.
The robust economic activity in the countries in which the Fund invests is still leading to stable cyclical de-mand for office rental space. In many cities, such as Dublin, Vancouver and Berlin, the technology sector is driving demand for space. Providers of flexible office space such as WeWork and Spaces are also becoming more important. In London, tenants occupying flexible office space accounted for 10% of demand for space in 2017. In continental Europe the figure was around 6%.
Continuing low levels of construction activity in the first half of 2018 meant that a further decline in vacancy rates was observed in many cities. Rental price growth for office space continued to accelerate, and came to an estimated 2.5–3.0% p.a. overall in the first half 2018.
Investor demand for property remains strong, driven by low interest rates and positive rental market pros-pects. Net initial yields on top-class office real estate in prime locations were either stable – as in the United States, Canada, and the UK – or underwent a further decline, as in Japan, continental Europe and Australia.
The positive and robust yield differentials between real estate investments and government bonds continue to drive the transaction markets and investor demand for real estate. Global rental markets are still in excellent shape. 2018 should prove to be another year of robust rent price growth and falling vacancy rates for the office markets. Political risks in Europe – particularly the situation in Italy and the United States› trade dispute with its trading partners – are currently the biggest risks.
Investor base,
special features
International real
estate markets
in the first half of
2018

Credit Suisse Real Estate Fund International • Unaudited Semi-Annual Report as at June 30, 2018
23
To minimize currency fluctuation risks, the currencies in the statement of assets were mostly hedged by means of foreign exchange forward transactions. The net result is a currency loss of CHF 49.14 million (loss of CHF 30.70 million as of June 30, 2017), which corresponds to 1.57% of the net asset value as of June 30, 2018. The exchange rate fluctuations in the income statement are not hedged.
On behalf of the fund management company and in compliance with the Collective Investment Schemes Act (CISA), the Fund›s properties were individually valued by independent, FINMA-accredited valuation experts as at December 31, 2017 and, in addition, at June 30, 2018. The year-end valuation also involved recourse to external consultants abroad.
The estimates are prepared on the basis of the International Valuation Standards. The valuations themselves are carried out using the discounted cash flow (DCF) method. The resulting aggregate market value as at June 30, 2018 comes to CHF 3,491.49 million (3,312.89 mn as at December 31, 2017). The average weighted discount rate is 4.67% (4.74% as at December 31, 2017). Excluding currency factors, this means on balance that the real estate portfolio appreciated by around 1.77% from the December 31, 2017 position.
As of June 22, 2018, Credit Suisse Real Estate Fund International received an inflow of new money amount-ing to CHF 395.66 million (gross) in connection with an issue. The proceeds of the issue will be used to continue expanding the high-quality real estate portfolio.
In the first half of 2018, the Fund added two properties to its real estate portfolio in the UK and New Zealand. One property in Australia was sold.
A high-quality property in an excellent location in London was added to the Fund: the Monument Building, which was completed in 2016. This ten-story office building is located directly adjacent to the Monument in the heart of the British capital. In addition to high-quality class A office space which is fully let on a long-term basis, the building also offers a retail outlet on the ground floor. The Monument Building meets the highest environmental standards and has been rated as «excellent” in the BREEAM certification process. With its purchase of the HSBC Tower in the center of Wellington (NZ), the Fund has acquired a prestigious architectural landmark and one of the few highly specialized class A buildings in New Zealand›s capital. The 26-story building is located in the exclusive and much frequented Lambton Quay shopping area and is fully let to companies with high credit ratings. In a strategic move, an office property at 52 Goulburn Street in Sydney (AU) was successfully sold at a profit. Key arguments in favor of the sale included the sharp rise in rents in Australia›s largest city in recent years, the fact that real estate prices are approaching historic peaks, the diminishing length of the remaining term of the rental agreement with the sole tenant, and the property›s peripheral location within the city center.
The Exchange, an office tower with LEED Platinum certification situated in a prime location, was completed in Vancouver (CA). The addition of this new-build project to the portfolio of Credit Suisse Real Estate Fund International resulted in an increase in the percentage of rental income lost as of 30 June 2018. The property has since been fully let to high-quality tenants.
Foreign exchange
influences
Half-year valuation
Continuing port-
folio development

Credit Suisse Real Estate Fund International • Unaudited Semi-Annual Report as at June 30, 2018
24
Notes to the Unaudited Semi-Annual Report as at June 30, 2018
Units of this Real Estate Fund may not be offered, sold or delivered within the United States or any of its ter-ritories. Units of this Real Estate Fund may not be offered, sold or delivered to US citizens or persons resident or incorporated in the US and/or other natural or legal persons whose income and/or returns, regardless of origin, are subject to US income tax, as well as persons who are considered to be US persons pursuant to Regulation S of the U.S. Securities Act of 1933 and/or the U.S. Commodity Exchange Act, in each case as amended from time to time.
For detailed information on commissions, please see “Appendix” starting on page 8.
The Swiss Financial Markets Supervisory Authority (FINMA) issued an order on January 10, 2018, approving the amendments to the fund contract proposed by the fund management company and the custodian bank. These amendments entered into force on January 15, 2018. The publication in the Swiss Official Gazette of Commerce and Neue Zürcher Zeitung on December 28, 2017 reads as follows:
Notice to the investors of the Credit Suisse Real Estate Fund Internationalan investment fund under Swiss law of the “Real estate funds” category for qualified investors
Change to the Sales Prospectus with integrated Fund ContractCredit Suisse Funds AG, Zurich, as fund management company, with the approval of Credit Suisse (Schweiz) AG, Zurich, as custodian bank, intends, subject to the approval of the Swiss Financial Market Supervisory Authority FINMA, to make the following formal amendment:
Amendment of Art. 19 prov. 1. b):
Previous wording New wording
In respect of its activities relating to the purchase and sale of land and prop-erty, the fund management company shall charge the Real Estate Fund a fee not exceeding 3.00% of the purchase/sale price, unless the asset manager entrusts a third party with the transaction. Purchase and sales commission in relation to external brokers shall be charged separately;
In respect of its activities relating to the purchase and sale of land and prop-erty as an “asset deal” (direct purchase and sale of land and property) and/or as a “share deal” (purchase and sale of investments in real estate compa-nies which hold the land and property), the fund management company shall charge the Real Estate Fund a fee not exceeding 3.0% of the purchase/sale price, unless a third party was entrusted with the transaction. Purchase and sales commission in relation to external brokers shall be charged separately;
The change to the wording, the sales prospectus with integrated fund contract, the simplified prospectus, and last year›s annual and semi-annual reports may be obtained free of charge from the fund manager or the custodian bank. In accordance with Art. 41 para. 1 and para. 2bis in conjunction with Art. 35a para. 1 of the Collective Investment Schemes Ordinance (CISO), investors are being informed that the verification and ascertainment of the legal compliance of the changes to the fund contract are being extended by FINMA to include the provisions pursuant to Art. 35a para. 1 lit. a–g CISO.
Zurich, December 28, 2017
Fund management company: Credit Suisse Funds AG, ZurichCustodian bank: Credit Suisse (Switzerland) Ltd., Zurich
Note 1:
Sales Restrictions
USA
Note 2:
Commissions
Note 3: Amend-
ments to the fund
contract as of
January 15, 2018

Credit Suisse Real Estate Fund International • Unaudited Semi-Annual Report as at June 30, 2018
25
Valuation Report
The Collective Investment Schemes Act (CISA) requires the value of the properties held by Swiss real estate funds to be estimated by independent valuation experts at the end of each financial year. In addition, the properties of Credit Suisse Real Estate Fund International are valued in the semi-annual statement of the financial year.
The valuation experts were tasked by the fund management company of Credit Suisse Real Estate Fund International with conducting the valuation in consultation with support staff abroad. The brief included co-ordination of the overall valuation process, including data preparation, provision of valuation software plus compilation and monitoring of the results supplied by the individual agents abroad.
The valuation experts mandated by the fund management company and accredited by the Swiss Financial Market Supervisory Authority (FINMA) are responsible for the actual valuation of the properties. Credit Suisse Funds AG is responsible for procuring the necessary documentation.
All properties held by Credit Suisse Real Estate Fund International were valued for accounting purposes as at June 30 of the 2018 financial year.
As at the closing date, the portfolio comprised 44 properties (including new additions and properties valued for the first time). One property was under construction. Since December 31, 2017, two purchases have been made and one property has been sold.
The documentation relevant to the valuations was prepared by the fund management company and manage-ment companies responsible. The valuations are based firstly on an evaluation and analysis of these docu-ments, a cycle of site visits, as well as an assessment of the general and specific market situation for each property. The FINMA-accredited valuation experts performed the entire mandate in consultation with the fund management company – from definition of the valuation parameters and entering the data in the valuation software, through the actual appraisal work, to monitoring and submission of the results – on a neutral basis and solely in accordance with the independent valuation brief.
The valuation experts confirm that the valuations were performed in accordance with the statutory require-ments of the Collective Investment Schemes Act (CISA) and Collective Schemes Ordinance (CISO), as well as with the Guidelines of the Swiss Funds & Asset Management Association (SFAMA), and furthermore accord with customary industry valuation standards. Market value is reported on the basis of the “fair market value”, i.e. the sale price that can probably be realized under normal circumstances and current market condi-tions. Property under construction is also stated at the fair market value.
In evaluating real estate, the valuation experts adhere to the internationally recognized International Valuation Standards (IVSC).
The valuations were carried out uniformly using the discounted cash flow (DCF) method. This excludes any undeveloped land, which would be valued using the comparison and residual value method. With the DCF method, the market value of a property is determined as the total of all projected future net earnings dis-counted to valuation-date equivalents. Income is discounted separately for each property with adjustment for market conditions and risks, i.e. with allowance for specific opportunities and risks.
The valuation includes a detailed analysis and assessment of the individual income and cost items. The valua-tion experts based their assessment on recent year’s individual accounts for each property, the current rental situation, as well as extensive market intelligence. This is used as the basis for the estimation and modeling of future cash flows and for definition of the discount rate. Valuations are prepared on the basis of a continu-ation of current use, i.e. any far-reaching changes of use, additions of new floors, or increases in density are not incorporated into the valuation.
Commission
Valuation
Standards
Valuation Method

Credit Suisse Real Estate Fund International • Unaudited Semi-Annual Report as at June 30, 2018
26
As at June 30, 2018, the market value of the total portfolio is estimated by the experts at CHF 3 491.49 million (conversion from local currency into Swiss francs as at closing rate on June 30, 2018).
Compared to December 31, 2017 (CHF 3 312.89 million), the value of the total portfolio has increased by CHF 178.60 million or 5.39% (including exchange rate movements).
Planned refurbishment work for the next ten years was reviewed. The scheduling and scale of investment for the individual properties were consequently reassessed and adjusted where necessary.
The discount rates used in the valuations are based on constant observation of real estate markets, par-ticularly the yields paid in arm’s-length transactions. The average discount rate as at June 30, 2018, was 4.67%.
The accredited valuation experts confirm their independence and guarantee the confidential treatment of information connected with the valuation mandate.
Zurich, June 30, 2018Wüest Partner AG
Pascal Marazzi-de Lima Gino Fiorentin
Result
Independence and
Confidentiality


Credit Suisse Funds AGUetlibergstrasse 231 / SYSU 13CH-8045 Zurich
Phone 044 332 58 08Fax 044 337 20 82
www.credit-suisse.com/realestatefunds 0755
05E
08.1
8 P
ublis
hed
in G
erm
an, F
renc
h an
d En
glis
h