Embed Size (px)
Citation preview
Unaudited results
for the half year ended 30 November 2014
Highlights for the half year ended 30 November 2014
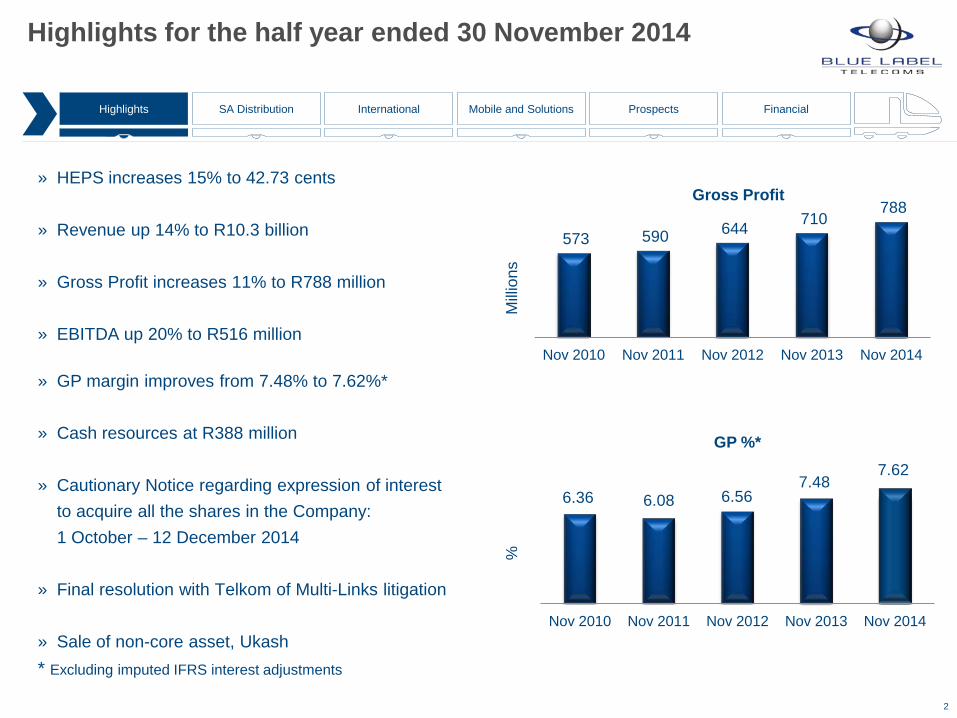
» HEPS increases 15% to 42.73 cents » Revenue up 14% to R10.3 billion
» Gross Profit increases 11% to R788 million
» EBITDA up 20% to R516 million
» GP margin improves from 7.48% to 7.62%* » Cash resources at R388 million
» Cautionary Notice regarding expression of interest to acquire all the shares in the Company: 1 October – 12 December 2014
» Final resolution with Telkom of Multi-Links litigation » Sale of non-core asset, Ukash * Excluding imputed IFRS interest adjustments
2
SA Distribution International Mobile and Solutions Prospects Financial Highlights
Nov 2014 Nov 2013 Nov 2012 Nov 2011 Nov 2010
GP %*
6.36 6.08 6.56 7.48
7.62
%
788 710 644 590 573
Nov 2014 Nov 2013 Nov 2012 Nov 2011 Nov 2010
Gross Profit
Milli
ons
South African Distribution Brett Levy – Joint CEO
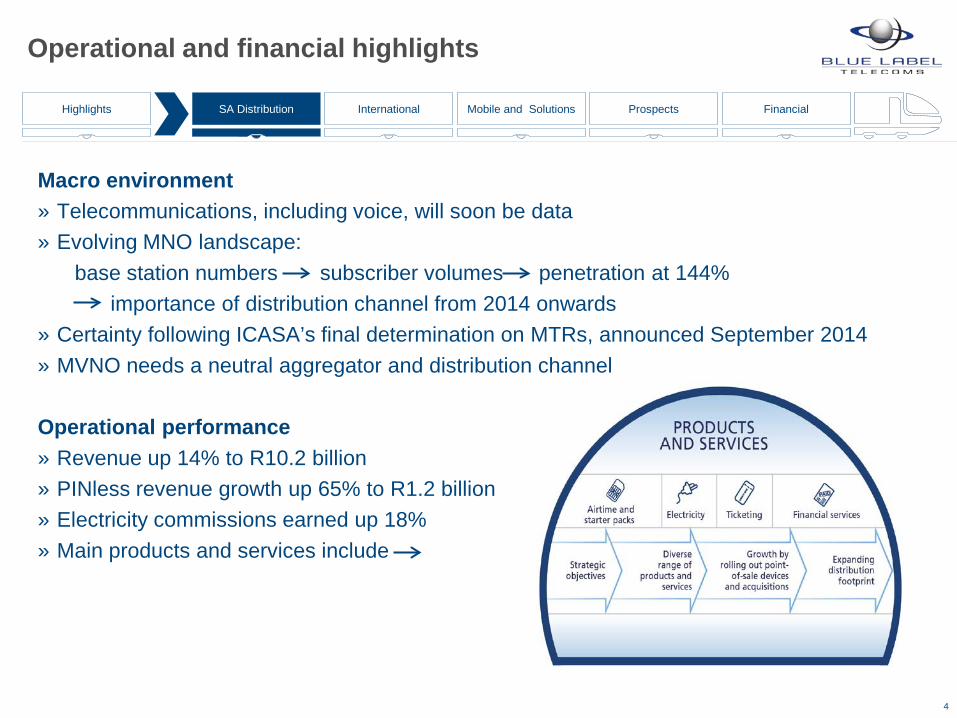
Operational and financial highlights
Macro environment » Telecommunications, including voice, will soon be data » Evolving MNO landscape:
base station numbers subscriber volumes penetration at 144% importance of distribution channel from 2014 onwards
» Certainty following ICASA’s final determination on MTRs, announced September 2014 » MVNO needs a neutral aggregator and distribution channel
Operational performance » Revenue up 14% to R10.2 billion » PINless revenue growth up 65% to R1.2 billion » Electricity commissions earned up 18% » Main products and services include
SA Distribution International Mobile and Solutions Prospects Financial Highlights
4
Prepaid airtime and starter-packs
5
SA Distribution International Mobile and Solutions Prospects Financial Highlights
-
500
1 000
1 500
2 000
2 500
Mill
ions
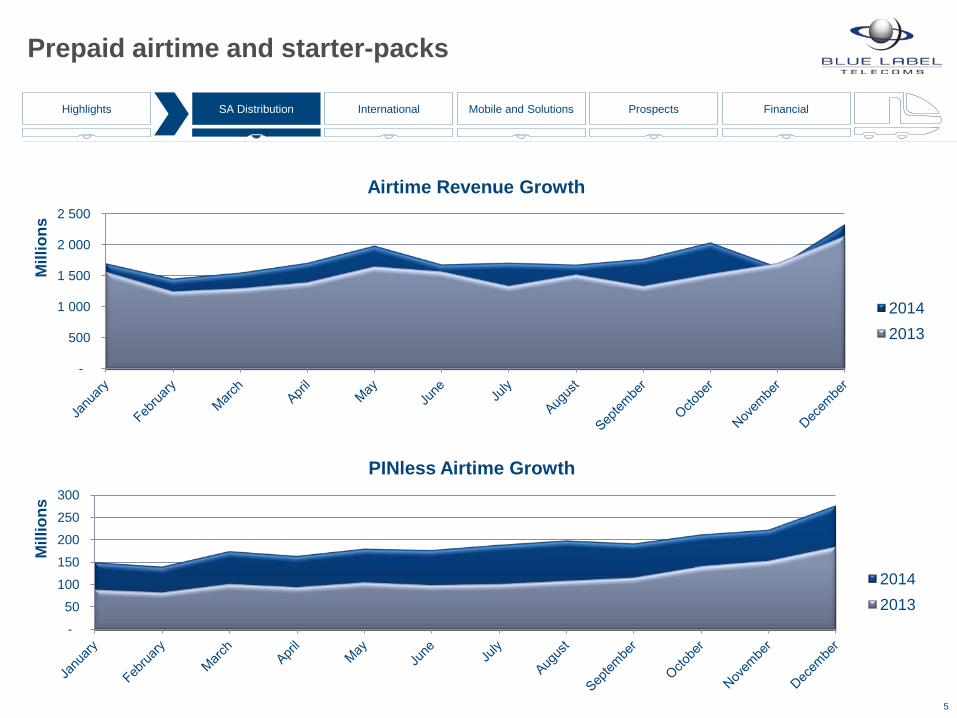
Airtime Revenue Growth
2014 2013
-
50
100
150
200
250
300
Mill
ions
PINless Airtime Growth
2014 2013
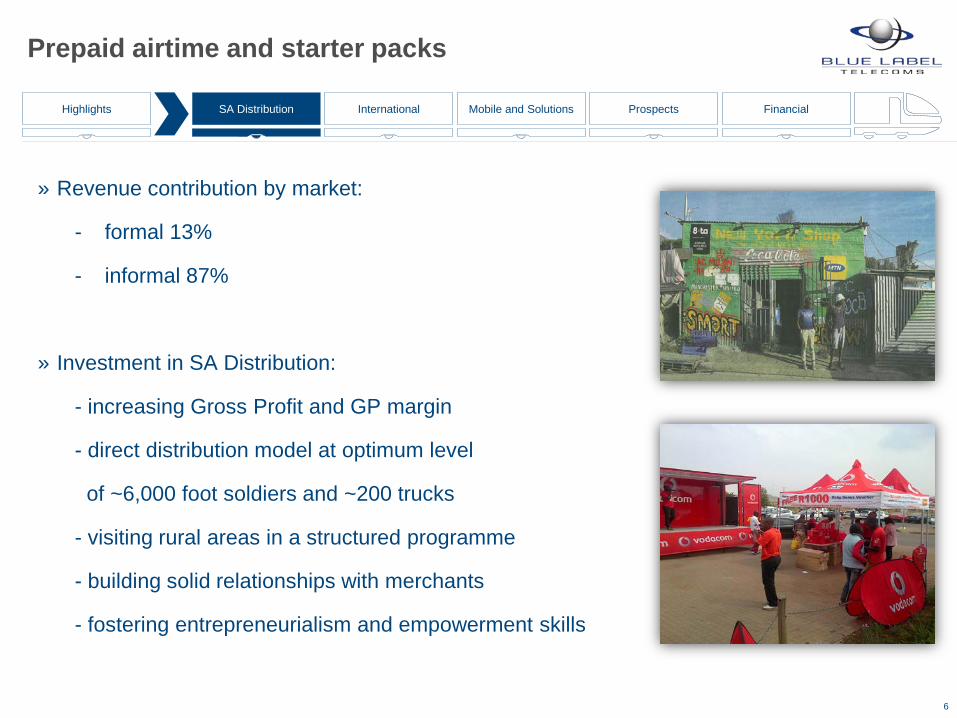
Prepaid airtime and starter packs
» Revenue contribution by market:
- formal 13%
- informal 87%
» Investment in SA Distribution:
- increasing Gross Profit and GP margin
- direct distribution model at optimum level
of ~6,000 foot soldiers and ~200 trucks
- visiting rural areas in a structured programme
- building solid relationships with merchants
- fostering entrepreneurialism and empowerment skills
6
SA Distribution International Mobile and Solutions Prospects Financial Highlights
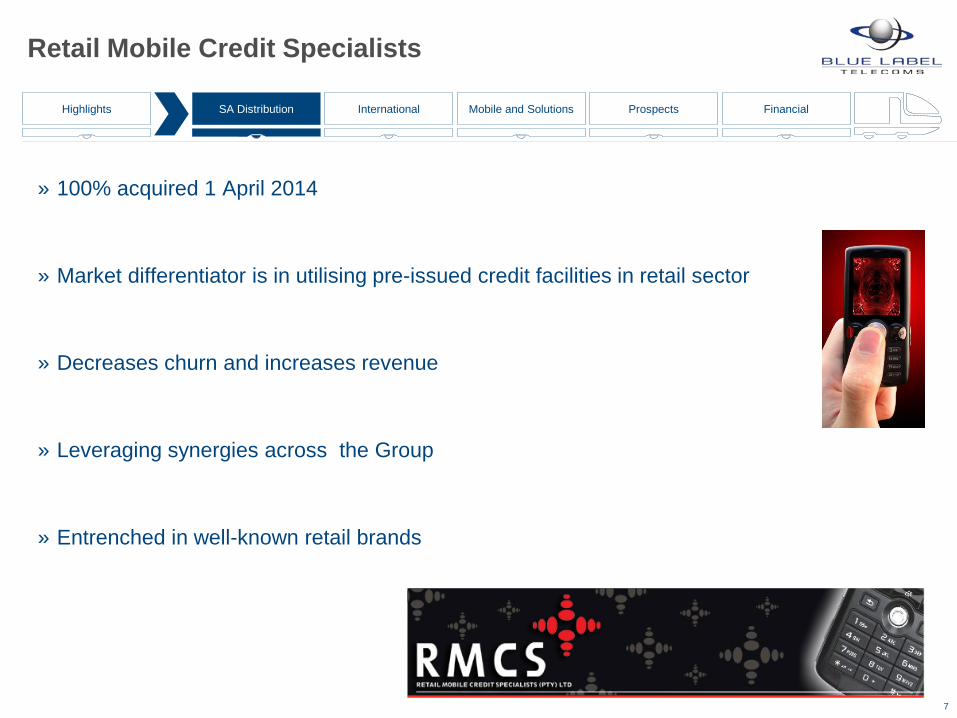
Retail Mobile Credit Specialists
» 100% acquired 1 April 2014
» Market differentiator is in utilising pre-issued credit facilities in retail sector
» Decreases churn and increases revenue
» Leveraging synergies across the Group
» Entrenched in well-known retail brands
7
SA Distribution International Mobile and Solutions Prospects Financial Highlights
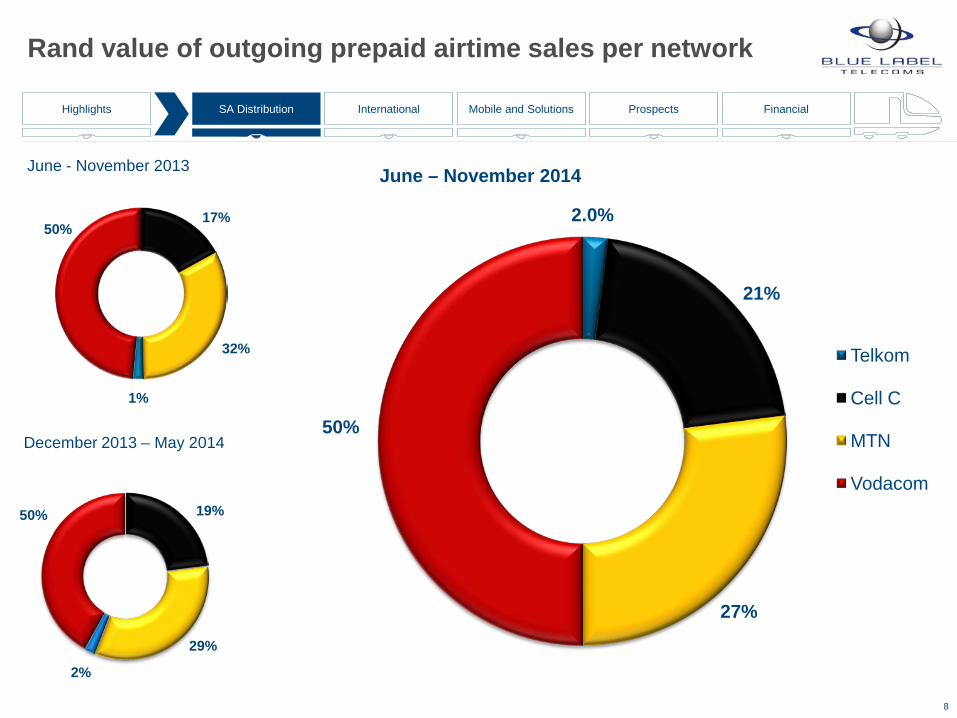
Rand value of outgoing prepaid airtime sales per network
8
SA Distribution International Mobile and Solutions Prospects Financial Highlights
June - November 2013
December 2013 – May 2014
June – November 2014
Telkom
Cell C
MTN
Vodacom 50%
50% 17%
32%
1%
29%
19%
2%
27%
21%
2.0%
50%
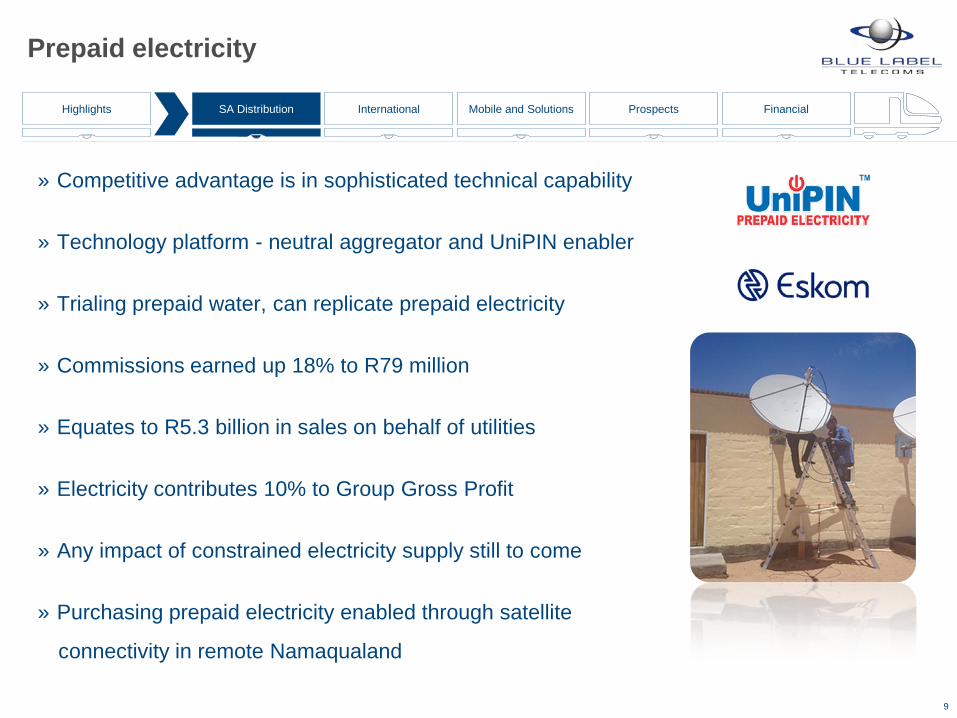
Prepaid electricity
» Competitive advantage is in sophisticated technical capability » Technology platform - neutral aggregator and UniPIN enabler
» Trialing prepaid water, can replicate prepaid electricity
» Commissions earned up 18% to R79 million
» Equates to R5.3 billion in sales on behalf of utilities
» Electricity contributes 10% to Group Gross Profit » Any impact of constrained electricity supply still to come
» Purchasing prepaid electricity enabled through satellite
connectivity in remote Namaqualand
9
SA Distribution International Mobile and Solutions Prospects Financial Highlights
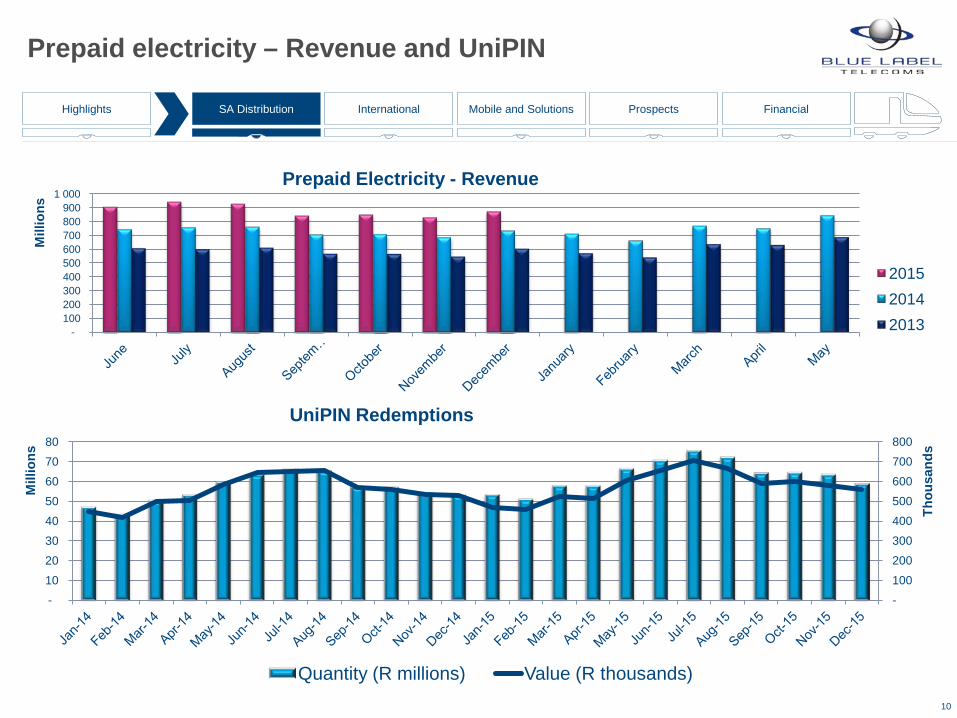
Prepaid electricity – Revenue and UniPIN
10
SA Distribution International Mobile and Solutions Prospects Financial Highlights
- 100 200 300 400 500 600 700 800
- 10 20 30 40 50 60 70 80
Thou
sand
s
Mill
ions
UniPIN Redemptions
Quantity (R millions) Value (R thousands)
- 100 200 300 400 500 600 700 800 900
1 000
Mill
ions
Prepaid Electricity - Revenue
2015 2014 2013
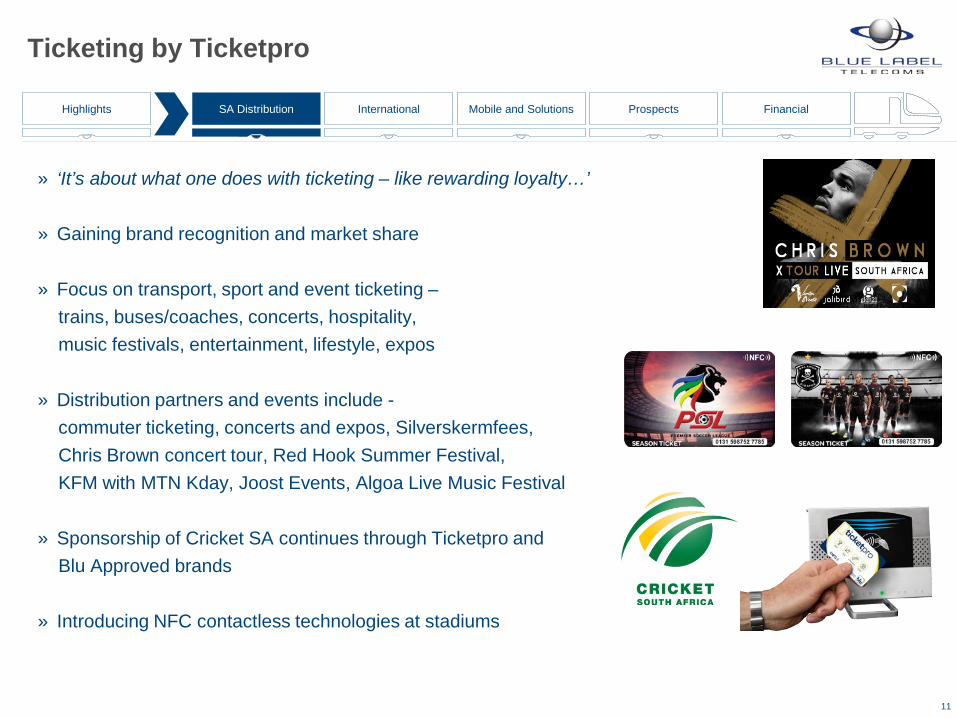
Ticketing by Ticketpro
» ‘It’s about what one does with ticketing – like rewarding loyalty…’
» Gaining brand recognition and market share
» Focus on transport, sport and event ticketing – trains, buses/coaches, concerts, hospitality, music festivals, entertainment, lifestyle, expos
» Distribution partners and events include - commuter ticketing, concerts and expos, Silverskermfees, Chris Brown concert tour, Red Hook Summer Festival, KFM with MTN Kday, Joost Events, Algoa Live Music Festival
» Sponsorship of Cricket SA continues through Ticketpro and Blu Approved brands
» Introducing NFC contactless technologies at stadiums
11
SA Distribution International Mobile and Solutions Prospects Financial Highlights
Financial and other Value Adding Services
» Convenience and financial inclusion for un - & under - banked and
rural communities
» Developments in mobile commerce driving interest in mobile payment services
» Our mobile wallet offered by MNOs and major banks
» Bill payments, merchant acquiring, money transfers, mobile wallets, m-pesa
12
SA Distribution International Mobile and Solutions Prospects Financial Highlights
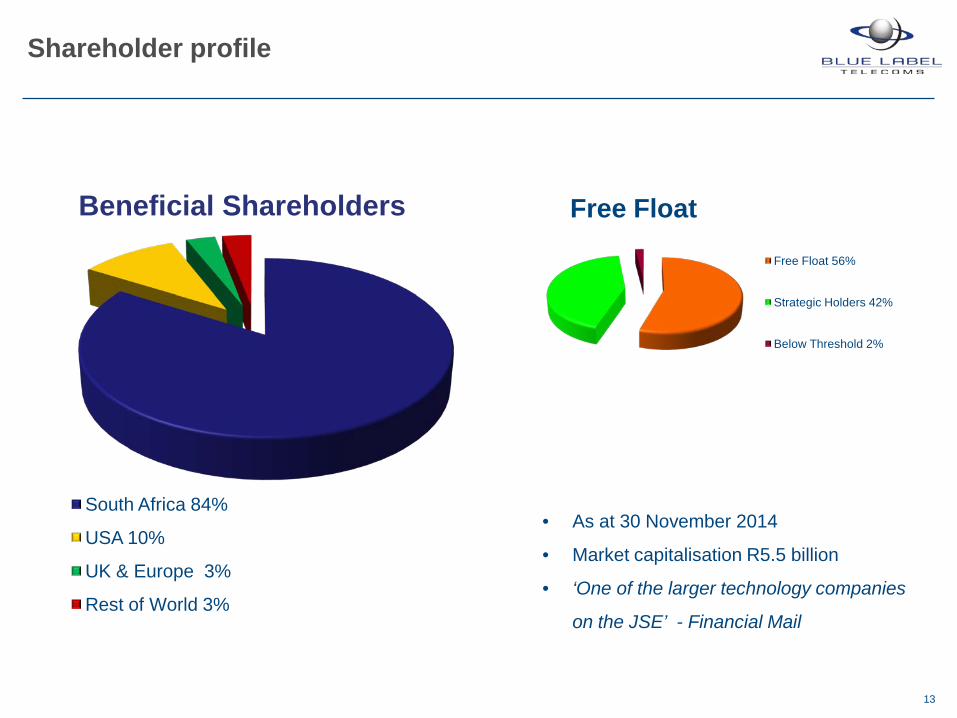
Shareholder profile
13
South Africa 84%
USA 10%
UK & Europe 3%
Rest of World 3%
Beneficial Shareholders Free Float
Free Float 56%
Strategic Holders 42%
Below Threshold 2%
• As at 30 November 2014
• Market capitalisation R5.5 billion
• ‘One of the larger technology companies
on the JSE’ - Financial Mail
International Distribution, Mobile and Solutions Segments
and Prospects Mark Levy – Joint CEO
Highlights
» Joint final resolution with Telkom of Multi-Links litigation
» Sale of stake in non-core asset, Ukash
» International strategy applied in India and Mexico
replicates South African business model
15
SA Distribution International Mobile and Solutions Prospects Financial Highlights
Oxigen Services India
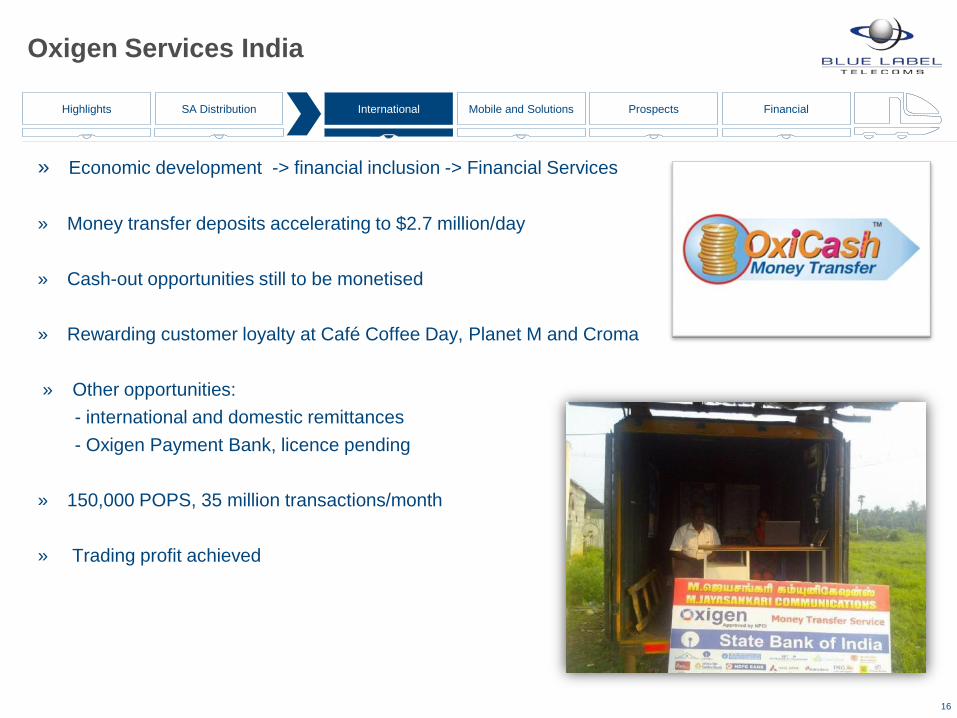
» Economic development -> financial inclusion -> Financial Services » Money transfer deposits accelerating to $2.7 million/day » Cash-out opportunities still to be monetised » Rewarding customer loyalty at Café Coffee Day, Planet M and Croma » Other opportunities:
- international and domestic remittances - Oxigen Payment Bank, licence pending
» 150,000 POPS, 35 million transactions/month » Trading profit achieved
16
SA Distribution International Mobile and Solutions Prospects Financial Highlights
Oxigen Services India – achievements and accolades
Indian Digital (IAMAI) Awards in December 2014: » Gold - Best Money Transfer Program – only winner in this category » Silver - Best Performance in Campaign Execution – first runner up » Bronze - Best Integrated Digital Campaign - second runner up National Payments Corporation of India (NPCI) Excellence Awards in December 2014: » Best Prepaid Issuer Many others ‘Firsts’ » First non-bank to connect directly with NPCI for instant money transfers to over 60 banks in June 2013 » First Prepaid Instrument to carry out Prepaid Mobile Wallet loading using NPCI among all banks and non-
banks in June 2013 » First to demonstrate Aadhaar based eKYC in 2013 » First non-bank to deploy cash out using Aadhaar enabled Point of Sale terminal with its Mobile wallet for
Reserve Bank of India (RBI) awarded pilot in May 2014 » First to deploy commercially eKYC for its Oxigen Wallet in retail locations in July 2014 » First to cross one million transactions in a month with NPCI on instant money transfer service, and first
among all banks and non-banks in August 2014 » First to launch instant money transfer service on Point of Sale terminal that are GPRS enabled in retail in
July 2014 » First to launch IMPS Merchant Payment in India in December 2014.
17
SA Distribution International Mobile and Solutions Prospects Financial Highlights
Blue Label Mexico
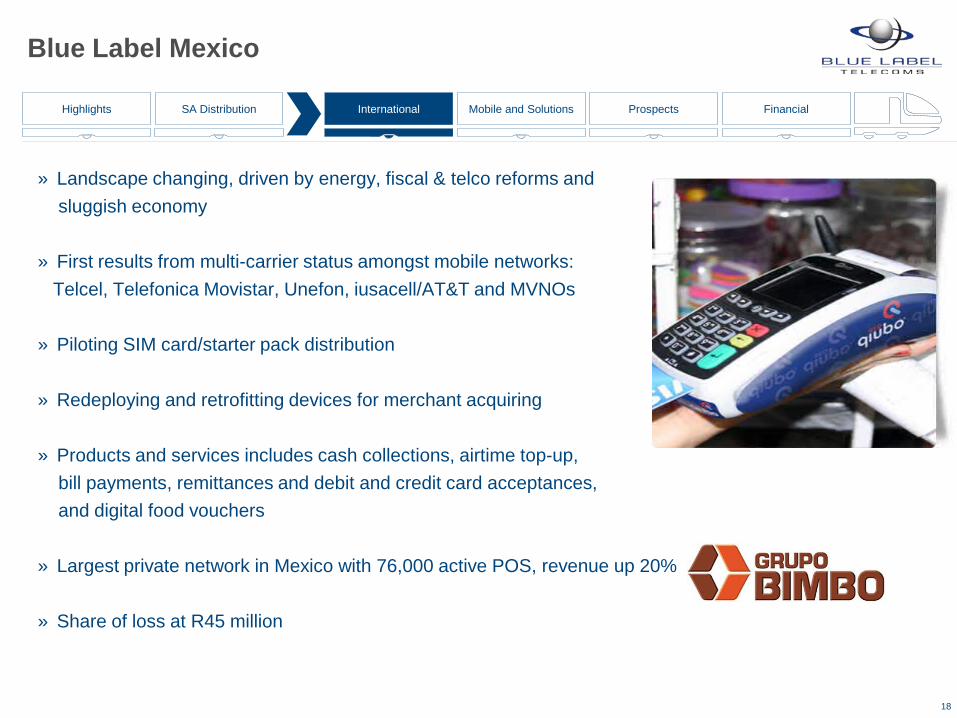
» Landscape changing, driven by energy, fiscal & telco reforms and sluggish economy » First results from multi-carrier status amongst mobile networks: Telcel, Telefonica Movistar, Unefon, iusacell/AT&T and MVNOs » Piloting SIM card/starter pack distribution » Redeploying and retrofitting devices for merchant acquiring » Products and services includes cash collections, airtime top-up, bill payments, remittances and debit and credit card acceptances, and digital food vouchers
» Largest private network in Mexico with 76,000 active POS, revenue up 20%
» Share of loss at R45 million
18
SA Distribution International Mobile and Solutions Prospects Financial Highlights
Mobile Segment
» Cellfind – SMS and Location Based Services
- Simigenix acquisition enhances MNO inter-connectivity, and
- enables VAS offerings in SMS market
- bulk SMS market challenging
» Viamedia – content (data), mobile entertainment, information
and value adding services
- 75% acquired 1 September 2014
- integration complete
- products include ring tones, wallpapers, dial-a-prayer, Lotto results
- leveraging synergies across the Group
» Core net profit at R12 million
19
SA Distribution International Mobile and Solutions Prospects Financial Highlights
Solutions Segment
» Velociti – call centres
- progressing to sustainable profitability
- difficult business environment
» Blue Label Data Solutions – data, ‘big data’ and analytical services
- accessing deep databases of >56 million consumers
- lead generation, lead aggregator, credit bureaux, geospacial analytics
- ‘your partner in direct marketing’
» Core net profit at R7.8 million
20
SA Distribution International Mobile and Solutions Prospects Financial Highlights
Prospects
» Oxigen India poised for growth in international and domestic remittance markets
» Ticketpro service offerings in South Africa set to expand
» Debit and credit card acquiring to gain momentum in South Africa, following alliances with
numerous financial institutions
» Strong market reputation and position in prepaid electricity driving entry into prepaid water
meter arena
» Multi-carrier capability across networks and MVNOs in Mexico should impact positively.
21
SA Distribution International Mobile and Solutions Prospects Financial Highlights
Financial Overview Dean Suntup – Financial Director
23
SA Distribution International Mobile and Solutions Prospects Financial Highlights
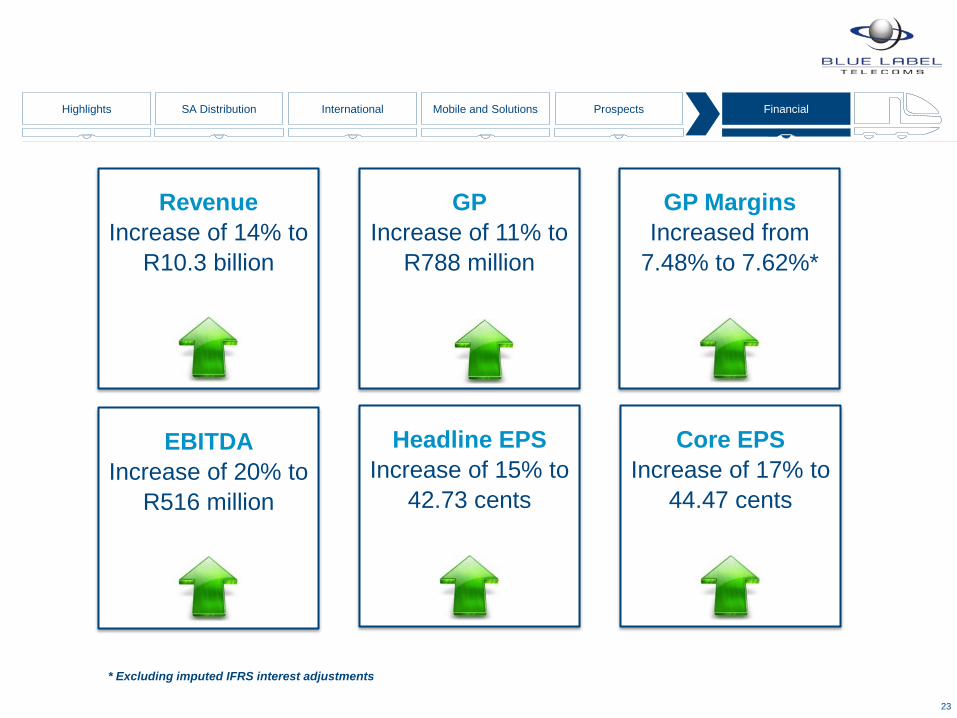
EBITDA Increase of 20% to
R516 million
Core EPS Increase of 17% to
44.47 cents
GP Increase of 11% to
R788 million
Revenue Increase of 14% to
R10.3 billion
GP Margins Increased from
7.48% to 7.62%*
Headline EPS Increase of 15% to
42.73 cents
* Excluding imputed IFRS interest adjustments
Income Statement
24
SA Distribution International Mobile and Solutions Prospects Financial Highlights
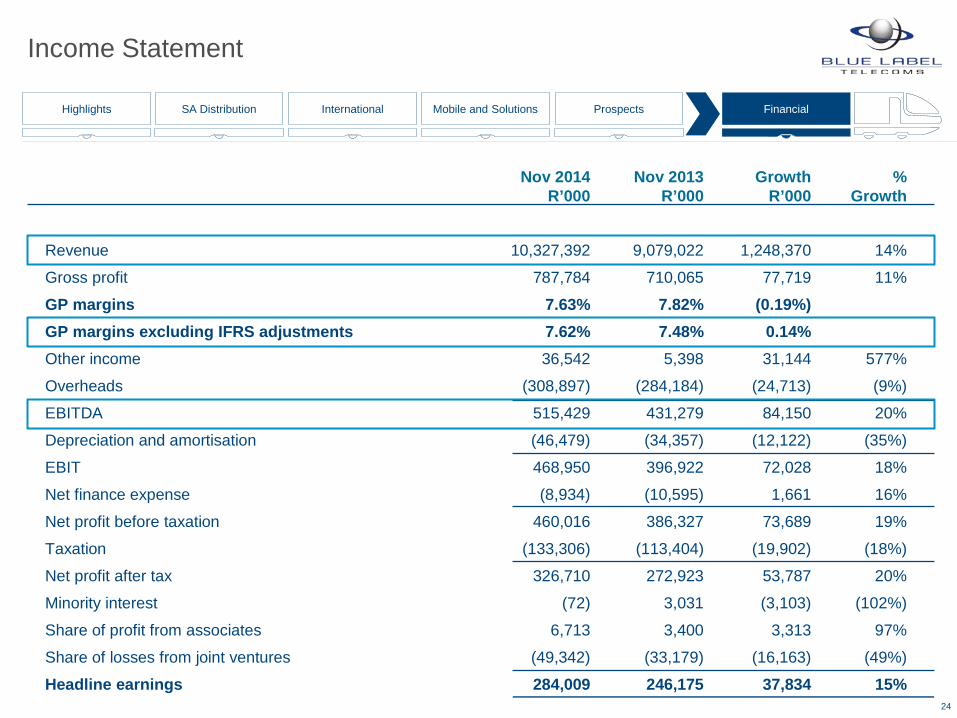
Nov 2014 Nov 2013 Growth % R’000 R’000 R’000 Growth
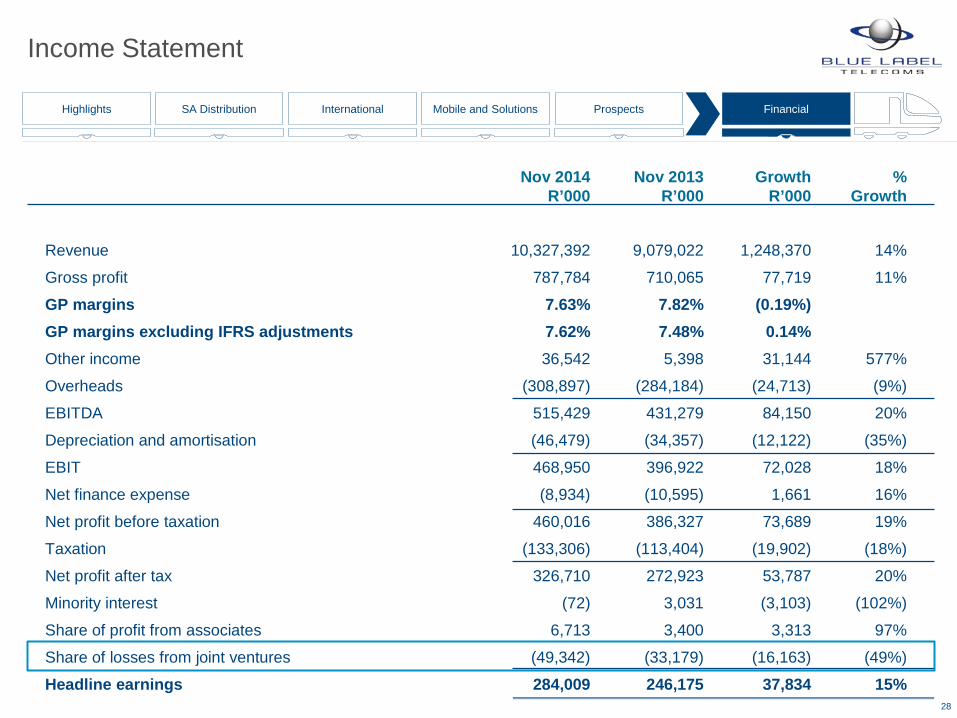
Revenue 10,327,392 9,079,022 1,248,370 14%
Gross profit 787,784 710,065 77,719 11%
GP margins 7.63% 7.82% (0.19%) GP margins excluding IFRS adjustments 7.62% 7.48% 0.14% Other income 36,542 5,398 31,144 577%
Overheads (308,897) (284,184) (24,713) (9%)
EBITDA 515,429 431,279 84,150 20%
Depreciation and amortisation (46,479) (34,357) (12,122) (35%)
EBIT 468,950 396,922 72,028 18%
Net finance expense (8,934) (10,595) 1,661 16%
Net profit before taxation 460,016 386,327 73,689 19%
Taxation (133,306) (113,404) (19,902) (18%)
Net profit after tax 326,710 272,923 53,787 20%
Minority interest (72) 3,031 (3,103) (102%)
Share of profit from associates 6,713 3,400 3,313 97%
Share of losses from joint ventures (49,342) (33,179) (16,163) (49%)
Headline earnings 284,009 246,175 37,834 15%
South African Distribution
25
SA Distribution International Mobile and Solutions Prospects Financial Highlights
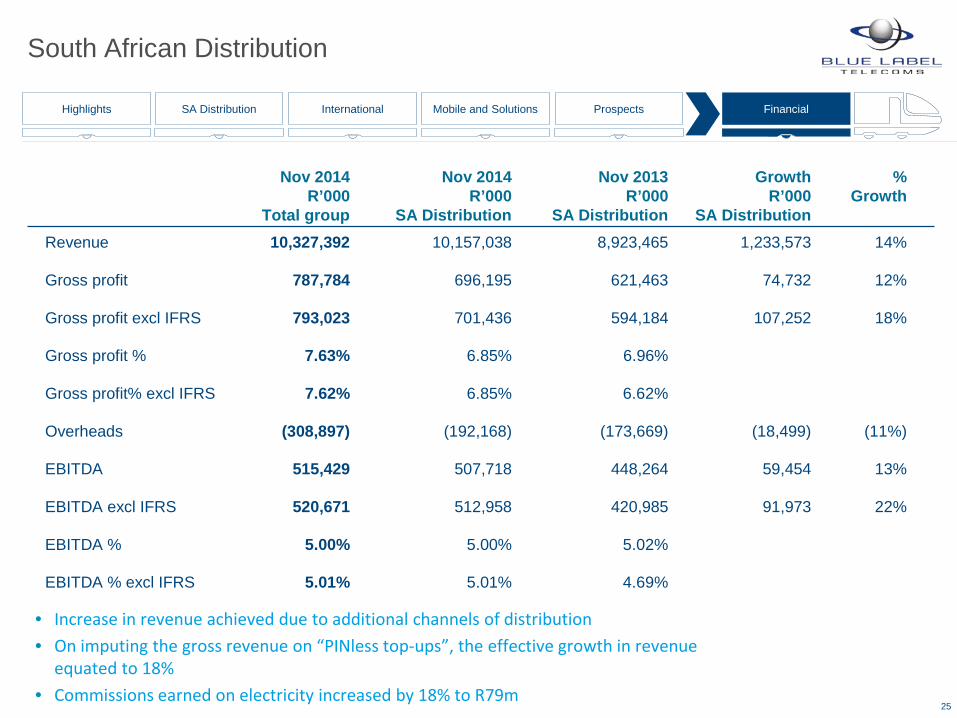
Nov 2014 Nov 2014 Nov 2013 Growth % R’000 R’000 R’000 R’000 Growth Total group SA Distribution SA Distribution SA Distribution
Revenue 10,327,392 10,157,038 8,923,465 1,233,573 14%
Gross profit 787,784 696,195 621,463 74,732 12%
Gross profit excl IFRS 793,023 701,436 594,184 107,252 18%
Gross profit % 7.63% 6.85% 6.96%
Gross profit% excl IFRS 7.62% 6.85% 6.62%
Overheads (308,897) (192,168) (173,669) (18,499) (11%)
EBITDA 515,429 507,718 448,264 59,454 13%
EBITDA excl IFRS 520,671 512,958 420,985 91,973 22%
EBITDA % 5.00% 5.00% 5.02%
EBITDA % excl IFRS 5.01% 5.01% 4.69%
• Increase in revenue achieved due to additional channels of distribution • On imputing the gross revenue on “PINless top-ups”, the effective growth in revenue
equated to 18% • Commissions earned on electricity increased by 18% to R79m
Income Statement
26
SA Distribution International Mobile and Solutions Prospects Financial Highlights
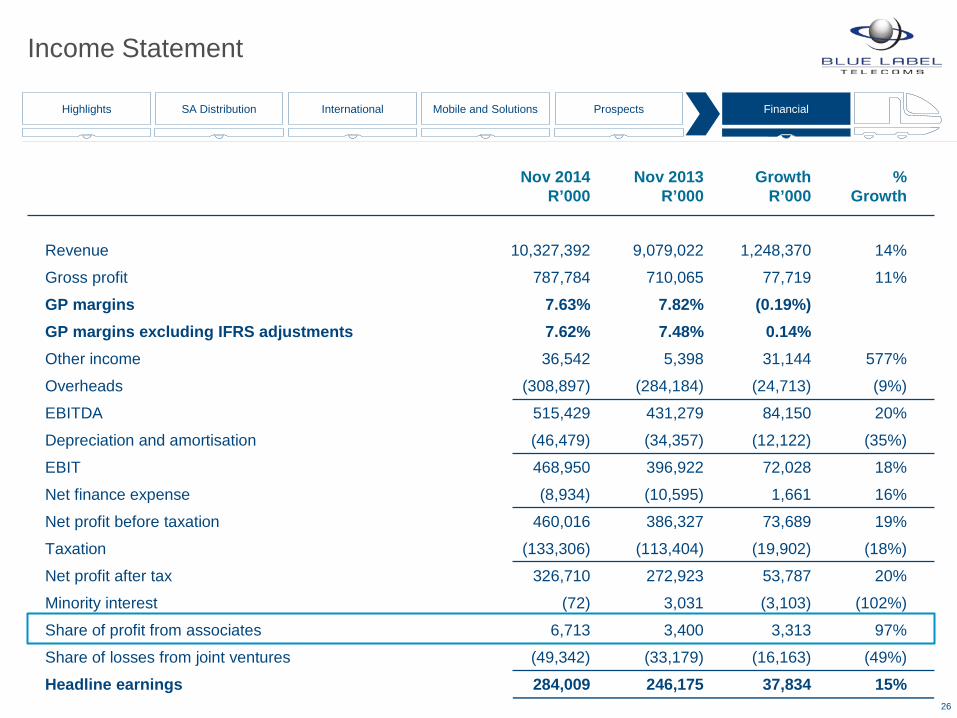
Nov 2014 Nov 2013 Growth % R’000 R’000 R’000 Growth
Revenue 10,327,392 9,079,022 1,248,370 14%
Gross profit 787,784 710,065 77,719 11%
GP margins 7.63% 7.82% (0.19%) GP margins excluding IFRS adjustments 7.62% 7.48% 0.14% Other income 36,542 5,398 31,144 577%
Overheads (308,897) (284,184) (24,713) (9%)
EBITDA 515,429 431,279 84,150 20%
Depreciation and amortisation (46,479) (34,357) (12,122) (35%)
EBIT 468,950 396,922 72,028 18%
Net finance expense (8,934) (10,595) 1,661 16%
Net profit before taxation 460,016 386,327 73,689 19%
Taxation (133,306) (113,404) (19,902) (18%)
Net profit after tax 326,710 272,923 53,787 20%
Minority interest (72) 3,031 (3,103) (102%)
Share of profit from associates 6,713 3,400 3,313 97%
Share of losses from joint ventures (49,342) (33,179) (16,163) (49%)
Headline earnings 284,009 246,175 37,834 15%
Associates
27
SA Distribution International Mobile and Solutions Prospects Financial Highlights
Nov 2014 Nov 2013 Growth % R’000 R’000 R’000 Growth
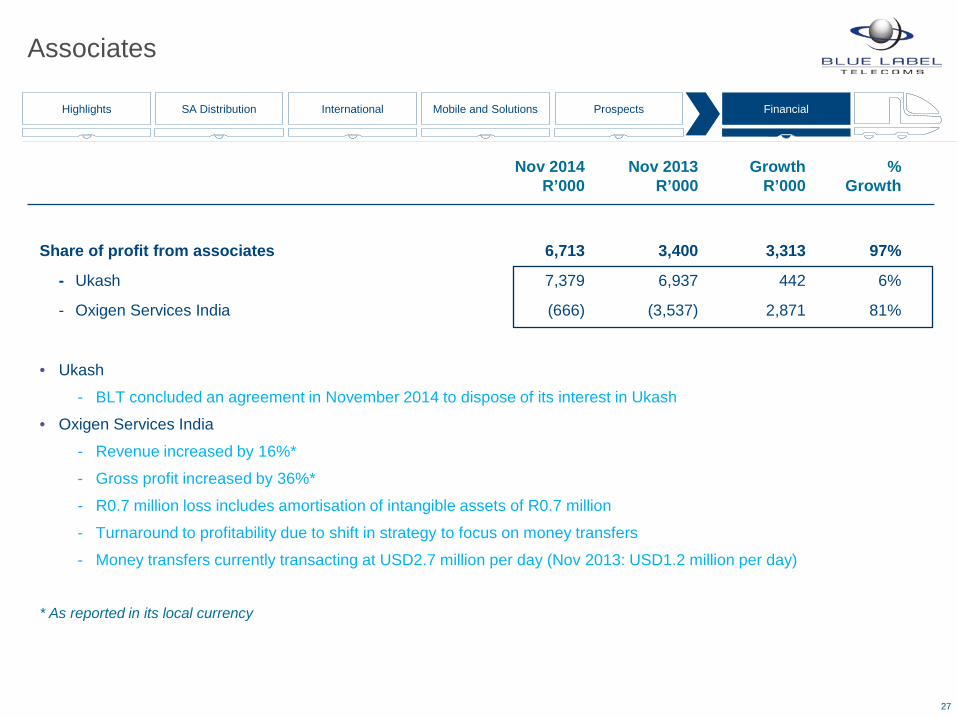
Share of profit from associates 6,713 3,400 3,313 97%
- Ukash 7,379 6,937 442 6%
- Oxigen Services India (666) (3,537) 2,871 81%
• Ukash
- BLT concluded an agreement in November 2014 to dispose of its interest in Ukash
• Oxigen Services India
- Revenue increased by 16%*
- Gross profit increased by 36%*
- R0.7 million loss includes amortisation of intangible assets of R0.7 million
- Turnaround to profitability due to shift in strategy to focus on money transfers
- Money transfers currently transacting at USD2.7 million per day (Nov 2013: USD1.2 million per day)
* As reported in its local currency
Income Statement
28
SA Distribution International Mobile and Solutions Prospects Financial Highlights
Nov 2014 Nov 2013 Growth % R’000 R’000 R’000 Growth
Revenue 10,327,392 9,079,022 1,248,370 14%
Gross profit 787,784 710,065 77,719 11%
GP margins 7.63% 7.82% (0.19%) GP margins excluding IFRS adjustments 7.62% 7.48% 0.14% Other income 36,542 5,398 31,144 577%
Overheads (308,897) (284,184) (24,713) (9%)
EBITDA 515,429 431,279 84,150 20%
Depreciation and amortisation (46,479) (34,357) (12,122) (35%)
EBIT 468,950 396,922 72,028 18%
Net finance expense (8,934) (10,595) 1,661 16%
Net profit before taxation 460,016 386,327 73,689 19%
Taxation (133,306) (113,404) (19,902) (18%)
Net profit after tax 326,710 272,923 53,787 20%
Minority interest (72) 3,031 (3,103) (102%)
Share of profit from associates 6,713 3,400 3,313 97%
Share of losses from joint ventures (49,342) (33,179) (16,163) (49%)
Headline earnings 284,009 246,175 37,834 15%
Joint Ventures
29
SA Distribution International Mobile and Solutions Prospects Financial Highlights
Nov 2014 Nov 2013 Growth R’000 R’000 R’000
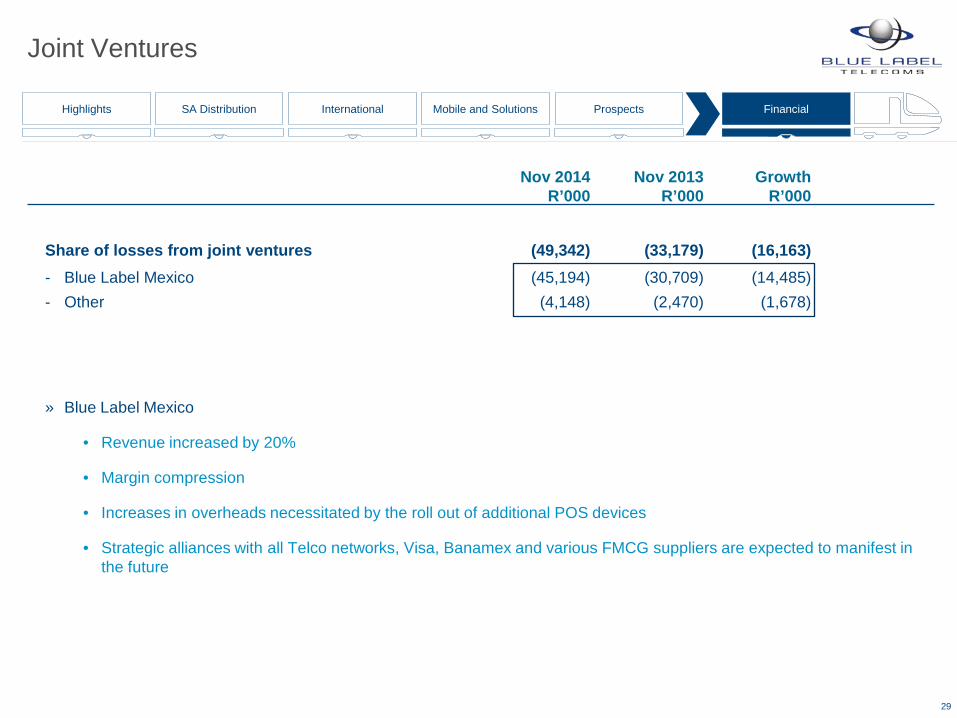
Share of losses from joint ventures (49,342) (33,179) (16,163) - Blue Label Mexico (45,194) (30,709) (14,485) - Other (4,148) (2,470) (1,678)
» Blue Label Mexico
• Revenue increased by 20%
• Margin compression
• Increases in overheads necessitated by the roll out of additional POS devices
• Strategic alliances with all Telco networks, Visa, Banamex and various FMCG suppliers are expected to manifest in the future
Income Statement
30
SA Distribution International Mobile and Solutions Prospects Financial Highlights
Nov 2014 Nov 2013 Growth % R’000 R’000 R’000 Growth
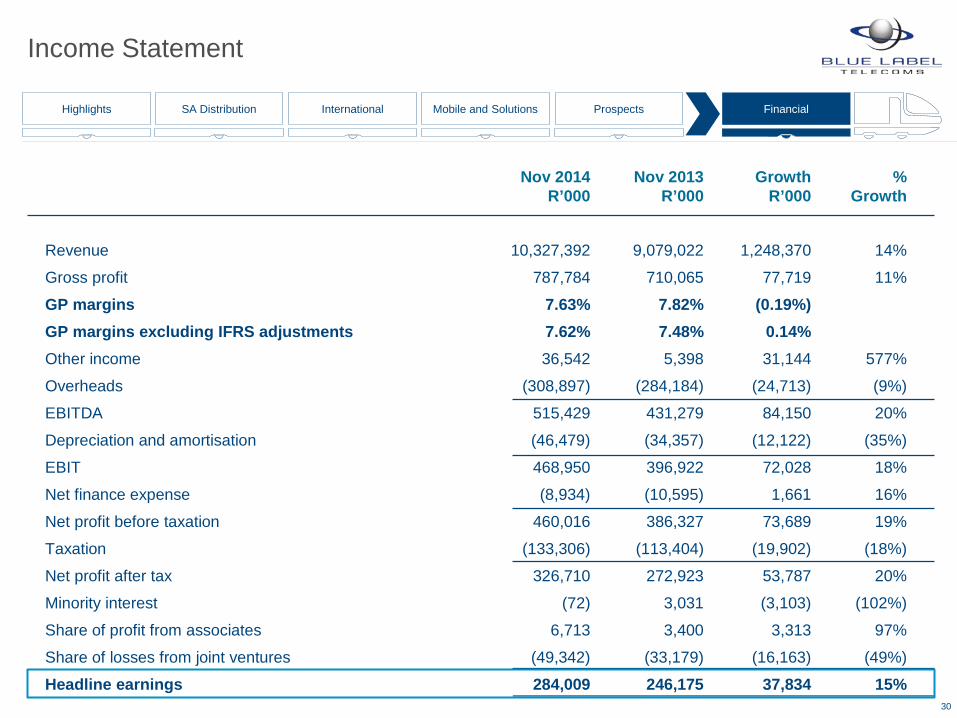
Revenue 10,327,392 9,079,022 1,248,370 14%
Gross profit 787,784 710,065 77,719 11%
GP margins 7.63% 7.82% (0.19%) GP margins excluding IFRS adjustments 7.62% 7.48% 0.14% Other income 36,542 5,398 31,144 577%
Overheads (308,897) (284,184) (24,713) (9%)
EBITDA 515,429 431,279 84,150 20%
Depreciation and amortisation (46,479) (34,357) (12,122) (35%)
EBIT 468,950 396,922 72,028 18%
Net finance expense (8,934) (10,595) 1,661 16%
Net profit before taxation 460,016 386,327 73,689 19%
Taxation (133,306) (113,404) (19,902) (18%)
Net profit after tax 326,710 272,923 53,787 20%
Minority interest (72) 3,031 (3,103) (102%)
Share of profit from associates 6,713 3,400 3,313 97%
Share of losses from joint ventures (49,342) (33,179) (16,163) (49%)
Headline earnings 284,009 246,175 37,834 15%
Income Statement
31
SA Distribution International Mobile and Solutions Prospects Financial Highlights
Nov 2014 Nov 2013 Growth % R’000 R’000 R’000 Growth
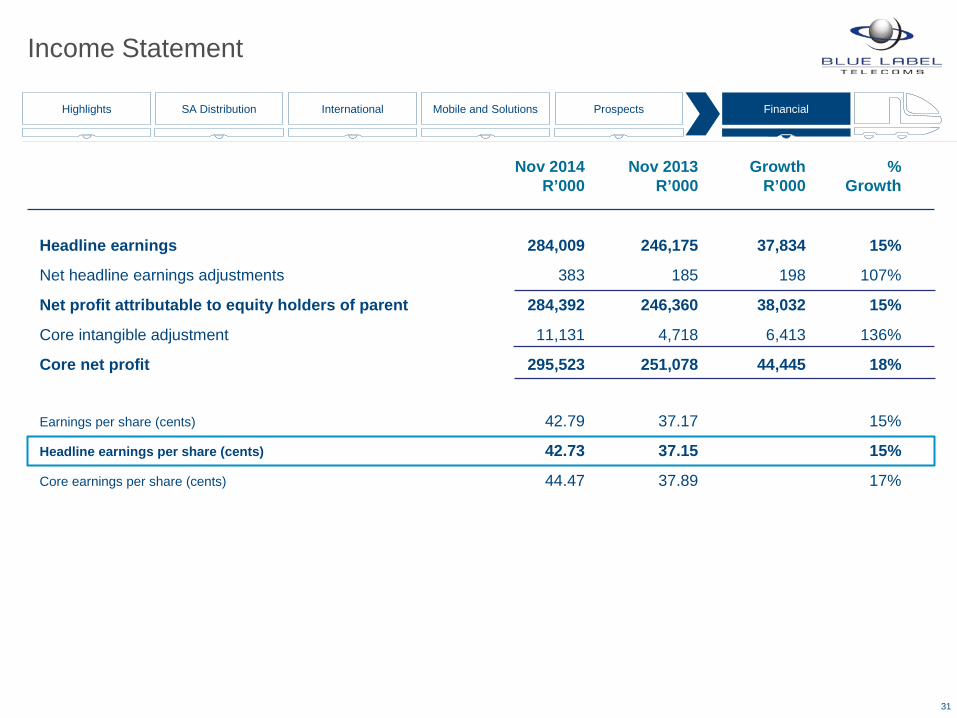
Headline earnings 284,009 246,175 37,834 15%
Net headline earnings adjustments 383 185 198 107%
Net profit attributable to equity holders of parent 284,392 246,360 38,032 15%
Core intangible adjustment 11,131 4,718 6,413 136%
Core net profit 295,523 251,078 44,445 18%
Earnings per share (cents) 42.79 37.17 15%
Headline earnings per share (cents) 42.73 37.15 15%
Core earnings per share (cents) 44.47 37.89 17%
Balance Sheet
32
SA Distribution International Mobile and Solutions Prospects Financial Highlights
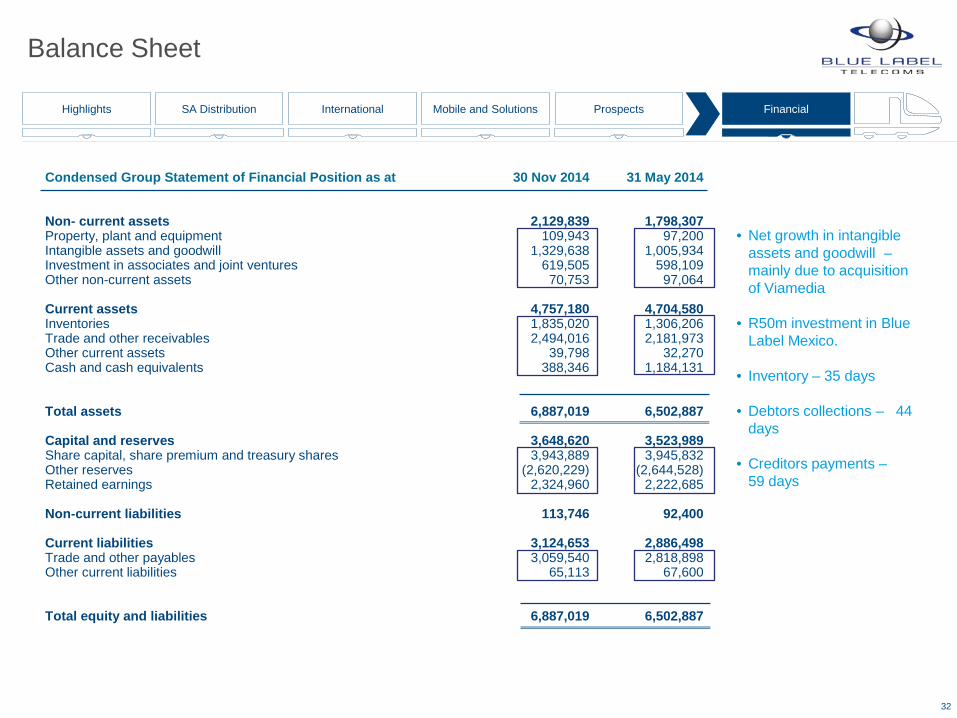
Condensed Group Statement of Financial Position as at 30 Nov 2014 31 May 2014 Non- current assets 2,129,839 1,798,307 Property, plant and equipment 109,943 97,200 Intangible assets and goodwill 1,329,638 1,005,934 Investment in associates and joint ventures 619,505 598,109 Other non-current assets 70,753 97,064 Current assets 4,757,180 4,704,580 Inventories 1,835,020 1,306,206 Trade and other receivables 2,494,016 2,181,973 Other current assets 39,798 32,270 Cash and cash equivalents 388,346 1,184,131 Total assets 6,887,019 6,502,887 Capital and reserves 3,648,620 3,523,989 Share capital, share premium and treasury shares 3,943,889 3,945,832 Other reserves (2,620,229) (2,644,528) Retained earnings 2,324,960 2,222,685 Non-current liabilities 113,746 92,400 Current liabilities 3,124,653 2,886,498 Trade and other payables 3,059,540 2,818,898 Other current liabilities 65,113 67,600 Total equity and liabilities 6,887,019 6,502,887
• Net growth in intangible
assets and goodwill – mainly due to acquisition of Viamedia
• R50m investment in Blue
Label Mexico.
• Inventory – 35 days
• Debtors collections – 44 days
• Creditors payments –
59 days
Cash Flow
33
SA Distribution International Mobile and Solutions Prospects Financial Highlights
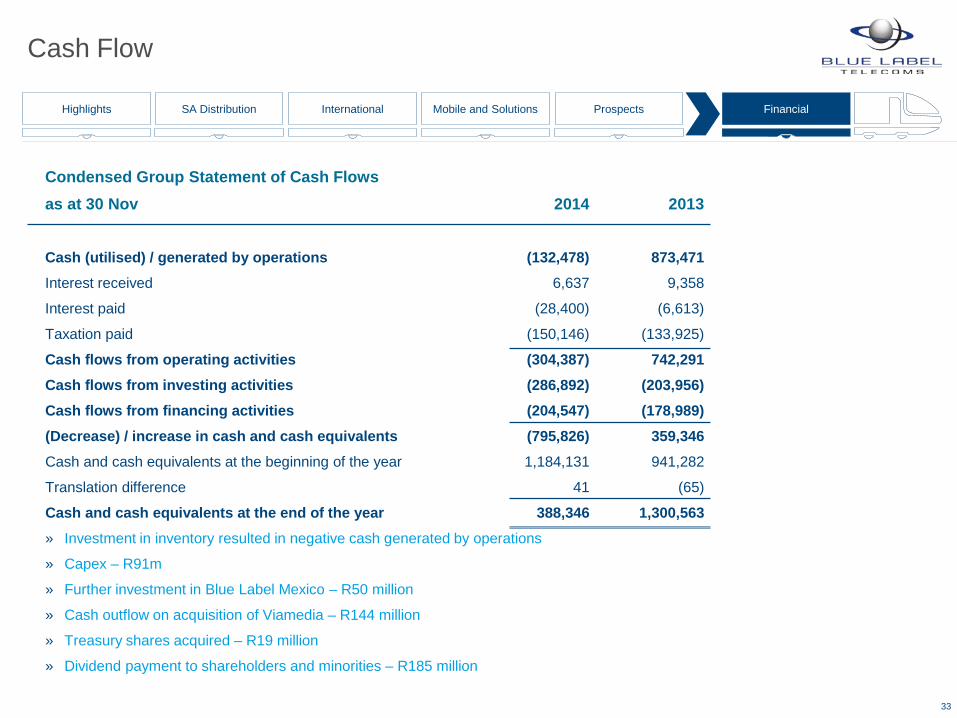
Condensed Group Statement of Cash Flows as at 30 Nov 2014 2013 Cash (utilised) / generated by operations (132,478) 873,471 Interest received 6,637 9,358
Interest paid (28,400) (6,613)
Taxation paid (150,146) (133,925)
Cash flows from operating activities (304,387) 742,291 Cash flows from investing activities (286,892) (203,956) Cash flows from financing activities (204,547) (178,989) (Decrease) / increase in cash and cash equivalents (795,826) 359,346 Cash and cash equivalents at the beginning of the year 1,184,131 941,282
Translation difference 41 (65)
Cash and cash equivalents at the end of the year 388,346 1,300,563
» Investment in inventory resulted in negative cash generated by operations
» Capex – R91m
» Further investment in Blue Label Mexico – R50 million
» Cash outflow on acquisition of Viamedia – R144 million
» Treasury shares acquired – R19 million
» Dividend payment to shareholders and minorities – R185 million
Thank you - Q & A