Embed Size (px)
Citation preview

Financial Statements of
LANDRY PRIVATE FUNDS
Year ended December 31, 2017

LANDRY PRIVATE FUNDS Table of Contents
Directory
Manager’s Responsibility for Financial Reporting
Independent Auditors' Report
Landry Global Equity Long/Short Fund 1
Landry Adaptive Value Long/Short Fund 12
Landry Razorbill Income Plus Fund 20
Notes to Financial Statements 27 - 49
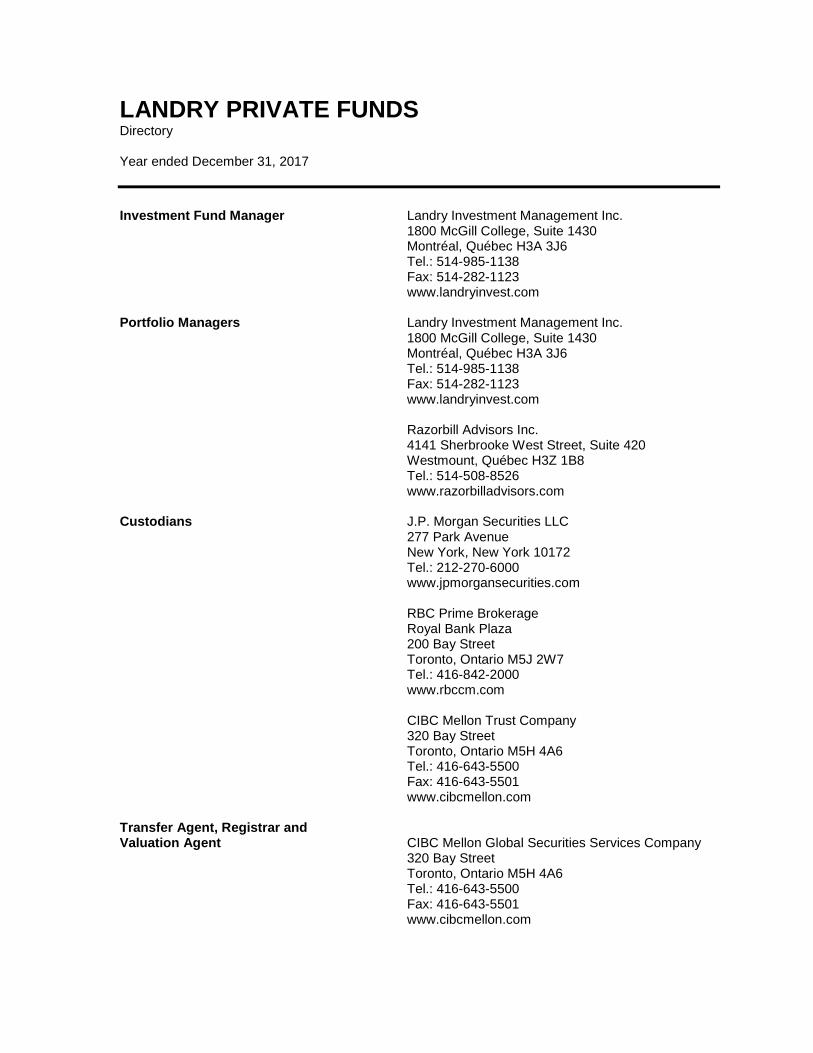
LANDRY PRIVATE FUNDS Directory Year ended December 31, 2017 Investment Fund Manager Landry Investment Management Inc. 1800 McGill College, Suite 1430 Montréal, Québec H3A 3J6 Tel.: 514-985-1138 Fax: 514-282-1123 www.landryinvest.com Portfolio Managers Landry Investment Management Inc. 1800 McGill College, Suite 1430 Montréal, Québec H3A 3J6 Tel.: 514-985-1138 Fax: 514-282-1123 www.landryinvest.com Razorbill Advisors Inc. 4141 Sherbrooke West Street, Suite 420 Westmount, Québec H3Z 1B8 Tel.: 514-508-8526 www.razorbilladvisors.com Custodians J.P. Morgan Securities LLC 277 Park Avenue New York, New York 10172 Tel.: 212-270-6000 www.jpmorgansecurities.com RBC Prime Brokerage Royal Bank Plaza 200 Bay Street Toronto, Ontario M5J 2W7 Tel.: 416-842-2000 www.rbccm.com CIBC Mellon Trust Company 320 Bay Street Toronto, Ontario M5H 4A6 Tel.: 416-643-5500 Fax: 416-643-5501 www.cibcmellon.com Transfer Agent, Registrar and Valuation Agent CIBC Mellon Global Securities Services Company 320 Bay Street Toronto, Ontario M5H 4A6 Tel.: 416-643-5500 Fax: 416-643-5501 www.cibcmellon.com

LANDRY PRIVATE FUNDS Directory (continued) Year ended December 31, 2017 Trustee Computershare Trust Company of Canada 1500 Robert-Bourassa Boulevard, 7th Floor Montréal, Québec H3A 3S8 Tel.: 514-982-7888 Fax: 514-982-7635 www.computershare.com Auditors KPMG LLP KPMG Tower 600 de Maisonneuve West Boulevard, Suite 1500 Montréal, Québec H3A 0A3 Tel.: 514-840-2100 Fax: 514-840-2187 www.kpmg.ca

MANAGER’S RESPONSIBILITY FOR FINANCIAL REPORTING
The following financial statements have been prepared by the Manager, Landry Investment Management Inc. The Manager is responsible for the integrity, objectivity and reliability of the data and declaration presented.
The Manager has taken all necessary measures to ensure that the financial information conveyed is relevant and reliable. The financial statements were prepared in accordance with International Financial Reporting Standards (as described in Notes 2 and 3) using information available and include certain amounts that are based on the Manager’s best estimates and judgment.
Approved on behalf of Landry Investment Management Inc.
Jean-Luc Landry
President & Chief Executive Officer

KPMG LLP Telephone (514) 840-2100 600 de Maisonneuve Blvd. West Fax (514) 840-2187 Suite 1500, Tour KPMG Internet www.kpmg.ca Montréal (Québec) H3A 0A3 Canada
KPMG LLP is a Canadian limited liability partnership and a member firm of the KPMG network of independent member firms affiliated with KPMG International Cooperative ("KPMG International"), a Swiss entity. KPMG Canada provides services to KPMG LLP.
INDEPENDENT AUDITORS' REPORT To the Unitholders of
Landry Global Equity Long/Short Fund Landry Adaptive Value Long/Short Fund Landry Razorbill Income Plus Fund (collectively the "Funds")
We have audited the accompanying financial statements of the Funds, which comprise the statements of financial position as at December 31, 2017, the statements of comprehensive income, changes in net assets attributable to holders of redeemable units and cash flows for the year then ended, and notes, comprising a summary of significant accounting policies and other explanatory information.
Management’s Responsibility for the Financial Statements
Management is responsible for the preparation and fair presentation of these financial statements in accordance with International Financial Reporting Standards, and for such internal control as management determines is necessary to enable the preparation of financial statements that are free from material misstatement, whether due to fraud or error.
Auditors’ Responsibility
Our responsibility is to express an opinion on these financial statements based on our audit. We conducted our audit in accordance with Canadian generally accepted auditing standards. Those standards require that we comply with ethical requirements and plan and perform the audit to obtain reasonable assurance about whether the financial statements are free from material misstatement.
An audit involves performing procedures to obtain audit evidence about the amounts and disclosures in the financial statements. The procedures selected depend on our judgment, including the assessment of the risks of material misstatement of the financial statements, whether due to fraud or error. In making those risk assessments, we consider internal control relevant to the entity's preparation and fair presentation of the financial statements in order to design audit procedures that are appropriate in the circumstances, but not for the purpose of expressing an opinion on the effectiveness of the entity's internal control. An audit also includes evaluating the appropriateness of accounting policies used and the reasonableness of accounting estimates made by management, as well as evaluating the overall presentation of the financial statements.
We believe that the audit evidence we have obtained is sufficient and appropriate to provide a basis for our audit opinion.

*CPA auditor, CA, public accountancy permit No. A129444
Page 2
Opinion
In our opinion, the financial statements present fairly, in all material respects, the financial position of the Funds as at December 31, 2017, and their financial performance and their cash flows for the year then ended in accordance with International Financial Reporting Standards.
March 27, 2018
Montréal, Canada

1
LANDRY GLOBAL EQUITY LONG/SHORT FUND Statement of Financial Position (In Canadian dollars) December 31, 2017, with comparative information for 2016 2017 2016
Assets
Current assets: Investments $ 10,179,422 $ 11,633,778 Cash equivalents 10,146,772 10,986,250 Amounts receivable relating to units issued − 30,000 Amounts receivable relating to portfolio assets sold − 4,235,623 Amounts receivable relating to accrued dividends 5,968 9,014 Amounts receivable relating to accrued interest 31,523 4,349 Prepaid expenses 34,308 6,578
20,397,593 26,905,592
Liabilities
Current liabilities: Bank overdraft − 2,356,514 Investments sold short 9,128,508 10,892,533 Accrued expenses 48,637 23,536 Accrued management fees 7,149 7,471 Amounts payable for portfolio assets purchased − 1,166,209
9,184,294 14,446,263
Net assets attributable to holders of redeemable units $ 11,213,299 $ 12,459,329
2017 2016
Number of units Net assets Number of units Net assets issued and attributable to issued and attributable to outstanding holders of outstanding holders of (note 7) redeemable units (note 7) redeemable units
Class A 4,055 $ 28,005 4,055 $ 27,335 Class F 702,949 7,105,368 779,083 7,597,715 Class I 451,744 3,528,368 570,897 4,253,524 Class J 50,587 551,958 55,797 580,755
2017 2016
Net assets attributable to holders of redeemable units per unit: Class A $ 6.91 $ 6.74 Class F 10.11 9.75 Class I 7.81 7.45 Class J 10.91 10.41
The accompanying notes are an integral part of these financial statements. Approved on behalf of Landry Investment Management Inc.:
Jean-Luc Landry Benoit Perraton Brillon, CFA President & Chief Executive Officer Chief Investment Officer & Director

2
LANDRY GLOBAL EQUITY LONG/SHORT FUND Statement of Comprehensive Income (In Canadian dollars) Year ended December 31, 2017, with comparative information for 2016 2017 2016 Revenue:
Dividend revenue $ (39,185) $ 22,244 Interest revenue 501,229 294,424 Foreign exchange (loss) gain (105,507) 3,884 Net realized gain (loss) on investments 1,450,968 (85,485) Net unrealized (loss) gain on investments (424,630) 10,768 Total revenue 1,382,875 245,835
Expenses:
Management fees (note 11) 83,797 90,791 Safekeeping fees 11,897 38,839 Administrative fees (note 8) 88,227 125,589 Transaction costs 64,558 185,268 Short borrow fees 8,724 75,114 Interest fees 611,010 394,250 Foreign withholding taxes 33,831 39,377 Total operating expenses 902,044 949,228
Increase (decrease) in net assets attributable to holders of
redeemable units $ 480,831 $ (703,393) Increase (decrease) in net assets attributable to holders of
redeemable units: Class A $ 670 $ 410 Class F 256,397 177,466 Class H − (1,080,923) Class I 198,362 173,497 Class J 25,402 26,157
Increase (decrease) in net assets attributable to holders of
redeemable units per unit: Class A $ 0.17 $ 0.10 Class F 0.35 0.21 Class H − (0.54) Class I 0.36 0.29 Class J 0.51 0.40
The accompanying notes are an integral part of these financial statements.

3
LANDRY GLOBAL EQUITY LONG/SHORT FUND Statement of Changes in Net Assets Attributable to Holders of Redeemable Units (In Canadian dollars) Year ended December 31, 2017, with comparative information for 2016 2017 Class A Class F Class I Class J Total
Balance, beginning of year $ 27,335 $ 7,597,715 $ 4,253,524 $ 580,755 $ 12,459,329 Increase in net assets
attributable to holders of redeemable units 670 256,397 198,362 25,402 480,831
Redeemable unit transactions:
Issue of redeemable units − 102,999 407,712 145,801 656,512 Redemption of redeemable
units − (851,743) (1,331,230) (200,000) (2,382,973)
Net decrease from
redeemable unit transactions − (748,744) (923,518) (54,199) (1,726,461)
Balance, end of year $ 28,005 $ 7,105,368 $ 3,528,368 $ 551,958 $ 11,213,699
2016 Class A Class F Class H Class I Class J Total
Balance, beginning of year $ 26,925 $ 8,914,989 $ 20,658,611 $ 4,308,832 $ 662,932 $ 34,572,289 Increase (decrease) in net assets
attributable to holders of redeemable units 410 177,466 (1,080,923) 173,497 26,157 (703,393)
Redeemable unit transactions:
Issue of redeemable units − 405,400 − 436,000 34,000 875,400 Redemption of redeemable
units − (1,842,474) (19,577,688) (664,805) (200,000) (22,284,967)
Net decrease from
redeemable unit transactions − (1,437,074) (19,577,688) (228,805) (166,000) (21,409,567)
Net transfer of units from
(to) other units − (57,666) − − 57,666 −
Balance, end of year $ 27,335 $ 7,597,715 $ − $ 4,253,524 $ 580,755 $ 12,459,329
The accompanying notes are an integral part of these financial statements.

4
LANDRY GLOBAL EQUITY LONG/SHORT FUND Statement of Cash Flows (In Canadian dollars) Year ended December 31, 2017, with comparative information for 2016 2017 2016 Cash provided by (used in): Operating activities:
Increase (decrease) in net assets attributable to holders of redeemable units $ 480,831 $ (703,393)
Adjustments for: Foreign exchange loss (gain) 105,507 (3,884) Net realized gain (loss) from investments (1,427,537) 85,485 Net unrealized loss (gain) from investments 454,300 (10,768) Dividend revenue 39,185 (22,244) Interest revenue (501,229) (294,424) Interest fees 611,010 394,250 Prepaid expenses (27,730) 2,593 Accrued expenses 25,101 (37,372) Accounts receivable relating to portfolio assets sold 4,235,623 − Liabilities for portfolio assets sold (1,166,209) − Management fees accrued (322) (1,934)
Net proceeds from sale of investment assets and liabilities 30,217,832 82,409,108 Net purchases of investment assets and liabilities (29,554,264) (80,426,367) Dividends received (36,139) 30,482 Interest received 474,055 307,533 Interest paid (611,010) (394,250) 3,319,004 1,334,815
Financing activities:
Proceeds from issuance of redeemable units 686,512 845,400 Payments on redemption of redeemable units (2,382,973) (22,284,967) (1,696,461) (21,439,567)
Net increase (decrease) in cash and cash equivalents 1,622,543 (20,104,752) Cash and cash equivalents, beginning of year 8,629,736 28,730,604 Foreign exchange (loss) gain on cash and cash equivalents (105,507) 3,884 Cash and cash equivalents, end of year $ 10,146,772 $ 8,629,736
Cash and cash equivalents are comprised of:
Bank overdraft $ − $ (2,356,514) Cash equivalents 10,146,772 10,986,250
$ 10,146,772 $ 8,629,736
The accompanying notes are an integral part of these financial statements.

5
LANDRY GLOBAL EQUITY LONG/SHORT FUND Schedule of Investment Portfolio (In Canadian dollars) December 31, 2017 Average Fair Shares/units Description cost value
U.S. equities (net -49.9%) Long Positions (+29.5%) 1,600 AbbVie Inc. $ 170,881 $ 193,876 1,000 Afiac Inc. 108,684 109,984 300 Align Technologie. 91,042 83,518 1,200 Allstate Corp (The) 138,700 157,436 900 Anadarko Petroleum Corp. 77,698 60,487 100 Anthem Inc. 24,411 28,193 700 Apache Corp. 39,948 37,030 4,500 Bank of America Corp. 126,320 166,442 200 BlackRock Inc. 133,192 128,731 600 Boeing Co. (The) 149,354 221,705 300 Caterpillar Inc. 55,433 59,232 700 Chevron Corp. 99,903 109,800 1,300 Citigroup Inc. 112,256 121,202 500 CVS Health Corp. 46,608 45,419 1,700 Devon energy Corp. 97,389 88,183 600 Dollar tree Inc. 82,498 80,672 1,200 Fifth Third Bancorp 47,234 45,617 800 Gap Inc. (The) 34,985 34,140 800 Gilead Sciences Inc. 81,332 71,809 2,600 HP Inc. 52,325 68,444 700 INC Research Holdings Inc., Class 'A' 37,433 38,240 1,400 Intel Corp 78,268 80,971 200 Intuitive Surgical Inc. 82,930 91,450 1,000 JPMorgan Chase & Co. 107,840 133,990 1,000 Kroger Co. (The) 34,128 34,393 1,000 Lincoln National Corp. 69,708 96,314 300 Marriot International Inc., Class 'A' 49,740 51,019 700 MasterCard Inc., Class 'A' 138,016 132,753 300 McKesson Corp. 55,540 58,619 1,100 Microsoft Corp. 121,219 117,895 1,400 Monster Beverage Corp. 113,733 111,019 700 Newell Brands Inc. 28,219 27,101 2,500 PayPal Holdings Inc. 190,501 230,605 600 Principal Financial group Inc. 54,905 53,045 200 UnitedHealth Group Inc. 57,191 55,245 1,200 Unum Group 59,356 82,529 3,048,920 3,307,108
Short Positions (-79.4%) (9,200) IShares MSCI Australia ETF (269,951) (267,084) (8,100) IShares MSCI Austria Capped ETF (246,111) (250,069) (29,200) IShares Canada ETF (1,007,241) (1,084,413) (41,600) IShares MSCI EAFE ETF (3,447,379) (3,664,748) (8,100) IShares MSCI United Kingdom ETF (350,749) (363,533) (6,100) IShares S&P 100 ETF (679,296) (906,765) (4,600) PowerShares QQQ Trust, Series 1 (580,865) (897,734) (4,400) SPDR S&P 500 ETF Trust (1,263,054) (1,471,194) (7,844,646) (8,905,540)
Balance carried forward (4,795,726) (5,598,432)

6
LANDRY GLOBAL EQUITY LONG/SHORT FUND Schedule of Investment Portfolio (continued) (In Canadian dollars) December 31, 2017 Average Fair Shares/units Description cost value
Balance brought forward $ (4,795,726) $ (5,598,432)
Austrian equities (net +5.5%)
Long Positions (-5.5%)
(1,500) CA Immobillien Anlagen AG 53,106 58,237 (600) Erste Group Bank 27,794 32,593 (2,000) OMV AG 103,922 158,970 (2,100) Raiffeisen Bank International AG 89,621 95,418 (13,000) Telekom Austria AG 123,916 151,172 (1,500) Verbund AG 46,101 45,464 (1,000) Voestapine AG 72,882 74,994 517,342 616,848 United Kingdom equities (net +9.6%)
Long Positions (+9.6%) 2,300 3i Group PLC 34,761 35,611 2,000 Anglo American PLC 40,043 52,526 12,000 Barclays 41,516 41,309 500 Berkeley Group Holdings PLC 35,368 35,568 2,000 BHP Billiton PLC 44,901 51,611 200 Carnival PLC 16,901 16,583 4,400 Evraz PLC 23,576 25,356 1,800 HSBC Holdings PLC 23,504 23,397 1,100 Intertek Group PLC 93,271 96,763 7,700 Jupiter Fund Management PLC 79,793 82,025 3,400 Just-Eat Holding Ltd. 45,934 45,007 900 London Stock Exchange Group PLC 56,682 57,860 1,900 NMC Health PLC 70,222 92,907 900 Renishaw PLC 67,310 79,704 14,600 Rentokil Initial PLC 75,811 78,692 800 Rio Tinto PLC, Registered 42,426 53,451 5,800 Royal Bank of Scotland Group PLC 21,788 27,329 6,200 Sophos Group PLC 57,918 59,899 8,200 SSP Group PLC 76,293 94,926 5,900 Vodafone Group PLC 23,667 23,500 971,685 1,074,024
France equities (net +4.7%)
Long Positions (+6.7%) 400 Aéroports de Paris 86,546 95,388 3,700 Sir France-KLM 71,341 75,597 1,000 AXA SA 30,565 37,215 400 BNP Paribas SA 31,237 37,463 1,600 Crédit Agricole SA 24,051 33,220 1,100 Engie 22,897 23,724 1,000 Eurazeo SA 107,128 115,851 200 Kering 90,815 118,257 1,800 Natixix SA 14,842 17,863 1,000 Neopost SA 35,937 36,109 400 Publicis Groupe 34,994 34,093 300 Societe Generale SA 19,813 19,431 1,000 Total SA 66,369 69,277 600 Worldline SA 35,712 36,714 672,247 750,202
Balance carried forward (2,634,452) (3,157,358)

7
LANDRY GLOBAL EQUITY LONG/SHORT FUND Schedule of Investment Portfolio (continued) (In Canadian dollars) December 31, 2017 Average Fair Shares/units Description cost value
Balance brought forward $ (2,634,452) $ (3,157,358) France equities (net +4.7%) (continued) Short Positions (-2.0%) (5,700) iShares MSCI France ETF (178,957) (222,968) (178,957) (222,968) 493,290 527,235 Swiss equities (-0.4%) Long Positions (+0.4%) 100 Swiss Life Holding AG, Registered 43,634 44,358 43,634 44,358 Luxembourg equities (net +0.2%) Long Positions (+0.2%) 600 ArcelorMittal SA. 17,516 24,477 17,516 24,477 Australian equities (net +4.4%) Long Positions (+4.4%) 700 Blackmores Ltd. 117,085 116,051 4,500 carsales.com Ltd. 60,696 63,901 1,400 CIMIC Group Ltd. 68,505 70,589 300 Cochlear Ltd. 50,554 50,341 1,300 Flight Centre Travel Group Ltd. 60,950 56,361 7,900 Origin Energy Ltd. 71,628 72,929 13,400 Qantas Airway Ltd. 76,945 66,185 506,363 496,357 Ireland equities (net +1.4%) Long Positions (+1,4%) 300 Allergan PLC 81,973 61,487 1,200 Mallinckrodt PLC 37,337 33,920 900 Shire PLC 58,165 59,492 177,475 154,899 Spain equities (net +0.8%) Long Positions (net +0.8%) 600 ACS Actividades de Construcción y Servicios SA 29,235 29,447 9,000 Banco de Sabadell SA 22,683 22,424 1,500 Repsol SA 33,962 33,277 1,500 Repsol SA, Rights 869 855
86,749 86,003 Netherlands equities (net +0.9%) Long Positions (net +0.9%) 300 LyondellBasell Industries NV, Class 'A' 41,363 41,468 1,400 Royal Dutch Shell PLC, Class 'A' 58,596 58,704
99,959 100,172
Balance carried forward (1,209,466) (1,723,857)

8
LANDRY GLOBAL EQUITY LONG/SHORT FUND Schedule of Investment Portfolio (continued) (In Canadian dollars) December 31, 2017 Average Fair Shares/units Security cost value
Balance brought forward $ (1,209,466) $ (1,723,857) Japan equities (net +9.7%) Long Positions (net +9.7%) 1,400 Asahi Group Holdings Ltd. 91,338 87,045 4,600 Chiba Bank Ltd. 41,866 47,991 1,300 COMSYS Holding Corp. 45,197 47,209 3,200 Concordia Financial Group Ltd. 24,919 24,203 2,900 Haseko Corp. 47,311 56,479 3,000 Hitachi Ltd. 25,488 29,293 2,000 IShares MSCI Japan ETF 138,208 150,180 600 KDDI Corp. 22,016 18,716 3,900 Mitsubishi UFJ Financial Group Inc. 36,635 35,847 1,800 Nikon Inc. 47,303 45,447 500 Nippon Telegraph & Telephone Corp. 32,442 29,480 3,700 Shizuoka Bank Ltd. (The) 46,019 47,902 1,200 Showa Denko K.K. 46,355 64,266 700 Sumitono Mitsui Financial Group Inc. 35,694 37,901 600 Taisei Corp. 36,810 37,438 200 TDK Corp. 20,306 19,998 1,000 Teijin Ltd. 25,065 27,917 6,000 Tokai Carbon Co. Ltd. 69,633 93,095 1,600 Tosoh Corp. 33,130 45,451 2,600 YASKAWA Electric Corp. 97,085 143,580
962,820 1,089,438 German equities (net +7.0%) Long Positions (net +7.0%) 400 Aareal Bank AG. 22,925 22,738 4,100 Aixton AG 49,324 71,433 100 Ailianz AG, Registered. 22,363 28,812 200 Aurubis AG 21,627 23,411 600 Axel Springer SE 61,299 58,919 500 Bechtle AG 53,593 52,298 1,300 CECONOMY AG 22,623 24,654 400 Covestro AG 31,079 51,774 1,400 Deutsche Bank AG, Registered 34,914 33,438 900 Deutsche Lufthansa AG 19,524 41,598 1,200 E.ON.SE 17,014 16,359 700 RWE AG, Class 'A' 21,645 17,904 600 Salzgitter AG 33,716 42,965 900 Talanx AG 39,891 45,951 300 Wacker Chemie AG 68,163 74,092 1,300 Wirecard AG 140,977 182,037 660,677 788,383
Balance carried forward 414,031 153,964

9
LANDRY GLOBAL EQUITY LONG/SHORT FUND Schedule of Investment Portfolio (continued) (In Canadian dollars) December 31, 2017 Average Fair Shares/units Security cost value
Balance brought forward $ 414,031 $ 153,964 Canadian equities (net +13.3%) Long Positions (+13.3%) 4,200 Air Canada 71,878 108,696 11,700 Baytex energy Corp. 45,845 44,109 900 Canadian Imperial Bank of Commerce 99,393 110,286 1,500 Canfor Corp. 29,215 37,170 5,900 Canopy Growth Corp. 117,213 175,466 2,900 Cenovus Energy Inc. 35,262 33,292 1,200 Cogeco Communications Inc. 102,802 103,776 5,000 Crescent Point energy Corp. 70,431 47,900 500 Dollorama 78,451 78,525 7,600 Enerplus Corp. 91,087 93,556 5,000 Husky Energy Inc. 81,270 88,750 4,700 IAMGOLD Corp. 34,118 34,451 1,900 Kirkland Lake Gold Ltd. 31,738 36,613 3,000 Manulife Financial Corp 80,675 78,660 1,300 National Bank of Canada 83,185 81,536 4,200 Quebecor Inc., Class 'A' 101,522 99,540 1,000 Shopify Inc., Class 'A' 137,215 127,110 1,900 Stars Group Inc. (The) 57,825 55,575 1,600 Teck Resources Ltd., Class 'B' 44,977 52,592
1,394,102 1,487,603 Italian equities (net +0.9%) Long Positions (+0.9%) 1,000 Assicurazioni Generali SPA 23,345 22,869 2,400 Mediobanca SPA 34,776 34,159 40,500 Telecom SPA 45,342 43,903
103,463 100,931 Belgium equities (net +0.2%) Long Positions (+0.2%) 200 KBC Group NV. 21,700 21,398
21,700 21,398 Bermuda equities (net +0.3%) Long Positions (+0.3%) 1,000 Hiscox Ltd. 31,623 37,221
31,623 37,221 Total long positions 9,316,275 10,179,422 Total short positions (8,023,603) (9,128,508) Transaction costs (30,405) − Total investment portfolio (9.4%) $ 1,262,267 $ 1,050,914 Cash and cash equivalents (90.5%) 10,146,772 Other assets less liabilities (0.1%) 16,013
Net assets attributable to holders of redeemable units at fair value (100.0%) $ 11,213,699
The accompanying notes are an integral part of these financial statements.

10
LANDRY GLOBAL EQUITY LONG/SHORT FUND Fair Value of Financial Instruments (In Canadian dollars) The following is a summary of the inputs used as of December 31, 2017 and 2016 in valuing the fund's investments carried at fair value: 2017 2016 Level 1 Level 1 quoted prices quoted prices in active in active markets for markets for identical identical assets assets Investments:
Equities $ 10,029,242 $ 11,161,428 Exchange traded funds 150,180 472,350 Total investments 10,179,422 11,633,778
Investments sold short:
Exchange traded funds (9,128,508) (10,892,533) Total investments sold short (9,128,508) (10,892,533)
Total investments, net $ 1,050,914 $ 741,245
There were no significant transfers made between Levels 1 and 2 as a result of changes in the availability of quoted market prices or observable market inputs during the years presented. In addition, there were no investments or transactions classified in Level 3 for the years ended December 31, 2017 and 2016. The accompanying notes are an integral part of these financial statements.

11
LANDRY ADAPTIVE VALUE LONG/SHORT FUND Statement of Financial Position (In Canadian dollars) December 31, 2017, with comparative information for 2016 2017 2016
Assets
Current assets: Investments $ 4,897,760 $ 4,457,939 Cash equivalents 1,391,925 1,398,250 Amounts receivable relating to accrued dividends 11,313 9,189 Amounts receivable relating to accrued interest 4,585 554 Prepaid expenses 1,920 1,243 6,307,503 5,867,175
Liabilities
Current liabilities: Bank overdraft − 80,481 Investments sold short 1,567,335 1,279,160 Accrued expenses 4,710 4,469 Accrued management fees 7,360 6,143 1,579,405 1,370,253
Net assets attributable to holders of redeemable units $ 4,728,098 $ 4,496,922
2017 2016
Number of units Net assets Number of units Net assets issued and attributable to issued and attributable to outstanding holders of outstanding holders of (note 7) redeemable units (note 7) redeemable units
Class F 355,632 $ 3,970,641 343,995 $ 3,795,216 Class I 63,732 757,457 60,569 701,706
2017 2016
Net assets attributable to holders of redeemable units per unit: Class F $ 11.17 $ 11.03 Class I 11.89 11.59
The accompanying notes are an integral part of these financial statements. Approved on behalf of Landry Investment Management Inc.:
Jean-Luc Landry Benoit Perraton Brillon, CFA President & Chief Executive Officer Chief Investment Officer & Director
12
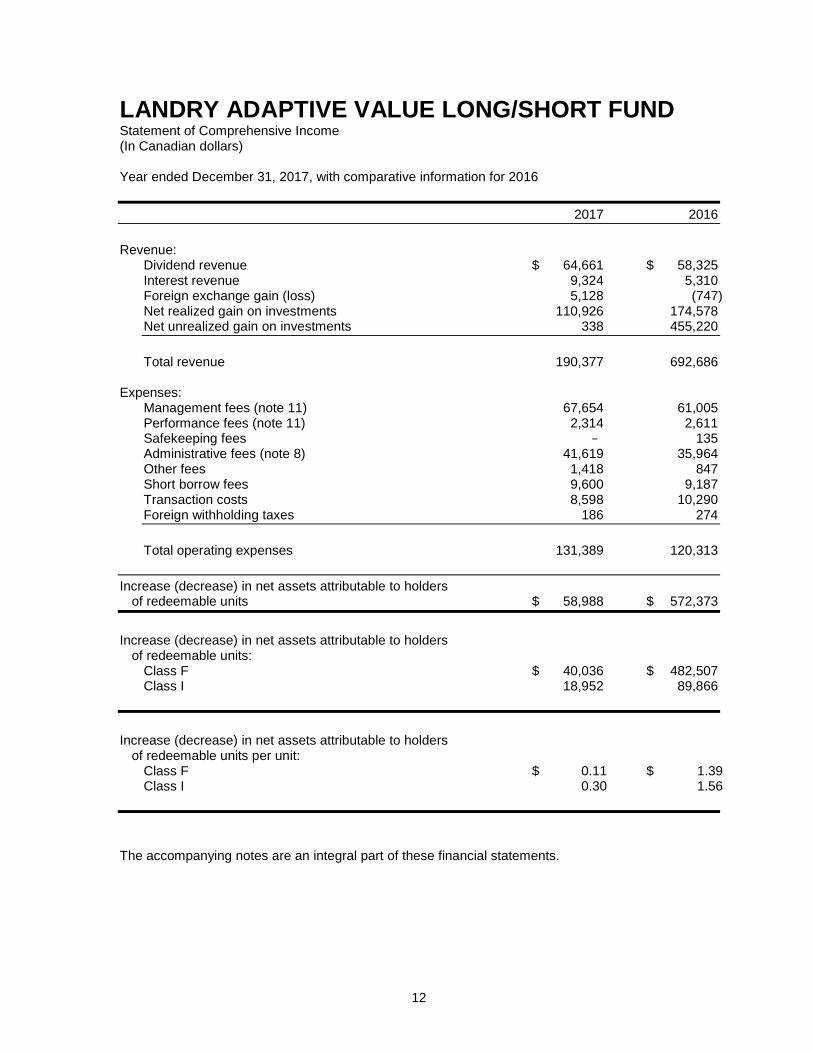
LANDRY ADAPTIVE VALUE LONG/SHORT FUND Statement of Comprehensive Income (In Canadian dollars) Year ended December 31, 2017, with comparative information for 2016 2017 2016 Revenue:
Dividend revenue $ 64,661 $ 58,325 Interest revenue 9,324 5,310 Foreign exchange gain (loss) 5,128 (747) Net realized gain on investments 110,926 174,578 Net unrealized gain on investments 338 455,220 Total revenue 190,377 692,686
Expenses:
Management fees (note 11) 67,654 61,005 Performance fees (note 11) 2,314 2,611 Safekeeping fees − 135 Administrative fees (note 8) 41,619 35,964 Other fees 1,418 847 Short borrow fees 9,600 9,187 Transaction costs 8,598 10,290 Foreign withholding taxes 186 274 Total operating expenses 131,389 120,313
Increase (decrease) in net assets attributable to holders
of redeemable units $ 58,988 $ 572,373 Increase (decrease) in net assets attributable to holders
of redeemable units: Class F $ 40,036 $ 482,507 Class I 18,952 89,866
Increase (decrease) in net assets attributable to holders
of redeemable units per unit: Class F $ 0.11 $ 1.39 Class I 0.30 1.56
The accompanying notes are an integral part of these financial statements.

13
LANDRY ADAPTIVE VALUE LONG/SHORT FUND Statement of Changes in Net Assets Attributable to Holders of Redeemable Units (In Canadian dollars) Year ended December 31, 2017, with comparative information for 2016 2017 Class F Class I Total Balance, beginning of year $ 3,795,216 $ 701,706 $ 4,496,922 Increase in net assets attributable
to holders of redeemable units 40,036 18,952 58,988 Proceeds from the issuance of units of the
investment fund 260,600 36,799 297,399 Redeemable unit transactions:
Redemption of redeemable units (125,211) – (125,211) Balance, end of year $ 3,970,641 $ 757,457 $ 4,728,098 2016 Class F Class I Total Balance, beginning of year $ 3,458,617 $ 513,163 $ 3,971,780 Increase in net assets attributable
to holders of redeemable units 482,507 89,866 572,373 Proceeds from the issuance of units of the
investment fund 45,499 98,677 144,176 Redeemable unit transactions:
Redemption of redeemable units (191,407) − (191,407) Balance, end of year $ 3,795,216 $ 701,706 $ 4,496,922 The accompanying notes are an integral part of these financial statements.

14
LANDRY ADAPTIVE VALUE LONG/SHORT FUND Statement of Cash Flows (In Canadian dollars) Year ended December 31, 2017, with comparative information for 2016 2017 2016 Cash provided by (used in): Operating activities:
Increase in net assets attributable to holders of redeemable units $ 58,988 $ 572,373
Adjustments for: Foreign exchange (gain) loss (5,128) 747 Net realized gain from investments and derivatives (110,926) (174,578) Net change in unrealized gain from investments (338) (455,220) Dividend revenue (64,661) (58,325) Interest revenue (9,324) (5,310) Prepaid expenses (677) (145) Accrued expenses 241 (11,401) Accrued management fees 1,217 1,042
Dividends received 62,537 61,544 Interest received 5,293 5,192 Net proceeds from sale of investment assets and liabilities 3,209,874 4,269,217 Net purchase of investment assets and liabilities (3,250,256) (3,603,625) (103,160) 601,511
Financing activities:
Proceeds from issuance of redeemable units 297,399 144,176 Payments on redemption of redeemable units (125,211) (191,407) 172,188 (47,231)
Net increase in cash and cash equivalents 69,028 554,280 Cash and cash equivalents, beginning of year 1,317,769 764,236 Foreign exchange gain (loss) on cash
and cash equivalents 5,128 (747) Cash and cash equivalents, end of year $ 1,391,925 $ 1,317,769 Cash and equivalents are comprised of:
Bank overdraft $ – $ (80,481) Cash equivalents 1,391,925 1,398,250
$ 1,391,925 $ 1,317,769 The accompanying notes are an integral part of these financial statements.

15
LANDRY ADAPTIVE VALUE LONG/SHORT FUND Schedule of Investment Portfolio (In Canadian dollars) December 31, 2017 Average Fair Shares/units Security cost value
Canadian equities (net +67.6%) Long Positions (+100.7%) Financial Services (+32.7%) 800 Allied Properties REIT $ 33,429 $ 33,664 1,000 Bank of Montréal 78,961 100,590 3,700 Bank of Nova Scotia 238,157 300,144 1,100 Canadian Imperial Bank of Commerce 111,966 134,794 1,100 Canadian Western Bank 37,655 43,175 400 FirstService Corp. 33,258 35,172 1,000 Granite REIT, Stapled Units 50,480 49,250 1,100 IGM Financial Inc. 48,731 48,565 500 Industrial Alliance Insurance and Financial Services Inc. 29,934 29,910 500 Intact Financial Corp. 50,346 52,495 2,200 Labrador Iron One Royalty Corp. 46,938 59,840 4,700 Manulife Financial Corp. 102,032 123,234 1,300 National Bank of Canada 68,528 81,536 3,400 Royal Bank of Canada 257,790 349,010 1,400 Toronto-Dominion Bank (The) 88,980 103,110 1,277,185 1,544,489 Energy (+18.9%) 10100 Baytex Energy Corp. 34,634 33,553 11,100 Bonavista Energy Corp. 49,294 30,600 4,100 Canadian Natural Resources Ltd. 109,564 157,220 3,100 Cenovus Energy Inc. 91,737 63,140 3,700 Crescent Point Energy Corp. 89,069 57,480 4,700 Encana Corp. 35,554 46,956 1,900 Enerplus Corp. 61,867 65,243 7,100 Gran Tierra Energy Inc. 26,331 28,985 4,100 Husky Energy Inc. 90,744 104,725 1,700 Raging River Exploration Inc. 22,617 22,400 6,100 Suncor Energy Inc. 199,912 258,440 1,400 Vermillion Energy Inc. 24,207 22,840 832,530 891,582 Industrials (+12.5%) 3,900 Air Canada 77,393 100,932 2,400 CAE Inc. 47,058 56,040 1,700 Canadian National Railway Co. 133,283 176,205 300 Canadian Pacific Railway Ltd. 58,371 68,898 600 Toromont Industries Ltd. 33,618 33,060 1,800 Transcontimental Inc., Class ‘A’ 50,515 44,712 500 Waste Connections Inc. 41,195 44,580 1,400 WestJet Airlines Ltd. 37,588 36,904 500 WSP Global Inc. 26,187 29,955
505,208 591,286
Balance carried forward 2,614,923 3,027,357

16
LANDRY ADAPTIVE VALUE LONG/SHORT FUND Schedule of Investment Portfolio (continued) (In Canadian dollars) December 31, 2017 Average Fair Shares/units Security cost value
Balance brought forward $ 2,614,923 $ 3,027,357 Canadian equities (net +67.6%) Long Positions (+100.7%) Materials (+13.8%) 3,000 Canfor Corp. 64,186 74,340 800 CCL Industries Inc., Class 'B' 19,815 46,464 6,200 Hudbay Minerals Inc. 56,324 69,006 5,800 IAMGOLD Corp. 29,761 42,514 5,900 Ivanhoe Mines Ltd., Class 'A' 24,657 25,016 6,100 Kinross Gold Corp. 32,798 33,062 3,900 Kirkland Lake Gold Ltd. 64,900 75,153 4,700 Lundin Mining Corp. 28,233 39,292 500 Methanex Corp. 30,834 38,080 800 Norbord 36,350 34,040 3,000 Teck Resources Ltd., Class 'B' 27,744 98,610 1,000 West Fraser Timber Co. Ltd. 63,146 77,570 478,748 653,147 Information technology (+6.8%) 2,300 BlackBerry Ltd. 29,921 32,292 2,400 Celestica Inc. 33,399 31,632 900 CGI Group Inc., Class 'A' 45,262 61,470 100 Constellation Software Inc. 69,309 76,202 700 Descartes Systems Group Inc. (The) 26,619 25,018 500 Shopify Inc., Class 'A' 73,875 63,555 1,000 Stars Group Inc. 28,024 29,250 306,409 319,419 Consumer discretionary (+9.4%) 1,400 Cogeco Communications Inc. 111,067 121,072 600 Dollarama Inc. 74,516 94,230 700 Linamar Corp. 46,455 51,247 700 Magna International Inc. 40,781 49,868 3,800 Québecor Inc., Class 'B' 78,084 90,060 500 Restaurant Brands Holdings Corp. 39,170 38,635 390,073 445,112
Consumer Staples (+2.8%) 300 George Weston Ltd. 31,787 32,748 700 Maple Leaf Foods Inc. 23,483 25,074 Premium Brands Holdings Corp. 65,510 72,212 120,780 130,034 Utilities (+1.0%) 1,600 Algonquin Power & Utilities Corp. 22,567 22,567 700 Fortis Inc. 33,732 32,277 56,299 54,773
Balance carried forward 3,967,232 4,629,842

17
LANDRY ADAPTIVE VALUE LONG/SHORT FUND Schedule of Investment Portfolio (continued) (In Canadian dollars) December 31, 2017 Average Fair Shares/units Security cost value
Balance brought forward $ 3,967,232 $ 4,629,842 Canadian equities (net +67.6%) Long Positions (+100.7%) Health care (0.9 %) 1,400 Canopy Growth Corp. 27,877 41,636 27,877 41,636 Telecommunications (1.9%) 1,400 Rogers Communications Inc., Class 'B' 88,579 89,670 88,579 89,670 Short Positions (-33.1%) Exchange Traded Funds (-33.1%) (56,500) iShares S&P/TSX 60 Index ETF (1,351,309) (1,567,335)
(1,351,309) (1,567,335)
2,732,379 3,193,813 U.S. equities (net +2.9%) Long Positions (+2.9%) Mutual Fund Corp. & Trust (2.9%) 700 PowerShares QQQ Trust, Series 1 79,301 136,612
79,301 136,612 Total long positions 4,162,989 4,897,760 Total short positions (1,351,309) (1,567,335) Transaction costs (6,497) − Total investment portfolio (70.5%) $ 2,805,183 $ 3,330,425 Cash and cash equivalents (29.4%) 1,391,925 Other assets less liabilities (0.1%) 5,748
Net assets attributable to holders of redeemable units at fair value (100.0%) $ 4,728,098
The accompanying notes are an integral part of these financial statements.

18
LANDRY ADAPTIVE VALUE LONG/SHORT FUND Fair Value of Financial Instruments (In Canadian dollars)
The following is a summary of the inputs used as of December 31, 2017 and 2016 in valuing the fund's investments carried at fair value: 2017 2016 Level 1 quoted Level 1 quoted prices in active prices in active markets for markets for identical assets identical assets Investments:
Equities $ 4,761,148 $ 4,346,581 Mutual fund 136,612 111,358 Total investments 4,897,760 4,457,939
Investments sold short:
Exchange traded funds (1,567,335) (1,279,160) Total investments sold short (1,567,335) (1,279,160)
Total investments, net $ 3,330,425 $ 3,178,779
There were no significant transfers made between Levels 1 and 2 as a result of changes in the availability of quoted market prices or observable market inputs during the year presented. In addition, there were no investments or transactions classified in Levels 2 and 3 and for the years ended December 31, 2017 and 2016. The accompanying notes are an integral part of these financial statements.

19
LANDRY RAZORBILL INCOME PLUS FUND Statement of Financial Position (In Canadian dollars) December 31, 2017, with comparative information for 2016 2017 2016 Assets Current assets:
Investments $ 22,252,606 $ 12,347,405 Cash and cash equivalents 422,196 1,441,175 Amounts receivable relating to units issued – 2,500 Amount receivable relating to accrued dividends 1,534 – Amounts receivable relating to accrued interest 95,995 56,744 Prepaid expenses 7,313 – 22,779,644 13,847,824
Liabilities Current liabilities:
Accrued expenses 16,843 2,504 Accrued management fees 12,748 3,359 Amounts payable for portfolio assets purchased – 8,283
29,591 14,146
Net assets attributable to holders of redeemable units $ 22,750,053 $ 13,833,678
2017 2016 Number of units Net assets Number of units Net assets issued and attributable to issued and attributable to outstanding holders of outstanding holders of (note 7) redeemable units (note 7) redeemable units
Class F $ 1,748,232 $ 18,066,586 $ 1,335,314 $ 13,404,084 Class G 245,647 2,506,513 – – Class I 103,864 1,035,776 – – Class J 109,807 1,141,178 42,784 429,594
2017 2016 Net assets attributable to holders of redeemable units per unit:
Class F $ 10.33 $ 10.04 Class G 10.20 – Class I 9.97 – Class J 10.39 10.04
The accompanying notes are an integral part of these financial statements. Approved on behalf of Landry Investment Management Inc.:
Jean-Luc Landry Benoit Perraton Brillon, CFA President & Chief Executive Officer Chief Investment Officer & Director

20
LANDRY RAZORBILL INCOME PLUS FUND Statement of Comprehensive Income (In Canadian dollars) Year ended December 31, 2017, with comparative information for 2016 2017 2016 Revenue:
Dividend revenue $ 192,038 $ − Interest revenue 474,485 7,428 Short-term trading fees 2,038 − Net unrealized gain on investments 475,271 89,584 Net realized gain (loss) on investments 274,348 − Foreign exchange loss (650) (2,354) Total revenue 1,417,530 94,658
Expenses:
Management fees (note 11) 137,655 3,359 Safekeeping fees 10,609 − Administrative fees (note 8) 103,061 2,504 Other fees 59 − Transaction costs 1,202 1,617 Total operating expenses 252,586 7,480
Increase in net assets attributable to holders of redeemable units $ 1,164,944 $ 87,178 Increase in net assets attributable to holders of redeemable units:
Class F $ 948,895 $ 84,984 Class G 126,013 − Class I 35,776 − Class J 54,260 2,194
Increase in net assets attributable to holders of redeemable units
per unit: Class F $ 0.58 $ 0.17 Class G 0.57 − Class I 0.36 − Class J 0.61 0.06
The accompanying notes are an integral part of these financial statements.

21
LANDRY RAZORBILL INCOME PLUS FUND Statement of Changes in Net Assets Attributable to Holders of Redeemable Units (In Canadian dollars) Year ended December 31, 2017, with comparative information for 2016 2017 Class F Class G Class I Class J Total Balance, beginning of year $13,404,084 $ − $ − $ 429,594 $13,833,678 Increase in net assets attributable
to holders of redeemable units 948,895 126,013 35,776 54,260 1,164,944
Redeemable unit transactions:
Issue of redeemable units 4,427,674 2,380,500 1,000,000 966,970 8,775,144 Reinvestment of distributions 506,106 92,182 38,534 34,780 671,602 Redemption of redeemable units (714,076) − − (309,645) (1,023,721) Net increase from redeemable unit
transactions 4,219,704 2,472,682 1,038,534 692,105 8,423,025 Distributions:
Net investment income (300,369) (61,186) (25,725) (28,341) (415,621) Realized gains on portfolio
assets sold (205,728) (30,996) (12,809) (6,440) (255,973)
Balance, end of year $18,066,586 $ 2,506,513 $ 1,035,776 $1,141,178 $ 22,750,053
2016 Class F Class J Total Balance, beginning of year $ − $ − $ − Increase in net assets attributable to holders
of redeemable units 84,984 2,194 87,178 Redeemable unit transactions:
Issue of redeemable units 13,319,100 427,400 13,746,500 Reinvestment of distributions 1,427 138 1,565 Net increase from redeemable unit
transactions 13,320,527 427,538 13,748,065 Distributions:
Net investment income (1,427) (138) (1,565)
Balance, end of year $ 13,404,084 $ 429,594 $ 13,833,678 The accompanying notes are an integral part of these financial statements.
22
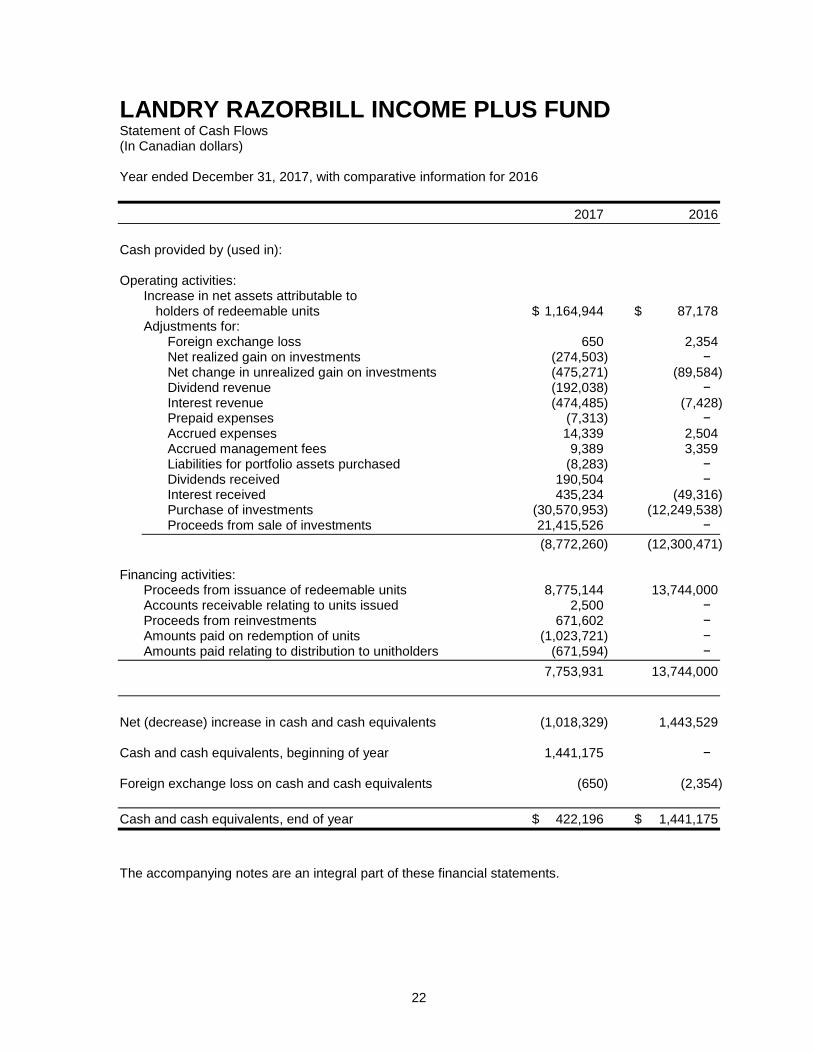
LANDRY RAZORBILL INCOME PLUS FUND Statement of Cash Flows (In Canadian dollars) Year ended December 31, 2017, with comparative information for 2016 2017 2016 Cash provided by (used in): Operating activities:
Increase in net assets attributable to holders of redeemable units $ 1,164,944 $ 87,178
Adjustments for: Foreign exchange loss 650 2,354 Net realized gain on investments (274,503) − Net change in unrealized gain on investments (475,271) (89,584) Dividend revenue (192,038) − Interest revenue (474,485) (7,428) Prepaid expenses (7,313) − Accrued expenses 14,339 2,504 Accrued management fees 9,389 3,359 Liabilities for portfolio assets purchased (8,283) − Dividends received 190,504 − Interest received 435,234 (49,316) Purchase of investments (30,570,953) (12,249,538) Proceeds from sale of investments 21,415,526 −
(8,772,260) (12,300,471) Financing activities:
Proceeds from issuance of redeemable units 8,775,144 13,744,000 Accounts receivable relating to units issued 2,500 − Proceeds from reinvestments 671,602 − Amounts paid on redemption of units (1,023,721) − Amounts paid relating to distribution to unitholders (671,594) −
7,753,931 13,744,000 Net (decrease) increase in cash and cash equivalents (1,018,329) 1,443,529 Cash and cash equivalents, beginning of year 1,441,175 − Foreign exchange loss on cash and cash equivalents (650) (2,354) Cash and cash equivalents, end of year $ 422,196 $ 1,441,175 The accompanying notes are an integral part of these financial statements.

23
LANDRY RAZORBILL INCOME PLUS FUND Schedule of Investment Portfolio (In Canadian dollars) December 31, 2017 Average Fair Shares/units Security cost value
Canadian bonds (93.1%)
Canadian bonds (21.2%) 200,000 AltaLink L.P., Callable, 4.09%, 2045/06/30 $ 208,200 $ 220,576 250,000 bcIMC Realty Corp., Callable, 3.00% 2027/03/31 250,000 249,813 250,000 Brookfield Infrastructure Finance ULC, Callable, 3.32%
2024/02/22 250,000 248,045 300,000 CI Financial Corp., Callable, 3.90%, 2027/09/27 300,000 305,787 250,000 Fairfax Financial Holdings Ltd., Callable, 4.70%
2026/12/16 249,780 258,188 300,000 Hydro One Inc., Callable, 7.35%, 2030/06/03 420,534 424,002 300,000 Metro Inc., Callable, 3.39%, 2027/12/06 299,823 297,645 500,000 Nova Scotia Power Inc., Series '3', Callable, 9.75%
2019/08/02 580,035 553,160 100,000 Parkland Fuel Corp., Callable, Restricted, 5.63%,
2025/05/09 100,000 100,400 400,000 RioCan REIT, 2.19%, 2020/08/26 397,160 395,996 500,000 Royal Bank of Canada, 1.40%, 2019/04/26 500,700 496,990 300,000 TMX Group Ltd., Series 'D', Callable, 3.00%, 2024/12/11 300,000 297,267 300,000 Toronto-Dominion Bank (The), Series 'CBL14', 1.68%,
2021/06/08 493,885 490,315 300,000 TransCanada PipeLines Ltd., 7.31%, 2027/01/15 382,179 389,052 100,000 Videotron Ltd., Restricted, Callable, 5.63%, 2025/06/15 108,375 106,626 4,840,671 4,833,862
Provincial bonds & guarantees (29.8%) 600,000 Province of Alberta, 3.5%, 2031/06/01 619,620 642,444 500,000 Province of British Columbia, 2.70%, 2022/12/18 513,779 511,394 200,000 Province of Manitoba, 2.60%, 2027/06/02 199,076 198,492 400,000 Province of New Brunswick, 5.65%, 2028/12/27 498,600 504,208 2,300,000 Province of Ontario, 1.35%, 2022/03/08 2,255,613 2,224,997 500,000 Province of Quebec, 4.50%, 2018/12/01 532,600 513,210 500,000 Province of Quebec, 4.50%, 2020/12/01 555,870 535,595 1,025,000 Province of Quebec, 2.50%, 2026/09/01 1,029,067 1,020,070 600,000 Province of Saskatchewan, 3.20%, 2024/06/03 634,800 627,654 6,839,025 6,778,064
Federal bonds & guarantees (8.2%) 280,000 Government of Canada, 2.75%, 2022/06/01 292,320 290,814 5,000 Government of Canada, 2.50%, 2024/06/01 5,238 5,165 850,000 Government of Canada, 1.00%, 2027/06/01 772,360 774,196 325,000 Government of Canada, 5.00%, 2037/06/01 473,379 466,336 300,000 Government of Canada, 2.75%, 2048/12/01 330,739 332,028 1,874,036 1,868,539
Municipal bonds (15.7%) 500,000 City of Montreal, 4.10%, 2034/12/01 538,575 564,700 500,000 City of Sherbrooke, 2.15%, 2021/12/13 494,975 492,170 400,000 City of Toronto, 2.95%, 2035/04/28 364,400 395,012 300,000 City of Toronto, 3.50%, 2036/06/02 314,490 316,389 500,000 Municipal Finance Authority of British Columbia, 4.95%
2027/12/01 604,235 590,615 200,000 Ville de Gatineau, 3.60%, 2021/09/14 210,900 207,560 500,000 Ville de Longueuil, 1.60%, 2019/07/13 496,375 495,535 500,000 Ville de Saint-Eustache, 1.95%, 2020/12/20 495,720 493,040 3,519,670 3,555,021
Balance carried forward 17,073,402 17,035,486

24
LANDRY RAZORBILL INCOME PLUS FUND Schedule of Investment Portfolio (continued) (In Canadian dollars) December 31, 2017 Average Fair Shares/units Security cost value
Balance brought forward $ 17,073,402 $ 17,035,486 Financial Services (6.6%) 12,050 Brookfield Asset Management Inc., Preferred, Class'A',
Series '28', Variable Rate, Convertible Perpetual 183,102 211,598 4,300 Great-West Lifeco Inc., Preferred, Series 'N',
Variable Rate, Perpetual 291,280 370,041 3,565 Intact Financial Corp., Preferred, Series '1',
Variable Rate, Convertible, Perpetual 310,710 363,150 5,550 Manulife Financial Corp., Preferred, Series '3',
Variable Rate, Convertible, Perpetual 216,388 273,000 3,490 Sun Life Financial Inc., Preferred, Class 'A', Series '8R',
Variable Rate, Perpetual 240,039 287,196 1,241,519 1,504,985 Energy (3.3%)
10,600 AltaGas Ltd., Preferred, Series 'A', Variable Rate, Convertible, Perpetual 188,682 223,660
4,750 Enbridge Inc., Preferred, Series 'J', Variable Rate Perpetual 139,557 142,182 3,490 Enbridge Inc., Preferred, Series 'L', Variable Rate, Perpetual 102,068 104,597 10,000 Pembina Pipeline Corp., Preferred, Series '1',
Variable Rate, Perpetual 186,919 217,800 2,300 Valener Inc., Preferred, Series 'A', Variable Rate,
Convertible, Perpetual 49,761 57,546 666,987 745,785 Utilities (5.7%) 34,900 CU Inc., 3.80%, Preferred, Series '4', Convertible, Perpetual 501,132 573,756 400 Emera Inc., Preferred, Series 'A', Variable Rate,
Convertible, Perpetual 6,225 7,368 22,400 Fortis Inc., 4.25%, Preferred, Series 'H', Perpetual 324,020 404,096 16,400 Northland Power Inc., Preferred, Series '1', Variable Rate
Perpetual 308,980 315,044
1,140,357 1,300,264 Telecommunications services (2.7%) 25,000 BCE Inc., Preferred, Series 'AK', Variable Rate, Convertible, Perpetual 393,159 463,750 8,800 Shaw Communications Inc., Preferred, Series 'A', Variable Rate, Perpetual 132,234 154,792 525,393 618,542
Balance carried forward 20,647,658 21,205,062

25
LANDRY RAZORBILL INCOME PLUS FUND Schedule of Investment Portfolio (continued) (In Canadian dollars) December 31, 2017
Average Fair Shares/units Security cost value
Balance brought forward $ 20,647,658 $ 21,205,062 U.S.Bonds (0.0%) Corporate Bonds (4.6%) 200,000 Anheuser-Busch InBev Finance Inc., Callable,
4.32%, 2047/05/15 200,000 211,766 300,000 AT&T Inc., Callable, 2.85%, 2024/05/25 299,982 291,426 250,000 AT&T Inc., Callable, Restricted, 4.85%, 2047/05/25 248,398 251,870 300,000 Wells Fargo & Co., 2.51%, 2023/10/27 292,209 292,482 1,040,589 1,047,544 Transaction costs (496) – Total investment portfolio (97.8%) $ 21,687,751 22,252,606 Cash and cash equivalents (1.9%) 422,196 Other assets less liabilities (0.3%) 75,251
Net assets attributable to holders of redeemable units at fair value (100.0%) 21,687,751 $ 22,750,053
The accompanying notes are an integral part of these financial statements.

26
LANDRY RAZORBILL INCOME PLUS FUND Fair Value of Financial Instruments (In Canadian dollars) The following is a summary of the inputs used as of December 31, 2017 and 2016 in valuing the fund's investments carried at fair value: 2017 2016 Level 2 Level 2
units that units that are valued are valued based on based on inputs other inputs other than quoted than quoted prices that are prices that are Level 1 observable, Level 1 observable, quoted prices either directly quoted prices either directly in active as prices or in active as prices or markets for indirectly as markets for indirectly as identical derived from identical derived from assets prices assets prices
Investments:
Preferred equities $ 4,169,576 $ − $ 3,160,673 $ − Bonds − 18,083,030 − 9,186,732
Total investments $ 4,169,576 $18,083,030 $ 3,160,673 $ 9,186,732
There were no significant transfers made between Levels 1 and 2 as a result of changes in the availability of quoted market prices or observable market inputs during the year presented. In addition, there were no investments or transactions classified in Level 3 for the years ended December 31, 2017 and 2016. The accompanying notes are an integral part of these financial statements.
27
LANDRY PRIVATE FUNDS Notes to Financial Statements Year ended December 31, 2017
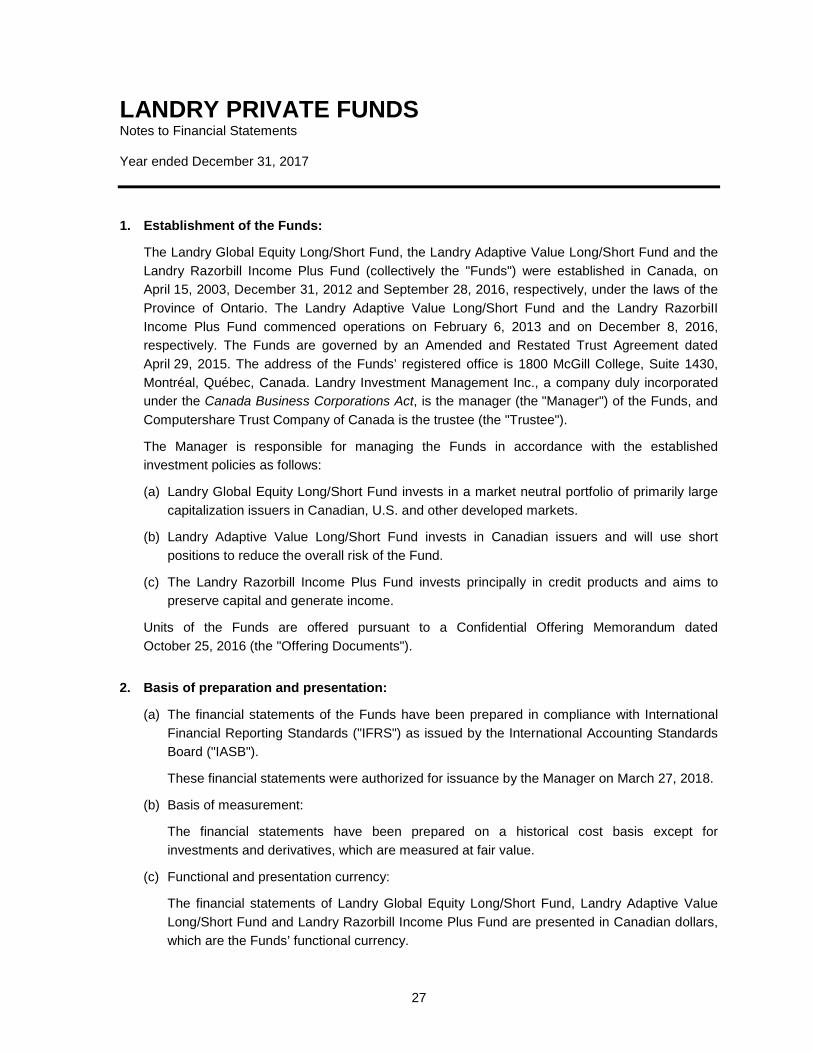
1. Establishment of the Funds:
The Landry Global Equity Long/Short Fund, the Landry Adaptive Value Long/Short Fund and the Landry Razorbill Income Plus Fund (collectively the "Funds") were established in Canada, on April 15, 2003, December 31, 2012 and September 28, 2016, respectively, under the laws of the Province of Ontario. The Landry Adaptive Value Long/Short Fund and the Landry RazorbiII Income Plus Fund commenced operations on February 6, 2013 and on December 8, 2016, respectively. The Funds are governed by an Amended and Restated Trust Agreement dated April 29, 2015. The address of the Funds’ registered office is 1800 McGill College, Suite 1430, Montréal, Québec, Canada. Landry Investment Management Inc., a company duly incorporated under the Canada Business Corporations Act, is the manager (the "Manager") of the Funds, and Computershare Trust Company of Canada is the trustee (the "Trustee").
The Manager is responsible for managing the Funds in accordance with the established investment policies as follows:
(a) Landry Global Equity Long/Short Fund invests in a market neutral portfolio of primarily large capitalization issuers in Canadian, U.S. and other developed markets.
(b) Landry Adaptive Value Long/Short Fund invests in Canadian issuers and will use short positions to reduce the overall risk of the Fund.
(c) The Landry Razorbill Income Plus Fund invests principally in credit products and aims to preserve capital and generate income.
Units of the Funds are offered pursuant to a Confidential Offering Memorandum dated October 25, 2016 (the "Offering Documents").
2. Basis of preparation and presentation:
(a) The financial statements of the Funds have been prepared in compliance with International Financial Reporting Standards ("IFRS") as issued by the International Accounting Standards Board ("IASB").
These financial statements were authorized for issuance by the Manager on March 27, 2018.
(b) Basis of measurement:
The financial statements have been prepared on a historical cost basis except for investments and derivatives, which are measured at fair value.
(c) Functional and presentation currency:
The financial statements of Landry Global Equity Long/Short Fund, Landry Adaptive Value Long/Short Fund and Landry Razorbill Income Plus Fund are presented in Canadian dollars, which are the Funds’ functional currency.

LANDRY PRIVATE FUNDS Notes to Financial Statements (continued) Year ended December 31, 2017
28
3. Significant accounting policies:
The accounting policies set out below have been applied consistently to all periods presented in these financial statements.
(a) Financial instruments:
(i) Recognition:
Financial assets and financial liabilities at fair value through profit or loss ("FVTPL") are initially recognized on the trade date, which is the date on which the Fund becomes a party to the contractual provisions of the instrument. Other financial assets and financial liabilities are recognized on the date on which they are originated.
Financial assets and financial liabilities at FVTPL are initially recognized at fair value, with transaction costs recognized as expenses in the statement of comprehensive income. Financial assets or financial liabilities not at FVTPL are initially recognized at fair value plus transaction costs that are directly attributable to their acquisition or issue.
Investments are classified at FVTPL, including certain investments in debt instruments, which have been designated at FVTPL. Derivatives are classified as held-for-trading.
Redeemable units are designated as financial liabilities at FVTPL and measured at redemption amount.
All other financial assets and liabilities are measured at amortized cost, which approximates their fair market values. Financial assets and liabilities are shown at the amount required to be received or paid and discounted when appropriate, at the contract’s effective interest rate. Fair value of investments and derivatives are measured using the same accounting policies as those used to measure the net asset value attributable to holders of redeemable units ("NAV") in transactions with unitholders.
(ii) Fair value measurement:
For financial reporting purposes, investments are valued at their fair value. Investments held that are traded in an active market through recognized public stock exchanges, over-the-counter markets, or through recognized investment dealers are valued at their last traded market price where the last traded market price falls within the day’s bid-ask spread. In circumstances, where the last traded price is not within that day’s bid-ask spread, the Manager determines the point within the bid-ask spread that is most representative of fair value based on specific facts and circumstances. Investments held include equities, exchange traded funds and bonds. The Funds’ policy is to recognize transfers into and out of their fair value hierarchy levels as of the date of the event or change in circumstances giving rise to the transfer.

LANDRY PRIVATE FUNDS Notes to Financial Statements (continued) Year ended December 31, 2017
29
3. Significant accounting policies (continued):
(a) Financial instruments (continued):
(ii) Fair value measurement (continued):
Investments held that are not traded in an active market are valued based on the results of valuation techniques - using observable market inputs where possible, on such basis and in such manner established by the Manager. Investments in other pooled funds are valued at the net asset value per unit reported by each pooled fund. See Note 4 for more information about the Funds’ fair value measurements.
(iii) Impairments of financial assets:
At each reporting date, the Funds assess whether there is objective evidence that financial assets at amortized cost are impaired. If such evidence exists, the Funds recognize an impairment loss as the difference between the amortized cost of the financial asset and the present value of the estimated future cash flows, discounted using the instrument’s original effective interest rate. Impairment losses on financial assets at amortized cost are reversed in subsequent periods if the amount of the loss decreases and the decrease can be related objectively to an event occurring after the impairment was recognized.
(b) Investment income:
Interest income is recognized on an accrual basis using the effective interest method. Dividend income is recognized on the date that the right to receive payment is established, which for quoted equity securities is usually the ex-dividend date. Portfolio transactions are recorded on the trade date. Realized gains and losses from investment transactions are calculated on an average cost basis. The variation in the market value of investments less their average cost, as recorded at the beginning of the period and at the end of the period, is included in the statement of comprehensive income as a net unrealized gain (loss) on investments.
(c) Foreign currency:
Investments and other assets and liabilities denominated in foreign currencies are translated into Canadian dollars at the exchange rates prevailing on the valuation date. Investment transactions, income and expenses are translated at the exchange rates prevailing on the respective dates of such transactions.
(d) Cash:
Cash and cash equivalents consist of cash and investments in Government of Canada Treasury bills with maturities of less than 90 days. These short-term investments are recorded at amortized cost, which approximates current market value.

LANDRY PRIVATE FUNDS Notes to Financial Statements (continued) Year ended December 31, 2017
30
3. Significant accounting policies (continued):
(e) Increase (decrease) in net assets attributable to holders of redeemable units per unit, per class:
Increase (decrease) in net assets attributable to holders of redeemable units per unit, per class in the statement of comprehensive income is calculated by dividing the increase (decrease) in net assets attributable to holders of redeemable units by the weighted average number of units outstanding per class during the period.
(f) Unitholder transactions:
The value at which units are issued or redeemed is determined by dividing the NAV attributable to holders of redeemable units of the class by the total number of units outstanding of that class on the valuation date. The valuation date is any day that the Toronto Stock Exchange is open for business. Amounts received on the issuance of units and amounts paid on the redemption of units are included in the statement of changes in net assets attributable to holders of redeemable units.
(g) Redeemable units:
The Funds classify redeemable units issued as financial liabilities or equity instruments in accordance with the substance of the contractual terms of the instruments. All units of all classes of the Funds have been classified as financial liabilities at FVTPL and are measured at redemption amount.
(h) Net asset value attributable to holders of redeemable units per unit:
A separate NAV is calculated for each class of units of each Fund by taking the class’ proportionate share of the Funds’ common assets less that class’ proportionate share of the Funds’ common liabilities and deducting from this amount all liabilities that relate solely to a specific class. The NAV per unit for each class is determined by dividing the NAV of each class by the number of units of that class outstanding on the valuation date.
(i) Transaction costs:
For financial instruments classified as FVTPL, transaction costs, such as brokerage commissions incurred in the purchase and sale of portfolio securities, and other trade execution costs paid to external third parties, such as stamp, duty and exchange fees, are recognized as expenses in the statement of comprehensive income based on the trade date.

LANDRY PRIVATE FUNDS Notes to Financial Statements (continued) Year ended December 31, 2017
31
3. Significant accounting policies (continued):
(j) New standards and interpretations not yet adopted:
A number of new standards, amendments to standards and interpretations are not yet effective for the year ended December 31, 2017, and have not been applied in preparing these financial statements. None of these will have a significant effect on the financial statement of the Funds, with the possible exception of IFRS 9, Financial Instruments.
The IFRS 9 deals with recognition, derecognition, classification and measurement of financial instruments and its requirements, and represents a significant change from the existing requirements in IAS 39, Financial Instruments: Recognition and Measurement, in respect of financial assets. The standard contains two primary measurement categories for financial assets: amortized cost and fair value. A financial asset would be measured at amortized cost if it is held within a business model whose objective is to hold assets in order to collect contractual cash flows, and the asset’s contractual terms give rise on specified dates to cash flows that are solely payments of principal and interest on the principal outstanding. All other financial assets would be measured at fair value. The standard eliminates the existing IAS 39 categories of held-to-maturity, available-for-sale and loans and receivables.
The effective date of this standard is for annual periods beginning on or after January 1, 2018, but early adoption ispermitted. The Funds’ Manager is currently in the process of evaluating the potential effect of this standard. The standard is not expected to have a significant impact on the financial statements since the Funds’ financial assets are currently measured at fair value or amortized cost.
4. Critical accounting estimates and judgments:
The preparation of financial statements requires management to use judgment in applying its accounting policies and to make estimates and assumptions about the future. The following discusses the most significant accounting judgments and estimates that the Funds have made in preparing the financial statements:
Fair value measurement of derivatives and securities not quoted in an active market
The Funds hold financial instruments that are not quoted in active markets, including derivatives. Fair values of such instruments are determined using valuation techniques and may be determined using reputable pricing sources. Broker quotes obtained from the pricing sources may be indicative and not executable. Where no market data is available, the Funds may value positions using its own models, which are usually based on valuation methods and techniques generally recognized as standard within the industry. The models used to determine fair values are validated and periodically reviewed by the Manager, independent of the party that created them. The models used for private equity securities are based mainly on earnings multiples adjusted for a lack of marketability as appropriate.
LANDRY PRIVATE FUNDS Notes to Financial Statements (continued) Year ended December 31, 2017
32
4. Critical accounting estimates and judgments (continued):
Fair value measurement of derivatives and securities not quoted in an active market (continued)
Models use observable data, to the extent practicable. However, areas such as credit risk, volatilities and correlations require the Manager to make estimates. Changes in assumptions about these factors could affect the reported fair values of financial instruments. The Funds consider observable data to be market data that is readily available, regularly distributed and updated, reliable and verifiable, not proprietary, and provided by independent sources that are actively involved in the relevant market. See Note 6 for more information on the fair value measurement of the Funds’ financial statements.
Classification and measurement of investments and application of the fair value option
In classifying and measuring financial instruments held by the Funds, the Manager is required to make significant judgments about whether or not the business of the Funds are to invest on a total return basis for the purpose of applying the fair value option for financial assets under IAS 39, Financial Instruments - Recognition and Measurement ("IAS 39"). The most significant judgments made include the determination that certain investments are held-for-trading and that the fair value option can be applied to those that are not.
5. Financial instruments and risk management:
(a) Risk management:
The Funds' investment activities expose them to a variety of financial risks. The Manager seeks to minimize potential adverse effects of these risks for the Funds' performance by employing professional and experienced portfolio advisors, by daily monitoring of the Funds' positions and market events, by diversifying their investment portfolio within the constraints of the investment objective, and periodically may use derivatives to hedge certain risk exposures. To assist in managing risks, the Manager maintains a governance structure that oversees the Funds' investment activities and monitors compliance with the Funds' stated investment strategy, internal guidelines and securities regulations.
Landry Global Equity Long/Short Fund's investment objective is to seek long-term capital growth by investing directly or indirectly in exchange-listed equity securities of Canadian, United States or other developed market issuers. Landry Adaptive Value Long/Short Fund's investment objective is to seek long-term capital appreciation by investing mostly in equity of Canadian issuers and will use short positions to reduce overall risk of the Fund. Landry Razorbill Income Plus Fund’s investment objective is to preserve capital while generating income by investing mainly in credit instruments.
No changes affecting the overall level of risk of the Funds were made during the year. The risks of the Funds remain, as discussed in the Funds' Offering Documents, significant risks that are relevant to the Funds are discussed below.

LANDRY PRIVATE FUNDS Notes to Financial Statements (continued) Year ended December 31, 2017
33
5. Financial instruments and risk management (continued):
(a) Risk management (continued):
The investment manager monitors on a daily basis the concentration of risk for equity. For the Landry Global Equity Long/Short Fund, it is based on counterparties, industries and geographic location. For the Landry Adaptive Value Long/Short Fund it is based on counterparties and industries. For the Landry Razorbill Income Plus Fund, it is based on the creditworthiness of bonds and preferred shares and industries.
As at December 31, 2017, the Landry Global Equity Long/Short Fund’s investments were concentrated in the following geographic locations, on a net position basis, as a percentage of net assets attributable to holders of redeemable units:
2017 2016 % % Japan 9.7 11.9 United Kingdom 9.6 9.6 France 4.7 6.9 Germany 7.0 6.9 Austria 5.5 3.9 United States of America (49.9) 3.0 Australia 4.4 2.2 Switzerland 0.4 1.8 Ireland 1.4 1.2 Italy 0.9 1.0 China − 0.9 Spain 0.8 0.4 Netherland 0.9 0.4 Norway − 0.3 Sweden − 0.3 Russia − 0.3 Luxembourg 0.2 − Belgium 0.2 − Bermuda 0.3 − Canada 13.3 (0.4) EAFE (Geographically diversified ETF) − (44.5) Total, as a percentage of net assets attributable
to holders of redeemable units 9.4 5.9

LANDRY PRIVATE FUNDS Notes to Financial Statements (continued) Year ended December 31, 2017
34
5. Financial instruments and risk management (continued):
(a) Risk management (continued):
As at December 31, 2017 and 2016, the Landry Adaptive Value Long/Short Fund’s investments were concentrated in the following industries, on a net position basis, as a percentage of net assets attributable to holders of redeemable units: 2017 2016 % % Financial services 32.7 34.2 Energy 18.9 25.9 Industrials 12.5 12.5 Materials 13.8 10.7 Information technology 6.8 6.6 Consumer discretionary 9.4 3.0 Consumer staples 2.8 2.6 Mutual fund corporation and trust 2.9 2.5 Utilities 1.0 1.1 Telecommunication services 1.9 − Health care 0.9 − Exchange traded funds (33.1) (28.4) 70.5 70.7
As at December 31, 2017, the Landry Razorbill Income Plus Fund’s investments were concentrated in the following industries as a percentage of net assets attributable to holders of redeemable units:
2017 2016 % % Canadian corporate bonds 21.2 29.2 Provincial government & guarantees 29.8 20.6 Federal bonds & guarantees 8.2 8.9 Financial services 6.6 8.7 Municipal bonds 15.7 7.8 Energy 3.3 7.0 Utilities 5.7 3.6 Telecommunication services 2.7 3.5 US Corporate bonds 4.6 − 97.8 89.3

LANDRY PRIVATE FUNDS Notes to Financial Statements (continued) Year ended December 31, 2017
35
5. Financial instruments and risk management (continued):
(b) Other market price risk:
Market price risk is the risk that the value of financial instruments will fluctuate as a result of changes in market prices (other than those arising from interest rate risk or currency risk), whether caused by factors specific to an individual investment, its issuer, or all factors affecting all instruments traded in a market or market segment. All securities present a risk of loss of capital.
The Funds’ strategy for the management of market risk is driven by the Funds’ investment objective. Depending on each Fund’s risk rating, the Funds will invest in a diversified portfolio of investments with more or less volatility. The market risk is monitored on a daily basis.
Because the Landry Global Equity Long/Short Fund is dollar neutral most of the time (approximately equal amount invested in long positions and short positions in each market it invests), it has shown low correlation with overall equity markets. If equity prices on global stock exchanges had increased or decreased by 10% as at year-end, with all other factors remaining constant, net assets attributable to holders of redeemable units of the Funds could possibly have increased or decreased by the amount shown in the table below: Impact on net assets attributable to holders of redeemable units (In thousands of CDN dollars)* Fund Reference index 2017 2016 Landry Global Equity
Long/Short Fund S&P500 Total Return Index $ 176 $ 607 Landry Adaptive Value S&P/TSX Composite Index
Long/Short Fund Total Return 423 6 Landry Razorbill Income FTSE/TMX Universe Index
Plus Fund 11,300 −
* This estimate is based on the Funds’ historical beta as calculated during the interval between January 1 to December 31 of each year for the Landry Global Equity Long/Short Fund and the Landry Adaptive Value Long/Short Value with its respective reference index (using last prices during the period).
Given that the Landry Razorbill Income Plus Fund only started in late 2016, not enough data was available to be able to determine a reliable beta for the purpose of this exercise.
In practice, actual results may differ from this sensitivity analysis and the difference could be material. The monetary impact on the increase (decrease) in net assets attributable to holders of redeemable units from operations of the Landry Global Equity Long/Short Fund would be similar.

LANDRY PRIVATE FUNDS Notes to Financial Statements (continued) Year ended December 31, 2017
36
5. Financial instruments and risk management (continued):
(c) Currency risk:
Currency risk is the risk that financial instruments, which are denominated in currencies other than the reporting currency of the Funds, will fluctuate due to changes in exchange rates. As at December 31, 2017 and 2016, the Landry Global Equity Long/Short Fund had currency exposure while the Landry Adaptive Value Long/Short Fund and the Landry Razorbill Income Plus Fund did not.
Consequently, the Landry Global Equity Long/Short Fund is exposed to the risk that the exchange rate of its currency relative to other foreign currencies may change in a manner that has an adverse effect on the fair value of the future cash flows of the Fund. The Fund’s policy with respect to managing its currency risk is to limit its net foreign currency exposure to less than 15% of the Fund’s net assets attributable to holders of redeemable units. The Fund’s currency risk is managed on a daily basis by the investment manager in accordance with policies and procedures in place.
The following tables illustrate the effect on net asset attributable to holders of redeemable units if the respective currency had strengthened or weakened by 5% in relation to all other currencies, with all other variables held constant. In practice, actual results may differ from this sensitivity analysis and the difference could be material. The monetary impact on the increase (decrease) in net assets attributable to holders of redeemable units from operations of the Fund would be similar.
Landry Global Equity Long/Short Fund (in Canadian dollars):
December 31, 2017: Sensitivity impact on net assets attributable to Net holders of Currency Investments Cash exposure redeemable units
AUD $ 496,357 $ 28,798 $ 525,155 $ 26,258 CHF 44,358 256,417 300,775 45,039 DKK − 13,536 13,536 677 EUR 2,388,240 (708,090) 1,680,150 84,007 GBP 1,229,442 (175,154) 1,054,288 52,714 HKD − 80,909 80,909 4,045 JPY − (221,899) (221,899) (11,095) NOK − 16,369 16,369 818 SEK − 154,142 154,142 7,707 USD (5,534,365) 157,466 (5,376,899) (268,844)

LANDRY PRIVATE FUNDS Notes to Financial Statements (continued) Year ended December 31, 2017
37
5. Financial instruments and risk management (continued):
(c) Currency risk (continued):
Landry Global Equity Long/Short Fund (in Canadian dollars) (continued):
December 31, 2016: Sensitivity impact on net assets attributable to Net holders of Currency Investments Cash exposure redeemable units
AUD $ 423,246 $ (367,993) $ 55,253 $ 2,763 CHF 38,027 119,375 157,402 7,870 DKK − 12,775 12,775 639 EUR 3,196,068 (2,157,346) 1,038,722 51,936 GBP 1,254,335 (894,985) 359,350 17,968 HKD − 87,393 87,393 4,370 JPY 1,008,672 (550,655) 458,017 22,901 NOK 36,008 (21,531) 14,477 724 SEK 32,380 113,686 146,066 7,303 USD (6,378,374) 727,212 (5,651,162) (282,558)
(d) Interest rate risk:
Interest rate risk arises on interest-bearing financial instruments, such as bonds or debentures. Interest rate risk is the risk that the fair value or future cash flows will fluctuate as a result of changes in market interest rate. The majority of the Landry Global Equity Long/Short Fund’s and the Landry Adaptive Value Long/Short Fund’s financial assets and liabilities are equity shares, which are non-interest bearing. When there are significant cash and cash equivalent balances, these Funds invest in Canada Treasury bills that have a maturity of less than 90 days. As such, they are not subject to significant amounts of risk due to fluctuations in prevailing levels of market interest rates.
Landry Razorbill Income Plus Fund is exposed to this risk mainly through its investments in bonds. To manage interest rate risk, the Fund aims to maintain a duration of the fixed income and cash portfolio between -five years and +two years compared to the duration of the benchmark (FTSE-TMX).

LANDRY PRIVATE FUNDS Notes to Financial Statements (continued) Year ended December 31, 2017
38
5. Financial instruments and risk management (continued):
(d) Interest rate risk (continued):
The internal procedures require the Manager to manage interest rate risk on a daily basis in accordance with the policies and procedures in place. After having estimated the modified duration for each securities, the entire portfolio is looked at to ensure compliance with the above mentioned duration policy. If the interest rate risk is not in accordance with the investment policy or guidelines of the Fund, then the Manager is required to rebalance the portfolio as soon as possible.
A summary of the Fund’s interest rate gap position analyzed by the earlier of contractual re-pricing or maturity date, is as follows. Less than 1 to 3 3 to 5 5+ 2017 1 year years years years Total Bonds $ 513,210 $ 2,970,316 $ 4,217,250 $10,382,254 $18,038,030
The Manager has determined that a fluctuation in interest rates of 100 basis points is reasonably possible, considering the economic environment in which the Fund operates. The table below sets out the effect on the Fund’s net assets attributable to holders of redeemable units of a reasonably possible increase or reduction of 100 basis points in interest rates at December 31, 2017. The impact of such an increase or reduction has been estimated by calculating the fair value changes of the bonds. This analysis assumes that all other variables remain constant. The monetary impact on the increase (decrease) in net assets attributable to holders of redeemable units from operations of the Fund would be similar. Net assets attributable to holders of redeemable units $ 8,527,060

LANDRY PRIVATE FUNDS Notes to Financial Statements (continued) Year ended December 31, 2017
39
5. Financial instruments and risk management (continued):
(e) Credit risk:
Credit risk on financial instruments is the risk of a financial loss occurring as a result of the default of a counterparty on its obligation to the Funds. Credit risk typically arises out of exposure to debt instruments, such as bonds or derivatives. As at December 31, 2017 and 2016, the Landry Global Equity Long/Short Fund and the Landry Adaptive Value Long/Short Fund had no significant investments in debt instruments. The Landry Razorbill Income Plus Fund had investments in bonds with the following credit quality, as at December 31, 2017: Rating:
AAA $ 3,957,854 17.40% AA 4,222,442 18.56% A 5,711,073 25.10% BBB 2,296,330 10.09% Below BBB (0) 207,026 0.91% Not rated 1,688,305 7.42%
Total $18,083,030 79.49%
Credit and counterparty risk is managed by dealing with counterparties the Manager believes to be creditworthy. As at December 31, 2017 and 2016, the Funds’ amounts receivable to portfolio assets sold at year-end were concentrated only among a few brokers, which credit risk is considered small due to short settlement period involved and their high credit quality.
(f) Liquidity risk:
Liquidity risk is the risk that the Funds will encounter difficulty in meeting obligations associated with financial liabilities. The Funds’ exposure to liquidity risk is equal to the carrying amount of liabilities. Aside from financial liabilities that arise from its normal investing activities, the Funds have no other significant financial liabilities.
The Funds' most significant potential exposure to financial liabilities is the daily cash redemptions of redeemable units. The Funds liquidity risk is managed on a daily basis by the investment manager. The policies of the Funds regarding liquid assets are in accordance with securities regulations. The Funds are subject to restrictions concerning illiquid assets. Per the regulation, a Fund must not purchase an illiquid asset if, immediately after the purchase, more than 10% of its net asset value would be made of illiquid assets. A Fund must also not have invested, for a period of 90 days or more, more than 15% of its net asset value in illiquid assets. The Funds’ investments in listed entities are considered to be readily realisable because they are traded on major stock exchange markets.

LANDRY PRIVATE FUNDS Notes to Financial Statements (continued) Year ended December 31, 2017
40
6. Fair value measurement:
The Funds classify fair value measurements within a hierarchy which gives the highest priority to unadjusted quoted prices in active markets for identical assets or liabilities (Level 1) and the lowest priority to unobservable inputs (Level 3). The three levels of the fair value hierarchy are as follows:
Level 1: Fair value based on unadjusted quoted prices in active markets for identical assets or liabilities that the Manager has the ability to access at the measurement date.
Level 2: Inputs other than quoted prices that are observable for the asset or liability either directly or indirectly, including inputs in markets that are not considered to be active.
Level 3: Inputs based on at least one significant non-observable input that is not supported by market data. There is little, if any, market activity. Inputs into the determination of fair value require significant management judgment or estimation.
If inputs of different levels are used to measure an asset’s or liability’s fair value, the classification within the hierarchy is based on the lowest level input that is significant to the fair value measurement. The fair value hierarchy table, in the section "Fair Value of Financial Instruments" of the respective Funds, presents information about the Funds’ assets and liabilities measured at fair value within the fair value hierarchy as at December 31, 2017 and 2016 at the end of each Funds’ schedule of investments.
7. Redeemable units:
The Funds classify financial instruments issued as financial liabilities or equity instruments in accordance with the substance of the contractual terms of the instruments.
A puttable financial instrument that includes a contractual obligation for the Funds to repurchase or redeem that instrument for cash or another financial asset is classified as equity if it meets all of the following conditions:
• it entitles the holder to a pro-rata share of the Funds’ net assets in the event of the Funds’ liquidation;
• it is in the class of instruments that is subordinate to all other classes of instruments;
• all financial instruments in the class of instruments that is subordinate to all other classes of instruments;
• have identical features;
• apart from the contractual obligation for the Funds to repurchase or redeem the instrument for cash or another financial asset, the instrument does not include any other features that would require classification as a liability; and

LANDRY PRIVATE FUNDS Notes to Financial Statements (continued) Year ended December 31, 2017
41
7. Redeemable units (continued):
• the total expected cash flows attributable to the instrument over its life are based substantially on the profit or loss, the change in the recognized net assets or the change in the fair value of the recognized and unrecognized net assets of the Funds over the life of the instrument.
The Funds' authorized capital consists of an unlimited number of redeemable units of each class without par value. The number of outstanding units of each class is disclosed in the statements of financial position. Units of the Funds are redeemable at the option of the holder in accordance with the provisions of the Trust Agreement. Classes A and F units are available to all investors. Classes H, I and J units are offered only to certain investors at the discretion of the Manager, including institutional investors or other eligible investors.
No class takes priority or preference over another and all classes contribute in proportion to the allocation of the Funds. All classes are the most subordinate classes of financial instruments issued by the Funds and, on liquidation of the Funds, they entitle the holders to the residual net assets. They rank pari passu in all respects. However, they do not have identical features. The redeemable shares provide investors with the right to require redemption for cash at a value proportionate to the investor’s share in the Funds’ net assets at each daily redemption date and also in the event of the Funds’ liquidation.
Since the Funds’ redeemable shares do not meet all of the above conditions to be classified as equity, they are classified as financial liabilities.
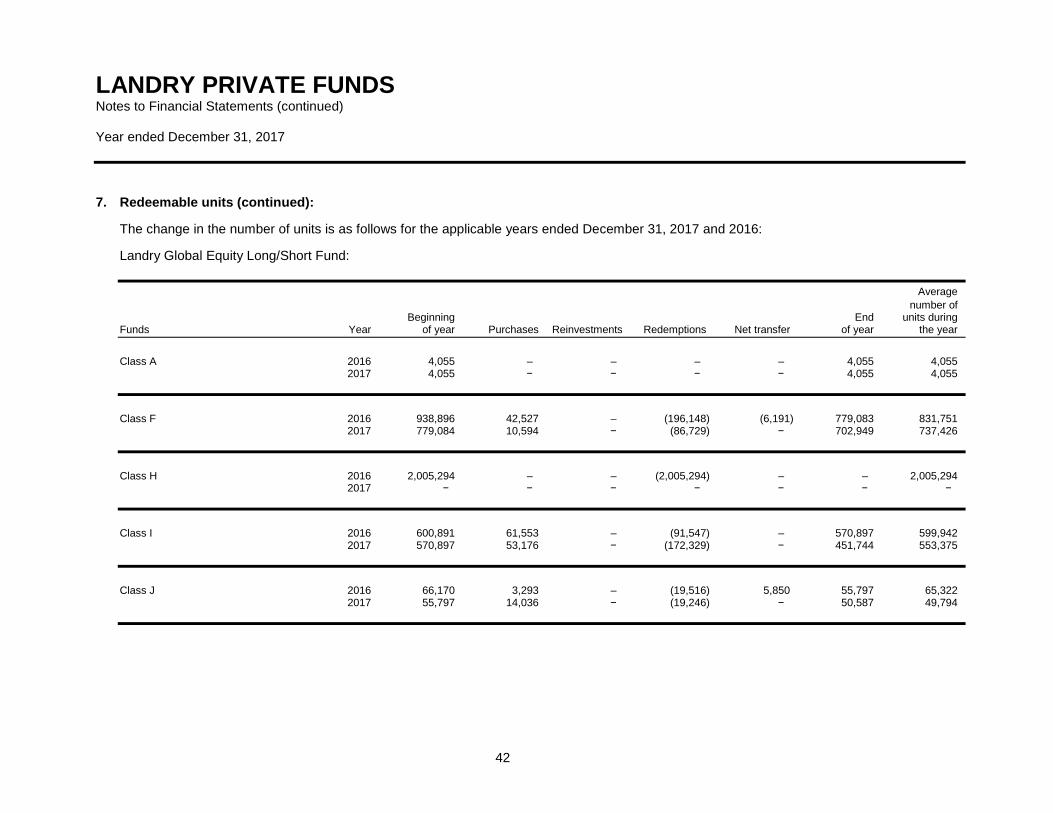
LANDRY PRIVATE FUNDS Notes to Financial Statements (continued) Year ended December 31, 2017
42
7. Redeemable units (continued):
The change in the number of units is as follows for the applicable years ended December 31, 2017 and 2016:
Landry Global Equity Long/Short Fund: Average number of Beginning End units during Funds Year of year Purchases Reinvestments Redemptions Net transfer of year the year
Class A 2016 4,055 – – – – 4,055 4,055 2017 4,055 − − − − 4,055 4,055
Class F 2016 938,896 42,527 – (196,148) (6,191) 779,083 831,751 2017 779,084 10,594 − (86,729) − 702,949 737,426
Class H 2016 2,005,294 – – (2,005,294) – – 2,005,294 2017 − − − − − − −
Class I 2016 600,891 61,553 – (91,547) – 570,897 599,942 2017 570,897 53,176 − (172,329) − 451,744 553,375
Class J 2016 66,170 3,293 – (19,516) 5,850 55,797 65,322 2017 55,797 14,036 − (19,246) − 50,587 49,794

LANDRY PRIVATE FUNDS Notes to Financial Statements (continued) Year ended December 31, 2017
43
7. Redeemable units (continued):
Landry Adaptive Value Long/Short Fund: Average number of Beginning End units during Funds Year of year Purchases Reinvestments Redemptions Net transfer of year the year
Class F 2016 358,694 4,367 – (19,066) – 343,995 347,862 2017 343,995 23,341 − (11,704) − 355,632 358,824
Class I 2016 51,329 9,240 – − – 60,569 57,524 2017 60,569 3,163 − − − 63,732 63,731
Landry Razorbill Income Plus Fund: Average number of Beginning End units during Funds Year of year Purchases Reinvestments Redemptions Net transfer of year the year
Class F 2016 – 1,335,314 – – – 1,335,314 504,219 2017 1,335,314 432,093 48,977 (68,152) − 1,748,232 1,636,723
Class G 2016 − − – − – − − 2017 − 236,612 9,035 − − 245,647 221,220
Class I 2016 − − – − − − − 2017 − 100,000 3,864 − − 103,864 100,025
Class J 2016 – 42,784 – – – 42,784 37,256 2017 42,784 94,191 3,348 (30,516) − 109,807 89,467

LANDRY PRIVATE FUNDS Notes to Financial Statements (continued) Year ended December 31, 2017
44
8. Expenses and brokerage commissions:
(a) Expenses:
As of December 31, 2017 and 2016, administrative fees are accrued daily, paid monthly, and calculated according to a fixed percentage of the NAV of the Funds. In 2016, the fees were established at 0.75% for the Landry Global Equity Long/Short and Landry Adaptive Long/Short Fund and at 0.50% for the Landry Razorbill Income Plus Fund. In 2017, the fees were established at 0.60% for the Landry Global Equity Long/Short and Landry Adaptive Long/Short Fund and at 0.40% for the Landry Razorbill Income Plus Fund.
The fees and expenses assumed by Landry Investment Management in exchange for the administrative fees include valuation and recordkeeping expenses and those related to the services of the transfer agent, including processing purchases and sales of the securities of the Funds and calculation of the price of the securities; legal fees and auditors’ fees; administrative fees and services of trustees; custodial fees; costs related to preparation and distribution of financial reports and other communications with investors that Landry Investment Management is obliged to prepare to comply with applicable laws; and the other fees and expenses that are not otherwise included in the management fees.
(b) Brokerage commissions:
Commissions paid to brokers in connection with portfolio transactions are disclosed in the Funds' statement of comprehensive income. Brokerage business is allocated based on which broker can deliver to the Funds the best results. Subject to these criteria, the Manager may allocate business to brokers that provide or pay for, in addition to transaction execution, order execution goods and services and database and software used in proprietary research. As at December 31, 2017 and 2016, the Manager had commission-sharing or "soft dollar" arrangements with certain brokers in which they paid for third-party services. The Landry Razorbill Income Plus Fund had no commission sharing arrangement. The following table outlines the transaction costs, including soft dollars incurred during the years: Goods and Commissions services paid by received by 2017 the Funds the Funds Landry Global Equity Long/Short Fund $ 30,300 $ 43,715 Landry Adaptive Value Long/Short Fund 14,124 20,376

LANDRY PRIVATE FUNDS Notes to Financial Statements (continued) Year ended December 31, 2017
45
8. Expenses and brokerage commissions (continued):
(b) Brokerage commissions (continued): Goods and Commissions services paid by received by 2016 the Funds the Funds Landry Global Equity Long/Short Fund $ 35,601 $ 27,717 Landry Adaptive Value Long/Short Fund 10,094 7,860
9. Distributions:
Unitholders are entitled to distributions at year-end. Net investment income and net capital gains realized on the Funds are reinvested in additional units of its own Fund or at the option of the unitholders, paid in cash. The distribution amounts are determined by the registrar and are allocated to the unitholders of the Funds.
Distributions paid in cash will be made in the Funds' reporting currency. Unless the unitholder provides written instructions to the registrar to receive distributions in cash, the amount of the distribution will automatically be reinvested in additional units of its own Fund. At the valuation date, each unitholder of the Funds is entitled to receive an amount equal to the Funds' net income for the year, divided by the number of units outstanding, and multiplied by the number of units held by the unitholder at fiscal year-end.
10. Income tax status:
Landry Global Equity Long/Short Fund and Landry Razorbill Income Plus Fund are mutual fund trusts under the Income Tax Act (Canada). The Funds are subject to federal and provincial taxes applicable on their assessed income, including taxable capital gains for the fiscal year, so far as those were not distributed to the unitholders. The Landry Adaptive Value Long/Short Fund is a unit trust. Unit trusts are subject to alternative minimum tax.

LANDRY PRIVATE FUNDS Notes to Financial Statements (continued) Year ended December 31, 2017
46
10. Income tax status (continued):
Tax loss carryforwards:
The Funds have accumulated realized capital losses/non-capital losses that are available for utilization against realized gains or net income for tax purposes in future years. Capital losses have no expiry date. Non-capital losses can be carried forward for up to 20 years. Total Non-capital losses by expiry date capital losses 2033 2034 2035 2036 2037
Landry Global
Equity Long/Short Fund $ 13,373,000 $ – $ 424,972 $ 2,786,986 $ 1,273,123 $ 130,884 Landry Adaptive
Value Long/Short Fund 309,004 1,983 83,850 32,188 – – Landry Razorbill
Income Plus Fund – – – – – –
11. Related party transactions:
(a) Management fees:
In consideration for management services and investment advice provided to the Funds, the Manager is entitled to a management fee.
The management fee for Landry Global Equity Long/Short Fund is 2% for Class A units and 1% for Class F units. The management fee for Landry Adaptive Value Long/Short Fund is 2.5% for Class A units and 1.5% for Class F units. For Landry Razorbill Income Plus Fund, the management fee is 0.70% for Class F units. It is calculated on a daily basis to the NAV of the Funds and payable monthly. No management fee is charged to Classes G, H, I and J units; instead a negotiated fee is paid by these unitholders to the Manager directly.
Refer to the statement of comprehensive income of each Fund for the management fee expenses as at December 31, 2017 and 2016 and to the statement of financial position of each Fund for the management fee payable balance as at December 31, 2017 and 2016.
(b) Performance fees:
The Manager receives a performance-based fee for the Funds. The Manager will charge a performance fee of 20% of the return of the Funds in excess of their benchmark return. The performance fee is payable only if the Funds have outperformed their benchmark since the last time a performance fee was paid. Performance fees are calculated daily and crystallized and paid monthly.

LANDRY PRIVATE FUNDS Notes to Financial Statements (continued) Year ended December 31, 2017
47
11. Related party transactions (continued):
(b) Performance fees (continued):
For the Landry Global Equity Long/Short Fund, the Manager will charge a negotiated performance fee for Class H units.
No performance fee will be charged for Class I units of the Landry Adaptive Value Long/Short Fund and for all classes of units of the Landry Razorbill Income Plus Fund.
For all other class of units, the Manager will charge a performance fee to the Landry Global Equity Long/Short Fund and the Landry Adaptive Value Long/Short Fund of 20% of the return of the class of units of these Funds in excess of their respective benchmark return.
For performance fee calculation purposes, the benchmarks of the Funds are as follows: Funds Index Landry Global Equity Long/Short Fund Higher of three-month Canada Treasury bills
or +2% for Class A and Class F; 2% for Class I; and three-month Canada Treasury bills plus 2% for Class J units
Landry Adaptive Value Long/Short Fund Three-month Canada Treasury bills +2% for Class F
Performance fees incurred by the Funds in 2017 and 2016 are presented in the statement of comprehensive income. There are no performance fees that remain payable as at December 31, 2017 and 2016.
(c) Other:
In the normal course of business, transactions between the Funds and officers of the Manager take place. At December 31, 2017 and 2016, the total percentages of net assets attributable to holders of redeemable units owned as a result of units held by key management personnel of the Manager of the Funds are as follows: 2017 2016 Landry Global Equity Long/Short Fund 4.36% 4.22% Landry Adaptive Value Long/Short Fund 9.79% 9.32% Landry Razorbill Income Plus Fund 5.14% 3.24%

LANDRY PRIVATE FUNDS Notes to Financial Statements (continued) Year ended December 31, 2017
48
12. Financial instruments by category:
Investments have been designated at FVTPL. Derivatives are being held-for-trading and cash and other receivables are carried at amortized cost. All of the Funds’ financial liabilities are carried at amortized cost, except investments sold short.
The following tables present the net gains (losses) on financial instruments by category for the years ended December 31, 2017 and 2016.
Landry Global Equity Long/Short Fund: 2017 2016 Financial assets and liabilities:
Designated at inception $ 1,026,338 $ (74,717)
Landry Adaptive Value Long/Short Fund: 2017 2016 Financial assets and liabilities at FVTPL:
Designated at inception $ 111,264 $ 629,798
Landry Razorbill Income Plus Fund: 2017 2016 Financial assets and liabilities at FVTPL:
Designated at inception $ 475,271 $ 89,584

LANDRY PRIVATE FUNDS Notes to Financial Statements (continued) Year ended December 31, 2017
49
13. Responsibility of the Trustee:
The Funds must indemnify and save harmless the Trustee, its affiliates or any director, officer, employee or agent of the Trustee from and against:
(a) all claims whatsoever (including legal fees, other costs, charges and expenses in connection therewith) brought, commenced or prosecuted against it for or in respect of any act, deed, matter or thing whatsoever made, done, acquiesced in or omitted in or about or in relation to the execution of the Trustee's and Manager's duties;
(b) all other costs, charges and expenses which sustain or incur in or about or in relation to the affairs of the Funds and the execution of the Trustee's and Manager's duties; and
(c) any personal liabilities of the Trustee incurred in connection with the failure of the Funds, or the Manager, on behalf of the Funds, to report, remit or withhold taxes, as required by the tax act or otherwise failing to comply with the tax act, so long as the Trustee has relied in good faith on the Manager in the performance of its duties hereunder and such personal liabilities have not been caused by the Trustee's bad faith, willful misconduct, gross negligence, reckless disregard of its duties or the breach by the Trustee of its standard of care.
This indemnification shall survive the resignation or removal of the Trustee or Manager and the termination of this Master Trust Agreement solely to the extent that such liabilities have been incurred in connection with taxation years occurring during the term of this Master Trust Agreement.
14. Comparative information:
Certain comparative information has been reclassified to conform to the presentation adopted in the current year.