Embed Size (px)
Citation preview

Technical Report UMTRI-96-37 April, 1998
Prediction of Destination Entryand Retrieval Times UsingKeystroke-Level Models
Daniel Manes,Paul Green,
andDavid Hunter
umtriHUMAN FACTORS


Technical Report Documentation Page
1. Report No.
UMTRI-96-372. Government Accession No. 3. Recipient’s Catalog No.
4. Title and Subtitle
Prediction of Destination Entry and Retrieval5. Report Date
April, 1998Times Using Keystroke-Level Models 6. Performing Organization Code
account 0329237. Author(s)
Daniel Manes, Paul Green, and David Hunter8. Performing Organization Report No.
UMTRI-96-379. Performing Organization Name and Address
The University of Michigan10. Work Unit no. (TRAIS)
Transportation Research Institute (UMTRI)2901 Baxter Rd, Ann Arbor, Michigan 48109-2150
11. Contract or Grant No.
12. Sponsoring Agency Name and Address
Road Commission of Oakland County (RCOC)13. Type of Report and Period Covered
10/84 - 1/9731001 Lahser, Beverly Hills, MI 48025 USA 14. Sponsoring Agency Code
15. Supplementary Notes
This research was funded by RCOC and the Federal Highway Administration.Thirty-six drivers entered and retrieved destinations using an Ali-Scout navigationcomputer. Retrieval involved keying in part of the destination name, scrolling througha list of names, or a combination of those methods. Entry required keying in thedestination's name, the longitude, and the latitude.
For young subjects, mean interkeystroke intervals were 1.7 s for initial cursorkeystrokes, 1.5 s for initial enter, letters, and shift keystrokes, 1.2 s for numbers, and0.6 s for space (different from the "standard" value in keystroke-level models of 1.2 sfor a "worst" typist). Second keystrokes were about 1 s for letters, 0.7 s for cursoractions, and 0.5 s for numbers, similar to the standard time for complex codes (0.75s/keystroke). For more than 2 cursor keystrokes, times were about 0.5 s. Agedifferences were large, with middle-aged drivers taking 40 percent longer and olderdrivers 120 longer than young drivers. Mental (thinking) times averaged 2.2 s, muchgreater the standard time (1.35 s).
Equations were developed linking keystroke-level predictions to the actual times.Linear equations based on pure keystroke-level models accounted from 41 (allsubjects) to 78 percent (young subjects only) of the variance of retrieval times and 12to 39 percent of entry times. For tailored keystroke-level models (with experimentally-based values for keystroke times, and adjustments for age and lighting) the varianceaccounted for was 58 and 83 percent (all subjects and young subjects, respectively)for retrieval, and 47 and 49 percent for entry. Use of linear equations and tailoredmodels significantly reduced the size of prediction errors, making the predictionsuseful for engineering evaluations of alternative interfaces.17. Key Words
ITS, human factors, ergonomics,driving, navigation, route guidance,usability, input devices, controls,keyboards, GOMS, keystroke models
18. Distribution Statement
No restrictions. This document isavailable to the public through theNational Technical Information Service,Springfield, Virginia 22161
19. Security Classify. (of this report)
none20. Security Classify. (of this page)
none21. No. of pages
6422. Price
Form DOT F 1700 7 (8-72) Reproduction of completed page authorized

ii

UMTRI Technical Report 96-37
1. What are typical times for keystrokes and mental operations for navigation data entry using a compact alphanumeric keyboard with poor tactile feedback?
2. How well do various keystroke-level models predict actual performance?
METHOD2
Prediction of Destination Entry and Retrieval Times Using Keystroke-Level Models
Daniel Manes, Paul Green, and David Hunter
ISSUES1
University of MichiganAnn Arbor, Michigan, USA
The Ali-Scout Keyboard (95% actual size)
iii
Men WomenAge
40 - 55
18 - 30
> 65
# of Subjects
6 6
6 6
6 6
Enter new destination into memory• Enter KROGERS with coordinates (0832250W, 422908N)
K R O G E R S0 8 3 2 2 5 0 W 4 2 2 9 0 8 N
K R O G E R S ......
A1 B2 C3 D4L M N- O
...
...Type charactersONLY
Task #2
(Subject has typed the destination name)
(Subject has typed the coordinates)
# of Trials
Task
Enter new destination
Retrieve destinationfrom unit's memory
Real Ali-Scout Simulated
Dusk Night
5 5 5
5 5 5
Ali-Scout
Dusk
Task #1
Retrieve destination from memory
• Retrieve MAIN THEATER
A1 B2 C3 D4L M N- O
...
...
M A I N T H E A T E R ?
Scroll through list Type characters
OR
M A ...........
(Subject has begun typing "MAIN")
(Once the "I" is typed, the rest of the name appears)

RESULTS3
CONCLUSIONS - Keystroke Model Adjustments to Consider4
---Repetition---Key Category 1st 2nd >2ndCursor 1.71 0.69 0.47Enter 1.55 Letters 1.55 0.99Numbers 1.15 0.47Shift 1.46Space 0.60
Step 1: Revised Values for K (s) Step 2: Age Multiplier
Young 1.0Middle 1.4Older 2.2
Step 3: Lighting Multiplier
Dusk 0.94Night 1.06
M = 2.22 s
0
1
2
3
4C
urso
r
Ent
er
Ltrs
Num
.
Shi
ft
Spa
ce
Old
Middle
Young
mea
n (s
)
iv
Step 4:AdjustMental time
Mostimportantadjustment
}
# of reps of same key
0.0
0.5
1.0
1.5
mea
n(s)
10 120 2 4 6 8 14 16
time/keystroketime/keystroke
14
Actual Time = .039 + 1.054 *Predicted
Act
ual T
ime
(s)
2.5
7.5
12.5
17.5
22.5
0 2 4 6 8 10 12
Predicted
Retrievalall subjects
R^2 = .583
102030405060708090
100
Act
ual T
ime
(s)
20 30 40 50 60 70 80 90
Predicted
Actual Time = 12.288 + .644 * Predicted
Entryall subjects
R^2 = .472

v
PREFACE
This report is one of a series supported by the Road Commission of Oakland County,Michigan and the Federal Highway Administration, as part of the FAST-TRAC (Fasterand Safer Travel through Traffic Routing and Advanced Controls) project. (SeeUnderwood, 1994; Eby, Streff, Wallace, Kostyniuk, Hopp, and Underwood, 1996;Taylor and Wu, 1995; Kostyniuk, and Eby, 1996 for related research.) This operationalfield test combines the SCATS (Sydney Coordinated Automatic Traffic ControlSystem) equipment and software, the Autoscope video detection system, and the Ali-Scout (Autofahrer Leit und Information System Scout) dynamic route guidance system.The goals of this effort are to improve traffic flow and reduce traffic accidents inOakland County and the surrounding area.
Ali-Scout is a second-generation product developed by Siemens which provides realtime, turn-by-turn guidance to drivers who have units installed in their vehicles.Ali-Scout vehicles communicate with infrared roadside beacons, which send traveltimes to the traffic control center and receive sequential routing instructions in return.
If navigation products are to be produced, they must be safe and easy to use. Drivernavigation-related tasks include (1) calibration (of the compass and distance sensors)and setting (of the voice levels and screen colors), (2) telling the system where thedriver wants to go (destination designation), and (3) following the guidanceinstructions. The second and third tasks are more important as most calibration andsetting tasks requiring driver intervention are not performed while the vehicle is inmotion. The human factors work carried out in the FAST-TRAC project is described infive reports, two of which relate to destination designation. A full description of anexperiment involving destination designation using the Ali-Scout and subsequentanalysis is provided in Steinfeld, Manes, Green, and Hunter (1996). This reportdescribes models that predict destination entry and retrieval times through the use ofindividual keystroke times. Of interest is how long it takes drivers to determine thecoordinates for a new destination, to enter coordinates into the navigation computer,and to retrieve previously entered destinations, and the time and errors for each. Inaddition, these two reports address a larger, more fundamental scientificissue—whether a touchscreen simulation of the real product is sufficient for usabilityassessments. The simulation takes much less time to construct and is easier tomodify, facilitating iterative design.
Readers should note that the working title of this report was slightly different(Prediction of Destination Entry and Retrieval Times Using GOMS). While the acronymGOMS is commonly used in the human-computer interaction literature, the acronymand its meaning is unfamiliar to those involved with automotive human factors.Accordingly, a more readily understood term that also appears in the literature(Keystroke-Level Model) was substituted.
Research relating to following route guidance is covered in three reports: oneconcerning equipment used in the evaluation (Katz, Green, and Fleming, 1995), oneconcerning driving performance and subjective ratings (Katz, Fleming, Green, Hunter,and Damouth, 1996), and a third concerning driver eye glances (Manes, Green, andHunter, 1997, in progress).

vi
This series of reports provides a comprehensive examination of driver-related designissues and should be useful in designing and evaluating safe and easy-to-usenavigation products.
We thank Amitaabh Malhotra, Patrick Wei, and Marie Williams, all formerly of UMTRI,for programming the Ali-Scout simulation, and Aaron Steinfeld for significantcontributions to the design of this experiment. We also would like to thank Sara Naylorfor testing some of the pilot subjects.
Finally, the authors thank Cale Hodder of Toyota for encouraging the authors toinclude Americanized A3 reports (the two-page summary prior to the preface) in ourtechnical reports.

vii
TABLE OF CONTENTS
INTRODUCTION......................................................................................... 1Why this topic is of interest .............................................................................................1Previous research............................................................................................................1
Summary of GOMS..............................................................................................1Previous studies of data entry modeled using keystroke models...............4
Research issues explored..............................................................................................5
TEST PLAN................................................................................................ 7Test participants ...............................................................................................................7Test materials and equipment .......................................................................................7
Ali-Scout interface................................................................................................7Driving simulator ................................................................................................10
Test activities and their sequence...............................................................................11
SUMMARY OF THE RESULTS FROM THE PREVIOUS REPORT.............. 1 3
ESTIMATING MODEL PARAMETER TIMES USING THEEXPERIMENTAL DATA ............................................................................ 1 7
Effect of character typed................................................................................................19Effect of repetitions.........................................................................................................22Effect of dusk versus night............................................................................................23Effect of subject age.......................................................................................................24Estimation of mental time..............................................................................................26Summary of the analysis process...............................................................................27
DEVELOPMENT OF THE KEYSTROKE-LEVEL MODEL ........................... 2 9Step 1 - Production of flowcharts ................................................................................29Step 2 - Generation of the spreadsheets...................................................................32Step 3 - Formulation of equations...............................................................................39
EVALUATION OF THE KEYSTROKE-LEVEL PREDICTIONS.................... 4 1
CONCLUSIONS....................................................................................... 4 5What are typical keystroke and mental operator times?.........................................45How well did keystroke models predict overall times? ...........................................46What should occur next? ..............................................................................................46
REFERENCES ......................................................................................... 4 7
APPENDIX A - REGRESSION PLOTS OF VARIOUS KEYSTROKE-LEVEL MODELS ...................................................................................... 5 1

viii

1
INTRODUCTION
Why this topic is of interest
There is considerable worldwide interest in developing safe and easy to usenavigation systems for motor vehicles. Navigation systems typically include (1) adisplay capable of showing maps of the route and turn-by-turn guidance (usually in theform of arrows), and (2) computer-generated speech to provide directions. Suchproducts are quite popular in Japan (Treece, 1996). Efforts to market navigationsystems on a similar scale in the U.S. and Europe are just beginning.
Navigation systems can reduce wasted travel, saving drivers time and fuel, andprovide for operational efficiency by optimizing use of the road network. Bydecreasing driving under uncertain conditions and eliminating the use of paper mapswhile driving, accidents may be reduced. Finally, navigation systems will offer comfortand convenience to drivers. However, such positive outcomes assume that navigationsystems are safe and easy to use.
There are two primary driver tasks in using navigation systems: (1) entering andretrieving destinations, and (2) following the directions given by these systems (routeguidance). Secondary tasks include setting and calibrating the system. Routefollowing deserves the most attention because that task occurs while the vehicle is inmotion. Route following is covered in other reports in this project (Katz, Green, andFleming, 1995; Katz, Fleming, Green, Hunter, and Damouth, 1996).
However, destination designation also must be considered. If drivers cannot readilyidentify destinations to the navigation computer, there will be no guidance. Generally,destination designation is assumed to be performed while the vehicle is stopped orparked. However, in many circumstances, such as driving on an expressway,stopping may be difficult, so destination designation while in motion may be less risky.There is great concern as to what a driver can do while in motion (Zwahlen andDeBald, 1986; Zwahlen, Adams, and DeBald, 1988).
Previous research
Several studies in the literature have examined the entry of location names, streetaddresses, and coordinates, a focus of this experiment. For a detailed review of thattopic, see the previous report in this series (Steinfeld, Manes, Green, and Hunter,1996). Of those studies, several have attempted to predict performance times using akeystroke-level implementation of the GOMS (goals, operators, methods, andselection rules) model developed by Stuart Card and his colleagues at Xerox (Card,Moran, and Newell, 1983).
Summary of GOMS
GOMS was originally developed as a method for predicting the time to completeroutine cognitive operations using a computer system. The model draws uponknowledge from psychology, industrial engineering, and computer science. Themodel is not intended to provide exact predictions of task times but reasonable

2
approximations. The model assumes that the user is reasonably familiar with whatthey need to do (hence the routine term) and that the primary constraints are related tothinking (cognitive activities) as opposed to physical limitations (aerobic capacity,muscle strength, etc.).
The application of the GOMS approach can best be described by example. Suppose,for example, the task was to set the clock on a VCR. On a typical system, this wouldinvolve entering “clock” mode, setting the values for several fields (such as day, hours,and minutes), and finally exiting “clock” mode. An analyst might identify one top-levelgoal (“Set clock”) and three subgoals (“Change mode,” “Set field value,” and “Advanceto next field”). For each low-level goal (goals at lower points in the hierarchy), amethod must be specified using basic operators (e.g., “Push up arrow button” or“Decide if value is correct”). Finally, selection rules are invoked any time more thanone path can be taken. One could enter the hours either with the number pad or usingthe up and down arrow buttons.
Once the steps have been identified, the task times can be predicted using data fromeither the Model Human Processor or the Keystroke-Level Model. The Model HumanProcessor is a computer system representation of the human thought processconsisting of three memory systems and four processors. These components areorganized into three subsystems (perceptual, cognitive, motor). (See Figure 1.)Memories have three parameters: storage capacity (µ), storage code (κ), and decaytime (δ). Processors have one parameter, cycle time (τ). For each parameter, threevalues are given: middleman, slowman, and fastman. Middleman is the most typicalvalue. Slowman and fastman represent reasonable minima and maxima. The modelalso includes eye fixation times. The choice of the value depends upon the predictionneeded—best case, worst case, or typical.

3
κwm = acoustic or visual
Cognitive Processor
τc = 70 [25~170] ms
τp = 100 [50~200] ms
Perceptual Processor
τm = 70 [30~100] ms
δvis = 200 [70~1000] ms
µvis = 17 [7~17] letters
δais = 1500 [900~3500] ms
µais = 5 [4.4~6.2] letters
κais = physical
κvis = physical
δwm = 7 [5~226] s
µwm = 7 [5~9] chunks
δltm = infinite
κltm = semantic
µwm = infinite
Visual Image Store
Auditory Image Store
Working MemoryLong-Term Memory
Motor Processor
Input
Output
Limbs
Hands
Feet
Cognitive Subsystem
Motor Subsystem
Perceptual Subsystem
Figure 1. Overview of the Model Human Processor.
A simplified GOMS derivative is the Keystroke-Level Model (Card, Moran, and Newell,1980). The Keystroke-Level Model is higher level than the Model Human Processor inthat each element in the Keystroke-Level Model can be decomposed into severalelements in the Model Human Processor. Accordingly, less time is required toestimate times using the Keystroke-Level Model. However, the estimates are lessaccurate because some details are ignored.
Model parameters are shown in Table 1. Two parameters are of particular interest:(1) K, the time to type a keystroke (the interkeystroke interval) and (2) M, the time tomentally prepare to perform some action such as typing a digit sequence or moving amouse to a location. Card, Moran and Newell (1980) provide a detailed set of rulesidentifying where M parameters should be included in time estimates. (See alsoKieras, 1988.)

4
Table 1. Keystroke-Level Model parameters.
Parameter Symbol Comment Time (s)Pointing P Point with a mouse to a target on a display 1.1Homing H Home hand(s) to keyboard or to device 0.4Draw D Draw N straight lines of length L cm .9N + .15LMental M Mentally prepare 1.35System Response R System specific time, empirically
determinedt
Keystroke K Best typist (135 wpm) 0.08Good typist (90 wpm) 0.12Average skilled typist (55 wpm) 0.20Average nonsecretary typist (40 wpm) 0.28Typing random letters 0.50Typing complex codes 0.75Worst typist (unfamiliar with keyboard) 1.20
Olson and Nilsen (1987 and 1988) carried out and analysis of what users do inworking with spreadsheets. From their data, M (the mental or thinking time) isestimated to be 1.62 seconds and K (time per keystroke) to be 0.36 seconds. Inaddition, they also introduce a new parameter, S (equal to 2.29 seconds), whichinvolves scanning across a row to find an item in a matrix.
Previous studies of data entry modeled using keystroke models
Detweiler (1990) examined five different methods to enter characters using a 12-keytelephone pad. As shown in Table 2, the rank orders of the actual entry times andkeystroke-level predictions were identical with one exception. Notice that all thedifferences between the actual and predicted times for each method are under 10percent and three of five are under five percent. Keystroke-level models were morelikely to underpredict than overpredict.
Table 2. Entry times and errors for various methods from Detweiler (1990).
Method % Errors Entry Time (s) Predicted (s) Difference (%)Repeat key 6.7 12.38 11.96 3.4Modified modal 17.1 12.50 13.72 9.8Top row 8.0 13.50 13.50 0.0Same row 10.5 14.18 13.78 2.8Modal position 13.0 14.81 14.58 1.6
In an experiment even closer to the point, Paelke (1993) examined four differentinterfaces for destination entry spanning the range of options available incontemporary navigation systems. Table 3 shows data from her efforts. While thepercentage differences are larger, that, in part, was because of larger sources ofvariance in entry times (time sharing, slow response of the simulated interface, etc.).

5
Table 3. Entry times and errors for various methods from Paelke (1993).
Method Similar to Entry Time (s) Predicted (s) Difference (%)Doublepress TravTek 75.6 63.1 16.5Qwerty ADVANCE 44.1 54.2 22.9Phonepad 42.9 49.8 16.1Scrolling List Zexel/PathMaster 55.1 82.5 81.0
Nonetheless, in both studies, the rank order of keystroke-level predictions agrees withthe actual data, suggesting keystroke-level predictions are useful for choosing amongalternative interface designs. This has tremendous importance for interface designand evaluation because an experimental evaluation of alternative interfaces mighttake several months to complete, while keystroke-level calculations could becompleted in a few days to a week. About 40 percent of the time spent testing aninterface is spent planning the experiment and instrumenting the interface ordeveloping a simulation.
Research issues explored
The research described here provides an example of the application of keystroke-levelmodels to two tasks involving a fairly complex interface. While the previous Ali-Scoutreport focused on how various factors (subject age and sex, lighting conditions, andstimulus) affected overall task times, this report deals with entry and retrieval times at amore fine-grained level. Specifically, the following two issues were addressed:
1. What are typical keystroke times when using an interface with an unfamiliarkeyboard and small buttons?
2. How successfully can keystroke-level models predict overall times for tasks ofvarying complexity?
The following two sections provide overviews of the relevant features of the previousAli-Scout study, namely the basic experimental protocol and some of the key results.Next, the results of the in-depth keystroke analysis are discussed. The final twosections describe the development of keystroke-level models for two tasks and ananalysis of how reliably the models predicted the actual task times from theexperiment.


7
TEST PLAN
This section provides a summary of the test protocol. Additional details appear in thefirst report in this series (Steinfeld, Manes, Green, and Hunter, 1996).
Test participants
There were 36 subjects in the experiment—12 young (18 to 30), 12 middle-aged (40 to55), 12 older (over 65)—representing the population extremes and the most likelybuyers. Within each age group there were an equal number of men and women. Allsubjects were licensed drivers, driving between 1,000 and 40,000 miles per year(mean of 13,000). All but three subjects had at least some college experience.Subjects' visual acuity ranged from 20/13 to 20/40. Only one subject had previousexperience with a navigation system, but most had used a touchscreen. Computeruse was moderate on average. Subjects were moderately comfortable typing.Subjects were paid $40 for completing the experiment.
Test materials and equipment
Ali-Scout interface
This experiment incorporated a real Siemens Ali-Scout Display Unit as well as atouchscreen simulation created in SuperCard on a Macintosh computer. Figure 2shows frames grabbed from video recordings of device use. The Ali-Scout interfaceconsists of the following four elements: (1) an LCD guidance screen on the left of theunit face; (2) a text window for destination names, coordinates, and entry information;(3) front panel selection keys; and (4) a fold-out alphanumeric keypad.
Figure 2. The real display unit (left) and the simulated display unit (right).
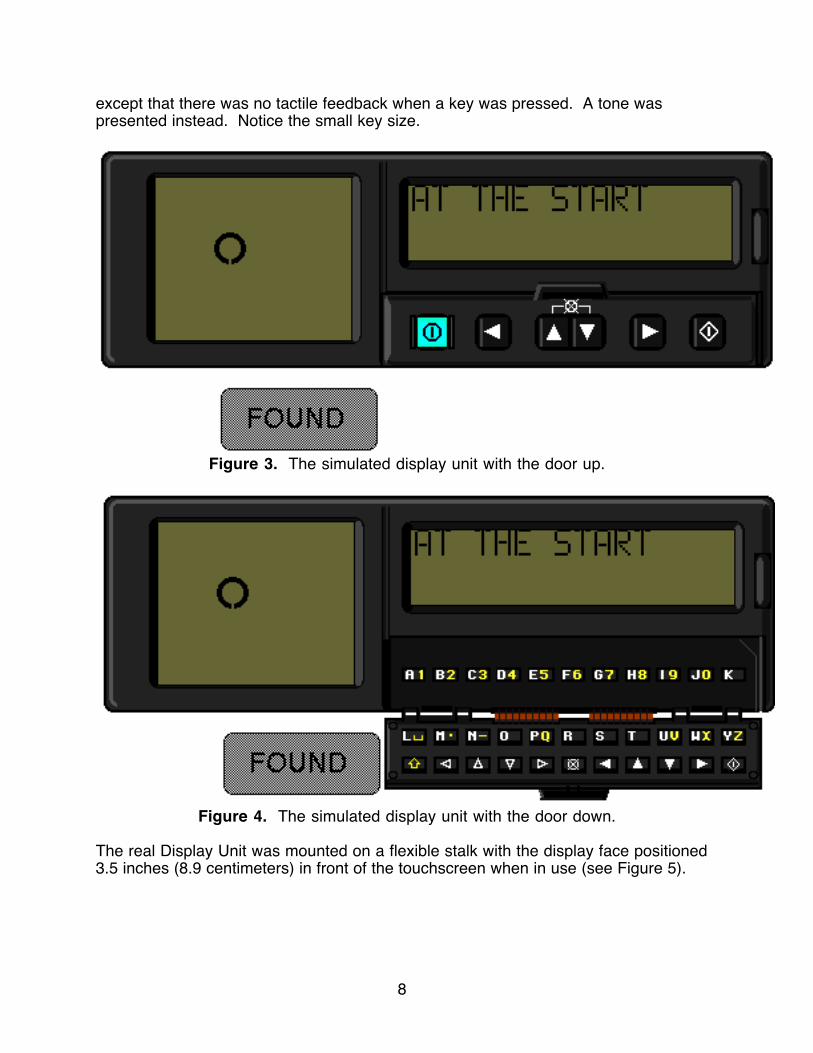
Figures 3 and 4, actually taken from the simulation, show the Display Unit closed andopen. These figures are full size on an 8.5 x 11 inch page. The FOUND button wasnot part of the device but was added to assist in timing use performance. The size andappearance of all elements of the simulated display were identical to the real interface
8
except that there was no tactile feedback when a key was pressed. A tone waspresented instead. Notice the small key size.
Figure 3. The simulated display unit with the door up.
Figure 4. The simulated display unit with the door down.
The real Display Unit was mounted on a flexible stalk with the display face positioned3.5 inches (8.9 centimeters) in front of the touchscreen when in use (see Figure 5).

9
Figure 5. Location of the display.
Two tasks were examined: (1) retrieving previously entered (stored) destinations and(2) entering new destinations. To retrieve a destination, subjects could use one ofthree strategies: (1) type in the name of the destination, which appeared when thecharacters entered uniquely matched the beginning of that name (type method);(2) scroll through the list of names until the desired destination appears (scrollmethod); or (3) type in one or more characters and then scroll the rest of the way(hybrid method).
Table 4 shows the keystrokes necessary to obtain SEARS as a destination using thetype method and hybrid method. Assuming the subject had not memorized the database (there were 21 locations in the main list), the minimum character strokes requiredusing either method would be four. The first down arrow is required to enter thescrolling mode.

10
Table 4. Example of the type and hybrid methods for destination retrieval.
Location List Type Method Hybrid MethodAT THE START Entered Displayed Entered Displayed... S S...... S S......SAKURA BANK E SE..... ∇
(scroll down)SAKURA BANK
SEAFOOD BAY A SEA.... ∇ SEAFOOD BAYSEARS R SEARS ∇ SEARSVANDENBURG SCH...
To enter a destination not in the data base, the subject first entered the name (up to 14characters including spaces). Keying was somewhat confusing as many of the keyshad two characters on them. The left character was shown in white, the right in yellow.To type the right character, the subject first pressed the shift key (which was located atthe bottom-left key of the keyboard and labeled with a yellow up arrow) and then thekey of interest. (See Figure 4.)
Next, the subject keyed in the longitude and latitude. This involved advancing thecursor to each of the two coordinate fields using either the diamond key or the rightcursor key and typing the appropriate numbers. Finally, the subject pressed thediamond key to save the destination. The longitude and latitude were obtained eitherfrom a map or from lists of street address ranges and coordinates. Additional details ofthe entry process are provided later.
The original project plan called for evaluating both real and simulated Display Unitsunder simulated dusk and night conditions. However, pilot tests showed nodifferences due to illumination for the simulated unit, so only the simulated duskcondition was explored in the main experiment.
Driving simulator
The data collection portion of the experiment was conducted in the UMTRI DriverInterface Research Simulator. The automobile simulator consisted of an A-to-B pillarmockup of a 1985 Chrysler Laser, a retroreflective wall, and a variety of computer andvideo components. Subjects never drove the simulator. During experimental trials animage simulating the view out the windshield of a car parked in the right shoulder of atwo-lane road was presented. For additional details of the simulator, see the initialreport, Green and Olson (1997), Olson and Green (1997), or MacAdam, Reed, andGreen (1993).

11
Test activities and their sequence
An overview of the protocol is shown in Table 5. As noted in the table, the primary testtasks were to retrieve and enter three sets of five destinations. Locations retrievedwere ordered so that the minimum number of keystrokes (averaged across groups bytrial) was just over three (see Tables 6 and 7). Likewise, destinations entered wereordered to roughly equalize the total number of keystrokes and shifts across ordersand across entry trials to facilitate looking at differences due to those factors. (SeeTable 8.)
Table 5. Summary of the experiment.
Activity Name Description1 Introduction The subject was told the purpose of the experiment, and then
completed the biographical and consent forms.2 Videotape The subject watched an instructional video on entering and
retrieving destinations.3 Practice The subject retrieved five locations, then entered five
locations.4 Test-use of
manualThe subject looked up three destinations in the manual (pointof interest name, intersection of 2 roads, street address).
5 Simulatorintroduction
The subject practiced using the touchscreen.
6 Test-keypaduse
The subject completed five entry then five retrieval tasks(three times: real interface at dusk, real at night, simulated atdusk).
7 Posttest The subject's eyesight was checked, completed aquestionnaire, was paid, and finger anthropometry wasrecorded.
Table 6. Retrieval lists for each stimulus set.
A B C DummySAKURA BANK SEAFOOD BAY BILL KNAPPS MONTGMRY WARDBIR ICE ARENA PRINT GALLERY PRIMOS PIZZA ROYAL OAK DELIMONTERREY REST MAJESTIC CAFE WOODSIDE HOSP SEARSMOBIL VANDENBURG SCH BIR THEATER BIR ART GALLRYBIG BOY BIR LIBRARY MONGOLIAN BBQ PALACE OF AH

12
Table 7. Minimum number of keystrokes for retrieval.
Stimulus SetA B C Dummy2 3 3 55 4 3 15 2 1 43 2 5 42 5 4 2
3.4 3.2 3.2 3.2
Table 8. Destination lists for each entry stimulus set.
Stimulus Set Name Total Keystrokes Total ShiftsNICKS PLACE 12 1Q GAS 7 2
A HELENS KITCHEN 15 1YAW GALLERY 12 1GOODYEAR 8 0FARMER JACK 12 1TACO LOCO 10 1
B FIRST OF AM 13 2JACOBSONS 9 0CHEVRON 8 1LARK REST 10 1UNICORN GRILL 14 1
C KROGERS 7 0QWIK STOP 11 2TUFFY AUTO 11 1LICHT PARK 11 1NORDSTROM 9 0
Dummy DISCAFE 7 0OAKLAND MALL 13 1OLIVE GARDEN 14 2
Each set of five was entered under different conditions (real interface at dusk or atnight, simulated interface at dusk) in a counterbalanced order. Lighting conditionswere simulated by adjusting the interior lighting.

13
SUMMARY OF THE RESULTS FROM THE PREVIOUS REPORT
Keypress times for the simulated interface were automatically saved by the controllingsoftware. Keypress times for the real interface were obtained by playing back avideotape of user actions at reduced speed and by using a custom logging program toenter keystrokes.
Task times varied quite widely with the task. Figures 6 and 7 show the histograms oftimes for retrieval for both tasks. There were significant differences betweendestinations (presumably due to the number of keypresses required), an issue that willbe explored later. (See Table 9.) Also prominent were practice effects (primarilybetween the first and second block), and significant effects due to age, sex, andsubject within age-sex categories. Lighting was also a significant factor (dusk versusnight), but only for older subjects performing the entry task.
0
20
40
60
80
100
120
Cou
nt (
n=54
0)
0 20 40 60 80 100 120 140Retrieval Times (s)
mean=10.48
median=6.23 s
DESTINATION RETRIEVAL
interquartile range=9.050 10 20 30 40
(inset: detail of first 40 seconds)
Figure 6. Histograms of retrieval times.

14
median=51.48 s
mean=64.68
0
10
20
30
40
50
60
Cou
nt (
n=54
0)
0 50 100 150 200 250 300 350 400 450Entry Times (s)
DESTINATION ENTRY
interquartile range=39.21
Figure 7. Histogram of entry times.
Table 9. Median, maximum, and mean times for each of the 30 cards.
Retrieval Times (in seconds) Entry Times (in seconds)Place Name Median Max Mean Place Name Median Max MeanSAKURA BANK 3.47 101.88 8.80 NICKS PLACE 60.16 209.95 77.00BIR ICE ARENA 12.00 121.75 19.00 Q GAS 47.67 275.88 69.55MONTERREY REST 9.58 120.58 16.34 HELENS KITCHEN 55.25 203.22 72.85MOBIL 3.98 55.40 8.68 YAW GALLERY 54.19 252.55 67.82BIG BOY 4.57 51.83 7.47 GOODYEAR 39.45 135.73 51.05SEAFOOD BAY 8.27 94.90 17.10 FARMER JACK 67.55 351.30 84.31PRINT GALLERY 6.82 16.05 7.52 TACO LOCO 52.50 151.70 57.98MAJESTIC CAFE 2.37 21.30 3.73 FIRST OF AM 54.98 159.20 64.55VANDENBURG SCH 3.56 52.97 9.68 JACOBSONS 48.28 185.70 60.30BIR LIBRARY 9.97 58.13 14.05 CHEVRON 44.00 100.63 46.96BILL KNAPPS 4.79 62.60 8.70 LARK REST 61.74 243.73 72.03PRIMOS PIZZA 6.15 57.63 10.93 UNICORN GRILL 55.59 238.53 74.17WOODSIDE HOSP 0.38 19.35 1.83 KROGERS 43.96 101.52 47.28BIR THEATER 9.83 30.77 12.70 QWIK STOP 54.43 436.45 73.18MONGOLIAN BBQ 7.27 39.77 10.69 TUFFY AUTO 45.67 131.72 51.12Overall 6.23 121.75 10.48 Overall 51.48 436.45 64.68
Note: Retrieval always begins with the place name AT THE START (the first alphabeticentry) shown.
Also important was the relationship between the retrieval and entry times for realsystems (both at night and at dusk) and analogous times for simulated systems. Ingeneral, actual task times were 57 to 86 percent of the time using the simulatedinterface, depending upon the lighting condition. Some of this difference may be due

15
to the slowness of the interface in responding to input, something that should not be anissue with current, much faster, computers. However, the lack of tactile feedbackprovided by the screen is still an issue.
The error data were also addressed in some detail, but the number of errors wasrelatively small, so few differences were found. Left unanswered in the previous reportwas how the details of the task structure affected keying time.
1. Were the times for different types of keystrokes the same?2. How did individual differences affect the time for each type of keystroke?3. How did the simulated keystrokes differ from real keystrokes?4. How well do the GOMS predictions agree with the times measured?
for the real device (dusk, night),for the simulated device, andfor each task?
This report focuses on issues 1 and 4, the differences between keystroke types andthe ability of keystroke-level models to predict actual performance.

16

17
ESTIMATING MODEL PARAMETER TIMES USING THE EXPERIMENTALDATA
One of the major goals of this project was to estimate the operator times using actualdata from the experiment. Although keystroke-level models can provide predictions oftask times based on the design of a product so testing is avoided, initial keystroke-level estimates for the Ali-Scout were very rough. This is partially because standardkeystroke operator times in the literature are based on the QWERTY keyboard whichhas very different characteristics than the keypad of the Ali-Scout, so it was notapparent which estimate of keying time should be used. Also, the nature of the tasksperformed using the Ali-Scout may be sufficiently different from those used in theliterature that the standard mental operator times do not apply. Since it was unclearwhich keystroke-level parameter estimates (or others tailored from the data) were mostaccurate, an effort to provide model calibration data for this context was appropriate.Again, the ultimate goal was to use some form of keystroke-level model as a basis forcomparing alternative driver interfaces during interface development.
The basic approach here was to examine each main effect (such as keying numbersversus letters) and each interaction in a stepwise fashion to reveal patterns in the data,especially for categorical effects such as age. To ensure that keystroke times met theassumptions of the GOMS model approach, only perfectly executed responses for thereal (rather than simulated) Ali-Scout interface were examined. Furthermore, fourexclusion criteria were applied to the data set for the real device.
1. No extra keystrokes - Sequences in which extra keystrokes appeared were trialsfor which subject uncertainty was likely. Uncertainty violates the routine-cognitive-method assumption of GOMS. Further, accounting for the corrections would haverequired developing a specific GOMS model for each trial with extra keystrokes, anexcessively time consuming task.
2. No first keystroke - Because of the method of timing, the first keystroke time alsoincludes the time for a mental operator. There was no way to determine exactlywhen the subject began to plan the keying sequence and when planning ended.However, when the first keystroke was completed was known.
3. No first numbers - The time for the first number in a sequence has embedded in itthe time for a mental operator since the subject plans a number sequence justbefore typing the string.
4. Young subjects only - Young subjects (1/3 of the sample) were least likely to pausewhile keying to think about what to do next, and accordingly for them, keying wasclose to being a routine cognitive activity. For middle-aged and older subjects,pauses did not occur in the same places for all subjects and dropped out withpractice, making it difficult to determine where mental operators should be includedin the time estimates.
The need for these assumptions is apparent in the original data set, where a moderatenumber of operator times were in excess of 10 seconds, times well beyond keystroke-level model estimates.

18
Using those criteria, 2,181 data points remained from 12,107 in the original data set.These remaining trials do not represent optimal performance, particularly for retrievaltasks where several methods could be employed. The mean time per operator was1.24 seconds with a standard deviation of 0.93 seconds. Figure 8 shows thedistribution of times and Figure 9 shows the distribution of log (time). Clearly thedistribution is log normal.
0
50
100
150
200
250
300
350C
ount
0 1 2 3 4 5 6 7 8 9
Time (seconds)
Figure 8. Distribution of times for young subjects with no extra or initial keystrokes.
0
20
40
60
80
100
120
140
160
Cou
nt
-1.2 -1 -.8 -.6 -.4 -.2 0 .2 .4 .6 .8 1
Log (time)
Figure 9. Distribution of log (time) for young subjects with no extra or initialkeystrokes for real interfaces.

19
Effect of character typed
There is considerable data in the literature on entry of sequences using a single finger(e.g., Verwey, 1996) and typing (e.g., Evey, 1980, Cooper, 1983). However, the keyingprocess in this context was only partially automated, and context-specific data wastherefore desired.
Table 10 shows a summary of the keystroke times by key. Of the characters typed,only 10 of them had fewer than 20 entries, so the time estimates should be fairlystable. Table 11 shows those same data sorted by mean time. Time for "other" keys(cancel, etc.) are not shown as those keys were associated only with extra keystrokesequences.
After very careful inspection of the data to identify similarities, and based on acceptedconventions, the keystrokes were grouped into six categories—letters, numbers,cursor keys, enter, shift, and space. A preliminary examination of all letters versusletters on the first row (thought to be different because of differences in illuminationlevel) showed no differences. In addition, there also did not appear to be arelationship between the frequency with which a character was typed and its meantime (r=-0.26 for the data set). Partitioning the data set (e.g., numbers only, lettersonly) led to even lower correlations between frequency and mean interkeystrokeinterval.

20
Table 10. Time statistics for each key, sorted by key name.
Key Name Mean Std. Dev. Std. Error Count Minimum Maximum0 1.039 .513 .058 78 .300 2.7301 1.024 .614 .120 26 .470 3.0302 .780 .396 .051 61 .270 2.2003 1.230 .888 .090 98 .200 5.3004 1.155 .877 .127 48 .230 3.9305 1.218 .613 .084 53 .330 3.0006 1.188 .811 .127 41 .400 4.1707 1.032 .671 .101 44 .430 3.5708 1.438 .925 .164 32 .470 4.2709 1.150 .928 .124 56 .470 4.800A .943 .592 .063 88 .300 4.470B 1.627 .690 .208 11 .800 2.700C 1.134 .583 .088 44 .430 2.900D .990 .416 .208 4 .430 1.430E 1.300 .653 .083 62 .430 3.500F 1.498 1.236 .258 23 .270 4.730G 2.188 1.066 .175 37 .470 5.530H 2.274 1.131 .400 8 1.100 4.370I 1.842 1.153 .128 81 .470 5.870J 2.727 1.027 .388 7 1.400 4.630K 1.585 .909 .163 31 .330 3.700L 1.616 1.097 .152 52 .170 4.700M 1.344 .639 .160 16 .730 3.270N 1.403 .925 .136 46 .170 4.100O 1.557 1.111 .124 80 .270 7.370P 1.934 1.044 .290 13 .400 3.500Q .834 .302 .084 13 .530 1.570R 1.677 .883 .088 100 .400 4.870S 1.531 .994 .142 49 .430 4.830T 1.121 .804 .134 36 .330 3.430U 1.205 .755 .202 14 .430 2.970V .804 .116 .037 10 .670 1.030W 2.215 .989 .211 22 1.070 5.130Y 2.038 1.071 .260 17 .670 4.400
Right cursor .917 .765 .052 216 .100 4.600Scroll up .470 .381 .071 29 .230 2.370
Scroll down .666 .586 .053 124 .200 2.970Enter 1.552 1.107 .085 170 .570 7.870Shift 1.277 1.048 .085 153 .270 6.770
Space .565 .222 .024 88 .230 1.400Total 1.243 .932 .020 2181 .100 7.870

21
Table 11. Mean keying times for the real interface sorted by time.
Key Name Time (seconds) Key Name Time (seconds)Scroll up 0.470 Shift 1.277Space 0.565 E 1.300
Scroll down 0.666 M 1.3442 0.780 N 1.403V 0.804 8 1.438Q 0.834 F 1.498
Right cursor 0.917 S 1.531A 0.943 Enter 1.552D 0.990 O 1.5571 1.024 K 1.5857 1.032 L 1.6160 1.039 B 1.627T 1.121 R 1.677C 1.134 I 1.8429 1.150 P 1.9344 1.155 Y 2.0386 1.188 G 2.188U 1.205 W 2.2155 1.218 H 2.2743 1.230 J 2.727
Figure 10 shows the mean times for each category of keys for each task. Forconvenience, those means also appear in Table 12. Note the high variability in theshift key times for retrieval in the figure, most likely because use of the shift key wasassociated with beginning a new sequence, and in some cases there may have beenassociated mental activity. Time for the space and cursor keys tended to be less thanothers because those keys are often struck several times in a row, and search to findthe key was only required for the first keypress. These differences may also reflectfrequency of use (and repeated use) as the shift and space keys were used quiteoften.
.5
1.0
1.5
2.0
2.5
Mea
n (s
)
Retrieval
Entry
Key type
SpaceCursor Letters ShiftEnter #s
Figure 10. Times by key category for young subjects using the real Ali-Scout.

22
Table 12. Mean times for young subjects using the real Ali-Scout.
Key Category Entry (s) Retrieval (s)Cursor 0.92 0.63Enter 1.55Letters 1.49 1.61Numbers 1.12Shift 1.23 1.69Space 0.55 0.64
To put these values in perspective, the standard Keystroke-Level Model estimates fortyping are 0.5 s/keystroke for random letters, 0.75 s/keystroke for complex codes, and1.2 s/keystroke for a "worst" typist unfamiliar with a keyboard. The data obtainedsuggests times resembling that of a worst case typist, though there is considerablevariation between key types, so using a single fixed keying time may not be optimal.
Effect of repetitions
As was mentioned previously, repetition was a critical factor. As depicted in Figure 11,the primary difference found was between the first trial and all others. The high degreeof variance for repetition 13 was most likely due to outliers in the data set (only fourdata points existed for that number of repetitions). According to these data, the meantime for a keystroke was 1.37 seconds for the first keystroke, 0.76 seconds for thesecond keystroke, and 0.47 seconds for the others. The mean time for trial three andbeyond is fairly close to the estimated time for typing random characters (0.5 seconds).Partitioning these data by key category (see Figure 12) shows that all of the repetitionsgreater than two were for the cursor key. The increase in time for the shift key probablywas due to the complex planning required (since shift is part of a two-key sequence)and because of the low frequency of occurrence of that combination.
0
.5
1.0
1.5
Mea
n (s
)
0 1 2 3 4 5 6 7 8 9 10 11 12 13 14 15 16 17
Number of repetititons
Figure 11. Effect of repetitions on the mean keying time (in seconds).

23
0
.5
1.0
1.5
2.0
2.5
3.0
Mea
n (s
)
17161514131211109
876543210
# of repetitions
Key typeSpaceCursor Letters ShiftEnter #s
Figure 12. Mean keying time as a function of key type and number of repetitions.
Table 13 reveals that the relative decrease in the second key varies with the keycategory, though the means for more than two successive cursor keys and twosuccessive numbers were both 0.47 seconds. This value probably represents a lowerbound of keying performance for this device (on average for younger subjects).
Table 13. Mean times for successive keystrokes (in seconds).
KeystrokeKey Category 1 2 >2Cursor 1.71 0.69 0.47Letter 1.54 0.99Number 1.15 0.47
Effect of dusk versus night
Also of interest is how the pooled dusk and night data described previously needed tobe adjusted to account for dusk-night differences. Pooling was necessary to provideenough data for good estimates of the means. As shown in Figure 13, the majordifference between dusk and night seems to be that enter, letters, and numbers took10 to 15 percent longer to type at night than under dusk conditions. For the shift key,the reverse was true. Typing the shift key took slightly less time at night. This addedtime was needed to search for the key when illumination levels were low. Since thecursor key was often used several times in succession and the space was part of atwo-key planned sequence, search was not required as often, so the effects of lowillumination were much less. This suggests selective use of an adjustment factor forpoor lighting conditions (decreasing the values in Table 13 by five to seven percent forenter, letters, and number to predict dusk performance; increasing them by the sameamount to predict performance at night).

24
Key type
SpaceCursor Letters ShiftEnter #s.4
.6
.8
1
1.2
1.41.6
1.8
2
Mea
n (s
)
Night
Dusk
Figure 13. Keystroke times for real interfaces for young subjects—dusk versus night.
Effect of subject age
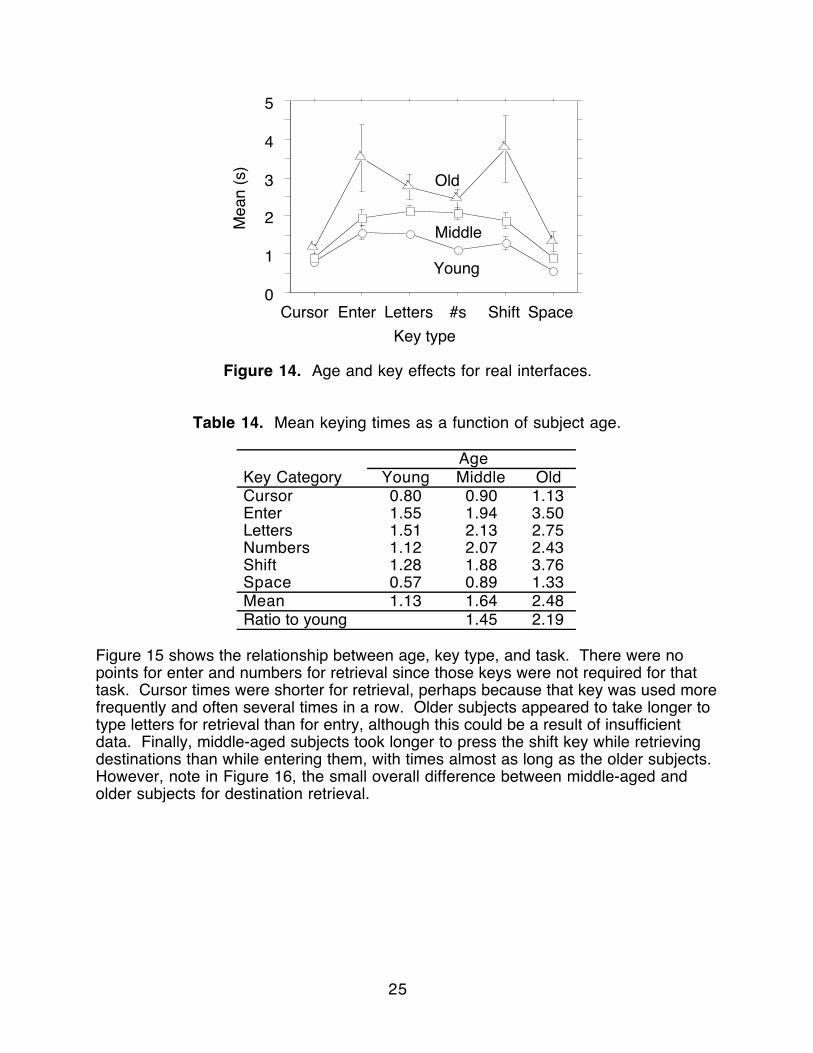
Age differences varied from one key type to another. (See Figure 14 and Table 14.)Although there were a limited number of good data points (trials without excesskeypresses) for older drivers, note that times for enter and shift were considerablygreater for that age group. This is probably because older subjects had not fullylearned the entry process, so there was an added mental operator. Ignoring the shiftand enter cases, times for older drivers were almost double (actually 1.93 times) thoseof young drivers.
If this were always the case, then adding in a standard M operator (1.35 seconds)would lead to an overestimate of the enter time (1.55 * 1.93 + 1.35 = 4.34 seconds) butwould improve the accuracy of the shift times (1.28 * 1.93 + 1.35 = 3.82 seconds).Most likely, mental operations only occurred some of the time. For quick estimates, it isreasonable to assume that times for middle-aged drivers are 1.45 times those foryoung subjects when key types are equalized. Older driver keying times were roughly2.19 times greater than young drivers. Again, in the experiment, most of the keys wereletters and numbers. Shift and space, both of which had extreme values, were lesscommon.
25
0
1
2
3
4
5
Mea
n (s
)
Old
Middle
Young
Key type
SpaceCursor Letters ShiftEnter #s
Figure 14. Age and key effects for real interfaces.
Table 14. Mean keying times as a function of subject age.
AgeKey Category Young Middle OldCursor 0.80 0.90 1.13Enter 1.55 1.94 3.50Letters 1.51 2.13 2.75Numbers 1.12 2.07 2.43Shift 1.28 1.88 3.76Space 0.57 0.89 1.33Mean 1.13 1.64 2.48Ratio to young 1.45 2.19
Figure 15 shows the relationship between age, key type, and task. There were nopoints for enter and numbers for retrieval since those keys were not required for thattask. Cursor times were shorter for retrieval, perhaps because that key was used morefrequently and often several times in a row. Older subjects appeared to take longer totype letters for retrieval than for entry, although this could be a result of insufficientdata. Finally, middle-aged subjects took longer to press the shift key while retrievingdestinations than while entering them, with times almost as long as the older subjects.However, note in Figure 16, the small overall difference between middle-aged andolder subjects for destination retrieval.

26
Tim
e (s
)
0
0.5
1.0
1.5
2.0
2.53.0
3.54.0
Ent
er
Cur
sor
Lette
rs
Num
bers
Shi
ft
Spa
ce
Ent
er
Cur
sor
Lette
rs
Num
bers
Shi
ft
Spa
ce
Entry Retrieval
Old
Middle
Young
Old
Middle
Young
Figure 15. Keying times for real interfaces by task and key category.
1.01.21.41.61.82.02.22.42.62.8
Mea
n (s
)
Entry RetrievalTask
Old
Middle
Young
Figure 16. Interaction of task and age.
Estimation of mental time
There are several ways in which the time for a mental operation (M) can be estimated.In the entire data set, there were 154 instances where a digit sequence occurred butthere were no extra keystrokes. This occurred for only five of the 10 digits. The meantime for that type of keystroke was 3.37 seconds. As shown in Figure 17, the primarydifference is between 0 and other digits.

27
2.5
3.0
3.5
4.0
4.5
5.0
Mea
n (s
)
0 1 2 3 4
Digit
Figure 17. Times for initial digits by young subjects for real interfaces.
In a keystroke-level analysis, these sequences should be coded as one M (mental)operator followed by a sequence of K's (keystrokes). Ignoring these differences andusing 1.15 seconds as the time for other number keystrokes, suggests an additional2.22 seconds (3.37 minus 1.15) was required for the mental operator. As was noted inthe literature review, the standard time to mentally prepare is 1.35 seconds (Card,Moran, and Newell, 1983) while Olson and Nilsen (1987 and 1988) estimated a timeof 1.62 seconds. The larger value found here reflects situations where the subject wasunsure of what to do, violating the routine cognitive task assumption of the model. If avalue of 3.25 seconds is used for the initial keystroke time (the approximate mean ofdigits one through four), the estimate for M is only slightly less, 2.1 seconds, and stilllarger than values in the literature.
The one estimate not readily obtained from the data set is that for "other" keys becausethey were only used when there were excess keystrokes. Ignoring that constraint stillonly leaves 12 data points with a mean time of 3.48 seconds. It is presumed that meantime has an embedded mental operator.
Summary of the analysis process
Based on these data, a five step process emerged for calculating entry times for thesedata. The estimates are based on 36 drivers performing two imperfectly learned taskswith a specific device, so there are limitations to the data. However, they do provide areasonable basis for analysis.
Step 1: Select the base keystroke time
In developing a table method for determining keystroke times, both accuracy and easeof use were considered. In examining the various factors, it became apparent thatsome of the task differences (entry versus retrieval) were due to confounding with thenumber of repetitions. For that reason and for ease of calculation, task differenceswere omitted from the model. For shift and space, the mean time for the two tasks wasused. Combining Tables 20 and 21, the following values in Table 15 result.

28
Table 15. Keystroke times for young drivers.
KeystrokeKey Category 1st 2nd >2ndCursor 1.71 0.69 0.47Enter 1.55Letters 1.54 0.99Numbers 1.15 0.47Shift 1.46Space 0.60
Step 2: Adjust for the lighting conditions
If the key is one that people search for (enter, letter, or number), decrease the time bysix percent for dusk conditions. Increase the time by six percent for night conditions.Since this effect is relatively small, this step can be omitted if quick calculations areneeded.
Step 3: Adjust for age
Multiply the time by 1.4 for middle-aged drivers, 2.2 for older drivers. For older drivers,the times for shift and enter will be underestimated. However, since there are only afew of those keystrokes in a typical sequence, this is not a major problem.
Step 4: Use 2.22 seconds for mental time.
Step 5: Compute total time
Insert the appropriate values for K and M in the Keystroke-Level Model and computethe total task time.

29
DEVELOPMENT OF THE KEYSTROKE-LEVEL MODEL
Three steps were involved in developing keystroke-level models to predict destinationentry and retrieval times for the Ali-Scout navigation system.
1. Flowcharts were produced indicating all the steps needed to complete each task.2. Spreadsheets were generated to calculate the times for each task by adding up the
times for the steps identified in the flowcharts.3. Equations summarizing the calculations in the spreadsheet were formulated.
Step 1 - Production of flowcharts
The first step in producing the flowcharts was to analyze the destination retrieval andentry tasks in depth by examining every reasonable method a user could employ toaccomplish each part of each task. Methods described in the manual or accounted forby the design of the Ali-Scout were considered reasonable. One method that was notdescribed in the manual but was considered reasonable was that of pressing the shiftkey prior to each number key during coordinate entry. For alphanumeric fields, theuser was required to press the shift key prior to a number key, but for number-onlyfields (i.e., the coordinate fields), shifting was optional.
Furthermore, an important distinction was made between steps involving pressingbuttons (keystroke operators) and those involving thought (mental operators) inaccordance with GOMS terminology. Mental operators include verifying thecorrectness of what was just typed or making a decision about which key to press next.A third category—zero-time step—was added to help indicate branches in the modelthat were considered not to involve any processing time on the part of the user. Forexample, a user would probably not take any time to decide between methods forretrieving a destination if he or she had been using the same method for every trialand may not even have been aware of other methods.
As mentioned earlier, three methods were available for performing destinationretrieval (see Figure 18)—scroll, type, and hybrid. The scroll method involved usingthe up and down arrow keys to move through the list of destinations until the desiredname appeared on the display. The type method involved typing enough charactersof the destination name to uniquely identify it from all the other destinations in the list.The hybrid method involved typing one or more characters of the destination nameand then scrolling until the name appeared on the display.

30
Start
Scroll methodPress up/down cursor
Yes NoDone?
Hybrid MethodType letter
Done or start scrolling?
Press up/down cursor
Yes No
Stop
Type methodType letter
Done?Yes No
Done?
Done Scroll No
Repeat? Repeat? Repeat?
Repeat?
YesNo YesNo YesNo
YesNoKey
Keystroke operator
Mental operator
Zero-time step
Figure 18. Flowchart for destination retrieval.
In contrast to destination retrieval, there was only one overall method for enteringdestinations (see Figure 19), although there were several submethods from which thesubject could choose as he or she progressed through the task. As the flowchartindicates, the process began with the user typing the entire name of the destinationand possibly verifying the spelling once finished. At this point, the user may haveadvanced to the first coordinate field (longitude) either by pressing enter or the rightcursor key. If the cursor key was used, the user must choose a method for moving thecursor from the first to the fourth (last) position of the field since only the last fournumbers of each coordinate need to be entered. This could have been accomplishedby cursoring over (pressing the right-cursor key until the cursor is in the correct spot) ortyping over (typing the first few numbers as they already appeared on the display).Note that the cursor was automatically moved over to the correct spot when the enterkey was used.

31
Start
Press right cursor
Type letter
Verify name
Type number
Stop
Enter AdvancePress enter
KeyKeystroke operator
Mental operator
Zero-time step
Repeat?
Repeat?
Repeat?
Repeat?
YesNo
YesNo
YesNo
YesNo
Cursor Over
Verify?Yes No
Cursor AdvancePress right cursor
Type OverShift?
Yes NoPress shift
Read coordinate
Type number
Repeat?YesNo
Shift?Yes NoPress shift
Verify coordinate
Verify?Yes No
Direction letter?Yes NoType letter
Verify entry
Verify?Yes No
Press enter
Repeat?Yes No
Figure 19. Flow chart for destination entry.

32
The user must then read the last four digits of the first coordinate from the stimulus cardand type them in. The user may choose to press shift before typing each number, andhe or she may decide to verify the accuracy of the coordinates once all the digits havebeen typed. Yet another uncertainty is that the user may decide to type over thedirection letter (N) that appears after the last digit of the coordinate. From here, theprocess is repeated for the second coordinate. Finally, the user must press enter,possibly preceded by a final verification.
The end product of these two flow charts is a series of steps, many of which may ormay not occur and many of which are repeated a certain number of times based on thespecific destinations to be entered or retrieved. Also, many of the steps may onlyoccur if the user chooses a certain method. Thus, there is a fair amount of branchingto the task structure.
Step 2 - Generation of the spreadsheets
A spreadsheet was created for both destination retrieval and entry in which totalpredicted times were calculated for each age group, lighting condition, and destinationcard. Each spreadsheet consists of a summary table and several lookup tables. Thesummary tables contain predicted times for high-level steps and the overall task, whilethe lookup tables contain adjustment factors for the different age groups and lightingconditions, keystroke (i.e., operator) times, and method probabilities (how often onemethod was expected to be chosen versus another). The values in the summary tableare a function of the information in the lookup tables. Note that some of the valuesused in the spreadsheets were taken from analyses of the experimental data(described in the results section).
The summary table for the destination retrieval spreadsheet (see Table 16) containscolumns for the experimental factors (age, lighting condition, and cards), the threeprimary methods (scroll, hybrid, and type), and the predicted task time. The task timeis based on the time for each method, the probability of each method occurring, andthe age adjustment factor. One set of lookup tables (see Tables 17) contains the ageand lighting-condition adjustment factors, the keystroke times, and the methodprobabilities. A second set of lookup tables (see Table 18, 19, and 20) contains theestimated times for each method across all the cards and for both lighting conditions.
Table 16. Portion of the summary table of the retrieval spreadsheet showingthe predicted times for the three methods (columns D and E) and
the overall task (column G).

33
Table 17. Lookup tables for the retrieval spreadsheet showing adjustment factors,keystroke times, and method probabilities.
Table 18. Lookup table for the retrieval spreadsheet showing the time for the scrollmethod by card and lighting condition.

34
Table 19. Lookup table for the retrieval spreadsheet showing the time for the hybridmethod by card and lighting condition.
Table 20. Lookup table for the retrieval spreadsheet showing the time for the typemethod by card and lighting condition.
The summary table for the destination entry spreadsheet (see Table 21) containscolumns for the experimental factors (age, lighting condition, and cards), the major

35
steps in the process, and the predicted task time. The major steps, which are basedon the entry flow chart (Figure 19) consists of (1) typing the name, (2) advancing to thelongitude field, (3) moving the cursor over, (4) entering the longitude, (5) advancing tothe latitude field, (6) moving the cursor over, (7) entering the latitude, and (8) pressingenter. The task time is based on the time for each step as well as the age adjustmentfactor. One set of lookup tables (Table 22) contains the age and lighting-conditionadjustment factors, the keystroke times, and several groups of method probabilities forboth longitude and latitude. A second set of lookup tables (Tables 23 and 24) containthe estimated times for typing the destination name and entering the longitude andlatitude across all the cards and for both lighting conditions.
Table 21. Portion of the summary table of the entry spreadsheet, showing thepredicted times for each step (columns D through O) and the overall task (column P).

36
Table 22. Lookup tables for the entry spreadsheet showing adjustment factors,keystroke times, and method probabilities.

37
Table 23. Lookup table for the entry spreadsheet showing the time for typing thename by card and lighting condition.

38
Table 24. Lookup tables for the entry spreadsheet showing the time to enter thecoordinates, advance the cursor, and move the cursor over.

39
Step 3 - Formulation of equations
Equations for calculating the total predicted time for destination retrieval and entrywere generated by extracting the appropriate spreadsheet formulas and replacing thecell references (e.g., A5) with more meaningful symbols. The symbols (see Table 25)are in the form Elementobject, where the element can be a time, number, probability, oradjustment factor and the object can be a task, method, operator, or variable. Forinstance, Tentry refers to the time to enter a single destination while Alight is a multiplierwhose value varies according to the lighting condition.
Table 25. The coding scheme used for the equations.
Element Symbol DescriptionTime Tx Time for task, method, or operator xNumber Nx Number of times method or operator x occursProbability Px Probability of method or operator x occurringAdjustment factor Ax Adjustment factor for variable x
The total retrieval time (see Table 26) is calculated by multiplying the time for eachmethod (scroll, hybrid, and type) by the probability of that method occurring, thentaking the sum of these products, and, finally, multiplying this sum by the ageadjustment factor. The time for the scroll method is a function of the number of scrolls,which, in turn, is a function of the probability that the user chooses the optimal scrolldirection.
Table 26. Equations for calculating the total retrieval time.
Eq # Equation1 Tretrieval = Aage * (PscrollTscroll + PhybridThybrid + PtypeTtype)
1.1 Tscroll = T2nd cursor + (Nscrolls - 2) * T>2nd cursor1.2 Thybrid = Nshifts (hybrid)Tshift + AlightNletters (hybrid)Tletter + N1st cursorsT1st
cursor + N2nd cursorsT2nd cursor + N>2nd cursorsT>2nd cursor1.3 Ttype = Nshifts (type)Tshift + NspacesTspace + AlightNlettersTletter
1.1.1 Nscrolls = Pideal * min(Nup cursors, Ndown cursors) + (1 - Pideal) *max(Nup cursors, Ndown cursors)
1.1.1.1 Pideal = the probability that the user chooses the fastest direction toscroll
Note: These equations do not take into account the first keystroke of the task since thiswas not timed during the experiment.
The equations for the total entry time appear in Table 27. This time is calculated byadding up the times for each of 12 steps (see equations 1.1 through 1.12) andmultiplying this sum by the age adjustment factor. Moving the cursor over within thelongitude and latitude fields is accomplished either by cursoring over or typing over.

40
Table 27. Equations for calculating the total entry time.
Eq # Equation1 Tentry = Aage * (1.1 + 1.2 + 1.3 + ... + 1.10 + 1.11 + 1.12)
1.1 Ttype name = AlightN1st lettersT1st letters + AlightN2nd lettersT2nd letter +NshiftsTshift + NspacesTspace
1.2 Tadvance (lon) = Pcurs advance (lon)T1st curs + AlightPenter advance (lon)Tenter1.3 Tmove over
(lon)= Pcurs over (lon)Tcurs over (lon) + Ptype over (lon)Ttype over (lon)
1.4 Tread (lon) = Tmental1.5 Tenter (lon) = Pshift, num * (4Tshift + AlightN1st nums (lon)T1st num +
AlightN2nd nums (lon)T2nd num) + Pnum * (AlightN1st nums (lon)T1st
num + AlightN2nd nums (lon)T2nd num)1.6 Tdir letter (lon) = Pdir letter (lon)T1st letter1.7 Tadvance (lat) = Pcurs advance (lat)T1st curs +
AlightPenter advanceTenter advance (lat)Tenter1.8 Tmove over
(lat)= Pcurs over (lat)Tcurs over (lat) + Ptype over (lat)Ttype over (lat)
1.9 Tread (lat) = Tmental1.10 Tenter (lat) = Pshift, num * (4Tshift + AlightN1st nums (lat)T1st num +
AlightN2nd nums (lat)T2nd num) + Pnum * (AlightN1st nums (lat)T1st
num +AlightN2nd nums (lat)T2nd num)
1.11 Tdir letter = Pdir letter (lat)T1st letter1.12 Tpress enter = Tenter1.3.1 Tcurs over (lon) = T2nd curs + 2T>2nd curs1.3.2 Ttype over
(lon)= Pshift, num * 3 * (Tshift + AlightT1st num) + PnumAlightT1st num
1.8.1 Tcurs over (lat) = T2nd curs + T>2nd curs1.8.2 Ttype over (lat) = Pshift, num * 2 * (Tshift + AlightT1st num) + PnumAlightT1st numNote: These equations do not take into account the first keystroke of the task since this
was not timed during the experiment.lon = longitude, lat = latitude

41
EVALUATION OF THE KEYSTROKE-LEVEL PREDICTIONS
Five sets of predictions based on the keystroke-level analyses were compared with thetrial times from the experiment. These included:
1. A standard keystroke-level analysis (as implemented in Kieras, 1988) where Kwas assumed to be 1.2 seconds (worst typist) and M was 1.35 seconds.
2. A modified analyses using values of K and M more typical of this experiment (1.5and 2.2 seconds respectively).
3. A standard keystroke-level analysis (K=1.2, M=1.35) with adjustments for age(multiple by 1.4 for middle-aged subjects, 2.2 for older subjects).
4. A tailored keystroke-level analysis that had unique K values for each category,adjustments for repetitions, adjustments for lighting, but no adjustments for age.
5. A tailored keystroke-level analysis that had unique K values for each category,adjustments for repetitions, adjustments for lighting, and adjustments for age.
For each set of predictions, regression plots were generated for both entry andretrieval, for both young subjects (the best case) and all subjects. Figures 20 and 21show the results for the best of the five sets, the tailored keystroke-level model. (SeeAppendix A for the full set of plots.) Correlations ranged from 0.70 to 0.91, with thosefor retrieval being higher than those for entry, and those for young subjects beinghigher than those for all subjects. Readers should keep in mind that the actual timesare not the true times, but only experimental estimates. From that viewpoint, thecorrelations reported are quite good. The higher correlations for the retrieval task maysuggest that it had become more routine than the entry task, especially among youngsubjects. Since one of the assumptions of the GOMS models is that the task beroutine, it makes sense that the model for the task with fewer steps to learn and masterwould be more accurate. Furthermore, the ability to build successful keystroke-levelmodels may also be a factor of the total time for the task, with shorter tasks beingeasier to predict than longer ones. Finally, it is no surprise that predictions for youngsubjects were more reliable than those for all subjects pooled together since youngerpeople tend to learn new tasks more quickly and perform them more fluidly.

42
-2.5
2.5
7.5
12.5
17.5
22.5A
ctua
l Tim
e
0 2 4 6 8 10 12 14Predicted Time
Y = .039 + 1.054 * X; R2 = .58
-2
0
2
4
6
8
10
12
Act
ual T
ime
0 1 2 3 4 5 6 7Predicted Time
Y = -1.585 + 1.447 * X; R2 = .83
All subjects Young subjects only
Figure 20. Actual versus predicted times for destination retrieval using all the data(left) and only the data from young subjects (right).
15202530354045505560
Act
ual T
ime
26 28 30 32 34 36 38 40 42 44Predicted Time
Y = -17.494 + 1.445 * X; R2 = .49
102030405060708090
100
Act
ual T
ime
20 30 40 50 60 70 80 90Predicted Time
Y = 12.288 + .644 * X; R2 = .47
All subjects Young subjects only
Figure 21. Actual versus predicted times for destination entry using all the data (left)and only the data from young subject (right).
Table 28 shows the regression equations and predictive equations for allcombinations examined. The extent to which particular factors predicted performancevaried quite widely from situation to situation. For example, the standard keystroke-level predictions accounted for 78 percent of the variance of actual retrieval times foryoung subjects, a fairly high value. However, when all subjects were included, thevalue dropped to 41 percent. For entry by young subjects, 38 percent of the variancewas accounted for, while the value for all subjects was quite low, 12 percent.

43
Table 28. Regression equations and correlations for various models.
Retrieval Young All SubjectsEquation R2 Equation R2
standard Keystroke-LevelModel(K=1.2, M=1.35)
Y=-2.381 + 1.380 X 0.784 Y=-1.839 + 1.759 X 0.414
modified keystroke model(K=1.5, M=2.2)
Y=-2.381 + 1.104 X 0.784 Y=-1.839 + 1.407 X 0.414
standard model (K=1.2,M=1.35) with ageadjustment(young=1, middle=1.4,old=2.2)
Y=-0.352 + 0.935 X 0.540
tailored model(various K's, M=2.2,lighting values,no age adjustments)
Y=-0.853 + 1.851 X 0.443
tailored model(various K's, M=2.2,lighting values,age adjustments)
Y=-1.585 + 1.447 X 0.832 Y=0.039 + 1.054 X 0.583
Entry
standard Keystroke-LevelModel(K=1.2, M=1.35)
Y=-17.057 + 1.613 X 0.385 Y=-12.962 + 1.851 X 0.123
modified keystroke model(K=1.5, M=2.2)
Y=-18.379 + 1.290 X 0.385 Y=-14.479 + 1.480 X 0.123
standard model (K=1.2,M=1.35) with ageadjustment(young=1, middle=1.4,old=2.2)
Y=13.57 + 0.692 X 0.454
tailored model(various K's, M=2.2,lighting values,no age adjustments)
Y= -7.689 + 1.498 X 0.119
tailored model(various K's, M=2.2,lighting values,age adjustments)
Y=-17.494 + 1.445 X 0.486 Y=12.288 + 0.644 X 0.472
Y is the actual time, X is the prediction.

44
Notice that using keystroke-level values based on the experiment (K=1.5, M=2.2) doesnot improve the correlation, but it does reduce the size of the adjustment necessary tofit the actual data. Depending on the condition, the multiplier drops from about 1.4 to1.9 to 1.1 to 1.5. In all cases, some adjustment to the intercept is also necessary,complicating the adjustment. These adjustments should be made to keystroke-levelestimates where differences in the relative or absolute size of alternative interfaces areof interest.
Another important insight from the data is that the primary adjustment needed is forsubject age. For example, for all subjects, adding adjustments for age to the basickeystroke-level model raised the R2 from 0.41 to 0.54 whereas adding adjustments foreverything but age (lighting, Ks tailored for each character group, repetitions, a revisedM) only raised the correlation to 0.44. To put these values in perspective, the best model (all factors included) had an R2 of 0.58 and needed minimal additionaladjustments to predict actual times. Thus, these data highlight the importance ofadjustments for age. For quick hand calculations, there may not be much value inusing tailored values to adjust for the specific key type or repetition effects, if rankorders of alternative interfaces are desired. For exact estimates of alternatives, thetailored keystroke-level models gave the best predictions and required the fewest posthoc adjustments to predict actual times, especially for retrieval tasks.

45
CONCLUSIONS
Overall, these data suggest that a keystroke-based model can be used to providereasonable estimates of driver performance in destination entry and retrieval whenthese tasks are performed alone. However, estimates based on textbook data arelikely to grossly underestimate real world performance. New values are required formodel parameters and additional adjustments are needed to provide the desiredaccuracy as described below.
What are typical keystroke and mental operator times?
The time per keystroke depends on the particular character typed. While this is quiteevident in the typing literature (Evey, 1980), these differences are ignored in traditionalkeystroke-level analyses. For young subjects, mean interkeystroke intervals wereabout 1.7 seconds for initial cursor keystrokes, 1.5 seconds for initial enter, letters, andshift keystrokes, 1.15 seconds for numbers, and 0.6 seconds for space. These timesare consistently larger than those in the GOMS literature (0.5 s/keystroke for typingrandom letters, 0.7 s/keystroke for complex codes, or 1.2 s/keystroke for a worst typist).Larger values were obtained here due to poor keyboard tactile feedback, small keysize, and delays due to mental activity (as the keying task was not fully learned).
Repetition effects are well known, but previously they have been ignored in keystroke-level analyses. Depending on the key type, a second repeated keystroke requiresabout half (plus or minus 10 percent) of the time for the initial keystroke. Subsequentkeystrokes are about 30 percent of the time for the initial keystroke. Specifically,second keystrokes were about 1 second for letters, 0.7 seconds for cursor actions, and0.5 seconds for numbers, times comparable to those reported in the literature fortyping complex codes (.75 s/keystroke). For more than 2 cursor keystrokes, times wereabout 0.5 seconds.
Keystroke times were also affected by lighting, but the impact of lighting was lesspronounced than for other factors (though basically only a limited range of darkconditions were examined). Baseline times should be increased by six percent fornight conditions, decreased by six percent for dusk.
Age differences were large and depended on the key typed. On average, middle-aged drivers took 1.45 times longer than younger drivers, while for older drivers, thedifference was a factor of 2.19. However, there were some differences between keytypes. For example, shift key operations took much longer for older subjects, probablybecause the keypress included an embedded mental operator. This suggests that forolder drivers for some tasks, additional mental operators need to be added topredictions. For simplicity, it is recommended that times should also be adjusted forage, multiplying times for young subjects by 1.4 to estimate performance for middle-aged subjects and 2.2 for older subjects.
Not only do textbook values underestimate keying times, but mental times areunderestimated as well. Mental times were about 2.2 seconds, a value 62 percentgreater than those reported in the literature (1.35 s).

46
How well did keystroke models predict overall times?
R2 from equations linking predicted and actual times ranged from approximately 0.1 to0.8 for the unmodified keystroke-level model and 0.5 to 0.8 for the tailored model.Readers are again reminded that the actual values are really estimates of the truetimes, and from that perspective, the models were accounting for a significant fractionof the total variance. Further, the entry and retrieval tasks were not fully learned in allcases, that is, executing them did not only involve routine cognitive skill. However, thisis true of many of the tasks that drivers will perform with in-vehicle information systems.Procedures are needed to determine where mental processes may sometimes occurand the time required for them.
Correlations were greater for younger drivers than for older drivers and greater forretrieval than for destination entry. Of the various improvements to the basic modelexplored (tailored Ks and Ms, adjustments for lighting, etc.), the single most importantadjustment was for age, with the age multipliers alone (1.4 for middle-aged drivers, 2.2for older drivers as was noted earlier) leading to basic keystroke-level predictions thatwere almost as good as the tailored model. Further adjustments required use of twoparameter corrections (slope and intercept) to the predictions.
Thus, overall these data suggest that reasonable predictions of task completion timecan be obtained from keystroke-level estimates of driver performance. However, thesedata also suggest that using age adjustments (that may be task specific) are desired.For exact predictions, tailored estimates of M and K may also be desired. Finally,these data suggest using a larger value of M than is reported in the literature, and thatkey type differences, driver age, repetition effects, and lighting conditions may warrantconsideration.
As was noted at the outset of this report, manufacturers of equipment often do not havethe time or resources to experimentally evaluate every user interface or interfacemodification they produce. Accordingly, there are many potential opportunities forkeystroke-level models. This report provides data for improving the accuracy ofkeystroke-level estimates, especially for applications where the task has yet to becomeingrained and the interface is far from ideal (the real world). While the estimates arehighly parameterized to the specific tasks investigated, the authors believe the tasksexamined are similar to those in a wide variety of practical contexts. Further, the rulesof thumb developed for correcting for age and key repetitions should also be generallyuseful. Readers who apply these estimates to other interfaces are encouraged tocontact the authors with their results.
What should occur next?
Since destinations are often entered and retrieved while people drive, the next logicalstep, if funding was available, would be to examine timeshared performance. Ofinterest is whether performance in that situation can be predicted using a simplemultiplicative scaling factor and laboratory data, or if a more sophisticated, process-oriented model is needed.

47
REFERENCES
Barbaresso, J.C. (1994). Preliminary Findings and Lessons Learned from the FAST-TRAC IVHS Program, Proceedings of the IVHS America 1994 Annual Meeting ,volume 1, Washington, D.C.: IVHS America, 489-497.
Beevis, D. and St. Denis, G. (1992). Rapid Prototyping and the Human FactorsEngineering Process, Applied Ergonomics , 23 (3), 155-160.
Berger, C., Walton, C., and Wurman, P. (1993). The Event Recorder (version 5.2), AnnArbor, MI: The University of Michigan, Office of Instructional Technology.
Card, S.K., Moran, T.P., and Newell, A. (1980). The Keystroke-Level Model for UserPerformance Time with Interactive Systems, Communications of the ACM , July,23 (7), 396-410.
Card, S.K., Moran, T.P., and Newell, A. (1983). The Psychology of Human-ComputerInteraction , Hillsdale, NJ: Lawrence Erlbaum Associates.
Cooper, W.E. (ed). (1983). Cognitive Aspects of Skilled Typewriting , Berlin, Germany:Springer-Verlag.
Detweiler, M.C. (1990). Alphabetic Input on a Telephone Keypad, Proceedings of theHuman Factors Society 34th Annual Meeting , Santa Monica, CA: HumanFactors Society, 212-216.
Eby, D.W., Streff, F.M., Wallace, R.R., Kostyniuk, L.P., Hopp, M.L., and Underwood, S.(1996). An Evaluation of User Perceptions and Behaviors of FAST-TRAC: PilotStudy Results (Technical Report UMTRI-96-14), Ann Arbor, MI: The University ofMichigan Transportation Research Institute.
Evey, R.J. (1980). How Typists Type (IBM Technical Report HFC-35), San Jose, CA:IBM General Products Division, Human Factors Center.
Green, P., Boreczky, J., and Kim, S. (1990). Applications of Rapid Prototyping toControl and Display Design. (SAE paper #900470, Special Publication SP-809), Warrendale, PA: Society of Automotive Engineers.
Green, P., Levison, W., Paelke, G., and Serafin, C. (1995). Preliminary Human FactorsGuidelines for Driver Information Systems (Technical Report FHWA-RD-94-087), McLean, VA: U.S. Department of Transportation, Federal HighwayAdministration.
Green, P. and Olson, A. (1997). A Technical Description of the UMTRI DrivingSimulator Family-1996 Implementation (Technical Report UMTRI 97-12), AnnArbor, MI: University of Michigan Transportation Research Institute (inpreparation).

48
Haunold, P. and Kuhn, W. (1994). A Keystroke Level Analysis of a GraphicsApplication: Manual Map Digitizing, CHI'94 Proceedings , New York: Associationfor Computing Machinery, 337-343.
Katz, S., Fleming, J., Hunter, D.R., Green, P., and Damouth, D. (1996). On-the-RoadHuman Factors Evaluation of the Ali-Scout Navigation System (TechnicalReport UMTRI-96-32), Ann Arbor, MI: The University of Michigan TransportationResearch Institute.
Katz, S., Green, P. , and Fleming, J. (1995). Calibration and Baseline Driving Data forthe UMTRI Driver Interface Research Vehicle , (Technical Report UMTRI-95-2),Ann Arbor, MI: The University of Michigan Transportation Research Institute.
Kieras, D. (1988). Towards a Practical GOMS Model Methodology for User InterfaceDesign, Chapter 7 in M. Helander (ed.) Handbook of Human-ComputerInteraction , New York: Elsevier Science, 135-157.
Kostyniuk, L. and Eby, D. (1996). Natural Use/Yoke Study Survey (Technical ReportEECS-ITS LAB-FT95-018), Ann Arbor, MI: The University of Michigan IntelligentTransportation Systems Center.
MacAdam, C.C., Green, P.A., and Reed, M.P. (1993). An Overview of Current UMTRIDriving Simulators, UMTRI Research Review , July-August, 24 (1), 1-8.
Manes, D., Green, P., and Hunter, D. (1996). Glance Frequencies to the Ali-ScoutNavigation System (Technical Report UMTRI-96-42), Ann Arbor, MI: TheUniversity of Michigan Transportation Research Institute (in preparation).
Manes, D., Green, P., and Hunter, D. (1996). Prediction of Destination Entry andRetrieval Times Using GOMS (Technical Report UMTRI-96-37), Ann Arbor, MI:The University of Michigan Transportation Research Institute.
Olson, A. and Green, P. (1997). A Description of the UMTRI Driving SimulatorArchitecture and Alternatives (Technical Report UMTRI-97-15), Ann Arbor, MI:The University of Michigan Transportation Research Institute.
Paelke, G.M. (1993). A Comparison of Route Guidance Destination Entry Methods,Proceedings of the Human Factors and Ergonomics Society 37th AnnualMeeting-1993 , Santa Monica, CA: The Human Factors and Ergonomics Society,569-573.
Paelke, G. and Green, P. (1993). Entry of Destinations into Route Guidance Systems:A Human Factors Evaluation (Technical Report UMTRI-93-45), Ann Arbor, MI:The University of Michigan Transportation Research Institute.
Siemens Automotive (undated). Ali-Scout Navigation System User's Guide, AuburnHills, MI: Siemens Automotive.

49
Segal, L.D. and Andre, A.D. (1993). Activity Catalog Tool (A.C.T.) v 2.0 User Manual (NASA Contractor Report CR 177634), Moffett Field, CA: NASA AmesResearch Center.
Steinfeld, A., Manes, D., Green, P., and Hunter, D. (1996). Destination Entry andRetrieval with the Ali-Scout Navigation System (Technical Report UMTRI-96-30),Ann Arbor, MI: The University of Michigan Transportation Research Institute.
Taylor, W. and Wu, J. (1995). A Database System Containing MOE's of Interest to theEvaluation (Technical Report EECS-ITS LAB FT95-028), Ann Arbor, MI: TheUniversity of Michigan Intelligent Transportation Center.
Treece, J.B. (1996). In Japan, Car Buyers Put Navigation Devices at the Top of TheirList, Automotive News , September 16, 1996, 3 & 24.
Underwood, S.E. (1994). FAST-TRAC: Evaluating an Integrated Intelligent Vehicle-Highway System, Proceedings of the IVHS America 1994 Annual Meeting , 1 ,Washington, D.C.: IVHS America, 300-311.
Verwey, W.B. (1996). Buffer Loading and Chunking in Sequential Keypressing,Journal of Experimental Psychology: Human Perception and Performance ,22 (3), 544-562.
Zwahlen, H.T., Adams, C.C. Jr., and DeBald, D.P. (1988). Safety Aspects of CRTTouch Panel Controls in Automobiles, in Gale, A.G., Freeman, M.H.,Haslegrave, C.M., Smith, P., and Taylor, S.P., Vision in Vehicles II , Amsterdam,Netherlands: Elsevier Science, 335-344.
Zwahlen, H.T. and DeBald, D.P. (1986). Safety Aspects of Sophisticated In-VehicleInformation Displays and Controls. Proceedings of the Human Factors Society- 30th Annual Meeting , Santa Monica, CA: Human Factors Society, 256-260.

50

51
APPENDIX A - REGRESSION PLOTS OF VARIOUS KEYSTROKE-LEVELMODELS
Note: In the figures and tables that follow, KLM is used as a shorthand to indicatepredictions ofvariations of the Keystroke-Level Model.

52
RETRIEVAL
Young All Subjects
Basic K eystroke- L evel M odel (K=1.2, M=1.35)
0
2
4
6
8
10
12
Act
ual T
ime
1 2 3 4 5 6 7 8KLM
Actual Time = -2.381 + 1.38 * KLM R^2 = .784
Retrievalyoung subjects
2.5
7.5
12.5
17.5
22.5
Act
ual T
ime
1 2 3 4 5 6 7 8KLM
Actual Time = -1.839 + 1.759 * KLMR^2 = .414
Retrievalall subjects
Improved K & M (K=1.5, M=2.2)
Actual Time = -2.381 + 1.104 * KLM.kR^2 = .784
0
2
4
6
8
10
12
Act
ual T
ime
2 3 4 5 6 7 8 9 10KLM.k
Retrievalyoung subjects
2.5
7.5
12.5
17.5
22.5
Act
ual T
ime
2 3 4 5 6 7 8 9 10KLM.k
Actual Time = -1.839 + 1.407 * KLM.kR^2 = .414
Retrievalall subjects

53
Keystroke model with a ge adjustment (y,mid,old=1.0, 1.4, 2.2)
same as basic KLM for retrieval withoutage adjustment
2.5
7.5
12.5
17.5
22.5
Act
ual T
ime
0 2 4 6 8 10 12 14 16 18KLM.a
Actual Time = -.352 + .935 * KLM.aR^2 = .54
Retrievalall subjects
Tailored model n o a ge adjustment (various K's, M=2.2, lighting adjust.)
0
2
4
6
8
10
12
Act
ual T
ime
0 1 2 3 4 5 6 7KLM.na
Actual Time = -1.585 + 1.447 * KLM.naR^2 = .832
Retrievalyoung subjects
2.5
7.5
12.5
17.5
22.5
Act
ual T
ime
0 1 2 3 4 5 6 7KLM.na
Actual Time = -.853 + 1.851 *KLM.naR^2 = .443
Retrievalall subjects

54
T ailored model with age adjustment (various K's, M=2.2, lighting adjust.)
0
2
4
6
8
10
12
Act
ual T
ime
0 1 2 3 4 5 6 7KLM.t
Actual Time = -1.585 + 1.447 * KLM.tR^2 = .832
Retrievalyoung subjects
2.5
7.5
12.5
17.5
22.5
Act
ual T
ime
0 2 4 6 8 10 12 14
Actual Time = .039 + 1.054 *KLM.tR^2 = .583
Retrievalall subjects
KLM.t
ENTRY
Basic K eystroke- L evel M odel (K=1.2, M=1.35)
15202530354045505560
Act
ual T
ime
26 28 30 32 34 36KLM
Actual Time = -17.057 + 1.613 * KLMR^2 = .385
Entryyoung subjects
102030405060708090
100
Act
ual T
ime
26 28 30 32 34 36KLM
Actual Time = -12.962 + 1.851 * KLMR^2 = .123
Entryall subjects

55
Improved K & M (K=1.5, M=2.2)
15202530354045505560
Act
ual T
ime
32 34 36 38 40 42 44 46 48KLM.k
Actual Time = -18.379 + 1.29 *KLM.kR^2 = .385
Entryyoung subjects
102030405060708090
100
Act
ual T
ime
32 34 36 38 40 42 44 46 48KLM.k
Actual Time = -14.479 + 1.48 * KLM.kR^2 = .123
Entryall subjects
Keystroke model with a ge adjustment (y,mid,old=1.0, 1.4, 2.2)
same as basic KLM for entry without ageadjustment
102030405060708090
100
Act
ual T
ime
20 30 40 50 60 70 80 90KLM.a
Actual Time = 13.57 + .692 * KLM.aR^2 = .454
Entryall subjects

56
Tailored model n o a ge adjustment (various K's, M=2.2, lighting adjust.)
15202530354045505560
Act
ual T
ime
26 28 30 32 34 36 38 40 42 44KLM.na
Actual Time = -17.494 + 1.445 * KLM.naR^2 = .486
Entryyoung subjects
102030405060708090
100
Act
ual T
ime
26 28 30 32 34 36 38 40 42 44KLM.na
Actual Time = -7.689 + 1.498 * KLM.naR^2 = .119
Entryall subjects
T ailored model with age adjustment (various K's, M=2.2, lighting adjust.)
15202530354045505560
Act
ual T
ime
32 34 36 38 40 42 44 46 48KLM.t
Actual Time = -18.379 + 1.29 * KLM.tR^2 = .385
Entryyoung subjects
102030405060708090
100
Act
ual T
ime
20 30 40 50 60 70 80 90KLM.t
Actual Time = 12.288 + .644 * KLM.tR^2 = .472
Entryall subjects