Embed Size (px)
Citation preview
UMR/NE-TFTL-05-03
TASK 4-5: INTERFACIAL AREA TRANSPORT INHORIZONTAL TWO-PHASE FLOW THROUGH VARIOUS
FLOW RESTRICTIONS
Data Report for Slug Flow in Air/Water Horizontal Two-phase Flow with 90-degree Elbow
Submitted to
The U.S. Nuclear Regulatory Commission.Two White Flint North11545 Rockville PikeRockville, MD 20852
by
Seungjin Kim, Justin Talley and Kennard Callender
UMRUNIVERSITY OF MISSOURI-ROLLA
University of Missouri-RollaNuclear Engineering
219 Fulton Hall A 1870 Miner Circlee Rolla, MO 65409-0170Phone: (573) 341-6780 e Fax: (573) 341-6309
December 2005

UMRINE-TFTL-05-03
TASK 4-5:HORIZONTAL
INTERFACIAL AREA TRANSPORT INTWO-PHASE FLOW THROUGH VARIOUS
FLOW RESTRICTIONS
Data Report for Slug Flow in Air/Water Horizontal Two-phase Flow with 90-degree Elbow
Submitted to
The U.S. Nuclear Regulatory CommissionTwo White Flint North11545 Rockville PikeRockville, MD 20852
by
Seungjin Kim, Justin Talley and Kennard Callender
UMRUNIVERSITY OF MISSOURI-ROLLA
University of Missouri-RollaNuclear Engineering
219 Fulton Hall e 1870 Miner Circle • Rolla, MO 65409-0170Phone: (573) 341-6780 • Fax: (573) 341-6309
December 2005

UMR/NE-05-03
TASK 4.5: INTERFACIAL AREA TRANSPORT IN HORIZONTALTWO-PHASE FLOW THROUGH VARIOUS FLOW RESTRICTIONS
Data Report for Slug Flow in Air/Water Horizontal Two-phaseFlow with 90-degree Elbow
Seungjin Kim, Justin Talley and Kennard Callender
Prepared for
The U.S. Nuclear Regulatory CommissionTwo White Flint North11545 Rockville PikeRockville, Md 20852
University of Missouri-RollaNuclear Engineering
219 Fulton Hall a 1870 Miner Circle * Rolla, MO 65409-0170Phone: (573) 341-6780 9 Fax: (573) 341-6309

ACKNOWLEDGEMENT
The data analysis presented in this report is based on the experiment performed by the
University of Wisconsin, Milwaukee. This work was supported by the US NRC Office
of Nuclear Regulatory Research.
iii
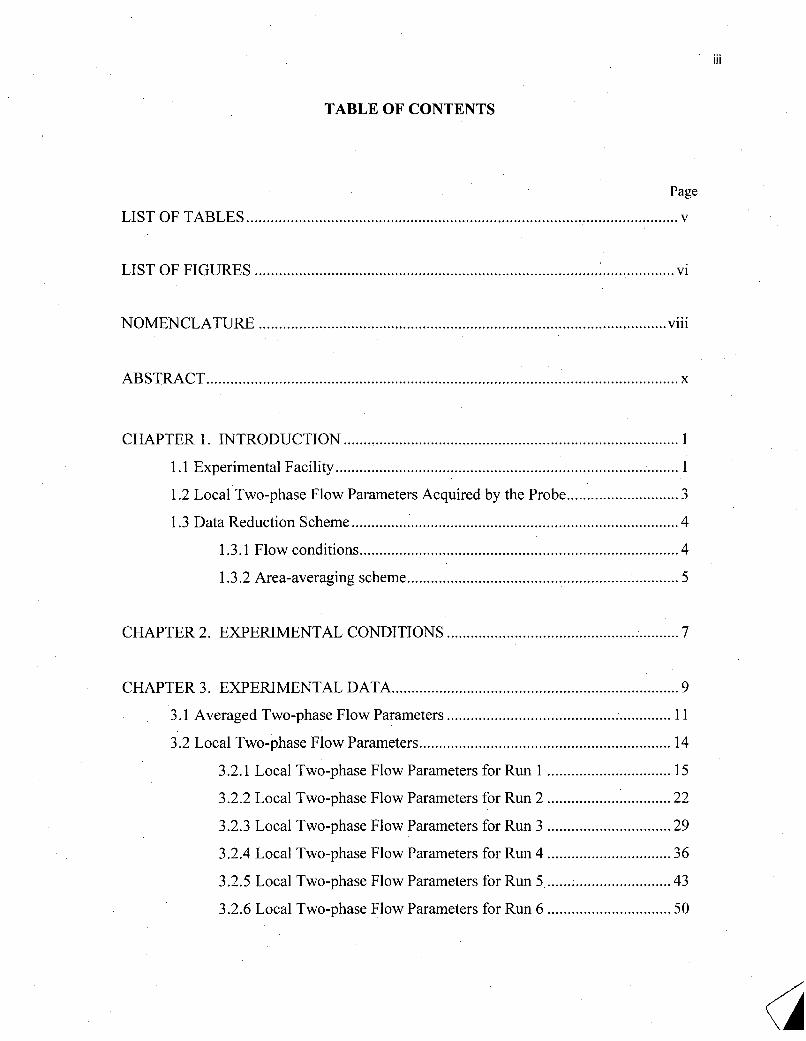
TABLE OF CONTENTS
Page
LIST O F TA B L E S ........................................................................................................ v
LIST O F FIG U R E S ..................................................................................................... vi
N O M EN C LA TU R E ...................................................................................................... viii
A B ST R A C T ....................................................................................................................... x
CHAPTER 1. INTRODUCTION .................................................................................... 1
1.1 E xperim ental Facility ...................................................................................... I
1.2 Local Two-phase Flow Parameters Acquired by the Probe ....................... 3
1.3 D ata Reduction Schem e ............................................................................. 4
1.3.1 Flow conditions ........................................................................... 4
1.3.2 A rea-averaging schem e ........................................................ ............ 5
CHAPTER 2. EXPERIMENTAL CONDITIONS ..................................................... 7
CHAPTER 3. EXPERIMENTAL DATA .................................................................... 9
3.1 Averaged Two-phase Flow Parameters ........................................................ 11
3.2 Local Two-phase Flow Parameters .......................................................... 14
3.2.1 Local Two-phase Flow Parameters for Run 1 ........................... 15
3.2.2 Local Two-phase Flow Parameters for Run 2 .............. 22
3.2.3 Local Two-phase Flow Parameters for Run 3 ................ ............... 29
3.2.4 Local Two-phase Flow Parameters for Run 4 .......................... 36
3.2.5 Local Two-phase Flow Parameters for Run 5 ........................... 43
3.2.6 Local Two-phase Flow Parameters for Run 6 .......................... 50
iv
Page
3.2.7 Local Two-phase Flow Parameters for Run 7 .......................... 57
3.2.8 Local Two-phase Flow Parameters for Run 8 .......................... 64
3.2.9 Local Two-phase Flow Parameters for Run 9 .......................... 71
3.2.10 Local Two-phase Flow Parameters for Run 10 ...................... 78
3.2.11 Local Two-phase Flow Parameters for Run 11 ...................... 85
3.2.12 Local Two-phase Flow Parameters for Run 12 ................... 92
3.2.13 Local Two-phase Flow Parameters for Run 13 .................... 99
3.2.14 Local Two-phase Flow Parameters for Run 14 ......................... 104
3.2.15 Local Two-phase Flow Parameters for Run 15 ......................... 109

v
LIST OF TABLES
Table Page
2.1 Summary of the test conditions in the present report ................................... 8
3.1 Summary of data acquired in the air-water slug flow through
a horizontal tube of 50.3 mm inner diameter with a 90-degree
elbow junction ...... I ..................................... 12
3.2.1 Local two-phase flow parameters for Run 1 ....................... 16
3.2.2 Local two-phase flow parameters for Run 2 ............................................... 23
3.2.3 Local two-phase flow parameters for Run 3 ....................... 30
3.2.4 Local two-phase flow parameters for Run 4 ............................................... 37
3.2.5 Local two-phase flow parameters for Run5 .................5............................ 44
3.2.6 Local two-phase flow parameters for Run 6 ............................................... 51
3.2.7 Local two-phase flow parameters for Run 7 ............................................... 58
3.2.8 Local two-phase flow parameters for Run 8 ................................................ 65
3.2.9 Local two-phase flow parameters for Run 9 ......................... ...................... 72
3.2.10 Local two-phase flow parameters for Run 10 ............................................. 79
3.2.11 Local two-phase flow parameters for Run 11 .............................................. 86
3.2.12 Local two-phase flow parameters for Run 12 ...................... 93
3.2.13 Local two-phase flow parameters for Run 13 ............................................... 100
3.2.14 Local two-phase flow parameters for Run 14 ................................................ 105
3.2.15 Local two-phase flow parameters for Run 15 ................................................ 110

vi
LIST OF FIGURES
Figure Page
1.1 Simplified schematic diagram of the 50.3 mm ID horizontal
two-phase flow test facility with 90-degree Elbow junction
(T op view / N ot scaled) ..................................................................................... 2
1.2 Definition of measurement coordinate system for the Elbow junction ...... 3
1.3 The definition of AAi in the area-averaging scheme
for the data obtained along vertical radius, Rv (Ports 1, 3 and 4) .................. 6
2.1 Comparison of the jg, localmeasured by the flow meter with the
<a ><< Ug >> calculated based on the probe measurement.
+ 10 % show n in dotted lines ................................................................ .............. 9
3.2.1 Profiles of local two-phase flow parameters for Run 1 .............................. 17
3.2.2 Profiles of local two-phase flow parameters for Run 2 .............................. 24
3.2.3 Profiles of local two-phase flow parameters for Run 3 .............................. 31
3.2.4 Profiles of local two-phase flow parameters for Run 4 ................ 38
3.2.5 Profiles of local two-phase flow parameters for Run 5 ............................. 45
3.2.6 Profiles of local two-phase flow parameters for Run 6 ............................. 52
3.2.7 Profiles of local two-phase flow parameters for Run 7. ................ 59
3.2.8 Profiles of local two-phase flow parameters for Run 8 ................................... 66
3.2.9 Profiles of local two-phase flow parameters for Run 9. ............................. 73
3.2.10 Profiles of local two-phase flow parameters for Run 10 ............................ 80
3.2.11 Profiles of local two-phase flow parameters for Run 11 ............................. 87
3.2.12 Profiles of local two-phase flow parameters for Run 12 ............................ 94
(
vii
Page
3.2.13 Profiles of lo&ýi i -tw 6-ihase flow pdriii iieteds§ for Run 13 ................................ 101
3.2.14 Profiles of local two-phase flow parameters for Run 14 ............................... 106
3.2.15 Profiles of local two-phase flow parameters for Run 15. .............................. 111
(

viii
NOMENCLATURE
Ai surface area [m2]
ai interfacial area concentration [m'-]
D diameter [in]
De volume equivalent diameter [in]
D, surface equivalent diameter [in]
Dsm bubble Sauter mean diameter [in]
fb bubble frequency [s1]
j total superficial velocity [m s-]
jf liquid superficial velocity [in s']
jg gas superficial velocity [m s-I]
Ig,atm gas superficial velocity under the atmospheric pressure condition [m s-]
jg,loc gas superficial velocity under the local pressure condition [m s-1]
p pressure [pa]
Patm atmospheric pressure [pa]
Pback static pressure at the exit of gas flow meter [psig]
Ploc static pressure at a local point of interest [psig]
Qu liquid volumetric flow rate [M 3 s1] or [gpm]
Qg gas volumetric flow rate [in 3 S-'] or [acfm]
Re Reynolds number
t time [s]
Ur relative velocity [m sl]
Ub bubble velocity [m s-]
V volume [mi]
6'

ix
GREEK SYMBOL
a gas void fraction
P viscosity [Kg mls"1]
MATHEMATICAL SYMBOL
( ) area average
(( )) void weighted area average
SUBSCRIPTS
1 group 1
2 group 2
atm atmospheric condition
b bubble
f liquid phase
g gas phase
i interface
1cC local

X
ABSTRACT
The present report summarizes the experimental data acquired in the air-water slug
flow through a horizontal pipe of 50.3 mm inner diameter with a 90-degee Elbow
junction. The data presented in this report is a part of experimental investigations
performed at the University of Wisconsin, Milwaukee (UWM) as Task 4-5 of Thermal-
hydraulic Task (RS-RES-03-048) sponsored by the US Nuclear Regulatory Commission.
As of October 25, 2004, the remaining assignments of Task 4-5 were transferred to the
Two-phase Flow and the Thermal-hydraulics Laboratory (TFTL) of the University of
Missouri-Rolla (UMR), subcontracted through the Institute of Thermal-hydraulics of
Purdue University. In the efforts of performing data analysis studies, the UMR has
organized the data transferred by the UWM and interpreted in view of developing
predictive models for interfacial area transport and pressure loss due to the flow
restriction. This is the second data report for the flow with 90-degee Elbow junction,
summarizing the data acquired in the slug flow condition.

1
1. INTRODUCTION
1.1 Experimental Facility.
The data presented in this report was acquired in the air-water bubbly two-phase flow
through a horizontal tube of 50.3 mm inner diameter (ID) with a 90-degee Elbow flow
restriction. The experiments were performed at the University of Wisconsin, Milwaukee
(UW•v). The simplified schematic diagram of the test facility is shown in Figure 1.1.
The test section is made of Pyrex glass tubes and the measurement ports were made of
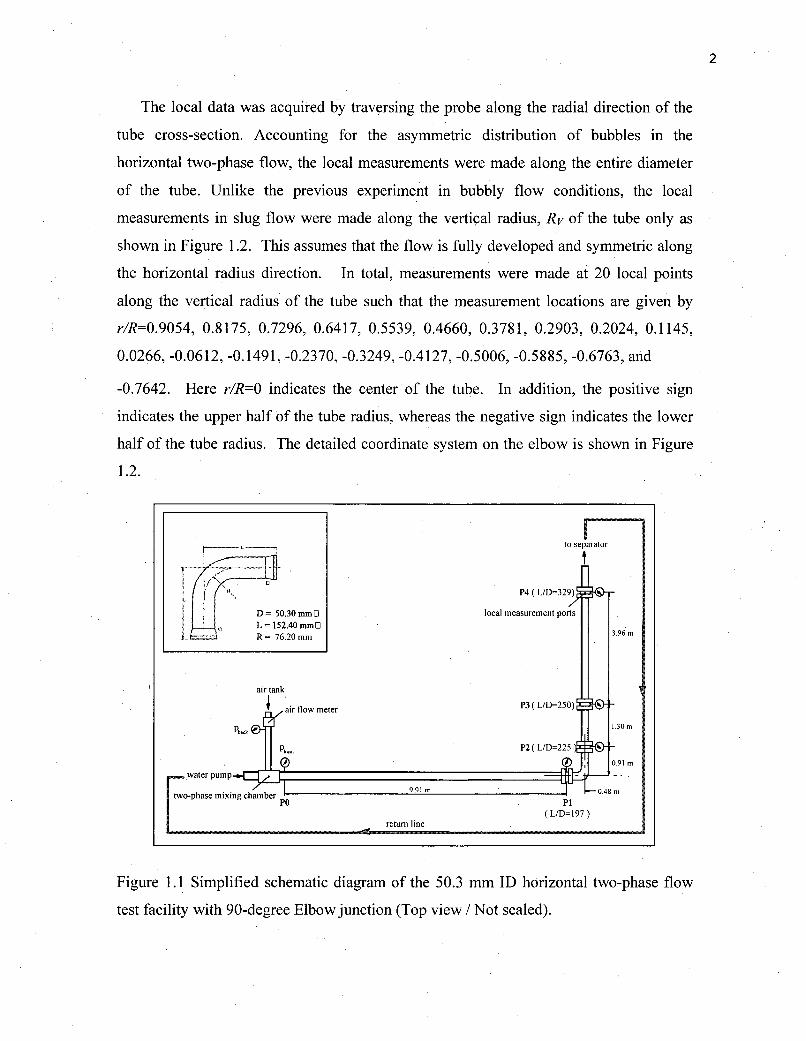
clear acrylic. In the test section, a 90-degree Elbow was installed at L/D=197. The
Elbow has a radius of curvature of 76.2 mm with an (L/D),ebow of approximately 6. The
detailed dimension of the elbow is shown in the inset of Figure 1.1.
There are four local measurement ports installed along the test section (P1 through P4
in Fig. 1.1), and the first port (PO) is located right after the two-phase mixing chamber
and was used only for the local pressure measurement. The port P1 is located at L/D=197
(9.91 meters from P0), just before the start of 90-degree Elbow, and the ports P2, P3 and
P4 are located at L/D=225, 250 and 329 from the mixing chamber, or 1.39, 2.69, 6.65
meters downstream of the start of 90-degree Elbow, respectively. It is noted that the
present data are acquired at P1, P3 and P4, and no data was acquired at P2.
For a given flow condition, the local two-phase flow parameters were acquired by
both the double-sensor and four-sensor conductivity probes. The double-sensor probe
was used to process the data registered by small bubbles, while the four-sensor probe was
used to process the data registered by slug (or Taylor) bubbles. The local parameters
acquired by the probe included: bubble frequency (ft), bubble velocity (ug), void fraction
(a) and interfacial area concentration (ai) for both small and slug bubbles. The local
bubble Sauter mean diameter (Dsm) was calculated by the measured void fraction and
interfacial area concentration with the mathematical relation given by
D,,= 6a/ : bubble Sauter mean diameterai
2
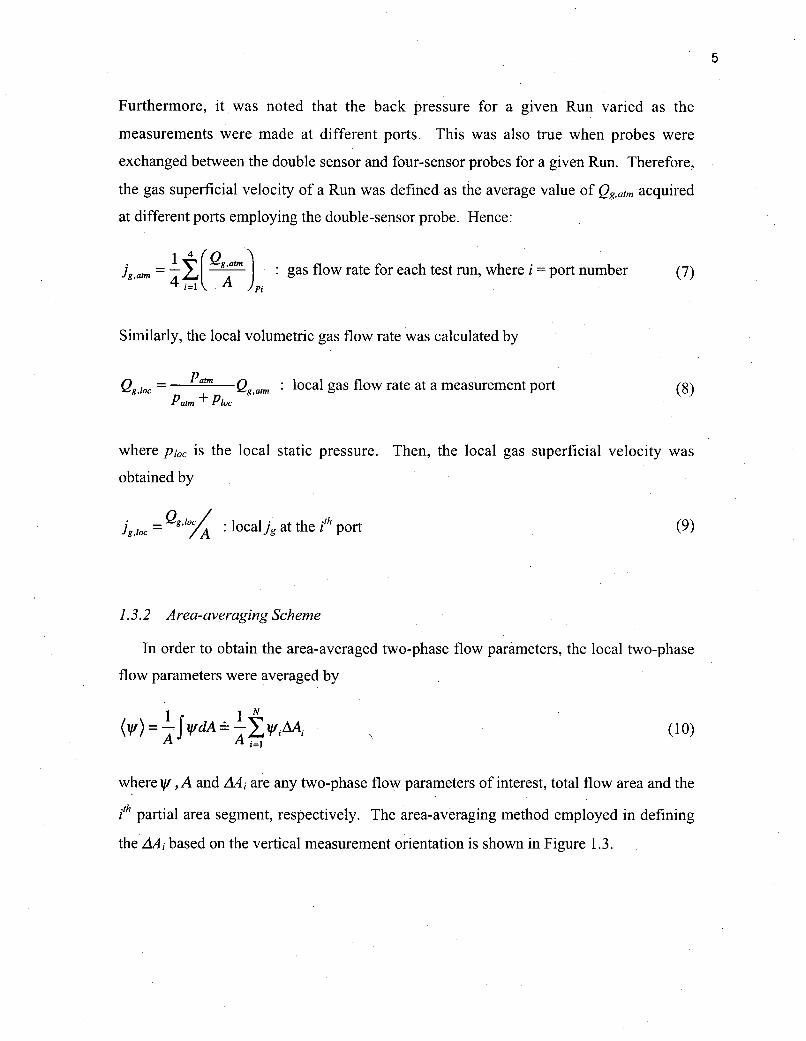
The local data was acquired by traversing the probe along the radial direction of the
tube cross-section. Accounting for the asymmetric distribution of bubbles in the
.horizontal two-phase flow, the local measurements were made along the entire diameter
of the tube. Unlike the previous experiment in bubbly flow conditions, the local
measurements in slug flow were made along the vertical radius, Rv of the tube only as
shown in Figure 1.2. This assumes that the flow is fully developed and symmetric along
the horizontal radius direction. In total, measurements were made at 20 local points
along the vertical radius of the tube such that the measurement locations are given by
r/R=0.9054, 0.8175, 0.7296, 0.6417, 0.5539, 0.4660, 0.3781, 0.2903, 0.2024, 0.1145,
0.0266, -0.0612, -0.1491, -0.2370, -0.3249, -0.4127, -0.5006, -0.5885, -0.6763, and
-0.7642. Here r/R=O indicates the center of the tube. In addition, the positive sign
indicates the upper half of the tube radius, whereas the negative sign indicates the lower
half of the tube radius. The detailed coordinate system on the elbow is shown in Figure
1.2.
to separator
. P4 (L/D7=329)
D = 50.30 mmoEl local measurement portst , L=152.4o mm 3 .9
R = 76.20 mm 3.96 m
air tankair flow meter P3 (L[D=250) %
Pb nýk
1.30 m
R-1~~.9 P2mD-2
water pump- _, 0.9 M
two-phase mixing chamber 9.91 M 0.4.,MP O P 1
(L/D=-197)return line
Figure 1.1 Simplified schematic diagram of the 50.3 mm ID horizontal two-phase flow
test facility with 90-degree Elbow junction (Top view / Not scaled).

3
positive
Cross-sectional View
positive
Top View
£
1
DD
rFlow Direction
Figure 1.2 Definition of measurement coordinate system for the Elbow junction
1.2 Local Two-phase Flow Parameters Acquired by the Probe
The local data was acquired by traversing the probe along the radial direction of the
flow. The acquired two-phase flow parameters and their mathematical definitions are
given by:
Nb•,tj(2
a= j• void fraction (2)
AT

4
where tj is the time occupied by the th bubble as it passes through the upstream sensor of
the probe, Nb is the total number of bubbles passed through the upstream sensor, and AT
*is the total measurement time at each location.
Asug - At bubble velocity (3)
where As is the distance between the two tips of probe sensors, and At is the time
difference between the signals registered at the upstream and downstream of the sensors
by the front interface of a bubble passing through the two sensor tips.
fb = NA bubble frequency (4)AT
and
1 (ia, ) interfacial area concentration (5)
where ui and ni are the interface velocity vector and unit normal vector to the interface,
respectively. As discussed earlier, the bubble Sauter mean diameter was calculated by
Eq. (1).
1.3 Data Process Schemes
1.3.1 Flow conditions
Noting that the local gas flow rate depends on the local pressure, the gas flow rate for
each Run was defined by that equivalent under the standard atmospheric pressure
condition. Hence, the local gas flow rate measured by the flow meter under, a back
pressure Pback was 'converted into the value equivalent to that under the atmospheric
pressure condition by
Qg,atnm -APM? + Pb.ck Qg,back where Qgback measured in acfm (6).Patm
5
Furthermore, it was noted that the back pressure for a given Run varied as the
measurements were made at different ports. This was also true when probes were
exchanged between the double sensor and four-sensor probes for a given Run. Therefore,
the gas superficial velocity of a Run was defined, as the average value of Qg, at, acquired
at different ports employing the double-sensor probe. Hence:1V4 rQg, atm
jg. =. - i,(-- i : gas flow rate for each test run, where i port number (7)
Similarly, the local volumetric gas flow rate was calculated by
Qg,1oc = Pat. Qg,al : local gas flow rate at a measurement port (8)Pa. + PIo,
where Ploc is the local static pressure. Then, the local gas superficial velocity was
obtained by
Jgloc = Qg"i°/oA localjg at the ith port (9)
1.3.2 Area-averaging Scheme
In order to obtain the area-averaged two-phase flow parameters, the local two-phase
flow parameters were averaged by
f f -dA V_ qzA, (10)
where IV ,A and AAi are any two-phase flow parameters of interest, total flow area and the
.th partial area segment, respectively. The area-averaging method employed in defining
the AAj based on the vertical measurement orientation is shown in Figure 1.3.

6
Hence, for the data acquired along Rv, the AAi is defined by
RJ2AA. = - O"-R h. 'sin hL-h *sin
2 2 2(11)
Here, Rv and is the vertical radius with respect to the top and bottom of the Elbow cross-
section, respectively. Therefore, Eq. (11) was employed to calculate the area-averaged
parameters from the data acquired in Ports 1, 3 & 4.
/ p7
., -44/
I .....K...
Figure 1.3 The definition of AAi in the area-averaging scheme for the data obtained along
vertical radius, Rv (Ports 1,3 and 4)
As the area-averaged values of the two-phase flow parameters were obtained, other
averaged parameters were calculated. Considering that there are two types of bubbles,
namely dispersed small bubbles and slug bubbles, they were categorized into two groups,
i.e., group 1 for small dispersed bubbles and group 2 for slug bubbles. Then the area
averaged two-phase flow parameters are defined as follows:
(ar) = (a1 + a2 ) :average total void fraction (12)
(13)(ai, ) = (ail + a12) : average total interfacial area concentration

7
I6aj .(Dsmnj) =\a average bubble Sauter mean diameter for the/h group (14)
((us.)) (aug) void-weighted average bubble velocity for thejth group, and (15)+)
ug)) + a void-weighted average bubble velocity (16)
where the subscripts 1 and 2 denote the group 1 and 2. In calculating the average Sauter
mean diameter, it was weighted by the bubble frequency and given by
((D,,\\ (fbDs',) "frequency-weighted average bubble Sauter mean diameter (17)(fb)
Furthermore, the superficial gas velocity at a local measurement port obtained by the
flow meter was compared with that obtained by the area-averaged two-phase flow
parameters by
IiJo= [(a T)((Ug))] (18)
2. EXPERIMENTAL CONDITIONS
The present experiments were performed in the air-water two-phase flow through a
horizontal tube of 50.3 mm in inner diameter (ID) with a 90-degee Elbow located at
L/D=197. In total, 15 different jg & jf combinations were investigated, all in slug flow
conditions. The test conditions were labeled as Runs 1 through 15 and they are
summarized in Table 2.1.
In view of the measurement error, the superficial gas velocity at a local measurement
port obtained by the flow meter was compared with that obtained by the area-averaged
two-phase flow parameters in Fig. 2.1. Here, the jg,,ocal was obtained by both the flow
rate and the pressure measurements and was calculated by Eq. (9). Then it was compared
to the local gas superficial velocity, calculated based on the a and Ug measured by the

8
local conductivity probe. As can be found in the figure, there are significant deviations in
flow conditions with higher gas flow rates ('g > 1 m/s). This may stem from errors
associated with both the probe application and the local pressure measurements.
Table 2.1 Summary of the test conditions in the present report
Run I Run 2 Run 3 Run 4 Run 5
]g,atm [m/s]* 0.287 0.293 0.300 0.587 0.603
jf [m/s]** 0.56 1.65 2.2 0.56 1.65
Run 6 Run 7 Run 8 Run 9 Run 10
Jg,atm [mis]* 0.625 1.186 1.218 1.186 2.371
jf [m/s] ** 2.2 0.56 1.65 2.2 0.56
Run 11 Run 12 Run 13 Run 14 Run 15
Ig,atm [m/s]* 2.526 2.648 3.243 3.528 3.812
jf [m/s] ** 1.65 2.2 0.56 1.65 2.2* jg,atm is the gas superficial velocity equivalent to the atmospheric pressure condition,
calculated based on Eqs. (6) and (7). The local pressure and the volumetric gas flowrates used in the calculations are the values when the local data were acquired by thedouble-sensor conductivity probe.
** jf shown in this table is the average of the liquid superficial velocities acquired at fourmeasurement ports for each Run when double-sensor conductivity probe wasemployed for local measurements.

9
4-
3.5
3 a 0
2.50 4
0 Port 1"LD=197
1 .o Pbrt3UD=250
0.5a Port4•UD=329
0 10 0.5 1 1 .a 1><<u> [mIs. 5 3 3.5 4
Figure 2.1 Comparison of the Ig,Iocal measured by the flow meter with (\rT TU\)/
calculated based on the probe measurement. ±10 % shown in dotted lines.
3. EXPERIMENTAL DATA
The comprehensive data acquired in the present experiments are summarized in this.
Chapter. First, the averaged data are presented, followed by the detailed local data
acquired by the double-sensor and four-sensor conductivity probes. In summary, they
are:
Section 3.1 The averaged data
(1) A comprehensive table that summarizes the experimental conditions and area-
averaged two-phase flow parameters for all test Runs, including both the
group 1 (small dispersed bubbles) and group 2 (slug bubbles) data.
Section 3.2 The local data
(1) A table that summarizes the local experimental conditions and the local two-
phase flow parameters acquired by the double-sensor conductivity probe (per
Run / per axial measurement location), and
(2) Profiles of local two-phase. flow parameters at each measurement port (per
Run / per axial measurement location)

10
Notations for figure identification numbers
The figure numbers are determined based on the following protocols:
* Figure 3.(data type):{ Data type = 1 for area-averaged data
Data type = 2 for local data
" Figure 3.2.(Run Number).(Axial Measurement Location):
Run number: 1 through 15
Axial location: Since no measurements were acquired at port 2, the
following numbering scheme was used:
Port 1 is denoted as the axial measurement location 1
Port 3 is denoted as the axial measurement location 2
Port 4 is denoted as the axial measurement location 3

11
3.1 Averaged Two-phase Flow Parameters.

Table 3.1 Summary of data acquired in air-water slug flow through a horizontal tube of 50.3 mm inner diameter with a 90-degree elbow junction
Data Port Location Flow Condition Local Gas Pressure Area Averaged Two-phaseTestNo.Superficial Velocity [psig] Flow Parameters
Port L L/D Q, Q" if Jgaln J«Ug,= Pb«»k PI- <a,> <a,> <aT> <a,,> <a,2> <nT> *<ugl>> "u <<ug>
No. [m] [acfm] [gpm] [mis] [m/s] [m/s] [1/m] [1/m] [1/m] [m/s] [m/s] [m/s]
Run 1 P0 0.00 - 0.512 17.5 0.556 0.2639 0.2854 19.80 1.20 . ... .
[m/s] P1 9.91 197 0.512 17.5 0.556 0.2672 0.2854 19.80 1.00 0.001 0.218 0.219 0.15 0.51 0.66 1.398 1.155 1.220j,'O 0.287 P3 12.60 250 0.541 17.7 0.562 0.2701 0.2884 18.30 1.00 0.001 0.252 0.253 0.09 0.46 0.55 1.492 0.961 1.026
jf=O0.5 6
P4 16.56 329 0.552 17.7. 0.562 0.2697 0.2881 17.60 1.00 0.001 0.243 0.244 0.12 0.46 0.58 1.306 0.873 0.933
Run 2 P0 0.00 - 0.578 51.9 1.648 0.2560 0.2960 17,00 2.30 - - - . -
[m/s] P1 9.91 197 0.578 51.9 1.648 0.2703 0.2960 17.00 1.40 0.013 0.131 0.144 4.99 2.16 7.15 1.846 2.778 2.784j,,= 0.293 P3 12.60 250 0.529 51.9 1.648 0.2689 0.2872 18.90 1.00 0.010 0.105 0.115 4.38 1.52 5.90 1.922 2.727 2.676
if= 1.65 P :P4 16.56 329 0.547 51.9 1.648 0.2704 0.2943 18.60 1.30 0.008 0.115 0.123 3.08 1.77 4.85 1.909 2.667 2.700
Run 3 P0 0.00 - 0.553 69.5 2.207 0.2558 0.2993 18,80 2.50 . . ..- - -
[mis] P1 9.91 197 0.553 69.5 2.207 0.2667 0.2993 18.80 1.80 0.028 0.083 0.111 14.37 1.65 16.02 2.278 3.587 3.300j,.= 0.300 P3 12.60 250 0.528 69.3 2.200 0.2683 0.3011 20,60 1.80 0.018 0.078 0.096 9.54 1.34 10.88 2.315 3.572 3.400
if= 2.2 P4 16.56 329 0.536 69.3 2.200 0.2694 0.3005 20.00 1.70 0.011 0.089 0.100 6.02 1.42 7.44 2.347 3.393 3.352
Run 4 P0 0.00 - 0.975 17.8 0.565 0.5384 0.5860 22.50 1.30 - - - - - - - -
[mIs] Pi 9.91 197 0.975 17.8 0.565 0.5487 0.5860 22.50 1.00 0.002 0.428 0.430 0.43 0.54 0.97 1.498 1.111 1.190jg,'•,= 0.587 P3 12.60 250 0.915 17.5 0.556 0.5509 0.5884 25,10 1.00 0.002 0.441 0.443 0.69 0.39 1.08 1.280 0.960 1.026
• 0.56 _
P4 16.56 329 0.954 17.4 0.552 0.5513 0.5888 23,50 1.00 0.002 0.420 0.422 0.44 0.40 0.84 1.436 0.926 0.991
Run 5 P0 0.00 - 1.019 52.2 1.657 0.5178 0.6059 22.10 2.50 - - - - - -
[m/s] P1 9.91 197 1.019 52.2 1.657 0.5498 0.6059 22,10 1.50 0.013 0.225 0.238 5.91 1.84 7.75 2.180 2.614 2.729jg,ý = 0.603 P3 12.60 250 0.921 51.9 1.648 0.5510 0.5997 25.60 1.30 0.015 0.199 0.214 7.26 1.50 8.76 2.058 2.930 2.998• jr 1.65 ___
____1.65_ P4 16.56 329 0.898 51.9 1.648 0.5505 0.5992 26,60 1.30 0.012 0.208 0.220 5.50 1.49 6.99 2.221 2.729 2.837
Run 6 P0 0.00 - 1.019 69.5 2.207 0.5212 0.6240 23,20 2.90 - - - - - - - -
[m/s] PI 9.91 197 1.019 69.5 2.207 0.5492 0.6240 23,20 2.00 0.025 0.157 0.182 13.25 2.08 15.33 2.634 3.905 3.855j,., = 0.625 P3 12.60 250 0.923 69.3 2.200 0.5526 0.6278 27.40 2.00 0.023 0.169 0.192 12.25 1.92 14.17 2.634 3.712 3.756
if- 2
.2
____2.2_ P4 16.56 329 0.917 69.2 2.197 0.5510 0.6223 27.30 1.90 0.020 0.163 0.183 10.24 1.68 11.92 2.665 3.787 3.813Run 7 PO 0.00 - 1.616 17.6 0.559 1.0761 1.193 31.00 1.60 - - - - - - - - -
[m/s]j,, = 1.186 P1 9.91 197 1.616 17.6 0.559 1.1172 1.193 31.00 1.00 0.007 0.554 0.561 3.25 0.31 3.56 1.859 1.297 1.390
ji=0.56 P3 12.60 250 1.504 17.4 0.552 1.1035 1.179 33.80 1.00 0.007 0.590 0.597 3.46 0.26 3.72 1.862 1.294 1.378
P4 16.56 329 1.520 17.3 0.549 1.1037 1.179 33.30 1.00 0.006 0.568 0.574 2.97 0.27 3.24 1.849 1.211 1.293
Run 8 P0 0.00 - 1.580 52.1 1.654 1.0336 1.230 33.50 2.80 . - - - - - - - -
[mis] Pi 9.91 197 1.580 52.1 1.654 1.1029 1.230 33.50 1.70 0.028 0.338 0.366 14.63 0.84 15.47 2.850 2.899 3.082
jg,,== 1.218 12.60 250 1.455 51.9 1.648 1.0946 1.199 36.30 1.40 0.030 0.308 0.338 16.19 0.76 16.95 2.651 3.081 3.231P3 12.60 250_ 1.455_ 51.9_ 1.4 1046 119'363 14 0,030_ 0,308_ 0.338 16.1 0.76_ 16.95_ 2.65_ 3.081 3.2
ji= 1.65P4 16.56 329 1.470 52.0 1.651 1.0991 1.211 36.30 1.50 0.028 0.319 0.347 14.74 0.71 15.45 2.848 2.954 3.125 N)

Table 3.1 continued from previous page
Local Gas Pressure Area Averaged Two-phaseatot Lco Superficial Velocity [psig] Flow Parameters
Test No.,______
Port L Qg Qf if Jgjoo Jg..<> <al> <ai2> <aiT> <<U9»>> <<U,,>> <<u»
No. [im] [acfm] [gpm] [m/s] [m/s] [m/s] P Plo• <a1> <02> <UT> [1/m] [I/m] [1/m] [m/s] [m/s] [m/s]
Run9 P0 0.00 - 1.663 69.5 2.207 1.0525 1.282 33.00 3.20 - - - - - - - - -
[m/s] P1 9.91 197 1.663 69.5 2.207 1.1017 1.282 33.00 2.40 0.049 0.223 0.272 25.63 1.20 26.83 3.407 4.486 4.485j,,m= 1.186 P3 12.60 250 1.566 69.2 2.197 1.1003 1.257 35.00 2.10 0.045 0.251 0.296 23.90 1.02 24.92 3.187 4.169 4.255
P4 16.56 329 1.556 69.2 2.197 1.1021 1.275 36.00 2.30 0.041 0.247 0.288 21.16 0.88 22.04 3.441 4.118 4.258
Run 10 P0 0.00 - 3.763 17.5 0.556 2.1253 2.371 24.30 1.70 - - - - - - - -
[m/s] P1 9.91 197 3.763 17.5 0.556 2.2060 2.371 24.30 1.10 0.018 0.686 0.704 8.95 0.10 9.05 2.705 1.304 1.4192371 P3 12.60 250 3.160 17.6 0.559 2.1989 2.349 31.30 1.00 0.020 0.676 0.696 10.72 0.14 10.86 2.716 2.119 2.259
if= 0.56 P4 16.56 329 3.160 17.3 0.549 2.2278 2.394 32.20 1.10 0.017 0.672 0.689 8.93 0.11 9.04 2.445 1.393 1.501
Run 11 P0 0.00 - 3.400 51.8 1.645 2.1243 2.543 31.60 2.90 - - . - - - - - -
[mis] P1 9.91 197 3.400 51.8 1.645 2.1993 2.543 31.60 2.30 0.059 0.453 0.512 21.14 0.35 21.49 3.509 3.215 3.4522.526 P3 12.60 250 2.381 51.9 1.648 2.1644 2.474 49.60 2.10 0.067 0.421 0.488 33.13 0.33 33.46 3.250 3.408 3.588
jf= 1.05 P4 16.56 329 3.113 51.7 1.641 2.2268 2.545 35.90 2.10 0.057 0.438 0.495 29.51 0.33 29.84 3.452 3.856 4.044
Run 12 P0 0.00 - 3.447 69.5 2.207 2.0907 2.645 32.80 3.901 - - - - - - - - -
[m/s] P1 9.91 197 3.447 69.5 2.207 2.1847 2.645 32.80 • 3.10 0.064 0.348 0.412 30.68 0.51 31.19 4.150 4.772 4.975
J,,m = 2.648 P3 12.60 250 3.324 69.4 2.203 2.1989 2.648 34,60 3.00 0.074 0.348 0.422 36.56 0.41 36.97 4.111 4.541 4.717if= 2.2 P4 16.56 329 3.210 69.3 2.200 2.2053 2.655 36.50 3.00 0.063 0.367 0.430 32.97 0.33 33.30 4.182 3.734 4.041
Kun IJ P0 0.00 - 3.775 17.3 0.549 2.8962 3.251 38.60 1.80 - - - - -[m/s]
jg,..,= 3.243 P1 9.91 197 3.775 17.3 0.549 3.0055 3.251 38.60 1.20 0.028 0.707 0.735 12.23 0.11 12.34 3.001 1.633 1.783
P3= 0.56 P3 12.60 250 - - - - - - - - - - - - - - -P4 16.56 329 4.550 17.5 0.556 3.0025 3.227 29.20 1.10 0.027 0.727 0.754 13.23 0.09 13.32 2.823 1.367 1.500
Run 14 P0 0.00 - 3.960 51.8 1.645 3.1350 3.519 40.30 1.80 - - - - - - - - -
[m/s] P1 9.91 197 3.960 51.8 1.645 2.9901 3.519 40.30 2.60 0.064 0.480 0.544 29.17 0.43 29.60 3.908 4.381 4.586jgm=3.528 P3 12.60 250 - - - - - - - - . - - - - - - -
P4 16.56 329 4.600 51.7 1.641 3.0123 3.545 33.00 2.60 0.069 0.505 0.574 32.22 0.29 32.51 3.920 3.653 3.908
Run 15 P0 0.00 - 4.390 69.5 2.207 3.0382 3.844 39.50 3.90 - - - - - - - -
[m/s] P1 9.91 197 4.390 69.5 2.207 3.0382 3.844 39.50 3.901 0.074 0.412 0.486 31.50 0.52 32.02 4.587 5.307 5.529j,,= 3.812 P3 12.60 250 - -. . . . . . . . . . . . .
jrf 2.2 P4 16.56 329 4.231 69.1 2.194 .2.9928 3.746 40.10 3.70 0.072 0.433 0.505 31126 0.40 31.66 4.677 5.013 5.268
14
3.2 Local Two-phase Flow Parameters.

15
3.2.1 Summary of results for Run 1.

Table 3.2.1.1 Local two-phase flow parameters for Run 1 acquired along the vertical axis at measurement port 1 (P1)Run 1: jg,am= 0.287 [m/s] &jf= 0.559 [m/s]
Measurement Location: L/D = 197 (Port 1)
Test Conditions: Sampling frequency: Measurement Time:Qg [acfin] = 0.512 Pback [psig] = 19.8 jg,l [m/s] =0.267 f., [1 /s] = 10,000 AT, [s] = 10Qf [gpm] = 17.50 PI.. [psig] = 1.0 jf [m/s] = 0.556 f2 [ 1/s] = 10,000 . AT2 [s] - 10
r/R fbl [1/s] fb2 [l/s] a1 a2 aT a., [1/m] a, [I/m] aiT [1/m] Ugl [m/S] Ug2 [m/s] D., [mm] D. [mm]0.9054 3.3 0.7 0.038 0.663 0.700 6.68 2.39 9.07 0.727 1.939 33.7 1663.90.8175 1.4 0.7 0.008 0.624 0.632 0.00 1.87 1.87 2.576 1.470 2002.10.7296 0.4 0.5 0.002 0.513 0.515 0.00 1.13 1.13 2.609 1.399 2723.90.6417 0.3 0.5 0.001 0.490 0.491 0.00 1.21 1.21 3.886 1.375 2430.70.5539 0.2 0.7 0.001 0.439 0.440 0.21 1.29 1.50 1.743 1.361 34.3 2040.50.4660 0.2 0.6 0.001 0.429 0.430 0.00 1.43 1.43 2.079 1.329 1798.70.3781 0.1 0.5 0.001 0.421 0.421 0.00 1.31 1.31 1.996 1.371 1926.40.2903 0.1 0.6 0.001 0.408 0.409 0.18 1.00 1.18 1.165 1.113 23.3 2447.40.2024 0.1 0.7 0.001 0.352 0.353 0.00 1.03 1.03 1.393 1.380 2047.60.1145 0.1 0.6 0.001 0.315 0.315 0.00 0.09 0.09 1.185 0.263 20980.00.0266 0.1 0.5 0.001 0.254 0.254 0.00 0.00 0.00 3.007 0.000-0.0612 0.1 0.5 0.000 0.092 0.092 0.00 0.00 0.00 0.271 0.000-0.1491 0.0 0.0 0.000 0.000 0.000 0.00 0.00 0.00 0.000 0.000-0.2370 0.0 0.0 0.000 0.000 0.000 0.00 0.00 0.00 0.000 0.000-0.3249 0.0 0.0 0.000 0.000 0.000 0.00 0.00 0.00 0.000 0.000-0.4127 0.0 0.0 0.000 0.000 0.000 0.00 0.00 0.00 0.000 0.000-0.5006 0.0 0.0 0.000 0.000 0.000 0.00 0.00 0.00 0.000 0.000-0.5885 0.0 0.0 0.000 0.000 0.000 0.00 0.00 0.00 0.000 0.000-0.6763 0.0 0.0 0.000 0.000 0.000 0.00 0.00 0.00 0.000 0.000-0.7642 0.0 0.0 0.000 0.000 0.000 0.00 0.00 0.00 0.000 0.000
Calculated Results:<al> = 0.001 <ail> [1/m] =0.15 <<Ugl>> [m/s] = 1.398
<a2 > = 0.218 <an> [1/m] =0.51 <<u,>> [m/s] = 1.155
<aT> = 0.219 <aiT> [I/m] =0.66 <<Ug>> [m/s] = 1.220
0)

17
1.0
0.5
P0.0
-0.5
-1.0
1.0
0.5
•0.0
-0.5
0 0U
a
0 40
ar
0 ail
a ai2
o aiT-1.0
0.0 0.2 0.4 0.6Void fraction, a
(a)
0.8 1.0 0 5Interfacial area concentration, ai [1/m]
(b)
10
1.00 A
A 0A 0A 0
0.5 a 0A 0
AD 0
A 00.0 o9
0
-0.5.
-1.00 1 2 3
Bubble velocity, ug [m/s]
(c)
4 5
Figure 3.2.1.1 Profiles of local two-phase flow parameters for Run I acquired along the vertical radius of the tube atmeasurement port 1 (PI). (a) void fraction, (b) interfacial area concentration and (c) bubble velocity.

Table 3.2.1.2 Local two-phase flow parameters for Run 1 acquired along the vertical axis at measurement port 3 (P3)Run 1: jg,am= 0.287 [m/s] &jf= 0.559 [m/s]
Measurement Location: L/D = 250 (Port 3)
Test Conditions: Sampling frequency: Measurement Time:Qg [acfin] = 0.541 Pback [psig] = 18.3 jg,8 or [m/s] =0.270 ft [I/s] = 10,000 AT1 [s] = 10
Qf [gpm] = 17.70 Ploc [psig] = 1.0 jf [m/s] = 0.562 f2 [ I/s = 10,000 AT2 [s] 10
r/R fb1 [1/s] fb2 [I/s] Cl a2 .T a,, [1/m] ai2 [1/m] afT [I/m] Ugl [m/s] ug2 [m/s] D.I [mm] D.2 [mm]
0.9054 1.3 0.9 0.014 0.660 0.674 1.27 1.55 2.82 1.113 0.871 67.6 .2554.1
0.8175 1.0 1.1 0.009 0.656 0.665 1.61 2.75 4.36 1.428 1.824 33.5 1431.30.7296 0.5 0.5 0.002 0.541 0.542 0.00 0.95 0.95 2.012 1.011 3414.3
0.6417 0.2 0.5 0.001 0.504 0.505 0.25 1.16 1.41 1.553 1.465 26.4 2605.9
0.5539 0.3 0.5 0.001 0.488 0.489 0.00 1.30 1.30 1.984 1.311 2250.90.4660 0.6 0.5 0.003 0.514 0.517 0.00 1.29 1.29 1.739 1.374 2389.8
0.3781 0.3 0.6 0.002 0.484 0.486 0.00 1.45 1.45 1.508 1.633 2002.3
0.2903 0.2 0.7 0.001 0.479 0.479 0.00 1.15 1.15 1.732 1.349 2497.00.2024 0.2 0.6 0.001 0.454 0.455 0.00 0.00 0.00 1.777 0.0000.1145 0.1 0.6 0.000 0.389 0.389 0.00 0.00 0.00 1.530 0.0000.0266 0.1 0.9 0.000 0.346 0.346 0.00 0.00 0.00 2.500 0.000-0.0612 0.0 0.5 0.000 0.108 0.108 0.00 0.00 0.00 2.117 0.000-0.1491 0.0 0.2 0.000 0.039 0.039 0.00 0.00 0.00 0.000 0.000-0.2370 0.0 0.0 0.000 0.000 0.000 0.00 0.00 0.00 0.000 0.000-0.3249 0.0 0.0 0.000 0.000 0.000 0.00 0.00 0.00 0.000 0.000
-0.4127 0.0 0.0 0.000 0.000 0.000 0.00 0.00 0.00 0.000 0.000-0.5006 0.0 0.0 0.000 0.000 0.000 0.00 0.00 0.00 0.000 0.000-0.5885 0.0 0.0 0.000 0.000 0.000 0.00 0.00 0.00 0.000 0.000-0.6763 0.0 0.0 0.000 0.000 0.000 0.00 0.00 0.00 0.000 0.000
-0.7642 0.0 0.0 0.000 0.000 0.000 0.00 0.00 0.00 0.000 0.000
Calculated Results:<a,> = 0.001 <ail> [1/m] =0.09 <<ugl>>[m/s] = 1.492
<a? = 0.252 <au> [1/m] =0.46 <<ug2>> [m/s] = 0.961
<a-> = 0.253 <a1T> [1/mi = 0.55 <<ug>> [m/s] = 1.026

19
1.0 1.00 Da 0
0 a 0C) Ia
0 a 00.5 0.5 a
510.0 0.0
-0 .5 .5l -0 .5 0 a il2a a12
-1.0 ... 0 -
0.0 0.2 0O4 0.6 0.8 1.0 01 2 3 45Void fraction, a -nterfacial area concentration, ai [1/m]
(a) (b)
1.0
-0.5~~~ 0 i05oa
0 A1.0
A 00.5 Ax 0
OAA 0
00
0.0 0
-0.5
-1.00 1 2 3 4 5
Bubble velocity, u, [m/s]
(c)
Figure 3.2.1.2 Profiles of local two-phase flow parameters for Run 1 acquired along the vertical radius of the tube atmeasurement port 3 (P3). (a) void fraction, (b) interfacial area concentration and (c) bubble velocity.

Table 3.2.1.3 Local two-phase flow parameters for Run 1 acquired along the vertical axis at measurement port 4 (P4)
Run 1: jg,atm= 0.287 [m/s] &jf= 0.55 9 [m/s]Measurement Location: L/D = 329 (Port 4)
Test Conditions: Sampling frequency: Measurement Time:Qg [acfin] = 0.522 Pback'[psig] = 17.6 Jg,lo• [m/s] =0.270 ftl [ i/s] 10,000 AT 1 [s] = 10
Qf [gpm] = 17.70 P1o' [psig] = 1.0 jf [m/s] = 0.562 f2 [ Is] = 10,000 AT 2 [s] = 10
r/R fbl [i/s] fb 2 [l/s] a1 a2 aT a., [1/m] a, [1/m] aiT [1/m] Ugl [m/s] ug2 [m/s] D.m [rnm] D.2 [mm]
0.9054 1.3 0.6 0.014 0.646 0.660 3.85 1.69 5.54 0.764 1.338 21.7 2293.10.8175 0.7 0.6 0.005 0.575 0.579 1.31 1.45 2.76 1.309 1.394 22.0 2377.70.7296 0.4 0.5 0.002 0.498 0.500 0.00 1.51 1.51 3.651 1.244 1978.00.6417 0.1 0.6 0.000 0.496 0.497 0.00 1.58 1.58 4.001 1.264 1884.70.5539 0.2 0.5 0.001 0.458 0.459 0.00 1.68 1.68 2.018 1.370 1635.40.4660 0.2 0.5 0.001 0.492 0.493 0.00 1.77 1.77 1.661 1.344 1667.80.3781 0.2 0.5 0.001 0.454 0.454 0.00 0.86 0.86 1.576 1.068 3164.00.2903 0.1 0.5 0.001 0.434 0.434 0.00 0.65 0.65 1.491 1.148 4001.50.2024 0.2 0.6 0.001 0.424 0.425 0.00 0.14 0.14 1.453 0.266 18158.60.1145 0.2 0.6 0.002 0.412 0.414 0.00 0.00 0.00 0.631 0.0000.0266 0.2 0.7 0.001 0.336 0.338 0.00 0.00 0.00 1.618 0.000-0.0612 0.0 0.7 0.000 0.154 0.154 0.00 0.00 0.00 2.255 0.000-0.1491 0.0 0.0 0.000 0.000 0.000 0.00 0.00 0.00 0.457 0.000-0.2370 0.0 0.0 0.000 0.000 0.000 0.00 0.00 0.00 0.000 0.000-0.3249 0.0 0.0 0.000 0.000 0.000 0.00 0.00 0.00 0.000 0.000-0.4127 0.0 0.0 0.000 0.000 0.000 0.00 0.00 0.00 0.000 0.000-0.5006 0.0 0.0 0.000 0.000 0.000 0.00 0.00 0.00 0.000 0.000-0.5885 0.0 0.0 0.000 0.000 0.000 0.00 0.00 0.00 0.000 0.000-0.6763 0.0 0.0 0.000 0.000 0.000 0.00 0.00 0.00 0.000 0.000-0.7642 0.0 0.0 0.000 0.000 0.000 0.00 0.00 0.00 0.000 0.000
Calculated Results:<a,> = 0.001 <ail> [1/m] =0.12 <<Ugl>> [m/s] = 1.306
<a 2> = 0.243 <ai2> [I/m] = 0.46 <<ug2>> [m/s] = 0.873
<aT> = 0.244 <aiT> [1/m] =0.57 <<us>> [m/s] = 0.933
N)C)

21
1.0
0.5
P0.0
-0.5
-1.0
1.0
0.5
p0.0
-0.5
-1.0
0 0CA 0
a
o ail
a ai2
o aiT
0.0 0.2 0.4 0.6Void fraction, ct
(a)
0.8 1.0 0 5Interfacial area concentration, ai [1r/m]
(b)
10
1.0
0.5
~n
o A
A 0A 0a 0
A 0A 0
00
000
0ug
A 1g
%
-0.5
-1.0
4 50 1 2 3Bubble velocity, ug [m/s]
(c)
Figure 3.2.1.3 Profiles of local two-phase flow parameters for Run I acquired along the vertical radius of the tube atmeasurement port 4 (P4). (a) void fraction, (b) interfacial area concentration and (c) bubble velocity.
22
3.2.2 Summary of results for Run 2.

Table 3.2.2.1 Local two-phase flow parameters for Run 2 acquired along the vertical axis at measurement port 1 (P1)Run 2: jg,atm= 0.293 [m/s] &jf= 0.1.648 [m/s]
Measurement Location: L/D = 197 (Port 1)
Test Conditions: Sampling frequency: Measurement Time:Qg [acfin] = 0.578 Pback [psig] = 17 jg,lo• [m/s] =0.270 frl [ Is] = 10,000 AT1 [s] = 10Qf [gpm] = 51.90 Pl.. [psig] = 1.4 jf [m/s] = 1.648 f,2 [ I/s] = 10,000 AT 2 [s] = 10
r/R fbI [i/s] fb2 [I/s] a a2 aT a.1 [/in] a2 [1/m] air [1/iM] ugl [m/s] ug2 [m/s] D. 1 [mm] Ds2 [mm]0.9054 48.4 3.4 0.191 0.453 0.644 73.34 6.33 79.67 1.561 2.721 15.6 429.60.8175 28.3 3.6 0.082 0.445 0.527 34.67 6.78 41.45 1.733 3.255 14.1 393.90.7296 9.7 3.6 0.027 0.385 0.412 10.52 5.68 16.20 2.402 2.992 15.6 406.60.6417 5.7 3.5 0.014 0.343 0.357 5.56 5.84 11.40 2.570 2.888 15.3 352.60.5539 4.1 3.4 0.011 0.306 0.317 5.61 5.55 11.16 2.477 3.137 11.2 330.80.4660 3.5 3.5 0.010 0.270 0.280 3.98 5.17 9.15 2.510 2.923 14.3 313.70.3781 3.4 3.5 0.011 0.241 0.252 3.90 4.90 8.80 2.586 2.943 17.1 294.6
* 0.2903 2.7 3.3 0.009 0.219 0.228 3.85 4.40 8.25 2.242 2.795 14.2 298.50.2024 3.4 3.3 0.012 0.201 0.213 4.35 3.67 8.02 2.075 2.888 16.3 328.40.1145 3.9 2.6 0.016 0.144 0.160 5.07 2.30 7.37 2.160 2.903 18.9 375.70.0266 4.2 2.0 0.014 0.086 0.101 4.51 0.40 4.91 2.088 1.163 19.2 1296.0-0.0612 1.6 0.9 0.004 0.035 0.039 2.03 0.00 2.03 1.530 0.000 12.7-0.1491 0.0 0.0 0.000 0.000 0.000 0.00 0.00 0.00 0.000 0.000-0.2370 0.0 0.0 0.000 0.000 0.000 0.00 0.00 0.00 0.000 0.000 1-0.3249 0.0 0.0 0.000 0.000 0.000 0.00 0.00 0.00 0.000 0.000-0.4127 0.0 0.0 0.000 0.000 0.000 0.00 0.00 0.00 0.000 0.000-0.5006 0.0 0.0 0.000 0.000 0.000 0.00 0.00 0.00 0.000 0.000-0.5885 0.0 0.0 0.000 0.000 0.000 0.00 0.00 0.00 0.000 0.000-0.6763 0.0 0.0 0.000 0.000 0.000 0.00 0.00 0.00 0.000 0.000,-0.7642 0.0 0.0 0.000 0.000 0.000 0.00 0.00 0.00 0.000 0.0001
Calculated Results:<a1 > = 0.013 <ail> [1/m] =4.99 <<ugi>> [m/s] = 1.846
<a 2> = 0.131 <an> [1/m] =2.16 <<u,2>> [m/s] = 2.778
<a-> = 0.144 <aiT> [I/m] =7.15 <<u,>> [m/s] = 2.784
C.)C.)

24
1.00 A 0
o ax 0o d
0 4
0.5
0.0 •a
-0.5 0 cil
1a.2O aT
-1.0
1.000
a 00
AO0
"dOdo
0.5 -Io
-600
0. p I I -
-0.5 0 ail
4 ai2
0 aiT
-1.0
0.0 0.2 0.4 0.6Void fraction, a
(a)
0.8 1.0 0 30 60 90 120Interfacial area concentration, ai [1/m]
(b)
150
1.0
0.5
-0.5
-1.0
0 A0 A
0 A0 A
0 A0 A0 A
0 A0 A0 A
IA 0 I0
OuI
0 1 2 3Bubble velocity, u, [m/s]
(c)
4 5
Figure 3.2.2.1 Profiles of local two-phase flow parameters for Run 2 acquired along the vertical radius of the tube atmeasurement port 1 (P1). (a) void fraction, (b) interfacial area concentration and (c) bubble velocity.
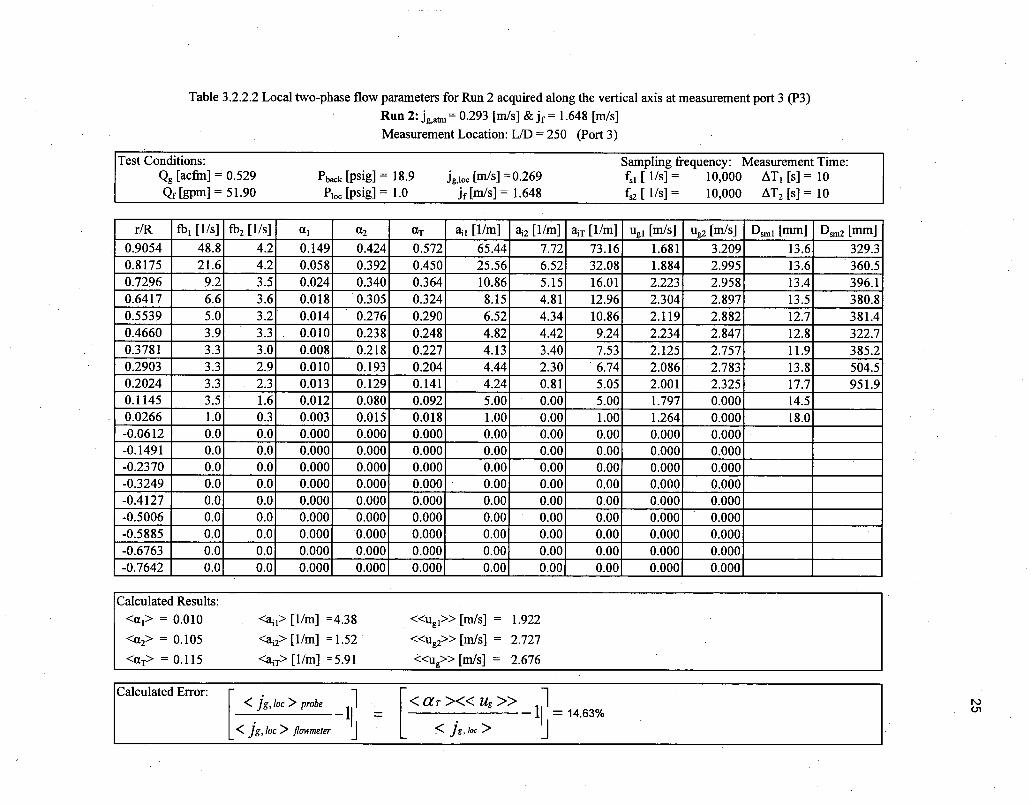
Table 3.2.2.2 Local two-phase flow parameters for Run 2 acquired along the vertical axis at measurement port 3 (P3)
Run 2: jg=at= 0.293 [m/s] &jf= 1.648 [m/s]
Measurement Location: L/D = 250 (Port 3)
Test Conditions: Sampling frequency: Measurement Time:Qg [acfm] = 0.529 Pback [psig] = 18.9 jg,loc [m/s] =0.269 fl [ l/s] = 10,000 AT 1 [s] = 10Qf [gpm] 51.90 Pl.. [psig] = 1.0 jf [m/s] = 1.648 f,2 [ I/s[ = 10,000 AT2 [s] = 10
r/R fbl1 [1/s] fb2 [1/s] al a2 a ail [1/m] a. [1/m] afT [1/mr] Ug [m/s] ug2 [m/s] D. 1 [mm] D.2 [m.n]0.9054 48.8 4.2 0.149 0.424 0.572 65.44 7.72 73.16 1.681 3.209 13.6 329.30.8175 21.6 4.2 0.058 0.392 0.450 25.56 6.52 32.08 1.884 2.995 13.6 360.50.7296 9.2 3.5 0.024 0.340 0.364 10.86 5.15 16.01 2.223 2.958 13.4 396.10.6417 6.6 3.6 0.018 0.305 0.324 8.15 4.81 12.96 2.304 2.897 13.5 380.80.5539 5.0 3.2 0.014 0.276 0.290 6.52 4.34 10.86 2.119 2.882 12.7 381.40.4660 3.9 3.3 0.010 0.238 0.248 4.82 4.42 9.24 2.234 2.847 12.8 322.70.3781 3.3 3.0 0.008 0.218 0.227 4.13 3.40 7.53 2.125 2.757 11.9 385.20.2903 3.3 2.9 0.010 0.193 0.204 4.44 2.30 6.74 2.086 2.783 13.8 504.50.2024 3.3 2.3 0.013 0.129 0.141 4.24 0.81 5.05 2.001 2.325 17.7 951.90.1145 3.5 1.6 0.012 0.080 0.092 5.00 0.00 5.00 1.797 0.000 14.50.0266 1.0 0.3 0.003 0.015 0.018 1.00 0.00 1.00 1.264 0.000 18.0-0.0612 0.0 0.0 0.000 0.000 0.000 0.00 0.00 0.00 0.000 0.000-0.1491 0.0 0.0 0.000 0.000 0.000 0.00 0.00 0.00 0.000 0.000-0.2370 0.0 0.0 0.000 0.000 0.000 0.00 0.00 0.00 0.000 0.000-0.3249 0.0 0.0 0.000 0.000 0.000 0.00 0.00 0.00 0.000 0.000-0.4127 0.0 0.0 0.000 0.000 0.000 0.00 0.00 0.00 0.000 0.000-0.5006 0.0 0.0 0.000 0.000 0.000 0.00 0.00 0.00 0.000 0.000-0.5885 0.0 0.0 0.000 0.000 0.000 0.00 0.00 0.00 0.000 0.000-0.6763 0.0 0.0 0.000 0.000 0.000 0.00 0.00 0.00 0.000 0.000-0.7642 0.0 0.0 0.000 0.000 0.000 0.00 0.00 0.00 0.000 0.000_
Calculated Results:<a,> = 0.010 <ail> [1/mr =4.38 <<Ugl>> [m/s] = 1.922
<%> = 0.105 <ai2> [1/m] = 1.52 <<Ug2>> [m/s] = 2.727<aT> = 0.115 <aiT> [1/mr =-5.91 <<ug>> [m/s] = 2.676
C n

26
1.0
o ao t
0.5 -
43
£3
;0.0
-0.5
-1.0
0.0 0.2 0.4 0.6Void fraction, a
(a)
o alA a2
o3 aT
0.8 1.0
1.0a 0 0
a 0 0a 0 060 0
0.5 -- o
(0
~0.0
-0.5 0 ail
a ai2
0 aiT
-1.0
0 20 40 60 80Interfacial area concentration, ai [1/m]
(b)
100
1.0
0.5
A A
o A0 A
0 A0 A
0 A0 A
0 A0 A
0 A0
I 0 ugI
-0.5
-1.0
0 1 2 3Bubble velocity, ug [mis]
(c)
4 5
Figure 3.2.2.2 Profiles of local two-phase flow parameters for Run 2 acquired along the vertical radius of the tube atmeasurement port 3 (P3). (a) void fraction, (b) interfacial area concentration and (c) bubble velocity.

Table 3.2.2.3 Local two-phase flow parameters for Run 2 acquired along the vertical axis at measurement port 4 (P4)
Run 2: jg,atm = 0.293 [m/s] &jf= 1.648 [m/s]Measurement Location: L/D = 329 (Port 4)
Test Conditions: Sampling frequency: Measurement Time:Qg [acfmn] = 0.547 Pback [psig] = 18.6 jg,lo¢ [m/s] =0.270 fl [ I/s] = 10,000 AT, [s] = 10Qf [gpm] = 51.90 Ploc [psig] = 1.3 jf [m/s] = 1.648 f2 [ I/s] = 10,000 AT 2 [s] = 10
r/R fb1 [1/s] fb2 [1/s] a(1 a2 aT a.1 [I/m] ai [1/m] aiT [I/rn] Ug1 [miS] Ug2 [m/s] D., [mm] Dn2 [mm]0.9054 36.2 3.0 0.108 0.391 0.499 49.98 5.96 55.94 1.629 3.165 13.0 393.90.8175 12.3 3.1 0.030 0.367 0.397 13.98 6.74 20.72 1.992 3.144 12.8 326.50.7296 3.8 3.1 0.010 0.342 0.352 4.04 6.44 10.48 2.580 2.943 14.3 318.80.6417 2.6 3.1 0.006 0.316 0.323 2.32 5.57 7.89 3.001 2.951 16.3 340.70.5539 2.6 3.1 0.007 0.284 0.291 3.30 5.22 8.52 2.699 2.944 12.7 326.80.4660 3.0 3.1 0.009 0.267 0.276 3.65 4.75 8.40 2.547 2.728 14.1 337.10.3781 2.7 3.0 0.009 0.244 0.253 3.12 4.02 7.14 2.437 2.784 17.3 363.60.2903 2.6 3.0 0.009 0.224 0.233 3.27 3.31 6.58 2.066 2.905 16.5 406.20.2024 3.2 2.7 0.013 0.164 0.177 4.58 1.39 5.97 1.978 2.104 16.4 708.30.1145 3.5 1.8 0.014 0.104 0.117 4.17 0.25 4.42 2.114 0.604 19.6 2484.00.0266 2.7 1.4 0.009 0.073 0.082 3.82 0.00 3.82 1.881 0.000 14.0-0.0612 0.9 0.0 0.004 0.000 0.004 0.79 0.00 0.79 1.243 0.000 31.1-0.1491 0.0 0.0 0.000 0.000 0.000 0.00 0.00 0.00 0.000 0.000-0.2370 0.0 0.0 0.000 0.000 0.000 0.00 0.00 0.00 0.000 0.000-0.3249 0.0 0.0 0.000 0.000 0.000 0.00 0.00 0.00 0.000 0.000-0.4127 0.0 0.0 0.000 0.000 0.000 0.00 0.00 0.00 0.000 0.000-0.5006 0.0 0.0 0.000 0.000 0.000 0.00 0.00 0.00 0.000 0.000-0.5885 0.0 0.0 0.000 0.000 0.000 0.00 0.00 0.00 0.000 0.000-0.6763 0.0 0.0 0.000 0.000 0.000 0.00 0.00 0.00 0.000 0.000-0.7642 0.0 0.0 0.000 0.000 0.000 0.00 0.00 0.00 0.000 0.000
Calculated Results:<a1> = 0.008 <ail> [1/m] = 3.08 <<ugl>> [m/s] = 1.909
<a 2> = 0.115 <an> [1/mr] 1.77 <<u»>> [m/s] = 2.667
<a-,> = 0.123 <aiT> [1/m] =4.85 <<Ug>> [m/s] = 2.700
N)"4

28
1.00 0 a 0
.0 A0
0.5
-0.5
-1.0
0.0 0.2 0.4 0.6Void fraction, a
(a)
1.0-
0.5
. _0.0
II
-0.5
-1.0
o a .
o aT
0.8 1.0
1.0A 0 0A 0 0
0A 00 AD
0.5 06 o
d O
-A 00a•0.0 13 II
-0.5 0 ail
A ai2
0 aiT
-1.0
0 10 20 30 40 50Interfacial area concentration, ai [1/m]
(b)
60
0Ao A
0 A0 A
OAO A
A 0OOI I
Oug0ug
0 1 2 3Bubble velocity, Ug [m/s]
(c)
4 5
Figure 3.2.2.3 Profiles of local two-phase flow parameters for Run 2 acquired along the vertical radius of the tube atmeasurement port 4 (P4). (a) void fraction, (b) interfacial area concentration and (c) bubble velocity.

29
3.2.3 Summary of results for Run 3.

Table 3.2.3.1 Local two-phase flow parameters for Run 3 acquired along the vertical axis at measurement port 1 (P1)Run 3: Jg,at.= 0.300 [m/s] &jf = 2.203 [m/s]Measurement Location: L/D = 197 (Port 1)
Test Conditions: Sampling frequency: Measurement Time:Qg [acfin] = 0.553 Pback [psig] = 18.8 jg,l0o [m/s] =0.267 f., [ I/si = 10,000 AT1 [s] = 10Qf [gpm] = 69.50 PI.,o [psig] = 1.8 jf [m/s] = 2.207 f2 [ 1/s] = 10,000 AT 2 [s] = 10
r/R fbl [1/s] fb2 [i/s] a, a2 aT a,, [1/m] ak [1/m] aiT [1/m] Ugi [m/s] ug2 [m/s] D.m [mm] D.2 [mm]0.9054 146.8 3.9 0.412 0.293 0.705 184.45 7.41 191.86 1.963 4.244 13.4 237.00.8175 110.1 4.1 0.210 0.286 0.496 124.11 5.69 129.80 2.169 4.011 10.1 301.50.7296 69.7 4.1 0.112 0.268 0.380 70.31 5.64 75.95 2.347 3.815 9.5 284.80.6417 32.0 4.1 0.050 0.247 0.297 29.29 4.92 34.21 2.590 3.764 10.3 301.10.5539 17.2 4.1 0.031 0.220 0.251 16.06 4.71 20.77 2.712 3.635 11.6 280.80.4660 11.9 4.0 0.024 0.191 0.214 11.43 4.06 15.49 2.793 3.678 12.4 281.80.3781 8.8 3.4 0.019 0.169 0.188 8.19 3.76 11.95 2.802 3.709 14.2 268.90.2903 7.3 3.0 0.016 0.147 0.163 6.89 3.09 9.98 2.761 3.578 14.2 285.60.2024 6.4 2.7 0.016 0.113 0.129 6.24 1.58 7.82 2.736 2.549 15.3 430.60.1145 6.3 1.7 0.016 0.066 0.082 6.78 0.64 7.42 2.487 2.569 14.2 620.60.0266 2.0 0.7 0.005 0.025 0.030 2.16 0.00 2.16 1.047 0.000 14.4-0.0612 0.0 0.0 0.000 0.000 0.000 0.00 0.00 0.00 0.000 0.000-0.1491 0.0 0.0 0.000 0.000 0.000 0.00 0.00 0.00 0.000 0.000-0.2370 0.0 0.0 0.000 0.000 0.000 0.00 0.00 0.00 0.000 0.000-0.3249 0.0 0.0 0.000 0.000 0.000 0.00 0.00 0.00 0.000 0.000-0.4127 0.0 0.0 0.000 0.000 0.000 0.00 0.00 0.00 0.000 0.000-0.5006 0.0 0.0 0.000 0.000 0.000 0.00 0.00 0.00 0.000 0.000-0.5885 0.0 0.0 0.000 0.000 0.000 0.00 0.00 0.00 0.000 0.000-0.6763 0.0 0.0 0.000 0.000 0.000 0.00 0.00 0.00 0.000 0.000-0.7642 0.0 0.0 0.000 0.000 0.000 0.00 0.00 0.00 0.000 0.000
Calculated Results:<a,> = 0.028 <ail> [1/m] = 14.37 <<Ug»>> [m/s] = 2.278
<%2> = 0.083 <ai2> [1/m] = 1.65 <<ug2>> [m/s] = 3.587
<aT> = 0.110 <aiT> [I/m] = 16.02 <<ug>> [m/s] = 3.300
W

31
1.0
0.5
0.0
A 0 00OA 0
0 a 00 A 13o A Do ADo •
43M
0
i A a2| [0 aT
1.0
0.5
0.0
-0.5
-1.0
A6 00A6 00A6 00a 00a 00a oO
am
A ai2
0 aiT
-0.5
-1.00.0 0.2 0.4 0.6
Void fraction, a(a)
1.0
0.5
;0.0
-0.5
-1.0
0.8 1.0 0 50 100 150Interfacial area concentration, ai [1/m]
(b)
200
0 A0 A
0 A0 Ao A0 A0 Ao0
9 n n O
0 1 2 3Bubble velocity, u, [m/s]
(c)
4 5
Figure 3.2.3.1 Profiles of local two-phase flow parameters for Run 3 acquired along the vertical radius of the tube atmeasurement port 1 (PI). (a) void fraction, (b) interfacial area concentration and (c) bubble velocity.

Table 3.2.3.2 Local two-phase flow parameters for Run 3 acquired along the vertical axis at measurement port 3 (P3)Run 3: jg,a,= 0.300 [m/s] &jf= 2.203 [m/s]Measurement Location: L/D = 250 (Port 3)
Test Conditions: Sampling frequency: Measurement Time:Qg [acfin] = 0.528. Pback [psig] = 20.6 Jg,loc [m/s] =0.268 fl [ 1/s] = 10,000 AT 1 [s] = 10Qf [gpm] = 69.30 P0oc [psig] = 1.8 jf [m/s] = 2.200 f,2 [ l/s] = 10,000 AT 2 [s]= 10
r/R fbI [1/s] fb2 [l/s] aI a2 _ aT ail [1/m] ai2 [1/m] aiT [1/M] Ug5 [Im/s] Ug2 [Im/s] Dsm. [mm] Dm2 [mm]0.9054 118.3 3.8 0.246 0.266 0.512 129.39 5.06 134.45 2.211 4.318 11.4 315.30.8175 70.4 4.1 0.131 0.264 0.395 72.80 5.48 78.28 2.325 3.862 10.8 289.20.7296 35.6 3.9 0.062 0.251 0.313 35.69 4.50 40.19 2.388 3.790 10.4 334.80.6417 16.8 3.5 0.030 0.226 0.256 15.16 3.84 19.00 2.655 3.657 11.9 353.60.5539 10.3 3.6 0.020 0.202 0.222 9.90 3.75 13.65 2.702 3.653 11.8 323.20.4660 8.5 3.5 0.017 0.182 0.199 8.45 3.23 11.68 2.746 3.531 12.1 338.10.3781 7.9 3.1 0.015 0.168 0.184 8.15 2.94 11.09 2.601 3.712 11.3 343.30.2903 6.3 2.9 0.014 0.151 0.165 6.18 2.29 8.47 2.763 3.727 13.8 394.30.2024 5.8 2.8 0.015 0.117 0.132 5.73 2.13 7.86 2.706 3.592 15.6 330.10.1145 6.9 1.5 0.018 0.051 0.070 7.80 0.18 7.98 2.445 0.700 14.0 1710.00.0266 6.6 0.7 0.018 0.025 0.043 7.53 0.00 7.53 2.353 0.000 14.6-0.0612 0.0 0.0 0.000 0.000 0.000 0.00 0.00 0.00 0.000 0.000-0.1491 0.0 0.0 0.000 0.000 0.000 0.00 0.00 0.00 0.000 0.000-0.2370 0.0 0.0 0.000 0.000 0.000 0.00 0.00 0.00 0.000 0.000-0.3249 0.0 0.0 0.000 0.000 0.000 0.00 0.00 0.00 0.000 0.000-0.4127 0.0 0.0 0.000 0.000 0.000 0.00 0.00 0.00 0.000 0.000-0.5006 0.0 0.0 0.000 0.000 0.000 0.00 0.00 0.00 0.000 0.000-0.5885 0.0 0.0 0.000 0.000 0.000 0.00 0.00 0.00 0.000 0.000-0.6763 0.0 0.0 0.000 0.000 0.000 0.00 0.00 0.00 0.000 0.000-0.7642 0.0 0.0 0.000 0.000 0.000 0.00 0.00 0.00 0.000 0.000
Calculated Results:<al> = 0.018 .<ail> [1/m] =9.54 <<Ugl>> [m/s] = 2.315
<%2> = 0.078 <ai2> [1/m] = 1.34 <<ug2>> [m/s] = 3.572
<aT> = 0.097 <aiTr> [1/m] = 10.88 <<Ug>> [m/s] = 3.400
C,.)

33
1.0
0.5
90.0
-0.5
1 n
Cd 00 A 0
0 aO0o A•D
o tO3o LI
i3Li]
ox ci2
o aT
1.0
0.5
1 0.0
-0.5
-1.0
A6 00A6 00
-A 00A 00A 00A O
A 60a:{3ACED
0 ail
a ai2
0 aiT
0.0 0.2 0.4 0.6Void fraction, a
(a)
0.8 1.0 0 30 60 90 120Interfacial area concentration, ai [1/m]
(b)
150
1.0
0.5
P0.0
-0.5
-1.0
o A0 A0 A
0 A0 A0 A
0 A0 A
0 AA 0
p
0 4 51 2 3Bubble velocity, ug [m/s]
(c)
Figure 3.2.3.2 Profiles of local two-phase flow parameters for Run 3 acquired along the vertical radius of the tube atmeasurement port 3 (P3). (a) void fraction, (b) interfacial area concentration and (c) bubble velocity.

Table 3.2.3.3 Local two-phase flow parameters for Run 3 acquired along the vertical axis at measurement port 4 (P4)Run 3: jg,ab= 0.300 [m/s] &jf= 2.203 [m/s]Measurement Location: L/D = 329 (Port 4)
Test Conditions: Sampling frequency: Measurement Time:Qg [acfln] = 0.536 Pback [psig] = 20 jg,loc [m/s] =0.269 fl [I s] = 10,000 AT 1 [s] = 10Qf [gpm] = 69.30 P1oc [psig] = 1.7 jf [m/s] = 2.200 fý2 [ I/s] = 10,000 AT 2 [s] 10
r/R fb1 [1/si fb2 [i/s] aI a 2 aT a,, [1/mr] ak [1/m] a1T [1/m] ug, [m/s] Ug2 [m/s] D., [mm] D.2 [mm]
0.9054 89.3 3.4 0.151 0.269 0.420 101.11 5.19 106.30 2.069 3.717 8.9 311.20.8175 41.7 3.5 0.060 0.264 0.325 42.73 4.92 47.65 2.284 3.618 8.5 322.30.7296 17.0 3.8 0.027 0.263 0.290 15.71 4.75 20.46 2.641 3.913 10.1 332.60.6417 8.7 3.7 0.015 0.244 0.259 8.25 4.83 13.08 2.728 4.037 11.0 303.40.5539 5.7 3.7 0.013 0.236 0.249 5.40 4.07 9.47 2.914 3.660 14.4 347.50.4660 6.1 3.7 0.015 0.215 0.230 5.34 3.79 9.13 2.912 3.544 16.9 340.70.3781 4.5 3.5 0.011 0.195 0.207 4.07 3.44 7.51 2.904 3.717 16.8 340.60.2903 4.1 3.2 0.010 0.178 0.188 3.87 2.60 6.47 2.855 3.423 16.0 411.00.2024 5.5 2.8 0.015 0.131 0.146 5.33 1.13 6.46 2.741 2.586 17.1 694.50.1145 5.2 1.9 0.015 0.081 0.096 5.45 0.19 5.64 2.555 0.658 16.5 2545.30.0266 5.1 1.0 0.014 0.037 0.051 5.31 0.21 5.52 2.502 0.435 16.0 1054.3-0.0612 0.0 0.0 0.000 0.000 0.000 0.00 0.00 0.00 0.000 0.000-0.1491 0.0 0.0 0.000 0.000 0.000 0.00 0.00 0.00 0.000 0.000-0.2370 0.0 0.0 0.000 0.000 0.000 0.00 0.00 0.00 0.000 0.000-0.3249 0.0 0.0 0.000 0.000 0.000 0.00 0.00 0.00 0.000 0.000-0.4127 0.0 0.0 0.000 0.000 0.000 0.00 0.00 0.00 0.000 0.000-0.5006 0.0 0.0 0.000 0.000 0.000 0.00 0.00 0.00 0.000 0.000-0.5885 0.0 0.0 0.000 0.000 0.000 0.00 0.00 0.00 0.000 0.000-0.6763 0.0 0.0 0.000 0.000 0.000 0.00 0.00 0.00 0.000 0.000-0.7642 0.0 0.0 0.000 0.000 0.000 0.00 0.00 0.00 0.000 0.000
Calculated Results:<a,> = 0.011 <ail> [1/m] =6.02 <<Ugl>> [mi/s = 2.347
<a 2> = 0.089 <an> [I/m] = 1.42 <<ug2>> [m/s] = 3.393
<ar> = 0.100 <aiT> [I/m] =7.44 <<u»>> [m/s] = 3.352
(.,

35
1.00 a 0
0 AD00 AD
0.5 £2£2
43
•0.0
I-
-0.5
-1.0
0..0 0.2 0.4 0.6Void fraction, a
(a)
1.0
0.5
P0.0
-0.5
-1.0
o 08 .0A a2
0.8 1.0
1.0
0.5
•0.0
-0.5
-1.0
A 00A 00a 00AO00
£D 0M 0-•Do
-so
0
o ail
A ai2
o aiT
0 30 60 90Interfacial area concentration, ai [I/m]
(b)
120
0 Ao A0 A0 A
0 A0 A0 A0 A
AOA 0
A I
0 1 2 3Bubble velocity, ug [m/s]
(c)
4 5
Figure 3.2.3.3 Profiles of local two-phase flow parameters for Run 3 acquired along the vertical radius of the tube atmeasurement port 4 (P4). (a) void fraction, (b) interfacial area concentration and (c) bubble velocity.
36
3.2.4 Summary of results for Run 4.

Table 3.2.4.1 Local two-phase flow parameters for Run 4 acquired along the vertical axis at measurement port 1 (P1)Run 4: jga= 0.587 [m/s] &jf= 0.560 [m/s]
Measurement Location: L/D = 197 (Port 1)
Test Conditions: Sampling frequency: Measurement Time:Qg [acfin] = 0.975 Pback [psig] = 22.5 jg,,oc [m/s] =0.549 fsl [ Is] = 10,000 AT1 [s] = 10Qf [gpm] = 17.80 Pio' [psig] = 1.0 jf [m/s] = 0.565 f2 [ l/s] = 10,000 AT 2 [s] = 10
r/R fbl [1/s] fb2 [I/s] a, a2 (XT ail [1/m] a,2 [1/m] aiT [1/m] ug, [m/s] ug2 [m/s] D., [mm] D.2 [mm]
0.9054 3.6 0.6 0.019 0.721 0.741 7.89 0.78 8.67 1.054 1.124 14.5 5549.20.8175 1.1 0.7 0.006 0.730 0.736 2.25 1.88 4.13 1.315 2.021 15.2 2329.50.7296 0.4 0.7 0.002 0.717 0.719 0.53 1.66 2.19 2.170 1.895 24.9 2591.60.6417 0.4 0.7 0.002 0.673 0.674 0.10 1.66 1.76 2.415 1.788 96.0 2431.10.5539 0.4 0.7 0.002 0.654 0.656 0.15 1.73 1.88 2.254 1.837 88.0 2267.50.4660 0.4 0.6 0.002 0.645 0.647 0.00 1.25 1.25 2.177 1.721 3094.10.3781 0.4 0.5 0.002 0.647 0.649 0.00 1.21 1.21 1.940 1.757 3208.80.2903 0.2 0.6 0.001 0.648 0.649 0.08 1.09 1.17 1.810 1.652 67.5 3569.20.2024 0.5 0.7 0.003 0.643 0.645 0.66 1.01 1.67 1.620 1.700 23.6 3818.00.1145 0.5 0.6 0.003 0.619 0.621 1.27 0.18 1.45 1.555 0.641 11.8 20630.00.0266 0.6 0.7 0.003 0.618 0.621 0.56 0.00 0.56 1.558 0.000 33.2-0.0612 0.3 0.8 0.002 0.555 0.557 0.32 0.00 0.32 1.662 0.000 31.9-0.1491 0.2 0.7 0.001 0.357 0.358 0.00 0.00 0.00 1.666 0.000-0.2370 0.1 0.8 0.000 0.291 0.292 0.00 0.00 0.00 1.763 0.000-0.3249 0.0 0.2 0.000 0.073 0.073 0.00 0.00 0.00 0.924 0.000-0.4127 0.0 0.0 0.000 0.000 0.000 0.00 0.00 0.00 0.000 0.000-0.5006 0.0 0.0 0.000 0.000 0.000 0.00 0.00 0.00 0.000 0.000 1-0.5885 0.0 0.0 0.000 0.000 0.000 0.00 0.00 0.00 0.000 0.000I
-0.6763 0.0 0.0 0.000 0.000 0.000 0.00 0.00 0.00 0.000 0.000I-0.7642 0.0 0.0 0.000 0.000 0.000 0.00 0.00 0.00 0.000 0.000,
Calculated Results:<ax> = 0.002 <ail> [1/m] =0.43 <<ugl>> [m/s] = 1.498
<a2> = 0.428 <ai2> [I/m] =0.54 <<ug2>> [m/s] = 1.111
<aT> = 0.429 <aiT> [1/m] =-0.97 <<u»>> [m/s] = 1.190

38
1.0
0.5
1 0.0
-0.5
-1.0
1.0
0.5
0.0
A 00AO El
o A 0
0 aia0
A03
0 .1a
0 ail
A, ai2
I 0 aiT
-0.5
-1.00.0 0.2 0.4 0.
Void fraction,(a)
1.0
0.5
p0.0
-0.5
-1.0
6, CE
0.8 1.0 0 5Interfacial area concentration, ai [1/m]
(b)
10
Ch0 A
A0A 0A 0
A 0AO
AO
A 0
000
00
o ig
Aog
0 1 2 3Bubble velocity, Ug [m/s]
(c)
4 5
Figure 3.2.4.1 Profiles of local two-phase flow parameters for Run 4 acquired along the vertical radius of the tube atmeasurement port I (P1). (a) void fraction, (b) interfacial area concentration and (c) bubble velocity.

Table 3.2.4.2 Local two-phase flow parameters for Run 4 acquired along the vertical axis at measurement port 3 (P3)Run 4: jg,at= 0.587 [m/s] &jf= 0.560 [m/s]
Measurement Location: L/D = 250 (Port 3)
Test Conditions: Sampling frequency: Measurement Time:Q0 [acfm] = 0.915 Pback [psig] = 25.1 Jg1co. [miS] =0.551 fl [1/S] = 10,000 AT, [s] = 10
Qf [gpm] = 17.50 Plo. [psig] = 1.0 jf [m/s] = 0.556 fs2 [ 1/s] = 10,000 AT 2 [s] = 10
r/R fb1 [1/s] fb 2 [I/si ai a2 aT ail [I/m] a2 [1/rn] afT [1/mi Ul [rm/s] uO [m/s] D.l [mm] Dm2 [mm]0.9054 4.8 0.6 0.034 0.698 0.732 11.42 1.11 12.53 0.946 2.178 18.0 3774.10.8175 1.9 0.6 0.012 0.679 0.691 3.92 1.34 5.26 1.281 1.990 18.8 3040.30.7296 0.7 0.6 0.003 0.694 0.697 0.80 1.12 1.92 1.816 1.884 23.3 3718.90.6417 0.3 0.5 0.002 0.673 0.674 0.33 1.10 1.43 1.852 1.852 29.1 3668.20.5539 0.5 0.6 0.002 0.660 0.662 0.31 1.32 1.63 1.574 1.741 40.6 2998.60.4660 0.4 0.5 0.003 0.656 0.659 0.66 0.94 1.60 1.590 1.946 22.7 4189.80.3781 0.3 0.6 0.002 0.671 0.673 0.25 1.34 1.59 1.702 1.946 45.6 3005.80.2903 0.4 0,6 0.002 0.657 0.659 0.76 0.88 1.64 1.575 1.503 15.0 4479.50.2024 0.5 0.6 0.003 0.661 0.664 0.68 0.14 0.82 1.408 0.285 22.1 28341.40.1145 0.6 0.5 0.003 0.634 0.637 1.31 0.00 1.31 1.263 0.000 12.40.0266 0.4 0.7 0.002 0.621 0.624 0.76 0.00 0.76 1.442 0.000 17.4-0.0612 0.4 0.8 0.002 0.583 0.585 0.38 0.00 0.38 1.417 0.000 30.0-0.1491 0.3 0.8 0.002 0.424 0.426 0.00 0.00 0.00 1.801 0.000
-0.2370 0.1 0.5 0.000 0.323 0.324 0.11 0.00 0.11 1.831 0.000 16.4-0.3249 0.1 0.3 0.000 0.131 0.131 0.00 0.00 0.00 1.415 0.000
-0.4127 0.0 0,0 0.000 0.000 0.000 0.00 0.00 0.00 0.000 0.000-0.5006 0.0 0.0 0.000 0.000 0.000 0.00 0.00 0.00 0.000 0.000-0.5885 0.0 0.0 0.000 0.000 0.000 0.00 0.00 0.00 0.000 0.000-0.6763 0.0 0.0 0.000 0.000 0.000 0.00 0.00 0.00 0.000 0.000
-0.7642 0.0 0.0 0.000 0.000 0.000 0.00 0.00 0.00 0.000 0.000
Calculated Results:<a,1> = 0.002 <ail> [1/m] = 0.69 <<UI»>> [m/s] = 1.280
<a 2> = 0.441 <an> [1/mi =0.39 <<Ug2>> [m/s] = 0.960
<aT> = 0.443 <aiT> [1/m] = 1.07 <<ug>> [m/s] = 1.026
C.O

40
1.0.
0.5
0.0
-0.5
-1.0
1.0
0.5
1 0.0W-
0 0
M 0 0c•o
0 a00 40CA 0
Q0
0, ail
a ai2
0 aiT
-0.5
-1.00.0 0.2 0.4 0.6
Void fraction, a(a)
0.8 1.0 0 5 10 15Interfacial area concentration, ai [1/m]
(b)
20
1.0
0.5
P0.0
0
0ACA0A
A 00
00
00
0
-0.5
-1.0
0 1 2 3Bubble velocity, ug [m/s]
(c)
4 5
Figure 3.2.4.2 Profiles of local two-phase flow parameters for Run 4 acquired along the vertical radius of the tube atmeasurement port 3 (P3). (a) void fraction, (b) interfacial area concentration and (c) bubble velocity.

Table 3.2.4.3 Local two-phase flow parameters for Run 4 acquired along the vertical axis at measurement port 4 (P4)
Run 4- jg,a,= 0.587 [m/s] &jf= 0.560 [m/s]Measurement Location: L/D = 329 (Port 4)
Test Conditions: Sampling frequency: Measurement Time:Qg [acfin] = 0.954 Pback [psig] = 23.5 Jg,joc [m/s] =0.551 fsl [ I/S] = 10,000 AT 1 [s] = 10Qf [gpm] = 17.40 P1o. [psig] = 1.0 jf [m/s] = 0.552 f,2 [ I/s] = 10,000 AT 2 [s] = 10
r/R fb1 [I/s] fb2 [l/s] al O2 aT a,, [1/m] a.2 [1/m] aiT [I/m] ugi [m/s] ug2 [m/s] D., [mm] D.2 [mm]0.9054 2.1 0.5 0.011 0.700 0.711 5.22 1.59 6.81 1.053 1.913 12.8 2639.60.8175 0.4 0.5 0.002 0.680 0.682 0.00 1.29 1.29 2.248 1.842 3164.20.7296 0.4 0.5 0.001 0.678 0.679 0.10 1.38 1.48 2.190 1.750 84.0 2945.70.6417 0.4 0.6 0.002 0.680 0.681 0.00 1.54 1.54 3.337 1.890 2647.40.5539 0.3 0.5 0.001 0.656 0.657 0.26 1.08 1.34 2.054 1.682 18.5 3646.10.4660 0.2 0.5 0.001 0.640 0.642 0.52 1.11 1.63 1.456 1.718 13.8 3461.10.3781 0.3 0.6 0.001 0.665 0.666 0.39 1.18 1.57 1.595 1.763 21.5 3381.40.2903 0.3 0.5 0.002 0.661 0.663 0.14 0.74 0.88 1.647 1.576 81.4 5361.90.2024 0.6 0.6 0.004 0.646 0.650 0.64 0.00 0.64 1.511 0.000 37.50.1145 0.5 0.6 0.003 0.630 0.633 0.79 0.00 0.79 1.163 0.000 22.00.0266 0.5 0.6 0.003 0.599 0.602 1.37 0.00 1.37 1.124 0.000 11.8-0.0612 0.3 0.6 0.001 0.567 0.568 0.67 0.00 0.67 1.554 0.000 10.7-0.1491 0.5 0.7 0.004 0.360 0.364 0.81 0.00 0.81 1.409 0.000 25.9-0.2370 0.1 0.5 0.000 0.211 0.211 0.00 0.00 0.00 1.621 0.000-0.3249 0.0 0.0 0.000 0.000 0.000 0.00 0.00 0.00 1.440 0.000-0.4127 0.0 0.0 0.000 0.000 0.000 0.00 0.00 0.00 0.000 0.000-0.5006 0.0 0.0 0.000 0.000 0.000 0.00 0.00 0.00 0.000 0.000-0.5885 0.0 0.0 0.000 0.000 0.000 0.00 0.00 0.00 0.000 0.000-0.6763 0.0 0.0 0.000 0.000 0.000 0.00 0.00 0.00 0.000 0.000-0.7642 0.0 0.0 0.000 0.000 0.000 0.00 0.00 0.00 0.000 0.000
Calculated Results:<a,> = 0.002 <ail> [1/m] =0.44 <<ug 1>> [m/s] = 1.436
<a2> = 0.420 <an> [1/m] =-0.40 <<ug2>> [m/s] = 0.926
<aT> = 0.421 <aiT> [1/m] =0.83 <<Ug>> [m/s] = 0.991

42
1.0
0.5
0.0
-0.5
-1.0
0.0 0.2 0.4 0.6Void fraction, a
(a)
1.0
0.5
I-0.0
-0.5
-1.0
1.0
0.5
;n n
-0.5
-1.0
- a0 ao ao
o a
o ail
a ai2
o aiT
0.8 1.0 0 5Interfacial area concentration, ai [1/m]
(b)
10
o AA o
A 0A0
QA00 A
06
010
0000 0
oug
0 1 2 3Bubble velocity, ug [m/s]
(c)
4 5
Figure 3.2.4.3 Profiles of local two-phase flow parameters for Run 4 acquired along the vertical radius of the tube atmeasurement port 4 (P4). (a) void fraction, (b) interfacial area concentration and (c) bubble velocity.

43
3.2.5 Summary of results for Run 5.

Table 3.2.5.1 Local two-phase flow parameters for Run 5 acquired along the vertical axis at measurement port 1 (P1)Run 5: jg,,a= 0.603 [m/s] &jf= 0.1.653 [m/s]
Measurement Location: L/D = 197 (Port 1)
Test Conditions: Sampling frequency: Measurement Time:Qg [acfin] = 1.019 Pback [psig] = 22.1 Jg, loc [m/s] =0.550 fl [ 1/si = 10,000 AT 1 [s] = 10Qf [gpm] = 52.20 Plo0 [psig] = 1.5 jf [m/s] = 1.657 f,2 [ 1/s] = 10,000 AT 2 [s] 6
r/R fb1 [1/s] fb2 [/s] al U2 aT afl [1/m] a.2 [/m] aiT [I/m] Ugl [mis] ug2 [m/s] D. 1 [mm] D.2 [mm]0.9054 54.6 3.6 0.124 0.468 0.592 68.05 2.08 70.13 1.903 1.812 11.0 1349.10.8175 25.6 4.3 0.046 0.493 0.539 28.58 7.17 35.75 2.033 3.556 9.7 412.90.7296 11.5 4.0 0.022 0.481 0.503 11.79 4.71 16.50 2.468 3.344 11.1 613.20.6417 6.0 4.1 0.012 0.468 0.480 6.25 5.91 12.16 2.746 3.568 11.8 474.80.5539 4.5 4.1 0.010 0.463 0.473 4.29 4.57 8.86 2.748 3.319 14.0 608.30.4660 3.9 4.4 0.010 0.440 0.450 3.94 4.91 8.85 2.894 3.476 15.5 537.80.3781 4.0 3.8 0.010 0.418 0.428 4.11 4.14 8.25 2.762 3.418 14.7 605.90.2903 4.9. 3.9 0.013 0.401 0.414 5.06 3.57 8.63 2.654 3.464 15.1 674.50.2024 5.4 4.3 0.014 0.398 0.412 5.68 3.45 9.13 2.543 3.115 14.7 692.70.1145 7.5 3.8 0.022 0.319 0.341 7.59 0.77 8.36 2.474 1.040 17.2 2487.30.0266 7.4 3.6 0.021 0.249 0.270 7.87 0.88 8.75 2.362 0.720 15.7 1697.7-0.0612 5.2 3.1 0.015 0.166 0.182 5.79 0.00 5.79 2.383 0.000 16.0-0.1491 4.5 2.1 0.014 0.075 0.089 5.58 0.00 5.58 2.290 0.000 15.5-0.2370 0.0 0.0 0.000 0.000 0.000 0.00 0.00 0.00 0.000 0.000-0.3249 0.0 0.0 0.000 0.000 0.000 0.00 0.00 0.00 0.000 0.000-0.4127 0.0 0.0 0.000 0.000 0.000 0.00 0.00 0.00 0.000 0.000-0.5006 0.0 0.0 0.000 0.000 0.000 0.00 0.00 0.00 0.000 0.000-0.5885 0.0 0.0 0.000 0.000 0.000 0.00 0.00 0.00 0.000 0.000-0.6763 0.0 0.0 0.000 0.000 0.000 0.00 0.00 0.00 0.000 0.000-0.7642 0.0 0.0 0.000 0.000 0.000 0.00 0.00 0.00 0.000 0.000
Calculated Results:<a,> = 0.013 <ail> [1/m] =5.91 <<ugl>> [m/s] = 2.180
<a 2> = 0.225 <ai2> [1/m] = 1.84 <<u,2>> [m/s] = 2.614
<aT> = 0.238 <aiT> [1/m] =-7.75 <<ug>> [m/s] = 2.729
45
1.0-0 a 0o AD0
o La3
0.5 A
oLa7dD
-0.5 0 atl
A a20 aT
-1.0
1.0 ~Coa 0 0
a 0 0a 0
Go0.5 -Z0
-do-00-600
0.0
-0.5 0 ail
a ai2
0 aiT-1.0
0.0 0.2 0.4 0.6Void fraction, a
(a)
0.8 1.0 0 20 40 60 80Interfacial area concentration, ai [1/m]
(b)
100
1.0
0.5
0.0
-0.5
-1.0
0o A
0 A0 A
0 A0 A
0 a0 a
A 0
00
i i oOigi
oug
0 1 2 3Bubble velocity, ug [m/s]
(c)
4 5
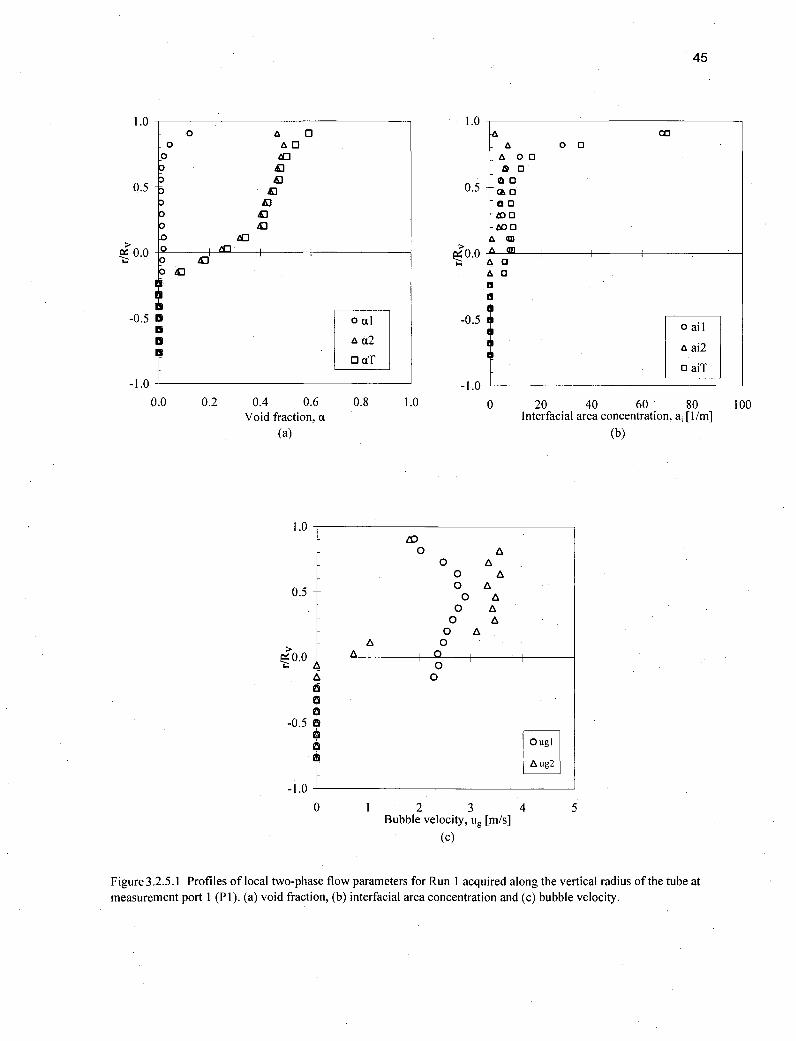
Figure 3.2.5.1 Profiles of local two-phase flow parameters for Run I acquired along the vertical radius of the tube atmeasurement port 1 (P 1). (a) void fraction, (b) interfacial area concentration and (c) bubble velocity.

Table 3.2.5.2 Local two-phase flow parameters for Run 5 acquired along the vertical axis at measurement port 3 (P3)Run 5: jg~at= 0.603 [m/s] &jf= 1.653 [m/s]
Measurement Location: L/D = 250 (Port 3)
Test Conditions: Sampling frequency: Measurement Time:Qg [acfin] = 0.921 Pb k [psig] = 25.6 jg,i. [m/s] =0.551 fl [I/s] = 10,000 AT, [s] 10Qf[gpm] = 51.90 PIoC [psig] = 1.3 jf[m/s] 1.648 f2 [I /s] = 10,000 AT 2 [s] 10
r/R fb1 [1/s] fb 2 [1/s] CI (X2 aT ail [1/rn] a2 [1/mr] aiT [1/m] UgI [m/S] Ug2 [m/s] D.m [mm] D.2 [mm]0.9054 59.5 3.6 0.116 0.477 0.593 67.83 4.94 72.77 2.071 3.672 10.2 579.60.8175 29.0 3.7 0.059 0.477 0.535 31.49 4.58 36.07 2.116 3.364 11.1 624.60.7296 12.5 3.6 0.021 0.471 0.493 13.18 4.72 17.90 2.291 3.463 9.7 598.90.6417 6.7 3.7 0.013 0.450 0.463 6.54 4.12 10.66 2.594 3.275 11.7 655.90.5539 4.9 3.5 0.010 0.444 0.454 5.23 4.01 9.24 2.591 3.518 11.0 664.80.4660 5.3 3.6 0.011 0.431 0.443 5.29 3.81 9.10 2.587 3.185 12.7 679.40.3781 5.7 3.7 0.013 0.417 0.430 6.32 3.49 9.81 2.598 3.287 12.5 716.20.2903 6.8 3.7 0.015 0.402 0.418 7.54 3.01 10.55 2.474 3.049 12.0 802.10.2024 7.8 4.0 0.018 0.354 0.372 8.99 2.29 11.28 2.377 3.169 12.3 927.50.1145 9.4 3.4 0.024 0.270 0.295 10.42 0.94 11.36 2.351 2.299 14.0 1724.70.0266 8.9 2.8 0.024 0.183 0.207 10.16 0.19 10.35 2.198 0.400 13.9 5785.3-0.0612 8.2 1.8 0.026 0.078 0.104 9.26 0.00 9.26 2.126 0.000 16.7-0.1491 3.4 0.1 0.012 0.005 0.017 5.09 0.00 5.09 1.085 0.000 13.7-0.2370 0.0 0.0 0.000 0.000 0.000 0.00 0.00 0.00 0.000 0.000-0.3249 0.0 0.0 0.000 0.000 0.000 0.00 0.00 0.00 0.000 0.000-0.4127 0.0 0.0 0.000 0.000 0.000 0.00 0.00 0.00 0.000 0.000-0.5006 0.0 0.0 0.000 0.000 0.000 0.00 0.00 0.00 0.000 0.000-0.5885 0.0 0.0 0.000 0.000 0.000 0.00 0.00 0.00 0.000 0.000-0.6763 0.0 0.0 0.000 0.000 0.000 0.00 0.00 0.00 0.000 0.000-0.7642 0.0 0.0 0.000 0.000 0.000 0.00 0.00 0.00 0.000 0.000
Calculated Results:<a,> = 0.015 .<ail> [1/mi =7.26 <Ugl>> [m/s] = 2.058
<%> = 0.199 <ani2> [1/m] = 1.50 <<ug2>> [m/s] = 2.930<aT> = 0.214 <aiT> [I/m] = 8.76 <<Ug>> [m/s] = 2.998

47
1.0
0 a 00 A
0.5 -
o too0b•0..0 o -A0
-0.5 0 cii
A ct20oaT
-1.0
1.0A 00
a 000
A 00AO 0
0.5 -too_A0 0
A4 00A O0
0.0 0
-0.5 o ail
a ai2
0 aiT-1 .0
0.0 0.2 0.4 0.Void fraction
(a)
1.0
0.5
0.0
-0.5
-1.0
6, a
0.8 1.0 0 20 40 60 80Interfacial area concentration, ai [1/m]
I (b)
100
o AO AO A
O AO AO AO A
O Ao A.
A a0
0
Oug
A g
0 1 2 3Bubble velocity, ug [m/s]
(c)
4 5
Figure 3.2.5.2 Profiles of local two-phase flow parameters for Run 5 acquired along the vertical radius of the tube at
measurement port 3 (P3). (a) void fraction, (b) interfacial area concentration and (c) bubble velocity.

Table 3.2.5.3 Local two-phase flow parameters for Run 5 acquired along the vertical axis at measurement port 4 (P4)Run 5: jg,atm= 0.603 [m/s] &jf= 1.653 [m/s]Measurement Location: L/D = 329 (Port 4)
Test Conditions: Sampling frequency: Measurement Time:Qg [acfm] = 0.898 Pb~k [psig] = 26.6 ig1loc [m/s] =0.551 fsl [Il/s] = 10,000 AT1 [s] = 10Qf [gpm] = 51.90 PIo0 [psig] = 1.3 jf [m/s] = 1.648 f•2 [ l/s] = 10,000 AT 2 [S] = 10
r/R fb1 [i/s] fb2 [l/s] a, a2 aT ail [l/m] a [1/mr] aT [1/m] Ugl [m/s] ug2 [m/s] D.m1 [mm] D.2 [mm]0.9054 43.1 3.2 0.080 0.471 0.551 50.86 5.16 56.02 1.985 4.210 9.4 547.80.8175 20.7 3.4 0.033 0.477 0.510 22.15 4.89 27.04 2.150 3.451 9.0 584.80.7296 8.8 3.4 0.015 0.466 0.481 8.87 4.64 13.51 2.527 3.666 9.8 603.10.6417 5.9 3.5 0.012 0.454 0.A67 5.97 4.31 10.28 2.663 3.443 12.4 632.40.5539 4.6 3.5 0.009 0.450 0.459 4.61 4.44 9.05 2.715 3.328 12.1 608.20.4660 3.9 3.6 0.009 0.431 0.440 3.93 4.12 8.05 2.743 3.283 13.0 628.00.3781 4.9 3.7 0.013 0.433 0.446 4.87 3.81 8.68 2.741 3.255 15.9 681.70.2903 4.1 3.8 0.010 0.405 0.415 4.27 2.98 7.25 2.642 3.391 14.2 814.40.2024 6.4 3.4 0.018 0.357 0.375 6.84 1.46 8.30 2.554 2.584 15.6 1467.50.1145 7.2 3.3 0.021 0.283 0.304 7.32 0.23 7.55 2.546 0.540 16.9 7390.40.0266 7.2 3.1 0.021 0.214 0.235 7.49 0.34 7.83 2.359 0.384 16.7 3778.2-0.0612 6.0 2.3 0.017 0.115 0.132 6.57 0.00 6.57 2.401 0.000 15.3-0.1491 5.9 0.6 0.020 0.025 0.044 7.53 0.00 7.53 2.253 0.000 15.5-0.2370 0.0 0.0 0.000 0.000 0.000 0.00 0.00 0.00 0.000 0.000-0.3249 0.0 0.0 0.000 0.000 0.000 0.00 0.00 0.00 0.000 0.000-0.4127 0.0 0.0 0.000 0.000 0.000 0.00 0.00 0.00 0.000 0.000-0.5006 0.0 0.0 0.000 0.000 0.000 0.00 0.00 0.00 0.000 0.000.-0.5885 0.0 0.0 0.000 0.000 0.000 0.00 0.00 0.00 0.000 0.000-0.6763 0.0 0.0 0.000 0.000 0.000 0.00 0.00 0.00 0.000 0.000-0.7642 0.0 0.0 0.000 0.000 0.000 0.00 0.00 0.00 0.000 0.000
Calculated Results:<ax> = 0.012 .<ail> [1/m] = 5.50 <ugl>> [m/s] = 2.221
<a 2> = 0.208 <ai2> [I/m] = 1.49 <<ug2>> [m/s] = 2.729
<aT> = 0.220 <aiT> [I/m] = 6.99 <<u,>> [m/s] = 2.837
.41GO

49
1.0 - 0 A 030 4
0.5 E
0 4:1I
-0 4JFý0.0 -0
Ion
-0.5
-1.0
0.0 0.2 0.4 0.6Void fraction, a
(a)
1.0
0.5
•0.0 _
-0.5
-1.0
0 ala a2
o aT
0.8 1.0
1.0
0.5
•0.0
-0.5
-1.0
0 00 0
a 0 0ao aaO 0
ek 0
&0 0bo 0-600
a
0
0 ail
a ai2
0 aiT
0 10 20 30 40 50interfacial area concentration, ai [1/m]
(b)
60
oo Ao A.o Ao Ao A
o A
A 0A t 0
00
0 Ag
0 1 2 3Bubble velocity, u, [m/s]
(c)
4 5
Figure 3.2.5.3 Profiles of local two-phase flow parameters for Run 5 acquired along the vertical radius of the tube atmeasurement port 4 (P4). (a) void fraction, (b) interfacial area concentration and (c) bubble velocity.

50
3.2.6 Summary of results for Run 6.

Table 3.2.6.1 Local two-phase flow parameters for Run 6 acquired along the vertical axis at measurement port 1 (P1)Run 6: jg,a&= 0.625 [m/s] &jf= 2.203 [m/s]Measurement Location: L/D = 197 (Port 1)
Test Conditions: Sampling frequency: Measurement Time:
Qg [acfin] = 1.019 Pback [psig] = 23.2 Jg,loc [m/s] =0.549 fo [ I/s] = 10,000 AT, [s] = 10Qf [gpm] = 69.50 Ploc [psig] = 2.0 jf [m/s] = 2.207 f,2 [ I/si = 10,000 AT 2 [s] = 10
r/R fbl [1/s] fb2 [/s] a1 , a2 aT a. [/rn a [1/m] aiT [1/nM] UgI [m/s] Ug2 [mis] D.m [mm] D2 [mrm]0.9054 124.0 5.3 0.212 0.405 0.616 129.66 6.55 136.21 2.329 4.525 9.8 370.70.8175 78.2 5.5 0.106 0.406 0.511 74.35 6.82 81.17 2.565 4.918 8.5 356.80.7296 51.0 5.5 0.069 0.404 0.473 45.09 5.83 50.92 2.813 4.200 9.1 416.10.6417 30.8 5.4 0.041 0.390 0.431 26.18 5.34 31.52 2.981 4.374 9.3 438.50.5539 21.4 5.9 0.034 0.382 0.416 18.06 5.46 23.52 3.066 4.111 11.3 419.70.4660 15.1 5.5 0.027 0.362 0.389 12.28 5.16 17.44 3.317 4.120 13.0 420.90.3781 12.4 5.8 0.021 0.347 0.368 9.44 5.12 14.56 3.438 4.225 13.6 406.40.2903 10.8 5.5 0.020 0.324 0.345 8.37 4.05 12.42 3.507 3.860 14.6 480.60.2024 11.4 5.2 0.023 0.267 0.291 9.46 3.24 12.70 3.337 3.827 14.8 494.80.1145 13.8 4.3 0.034 0.180 0.214 11.66 1.85 13.51 3.006 2.911 17.2 584.80.0266 15.4 2.6 0.039 0.095 0.134 13.26 0.25 13.51 2.934 0.535 17.6 2277.6-0.0612 12.1 1.0 0.027 0.032 0.059 10.76 0.00 10.76 2.772 0.000 15.1-0.1491 1.6 0.0 0.004 0.000 0.004 1.50 0.00 1.50 0.572 0.000 17.6-0.2370 0.0 0.0 0.000 0.000 0.000 0.00 0.00 0.00 0.000 0.000-0.3249 0.0 0.0 0.000 0.000 0.000 0.00 0.00 0.00 0.000 0.000-0.4127 0.0 0.0 0.000 0.000 0.000 0.00 0.00 0.00 0.000 0.000-0.5006 0.0 0.0 0.000 0.000 0.000 0.00 0.00 0.00 0.000 0.000-0.5885 0.0 0.0 0.000 0.000 0.000 0.00 0.00 0.00 0.000 0.000-0.6763 0.0 0.0 0.000 0.000 0.000 0.00 0.00 0.00 0.000 0.000-0.7642 0.0 0.0 0.000 0.000 0.000 0.00 0.00 0.00 0.000 0.000
Calculated Results:<a,> = 0.025 <ail> [1/m] = 13.25 << ugl>> [m/s] = 2.634
<a 2> = 0.157 <an> [1/m] =2.08 <<ug2>> [m/s] = 3.905
<ar> = 0.182 <aiT> [I/m] = 15.33 «<ug>> [m/s] = 3.855
01n
52
1.00 A 0
0 A 0o AQ
o AD0.5 0o
-0 a a7o AO3
0.0 0 a 0
-0.5o l
. a20 aT
-1.0
1.0A 00A 00
A 00
a 00A 00
0.5 0 aoi
AoO
>00 a ,,
-0.5oal
a ai2
0 aiT
-1.00.0 0.2 0.4 0.6
Void fraction, a
(a)
0.8 1.0 0 30 60 90 120Interfacial area concentration, ai [1/m]
(b)
150
1.0
0.5
Fý0.0
0 Aoo A
o A0 A
o Ao Ao A
o A0 A0
A q0
0
0 g
A g-0.5
-1.0
0 1 2 3Bubble velocity, ug [mis]
(c)
4 5
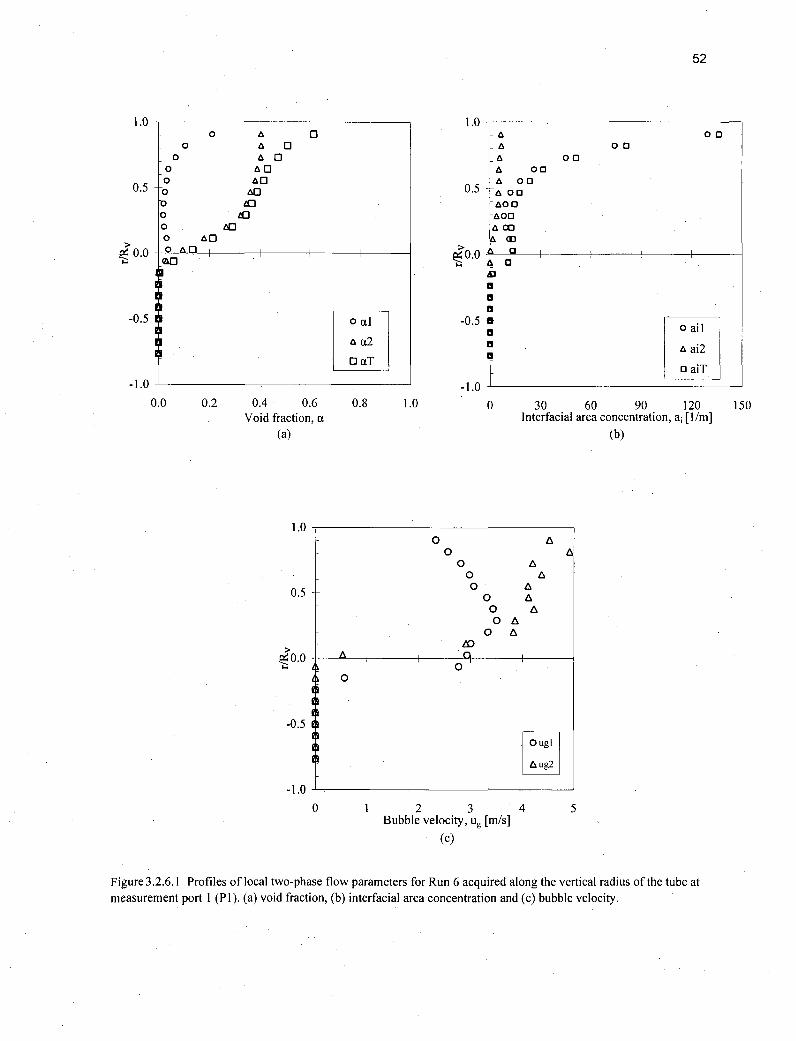
Figure 3.2.6.1 Profiles of local two-phase flow parameters for Run 6 acquired along the vertical radius of the tube atmeasurement port 1 (PI). (a) void fraction, (b) interfacial area concentration and (c) bubble velocity.

Table 3.2.6.2 Local two-phase flow parameters for Run 6 acquired along the vertical axis at measurement port 3 (P3)Run 6: jg,an= 0.625 [m/s] &jr = 2.203 [m/s]Measurement Location: L/D = 250 (Port 3)
Test Conditions: Sampling frequency: Measurement Time:Qg [acfin] = 0.923 Pback [psig] = 27.4 Jg.Ioc [m/s] =0.553 fl [ I/s = 10,000 AT1 [s] = 10Qf [gpm] = 69.30 Ploc [psig] = 2.0 jf [m/s] 2.200 f2 [ I/s] = 10,000 AT 2 [s] = 10
r/R fb1 [1/s] fb 2 [1/s] t1 a a2 UT ail [1/m] aik [1/m] aiT [1/m] UgI [m/s] Ug2 [m/s] D.m [mm] Ds2 [mm]
0.9054 105.6 5.0 0.162 0.353 0.515 101.64 1.81 103.45 2.589 2.682 9.5 1171.20.8175 72.4 5.0 0.103 0.380 0.482 64.34 4.73 69.07 2.802 4.132 9.6 481.50.7296 43.4 5.0 0.061 0.382 0.444 38.30 5.01 43.31 2.879 4.321 9.6 458.00.6417 26.9 5.1 0.038 0.375 0.413 22.92 4.67 27.59 2.972 4.036 9.8 481.90.5539 16.0 5.2 0.025 0.368 0.394 13.92 4.54 18.46 3.081 4.397 10.9 486.90.4660 14.2 5.3 0.025 0.360 0.385 11.90 4.44 16.34 3.106 4.158 12.6 485.80.3781 13.1 5.3 0.023 0.351 0.374 11.07 4.25 15.32 3.146 4.112 12.5 495.50.2903 12.0 5.1 0.021 0.335 0.356 10.52 3.84 14.36 3.058 4.126 11.9 523.40.2024 12.3 5.5 0.023 0.313 0.336 11.29 3.86 15.15 3.034 4.037 12.3 486.20.1145 14.2 5.2 0.031 0.251 0.282 13.89 3.01 16.90 2.871 4.097 13.5 500.70.0266 16.9 3.8 0.039 0.156 0.195 16.08 1.65 17.73 2.701 4.068 14.4 568.4-0.0612 10.8 2.3 0.023 0.076 0.100 10.78 0.23 11.01 2.613 0.699 13.0 1990.4-0.1491 0.0 0.5 0.000 0.017 0.017 0.00 0.00 0.00 0.000 0.000-0.2370 0.0 0.0 0.000 0.000 0.000 0.00 0.00 0.00 0.000 0.000-0.3249 0.0 0.0 0.000 0.000 0.000 0.00 0.00 0.00 0.000 0.000-0.4127 0.0 0.0 0.000 0.000 0.000 0.00 0.00 0.00 0.000 0.000-0.5006 0.0 0.0 0.000 0.000 0.000 0.00 0.00 0.00 0.000 0.000-0.5885 0.0 0.0 0.000 0.000 0.000 0.00 0.00 0.00 0.000 0.000-0.6763 0.0 0.0 0.000 0.000 0.000 0.00 0.00 0.00 0.000 0.000_-0.7642 0.0 0.0 0.000 0.000 0.000 0.00 0.00 0.00 0.000 0.000_
Calculated Results:<a 1> = 0.023 <ail> [1/mi = 12.25 <<Ugl>> [m/s] = 2.634<a 2> = 0.169 <an> [1/m] = 1.92 <<ug2>> [m/s] = 3.712
<aT> = 0.192 <aiT> [I/mi = 14.17 <<ug>> [m/s] = 3.756
0,PWO

54
1.0
0.5
;0.0
-0.5
0 a 030 a~ 0o • [
o • [o A[
o •
o •0
oo ci
0 an ,,
o aT
1.0
0.5
S0.0
ooo00
00S 00
* 00* 00
-a 00_A 00-A 00
-600
0, ail
a ai2
0 aiT
-0.5
1.0 -1.00.0 0.2 0.4 0.6
Void fraction, a(a)
1.0-
0.5
P0.0
-0.5
-1.0
0.8 1.0 0 30 60 90Interfacial area concentration, ai [1/m]
(b)
120
CA0 A0 A0 A0 A0 A0 A
0 A0 A0 A
0
0 1 2 3Bubble velocity, ug [mis]
(c)
4 5
Figure 3.2.6.2 Profiles of local two-phase flow parameters for Run 6 acquired along the vertical radius of the tube atmeasurement port 3 (P3). (a) void fraction, (b) interfacial area concentration and (c) bubble velocity.

Table 3.2.6.3 Local two-phase flow parameters for Run 6 acquired along the vertical axis at measurement port 4 (P4)Run 6 : jga,= 0.6 2 5 [m/s] &jf= 2 .2 03 [m/s]Measurement Location: L/D = 329 (Port 4)
Test Conditions: Sampling frequency: Measurement Time:Qg [acfin] = 0.917 Pback [psig] = 27.3 Jg,1oc [m/s] =0.551 fs, [ I/s] = 10,000 AT1 [s] =10Qf [gpm] = 69.20 P1o. [psig] = 1.9 jf[m/s] = 2.197 f,2 [ l/s] = 10,000 AT 2 [s] = 10
r/R fb1 [1/s] fb2 [Is] 1A a2 aT all [1/m] a [1/m] aiT [1/mi Ug1 [m/s] ug2 [m/s] D., [mm] D. [mm]0.9054 86.9 4.5 0.119 0.394 0.514 85.48 5.79 91.27 2.513 4.136 8.4 408.50.8175 54.0 4.6 0.068 0.398 0.466 49.52 5.09 54.61 2.725 4.556 8.2 469.00.7296 34.7 4.8 0.045 0.397 0.442 31.55 4.73 36.28 2.834 4.397 8.6 504.10.6417 23.5 4.6 0.033 0.385 0.417 20.48 4.29 24.77 2.999 3.967 9.5 538.30.5539 16.8 5.1 0.025 0.380 0.406 14.71 4.62 19.33 3.041 4.539 10.4 493.60.4660 11.8 5.0 0.020 0.369 0.388 9.35 4.31 13.66 3.331 4.197 12.8 513.00.3781 9.8 4.8 0.018 0.360 0.379 7.90 3.65 11.55 3.267 3.938 14.0 591.90.2903 9.1 4.9 0.019 0.338 0.357 7.31 3.31 10.62 3.324 4.022 15.7 611.80.2024 10.7 5.3 0.026 0.281 0.307 9.00 2.87 11.87 3.206 3.924 17.1 588.10.1145 14.0 4.1 0.036 0.206 0.243 12.24 1.44 13.68 3.030 2.861 17.8 859.20.0266 13.5 3.0 0.036 0.122 0.158 12.16 0.20 12.36 2.889 0.916 17.9 3657.0-0.0612 10.7 1.5 0.025 0.050 0.075 9.61 0.00 9.61 2.790 0.000 15.3-0.1491 1.5 0.0 0.004 0.000 0.004 1.72 0.00 1.72 0.507 0.000 12.2-0.2370 0.0 0.0 0.000 0.000 0.000 0.00 0.00 0.00 0.000 0.000-0.3249 0.0 0.0 0.000 0.000 0.000 0.00 0.00 0.00 0.000 0.000-0.4127 0.0 0.0 0.000 0.000 0.000 0.00 0.00 0.00 0.000 0.000.0.5006 0.0 0.0 0.000 0.000 0.000 0.00 0.00 0.00 0.000 0.000-0.5885 0.0 0.0 0.000 0.000 0.000 0.00 0.00 0.00 0.000 0.000-0.6763 0.0 0.0 0.000 0.000 0.000 0.00 0.00 0.00 0.000 0.0001-0.7642 0.0 0.0 0.000 0.000 0.000 0.00 0.00 0.00 0.000 0.000_
Calculated Results:<a,> = 0.020 <ail> [1/m] = 10.24 <<ugl>> [m/s] = 2.665
<a 2> = 0.163 <ai2> [1/m] = 1.68 <<ug2>> [m/s] = 3.787
<aT> = 0.183 <aiT> [1/m] = 11.92 <<ug>> [m/s] = 3.813
CnO'1

56
1.00 ai 0
o 6o no •-
0.5 b 40
o t0 At1
.o a
-0.5
-1.0
0.0 0.2 0.4 0.6Void fraction, a
(a)
o c 1.c a2
O aT
0.8 1.0
1.0
0.5.
0.0
-0.5
-1.0
0 000 00
Li 0 0
-6 00ai 00a 00
_6O0-6 00
(iD
, 1
0 ail
a ai2
0 aiT
0 20 40 60 80Interfacial area concentration, ai [1/m]
(b)
100
1.0
0.5
S0400
o AO AO A
O AO A
O A
O AO A
AO
000
OOg
A
-0.5
-1.0
0 1 2 3Bubble velocity, ug [m/s]
(c)
4 5
Figure 3.2.6.3 Profiles of local two-phase flow parameters for Run 6 acquired along the vertical radius of the tube atmeasurement port 4 (P4). (a) void fraction, (b) interfacial area concentration and (c) bubble velocity.
57
3.2.7 Summary of results for Run 7.

Table 3.2.7.1 Local two-phase flow parameters for Run 7 acquired along the vertical axis at measurement port 1 (P1)Run 7: jg,atm= 1.186 [m/s] &jf= 0.553 [m/s]
Measurement Location: L/D = 197 (Port 1)
Test Conditions: Sampling frequency: Measurement Time:Qg [acfm] = 1.616 Pback [psig] = 31 Jg, [m/s] = 1.117 fj [ I/s] = 10,000 AT 1 [s] = 10Qf [gpm] = 17.60 P1 .o [psig] = 1.0 jf [m/s] = 0.552 f2 [ ls] = 10,000 AT2 [S] = 10
r/R fbI [1/s] fb2 [1/s] a _ _ a2 aT a., [1/m] a [1/m] aiT [1/m] ug, [m/s] ug2 [m/s] D., [mm] D.2 [mm]
0.9054 12.8 0.7 0.033 0.794 0.827 16.20 1.50 17.70 1.849 2.978 12.2 3174.40.8175 6.2 0.6 0.013 0.798 0.811 6.84 0.98 7.82 2.084 2.753 11.1 4884.50.7296 4.1 0.6 0.008 0.812 0.819 4.46 0.90 5.36 2.256 2.822 10.5 5410.00.6417 2.6 0.7 0.005 0.824 0.830 3.03 0.95 3.98 2.291 2.927 10.1 5206.70.5539 2.1 0.8 0.004 0.810 0.814 2.53 0.97 3.50 2.210 2.508 8.8 5012.20.4660 2.5 0.6 0.006 0.808 0.814 3.01 0.84 3.85 2.291 2.321 11.2 5770.70.3781 2.2 0.6 0.004 0.811 0.815 2.47 0.72 3.19 2.359 3.010 10.4 6754.20.2903 2.3 0.7 0.005 0.786 0.791 2.85 0.71 3.56 2.260 1.900 11.4 6639.70.2024 2.7 0.7 0.007 0.791 0.797 3.51 0.17 3.68 2.099 0.435 11.5 27907.10.1145 2.6 0.7 0.008 0.781 0.789 3.32 0.00 3.32 2.090 0.000 14.10.0266 3.1 0.8 0.009 0.768 0.777 3.84 0.00 3.84 2.131 0.000 13.9-0.0612 3.1 0.8 0.008 0.693 0.701 3.86 0.00 3.86 1.989 0.000 12.4-0.1491 2.9 0.8 0.009 0.641 0.650 3.65 0,00 3.65 2.029 0.000 14.5-0.2370 3.1 0.8 0.011 0.506 0.516 5.13 0.00 5.13 1.715 0.000 12.5-0.3249 3.3 0.8 0.015 0.296 0.311 5.59 0.00 5.59 1.728 0.000 15.9-0.4127 1.4 0.1 0.005 0.064 0.070 2.03 0.00 2.03 1.165 0.000 16.0-0.5006 0.0 0.0 0.000 0.000 0.000 0.00 0,00 0.00 0.000 0.000-0.5885 0.0 0.0 0.000 0.000 0.000 0.00 0.00 0.00 0.000 0.000-0.6763 0.0 0.0 0.000 0.000 0.000 0.00 0.00 0.00 0.000 0.000-0.7642 0.0 0.0 0.000 0.000 0.000 0.00 0.00 0.00 0.000 0.000,
Calculated Results:<a,> = 0.007 .<ail> [I/m] =3.25 <<ugi>> [m/si = 1.859
<a2> = 0.554 <ai2> [1/m] =0.31 <<ug2>> [m/s] = 1.297
<aT> = 0.561 <aiT> [1/mi =3.56 <<ug>> [mi/s = 1.390
00

59
1.0
0.5
0.0
-0.5
-1.0
1.0A 0 0
A 00A 00
A 00
A 00A 00
> 30.0I
0
-0.5 0 al
A ai2
0 aiT-1.0
0.0 0.2 0.4 0.6Void fraction, a
(a)
1.0
0.5
0.0
-0.5
-1.0
0.8 1.0 0 5 10 15Interfacial area concentration, ai [1/m]
(b)
20
o Ao A
o Ao A
O A
AOA 0
0
00
00
0 OA
0 1 2 3Bubble velocity, ug [m/s]
(c)
4 5
Figure 3.2.7.1 Profiles of local two-phase flow parameters for Run 7 acquired along the vertical radius of the tube atmeasurement port 1 (P1). (a) void fraction, (b) interfacial area concentration and (c) bubble velocity.

Table 3.2.7.2 Local two-phase flow parameters for Run 7 acquired along the vertical axis at measurement port 3 (P3)Run 7: jg,atm= 1.186 [m/s] &jf= 0.553 [m/s]Measurement Location: L/D = 250 (Port 3)
Test Conditions: Sampling frequency: Measurement Time:Qg [acfin] = 1.504 PbCk [psig] = 33.8 Jg,lo• [m/s] = 1.104 f'l [I/s] = 10,000 AT 1 [s] = 10
Qf [gpm] = 17.40 PI., [psig] = 1.0 jf [m/s] = 0.552 f,2 [ i/s] 10,000 AT 2 [s] = 10
r/R fbi [I/s] fb 2 [i/s] al a2 aT a,, [1/m] ak [1/m] aiT [1/m] Ug1 [m/s] ug2 [m/s] D.m [mm] D2 [mm]
0.9054 14.5 0.6 0.044 0.799 0.843 20.90 0.99 21.89 1.633 2.980 12.5 4843.60.8175 11.1 0.6 0.030 0.815 0.845 13.72 0.73 14.45 1.933 1.914 12.9 6701.10.7296 5.0 0.6 0.009 0.814 0.823 6.17 0.79 6.96 1962 2.742 9.0 6178.50.6417 2.7 0.6 0.006 0.806 0.812 3.35 0.75 4.10 2.138 2.596 10.0 6449.60.5539 2.7 0.6 0.005 0.795 0.800 3.02 0.69 3.71 2.268 2.887 8.9 6914.80.4660 1.6 0.6 0.003 0.820 0.823 2.21 0.82 3.03 2.085 2.759 9.0 5999.30.3781 1.9 0.5 0.004 0.793 0.797 2.35 0.60 2.95 2.245 2.347 10.5 7926.00.2903 1.9 0.5 0.004 0.795 0.799 2.29 0.64 2.93 2.234 2.697 10.2 7456.90.2024 2.0 0.6 0.006 0.794 0.800 2.68 0.17 2.85 2.114 0.977 13.4 28005.90.1145 2.0 0.6 0.006 0.764 0.770 2.61 0.09 2.70 2.161 0.483 13.6 50906.70.0266 2.5 0.6 0.006 0.749 0.755 3.01 0.00 3.01 2.267 0.000 12.0-0.0612 2.5 0.4 0.007 0.746 0.752 3.50 0.00 3.50 2.008 0.000 11.1
-0.1491 3.2 0.6 0.010 0.695 0.706 4.94 0.00 4.94 1.872 0.000 12.5
-0.2370 3.9 0.7 0.012 0.622 0.635 5.76 0.00 5.76 1.877 0.000 12.8
-0.3249 2.6 0.6 0.010 0.476 0.485 3.85 0.00 3.85 1.731 0.000 14.8
-0.4127 1.3 0.3 0.004 0.309 0.313 2.51 0.00 2.51 1.808 0.000 10.3
-0.5006 0.3 0.1 0.001 0.030 0.030 0.00 0.00 0.00 1.930 0.000
-0.5885 0.0 0.0 0.000 0.000 0.000 0.00 0.00 0.00 0.000 0.000
-0.6763 0.0 0.0 0.000 0.000 0.000 0.00 0.00 0.00 0.000 0.000
-0.7642 0.0 0.0 0.000 0.000 0.000 0.00 0.00 0.00 0.000 0.000
Calculated Results:
<a,> = 0.007 <ail> [1/m] =3.46 <<Ugl>> [m/s] = 1.862
<a 2> = 0.590 <ai2> [1l/m] = 0.26 <<u82>> [m/s] = 1.294
<aT> = 0.597 <aiT> [1/m] =3.71 <<u»>> [m/s] = 1.378
O)C)

61
1.0
0.5
P0.0
-0.5
-1.0
1.0
0.5
0.0
-6 00-6 00
A& 00-A 00A 00A 00
o lnaa
C3
L
aa0 ~oail]
A ai2
0 aiT
-0.5
-1.00.0 0.2 0.4 0.6
Void fraction, a(a)
1.0
0.5
•0.0
-0.5
-1.0
0.8 1.0 0 5 10 15 20 25Interfacial area concentration, ai [1/m]
(b)
30
o A0 A
0 A0 A
0 AA 0
A 0
+10000
00
0
0og
IA ug2
0 1 2 3Bubble velocity, ug [m/s]
(c)
4 5
Figure 3.2.7.2 Profiles of local two-phase flow parameters for Run 7 acquired along the vertical radius of the tube at
measurement port 3 (P3). (a) void fraction, (b) interfacial area concentration and (c) bubble velocity.

Table 3.2.7.3 Local two-phase flow parameters for Run 7 acquired along the vertical axis at measurement port 4 (P4)Run 7: jg,atm= 1.186 [m/s] &jf= 0.553 [m/s[Measurement Location: L/D = 329 (Port 4)
Test Conditions: Sampling frequency: Measurement Time:Qg [acfhi] = 1.520 Pback [psig] = 33.3 j,. [m/s] = 1.104 fl [ 1/s[ = 10,000 AT1 [s] = 10Qf [gpm] = 17.30 Pl.0 [psig] = 1.0 jf [m/s] = 0.549 f 2 [ l/s] = 10,000 AT 2 [s] = 10
r/R fbI [l/s] fb2 [l/s] aE a2 a1 r ail [1/mI a2 [1/m] aiT [1/m[ ugl [Mis] ug [m/s] D., [mm] D.2 [mm]0.9054 13.8 0.5 0.033 0.805 0.838 19.74 0.88 20.62 1.603 2.109 10.0 5491.40.8175 6.6 0.6 0.013 0.819 0.832 7.70 1.22 8.92 1.951 3.283 10.1 4029.80.7296 2.8 0.6 0.005 0.802 0.807 3.12 0.99 4.11 2.013 2.863 9.2 4861.20.6417 1.6 0.5 0.003 0.793 0.796 2.04 0.75 2.79 2.183 3.263 8.8 6341.60.5539 1.3 0.6 0.002 0.808 0.811 1.64 0.89 2.53 2.352 2.289 8.4 5448.50.4660 1.5 0.6 0.003 0.816 0.819 1.97 0.93 2.90 2.182 2.443 8.8 5265.80.3781 1.2 0.5 0.002 0.785 0.788 1.58 0.58 2.16 2.317 2.505 8.7 8123.80.2903 1.7 0.5 0.003 0.787 0.791 2.05 0.35 2.40 2.307 1.614 9.4 13496.60.2024 2.0 0.6 0.006 0.790 0.796 2.43 0.14 2.57 2.203 0.367 14.3 33861.40.1145 2.7 0.6 0.007 0.764 0.771 3.52 0.00 3.52 2.026 0.000 12.10.0266 2.3 0.6 0.005 0.746 0.750 2.89 0.00 2.89 2.085 0.000 9.6-0.0612 2.0 0.6 0.004 0.726 0.731 2.57 0.00 2.57 2.133 0.000 10.3-0.1491 2.7 0.6 0.009 0.679 0.687 3.90 0.00 3.90 1.942 0.000 13.7-0.2370 3.0 0.7 0.011 0.548 0.559 4.35 0.00 4.35 2.131 0.000 15.6-0.3249 3.5 0.5 0.013 0.400 0.413 6.10 0.00 6.10 1.620 0.000 13.1-0.4127 2.3 0.4 0.010 0.138 0.148 5.10 0.00 5.10 1.397 0.000 11.3-0.5006 0.0 0.0 0.000 0.000 0.000 0.00 0.00 0.00 0.000 0.000-0.5885 0.0 0.0 0.000 0.000 0.000 0.00 0.00 0.00 0.000 0.000-0.6763 0.0 0.0 0.000 0.000 0.000 0.00 0.00 0.00 0.000 0.000
-0.7642 0.0 0.0 0.000 0.000 0.000 0.00 0.00 0.00 0.000 0.000
Calculated Results:<a,> = 0.006 <.ail> [1/m] =2.97 <<Ugl>> [m/si = 1.849.<a 2> = 0.568 <aa> [1/mi = 0.27 <<u2>> [m/s] = 1.211
<aT> = 0.573 <aiT> [1/mi =3.24 <<ug>> [m/si = 1.293
0)Il

63
1.0
0.5
•0.0
-0.5
-1.0
-0 Af
51
51
51
51451
•51
A a2
1O cT
1.0-A 00-A 00
_A 00A-00
0.5 --Aoo--ao
a
;4 0.00
n0
-0.5 0 ail
A ai2
0 aiT
-1.00.0 0.2 0.4 0.
Void fraction(a)
1.0
0.5
0.0
-0.5
-1.0
6 0.8 1.0 0 5 10 15 20 25Interfacial area concentration, ai [1/m]
(b)
30
o ao A0~ ao A
OAOA
A 0a 0
0
00.0
000Ougi oug
0 1 2 3Bubble velocity, ug [mi/s]
(c)
4 5
Figure 3.2.7.3 Profiles of local two-phase flow parameters for Run 7 acquired along the vertical radius of the tube atmeasurement port 4 (P4). (a) void fraction, (b) interfacial area concentration and (c) bubble velocity.

64
3.2.8 Summary of results for Run 8.
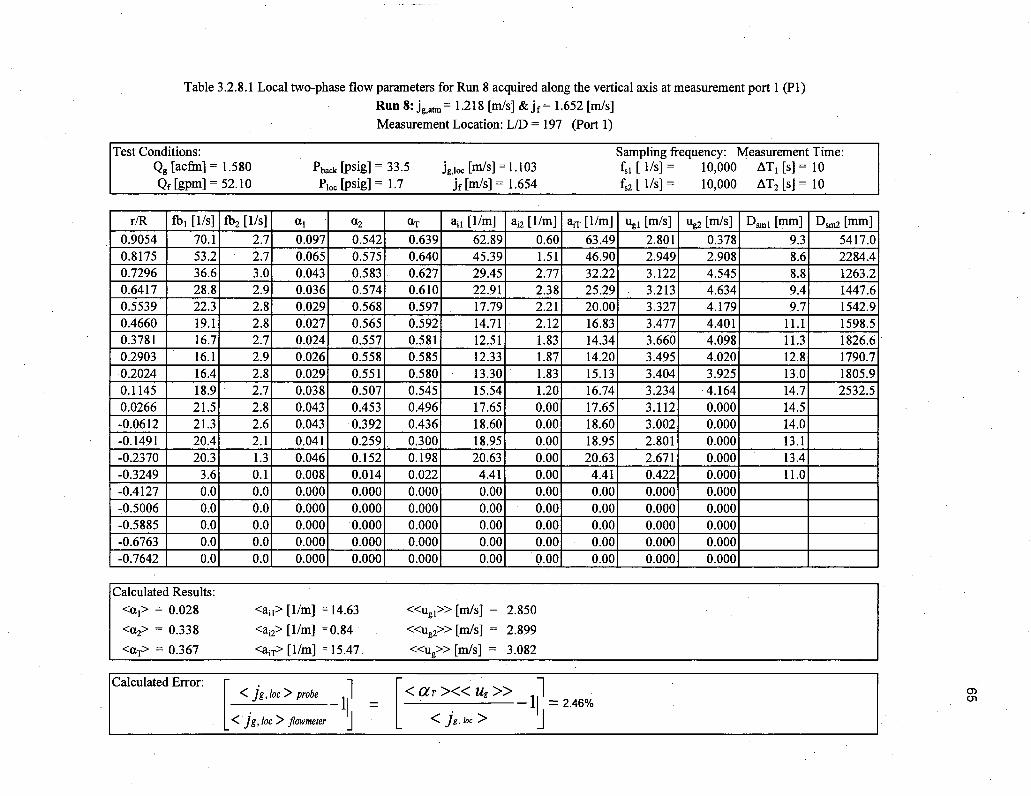
Table 3.2.8.1 Local two-phase flow parameters for Run 8 acquired along the vertical axis at measurement port 1 (P1)Run 8:jg,at= 1.218 [m/s] &jf= 1.652 [m/s]
Measurement Location: L/D = 197 (Port 1)
Test Conditions: Sampling frequency: Measurement Time:Qg [acfm] = 1.580 Pback [psig] = 33.5 Jg,Ioc [m/s] = 1.103 fsl [ IS] = 10,000 AT1 [s] = 10
Qf [gpm] = 52.10 Ploc [psig] = 1.7 jf [m/s] = 1.654 f,2 [ I/s] = 10,000 AT 2 [s] = 10
r/R fbI [1/si fb2 [I/s] at a2 aT a,, [1/m] a, [1/m] a1T [1/m] ugi [m/s] ug2 [m/s] D., [mm] D.2 [mm]0.9054 70.1 2.7 0.097 0.542 0.639 62.89 0.60 63.49 2.801 0.378 9.3 5417.00.8175 53.2 2.7 0.065 0.575 0.640 45.39 1.51 46.90 2.949 2.908 8.6 2284.40.7296 36.6 3.0 0.043 0.583 0.627 29.45 2.77 32.22 3.122 4.545 8.8 1263.20.6417 28.8 2.9 0.036 0.574 0.610 22.91 2.38 25.29 3.213 4.634 9.4 1447.60.5539 22.3 2.8 0.029 0.568 0.597 17.79 2.21 20.00 3.327 4.179 9.7 1542.90.4660 19.1 2.8 0.027 0.565 0.592 14.71 2.12 16.83 3.477 4.401 11.1 1598.50.3781 16.7 2.7 0.024 0.557 0.581 12.51 1.83 14.34 3.660 4.098 11.3 1826.60.2903 16.1 2.9 0.026 0.558 0.585 12.33 1.87 14.20 3.495 4.020 12.8 1790.70.2024 16.4 2.8 0.029 0.551 0.580 13.30 1.83 15.13 3.404 3.925 13.0 1805.90.1145 18.9 2.7 0.038 0.507 0.545 15.54 1.20 16.74 3.234 4.164 14.7 2532.50.0266 21.5 2.8 0.043 0.453 0.496 17.65 0.00 17.65 3.112 0.000 14.5-0.0612 21.3 2.6 0.043 0.392 0.436 18.60 0.00 18.60 3.002 0.000 14.0-0.1491 20.4 2.1 0.041 0.259 0.300 18.95 0.00 18.95 2.801 0.000 13.1-0.2370 20.3 1.3 0.046 0.152 0.198 20.63 0.00 20.63 2.671 0.000 13.4,-0.3249 3.6 0.1 0.008 0.014 0.022 4.41 0.00 4.41 0.422 0.000 11.0-0.4127 0.0 0.0 0.000 0.000 0.000 0.00 0.00 0.00 0.000 0.000-0.5006 0.0 0.0 0.000 0.000 0.000 0.00 0.00 0.00 0.000 0.000-0.5885 0.0 0.0 0.000 0.000 0.000 0.00 0.00 0.00 0.000 0.000-0.6763 0.0 0.0 0.000 0.000 0.000 0.00 0.00 0.00 0.000 0.000,-0.7642 0.0 0.0 0.000 0.000 0.000 0.00 0.00 0.00 0.000 0.0001
Calculated Results:<a,> = 0.028 <ail> [1/m] = 14.63 <<ugl>> [m/s] = 2.850
<a 2> = 0.338 <ai2> [1/m] =0.84 <<u,2>> [m/s] = 2.899
<aTf> = 0.367 <aiT> [1/m] = 15.47. <<Ug>> [m/s] = 3.082
O)O"n

66
1.0
0.5
0.0
-0.5
-1.0
0 a 0o ADo AD 1
o ADo ADno A•D
o a00 AD0
o AD
o AD Oo A'o AD
0 o 0
A a2
oDaT
1.0
0.5
:40.0
A 00A 00a 00
" CE3
A 01
co
CO
a
0 ail
A ai2
o aiT
-0.5
-1.00.0 0.2 0.4 0.6
Void fraction, a(a)
1.0
0.5
Pý0.0
-0.5
-1.0
0.8 1.0 0 20 40 60 80Interfacial area concentration, ai [1/m]
(b)
100
0o A
o Ao A
o A0 A
o Ao A
o A
00
0
0 A
0 u4i
0Aug
0 1 2 3B'ubble velocity, u, [m/s]
(c)
4 5
Figure 3.2.8.1 Profiles of local two-phase flow parameters for Run 8 acquired along the vertical radius of the tube atmeasurement port I (P1). (a) void fraction, (b) interfacial area concentration and (c) bubble velocity.

Table 3.2.8.2 Local two-phase flow parameters for Run 8 acquired along the vertical axis at measurement port 3 (P3)Run 8: jg,ann= 1.218 [m/s] &jf= 1.652 [m/s]
Measurement Location: L/D = 250 (Port 3)
Test Conditions: Sampling frequency: Measurement Time:Qg [acfm] = 1.455 Pback [psig] = 36.3 jg,lo, [m/s] = 1.095 fSl [ l/s] = 10,000 AT 1 [s] = 10Qf [gpm] = 51.90 PIoc [psig] = 1.4 jf [m/s] 1.648 f,2 [ l/s] = 10,000 AT 2 [s] = 10
r/R fb 1 [1/s] fb2 [I/s] al a2 aT a,, [1/m] ai [1/m] aiT [1/ml] Ug [m/s] u2 [m/s] D., [mm] D.2 [mrm]0.9054 81.3 2.5 0.123 0.575 0.698 73.52 1.03 74.55 2.840 1.652 10.0 3348.30.8175 62.6 2.5 0.088 0.583 0.671 55.19 2.48 57.67 2.881 4.588 9.6 1409.80.7296 41.4 2.7 0.053 0.589 0.642 34.86 2.22 37.08 3.017 4.428 9.1 1591.40.6417 27.2 2.5 0.033 0.583 0.616 22.20 2.10 24.30 3.146 4.300 8.9 1664.60.5539 18.7 2.6 0.024 0.578 0.602 15.71 2.00 17.71 3.225 3.992 9.2 1733.70.4660 16.0 2.5 0.022 0.577 0.599 12.38 1.89 14.27 3.378 4.220 10.5 1831.70.3781 13.6 2.7 0.020 0.575 0.595 10.92 2.05 12.97 3.339 3.935 11.0 1683.50.2903 13.6 2.7 0.022 0.562 0.584 11.08 1.85 12.93 3.306 4.005 11.9 1822.10.2024 14.1 2.6 0.025 0.518 0.543 12.48 1.26 13.74 3.204 4.014 12.2 2464.30.1145 20.1 2.7 0.037 0.474 0.511 16.99 0.42 17.41 3.110 2.184 12.9 6770.00.0266 19.7 2.4 0.040 0.400 0.440 17.35 0.00 17.35 2.971 0.000 13.8-0.0612 22.1 2.1 0.044 0.293 0.337 20.56 0.00 20.56 2.785 0.000 12.9-0.1491 23.3 1.0 0.050 0.117. 0.167 25.71 0.00 25.71 2.451 0.000 11.7-0.2370 28.0 0.1 0.066 0.009 0.075 32.90 0.00 32.90 2.127 0.000 12.1-0.3249 3.0 0.0 0.007 0.000 0.007 3.50 0.00 3.50 0.389 0.000 11.3-0.4127 0.0 0.0 0.000 0.000 0.000 0.00 0.00 0.00 0.000 0.000-0.5006 0.0 0.0 0.000 0.000 0.000 0.00 0.00 0.00 0.000 0.000-0.5885 0.0 0.0 0.000 0.000 0.000 0.00 0.00 0.00 0.000 0.000-0.6763 0.0 0.0 0.000 0.000 0.000 0.00 0.00 0.00 0.000 0.000-0.7642 0.0 0.0 0.000 0.000 0.000 0.00 0.00 0.00 0.000 0.000
Calculated Results:<a,> = 0.030 <ail> [1/m] = 16.19 <<ugl>> [m/s] = 2.651
<a 2> = 0.308 <an2> [1/m] = 0.76 <<ug2>> [m/s] = 3.081
<aT> = 0.338 <aiT> [1/m] = 16.95. <<ug>> [m/s] - 3.231
0)-'I

68
1.00 a~ 0
0 1~0o
oo t
0.5 0 AOo0 tol
o-0 A
o0 A
-0.5 n al
0 a a2aDaT
-1.0
1.0
0.5
0.0
-0.5
-1.0
coE 00013
00
a COa c
-ýS co-a aaaC
o ail
a ai2
a aiT
0.0 0.2 0.4 0.6Void fraction, a
(a)
1.0
0.5
0.0
-0.5
-1.0
0.8 1.0 0 20 40 60 80Interfacial area concentration, ai [1/rn]
(b)
100
A 0o Ao Ao A00 A0 A0 A
0o Ao A
A 0
00
00
0 1 2 3Bubble velocity, ug [m/s]
(c)
4 5
Figure 3.2.8.2 Profiles of local two-phase flow parameters for Run 8 acquired along the vertical radius of the tube atmeasurement port 3 (P3). (a) void fraction, (b) interfacial area concentration and (c) bubble velocity.

Table 3.2,8.3 Local two-phase flow parameters for Run 8 acquired along the vertical axis at measurement port 4 (N4)
Run 8: jg,am= 1.218 [m/s] &jf= 1.652 [m/s]
Measurement Location: L/D = 329 (Port 4)
Test Conditions: Sampling frequency: Measurement Time:Qg [acfin] = 1.470 Pbak [psig] = 36.3 Jg,loc [m/s] = 1.099 fl [ I/s] = 10,000 AT, [s] = 10Qf [gpm] = 52.00 P1o. [psig] = 1.5 jf [m/s] 1.651 fa [ I/s] = 10,000 AT 2 [si = 10
r/R fb1 [1/s] fb2 [1/s] C1 a2 aT ail [1/m] a2 [1/m] a1T [1/rn] UgI [m/si Ug2 [m/s] D., [mm] D. [mm]
0.9054 77.3 2.3 0.103 0.577 0.680 72.77 1.91 74.68 2.652 3.388 8.5 1813.20.8175 56.2 2.3 0.067 0.582 0.649 48.43 2.25 50.68 2.968 3.705 8.3 1552.30.7296 38.2 2.6 0.044 0.585 0.630 31.17 2.43 33.60 3.147 4.926 8.5 1445.20.6417 28.7 2.4 0.035 0.582 0.617 23.25 2.00 25.25 3.240 4.099 9.0 1746.00.5539 22.7 2.4 0.028 0.583 0.611 17.57 1.88 19.45 3.365 4.199 9.4 1861.30.4660 16.8 2.4 0.024 0.571 0.594 12.77 1.83 14.60 3.568 4.164 11.2 1870.80.3781 13.7 2.5 0.019 0.573 0.593 10.36 1.81 12.17 3.644 4.473 11.1 1900.40.2903 12.7 2.5 0.020 0.552 0.571 10.00 1.58 11.58 3.575 4.096 11.8 2095.40.2024 14.8 2.4 0.026 0.517 0.543 12.04 1.02 13.06 3.459 3.689 13.0 3040.60.1145 17.6 2.4 0.035 0.469 0.504 14.80 0.18 14.98 3.292 1.344 14.4 15633.30.0266 18.1 2.4 0.036 0.409 0.445 15.44 0.00 15.44 3.179 0.000 13.9-0.0612 20.2 2.1 0.038 0.346 0.384 17.46 0.00 17.46 3.008 0.000 13.2-0.1491 18.3 1.4 0.039 0.200 0.239 16.86 0.00 16.86 2.828 0.000 13.9-0.2370 20.4 0.4 0.049 0.037 0.086 20.51 0.00 20.51 2.749 0.000 14.4-0.3249 14.8 0.0 0.034 0.000 0.034 15.39 0.00 15.39 1.899 0.000 13.2-0.4127 0.0 0.0 0.000 0.000 0.000 0.00 0.00 0.00 0.000 0.00070.5006 0.0 0.0 0.000 0.000 0.000 0.00 0.00 0.00 0.000 0.000 1-0.5885 0.0 0.0 0.000 0.000 0.000 0.00 0.00 0.00 0.000 0.000-0.6763 0.0 0.0 0.000 0.000 0.000 0.00 0.00 0.00 0.000 0.000-0.7642 0.0 0.0 0.000 0.000 0.000 0.00 0.00 0.00 0.000 0.000
Calculated Results:<a,> = 0.028 <ail> [1/m] = 14.74 <<ug»>> [m/s] = 2.848
<a2> = 0.319 <ai2> [1/m] = 0.71 <<ug2>> [m/s] = 2.954
<aT> = 0.347 <air> [1/m] = 15.45 <<ug>> [m/s] = 3.125
0)(0

70
1.0
o0 A 130 t60o •o
0.5 - LOo e
o to a
•0.0 o 0o AD
-0.5 0 at
0 aT-1.0
1.0
0.5
p40.0
A CA 00
A 00
00a aO
a
o ail
a~ ai2
0 aiT
-0.5
-1.00.0 0.2 0.4 0.6
Void fraction, ax(a)
1.0
0.5
;0.0
-0.5
-1.0
0.8 1.0 0 20 40 60 80Interfacial area concentration, ai [1/m]
(b)
100
o A0 A
00 A0 A
0 A00 A0 A
A 00
00
0
0 1 2 3Bubble velocity, Ug [m/s]
(c)
4 5
Figure 3.2.8.3 Profiles of local two-phase flow parameters for Run 8 acquired along the vertical radius of the tube atmeasurement port 4 (P4). (a) void fraction, (b) interfacial area concentration and (c) bubble velocity.
71
3.2.9 Summary of results for Run 9.

Table 3.2.9.1 Local two-phase flow parameters for Run 9 acquired along the vertical axis at measurement port 1 (P1)Run 9: jg,a = 1.186 [m/s] &jf= 2.202 [m/s]Measurement Location: L/D = 197 (Port 1)
Test Conditions: Sampling frequency: Measurement Time:Qg [acfin] = 1.663 Pback [psig] = 33.0 jg,loc [m/s] = 1.102 fsl [ l/s] 10,000 AT1 [s] = 10Qf [gpm] = 69.50 PIo, [psig] = 2.4 jf [mis] 2.207 f,2 [ 1/s] = 10,000 AT 2 [s] 10
r/R fb1 [1/s] fb2 [l/s] a1 a 2 aT al [1/rm] a [I/rn] aiT [1/mr] Ug [m/s] ug2 [m/s] D.m [mm] D.2 [mm]0.9054 121.2 3.9 0.164 0.474 0.638 100.22 3.89 104.11 3.148 4.813 9.8 730.80.8175 98.6 4.0 0.119 0.488 0.607 .76.97 3.42 80.39 3.338 5.415 9.3 855.60.7296 78.0 4.3 0.086 0.502 0.588 55.71 3.61 59.32 3.723 5.707 9.3 833.70.6417 64.3 4.2 0.072 0.499 0.571 45.24 3.00 48.24 3.783 5.239 9.5 997.80.5539 54.4 4.3 0.062 0.496 0.559 37.76 2.86 40.62 3.867 4.943 9.9 1041.40.4660 40.3 4.3 0.049 0.478 0.527 26.92 2.58 29.50 4.065 4.907 10.9 1111.60.3781 38.6 4.2 0.050 0.469 0.519 25.91 2.40 28.31 4.044 5.091 11.5 1172.30.2903 34.2 4.4 0.048 0.456 .0.504 22.70 2.71 25.41 4.124 4.745 12.7 1008.70.2024 34.4 4.1 0.050 0.410 0.460 24.11 2.14 26.25 4.017 4.715 12.5 1149.50.1145 38.0 3.4 0.063 0.317 0.380 27.53 1.56 29.09 3.852 4.251 13.7 1220.80.0266 45.1 2.3 0.078 0.185 0.263 33.08 0.33 33.41 3.767 2.160 14.1 3363.6-0.0612 47.2 1.4 0.079 0.107 0.185 35.44 0.00 35.44 3.577 0.000 13.3-0.1491 39.8 0.2 0.064 0.015 0.079 30.58 0.00 30.58 3.435 0.000 12.6-0.2370 28.6 0.0 0.048 0.001 0.049 22.78 0.00 22.78 3.170 0.000 12.6-0.3249 0.0 0.0 0.000 0.000 0.000 0.00 0.00 0.00 0.000 0.000-0.4127 0.0 0.0 0.000 0.000 0.000 0.00 0.00 0.00 0.000 0.000-0.5006 0.0 0.0 0.000 0.000 0.000 0.00 0.00 0.00 0.000 0.000-0.5885 0.0 0.0 0.000 0.000 0.000 0.00 0.00 0.00 0.000 0.000-0.6763 0.0 0.0 0.000 0.000 0.000 0.00 0.00 0.00 0.000 0.000-0.7642 0.0 0.0 0.000 0.000 0.000 0.00 0.00 0.00 0.000 0.000
Calculated Results:<a,> = 0.049 <ail> [1/m] =25.63 <<ug 1>> [m/s] = 3.407
<a2> = 0.223 <ai2> [1/m] = 1.20 <<ug2>> [m/s] = 4.486
• <ST> = 0.272 <aiT> [1/m] =26.83 <<Ug>> [m/s] = 4.485
"-4

73
1.0 1.00 a 0 A 00
0 A 0 A6 0oo0 A 0 00
0 A 0 000.5 0 a 0 00o
0 a0 0.5 -0 aD 0 -
-0 AD A6 000 0 a co0 0 AD0 1oOA 0D 0
kao ogQ 0
-0.5 0 a] -0.5 0 ail
a 2 e a ai2
D aT e0 aiT
-1.0 -1.0
0.0 0.2 0.4 0.6 0.8 1.0 0 30 60 90 120Void fraction, a Interfacial area concentration, ai [1/m]
(a) (b)
1.0o Ao A
o Ao A0 A0.5 0 Ao Ao A0 A
OAI 0 : I I0 .0 0 "oI
00
-0.5.
-1.00 2 4 6 8 10
Bubble velocity, Ug [m/s]
(c)
Figure 3.2.9.1 Profiles of local two-phase flow parameters for Run 9 acquired along the vertical radius of the tube atmeasurement port 1 (PI). (a) void fraction, (b) interfacial area concentration and (c) bubble velocity.

Table 3.2.9.2 Local two-phase flow parameters for Run 9 acquired along the vertical axis at measurement port 3 (P3)Run 9: jg,aim= 1.186 [m/s] &jf= 2.202 [m/s]Measurement Location: L/D = 250 (Port 3)
Test Conditions: Sampling frequency: Measurement Time:Qg [acfin] = 1.566 Pback [psig] = 35.0 jg,loc.[m/s] = 1.100 f5l [1 /sI = 10,000 AT 1 [s] = 10Qf [gpm] = 69.20 P10 c [psig] = 2.1 jf [m/s] = 2.197 f,2 [ l/s] = 10,000 AT2 [s] 10
r/R fb1 [1/s] fb2 [1/s] I1 a,2 aT ail [1/rn] a2 [I/m] aff [1/m] Ug1 [I'S] Ug2 [mis] D. 1 [mm] D2 [mm]
0.9054 105.5 3.5 0.142 0.428 0.571 82.56 0.00 82.56 3.344 0.000 10.30.8175 91.8 3.9 0.118 0.487 0.605 68.93 1.16 70.09 3.522 1.984 10.3 2520.00.7296 72.9 3.8 0.086 0.505 0.591 52.39 2.85 55.24 3.676 5.909 9.9 1062.30.6417 53.6 3.8 0.060 0.497 0;557 37.70 2.65 40.35 3.780 5.287 9.6 1125.10.5539 39.3 4.0 0.046 0.510 0.556 27.46 2.59 30.05 3.807 5.498 10.0 1181.90.4660 31.5 3.8 0.037 0.501 0.537 21.78 2.42 24.20 3.958 5.403 10.1 1241.70.3781 25.8 4.0 0.033 0.504 0.537 18.03 2.69 20.72 3.966 5.385 10.9 1124.80.2903 24.3 4.0 0.033 0.492 0.525 17.60 2.25 19.85 3.891 5.187 11.1 1312.50.2024 27.7 3.9 0.042 0.462 0.505 20.49 2.30 22.79 3.825 5.190 12.4 1205.70.1145 34.4 3.6 0.054 0.396 0.450 26.20 1.77 27.97 3.671 5.296 12.3 1342.70.0266 42.6 3.0 0.073 0.292 0.365 33.39 0.75 34.14 3.521 3.834 13.1 2335.2-0.0612 46.4 2.1 0.081 0.174 0.255 38.67 0.00 38.67 3.116 0.000 12.6-0.1491 40.3 0.8 0.072 0.070 0.141 35.31 0.00 35.31 2.985 0.000 12.1-0.2370 32.6 0.1 0.052 0.007 0.059 29.17 0.00 29.17 2.795 0.000 10.7-0.3249 0.0 0.0 0.000 0.000 0.000 0.00 0.00 0.00 0.000 0.000-0.4127 0.0 0.0 0.000 0.000 0.000 0.00 0.00 0.00 0.000 0.000-0.5006 0.0 0.0 0.000 0.000 0.000 0.00 0.00 0.00 0.000 0.000-0.5885 0.0 0.0 0.000 0.000 0.000 0.00 0.00 0.00 0.000 0.000-0.6763 0.0 0.0 0.000 0.000 0.000 0.00 0.00 0.00 0.000 0.000 1-0.7642 0.0 0.0 0.000 0.000 0.000 0.00 0.00 0.00 0.000 0.000
Calculated Results:<xl> = 0.045 <ail> [1//m] =23.90 <«<Ugl>> [m/s] = 3.187
<a2> = 0.251 <an> [1/m] = 1.02 <<u,2>> [m/s] = 4.169
<aT> = 0.296 <aiT> [1/m] =24.92 <<ug>> [m/s] = 4.255

75
1.0o A 0
o a 0o A 0
o ADEo AO3
0.5 0 AD
-o ADo Ano A[]
o0 A0o Da 0
-0.5
-1.0
0.0 0.2 0.4 0.6Void fraction, a
(a)
1.0
0.5
F0.0
-0.5
-1.0
o a]Aa 2
o aT
0.8 1.0
1.0
0.5
•0.0
ia
.A 00A 00A 00
-A 00A 00A 013
CD
00 ail
ai2
0 aiT
-0.5
-1.0
0 20 40 60 80Interfacial area concentration, ai [1/m]
(b)
100
0A 0O A
O AO AO AO AO AO A
O AI A , I I
00
00Og
AOg
0 2 4 6Bubble velocity, ug [m/s]
(c)
8 10
Figure 3.2.9.2 Profiles of local two-phase flow parameters for Run 9 acquired along the vertical radius of the tube atmeasurement port 3 (P3). (a) void fraction, (b) interfacial area concentration and (c) bubble velocity.

Table 3.2.9.3 Local two-phase flow parameters for Run 9 acquired along the vertical axis at measurement port 4 (P4)Run 9: Jg,an= 1.186 [m/s] &jf= 2.202 [m/s]
Measurement Location: L/D = 329 (Port 4)
Test Conditions: Sampling frequency: Measurement Time:Qg [acfin] = 1.556 Pbak [psig] = 36.0 jg,lo, [mis] = 1.102 frl [1 /s] = 10,000 AT 1 [s] = 10Qf [gpm] = 69.20 Pl.. [psig] = 2.3 jf [m/s] 2.197 f,2 [ l/s] = 10,000 AT2 [s] 10
r/R fbI [1/s] fb2 [/s] al a2 OT a,, [1/m] ai [1/m] a1T [1/m] u.l [m/si ug2 [m/s] D., [mm] D~2 [mm]0.9054 101.7 3.3 0.118 0.490 0.608 81.42 2.44 83.86 3.291 3.704 8.7 1203.70.8175 83.1 3.4 0.093 0.501 0.594 64.15 2.91 67.06 3.459 4.467 8.7 1033.80.7296 68.2 3.6 0.074 0.510 0.584 49.35 2.63 51.98 3.720 5A08 8.9 1164.00.6417 55.8 3.5 0.062 0.504 0.567 39.26 2.21 41.47 3.824 5.482 9.5 1368.90.5539 46.0 3.4 0.052 0.504 0.556 31.47 2.40 33.87 3.927 5.369 9.9 1260.80.4660 39.4 3.6 0.048 0.498 0.546 26.52 2.16 28.68 4.020 4.681 10.9 1382.80.3781 30.5 3.3 0.038 0.483 0.521 20.41 1.79 22.20 4.216 5.169 11.3 1617.30.2903 28.4 3.6 0.039 0.480 0.519 19.54 1.77 21.31 4.163 5.235 12.0 1625.40.2024 26.5 3.6 0.039 0.435 0.474 18.03 1.49 19.52 4.190 5.430 13.0 1750.50.1145 31.2 3.1 0.052 0.358 0.410 21.96 0.65 22.61 3.923 2.615 14.3 3303.70.0266 37.0 3.0 0.069 0.289 0.359 26.55 0.40 26.95 3.839 1.439 15.7 4336.5-0.0612 33.2 2.0 0.061 0.175 0.236 25.02 0.00 25.02 3.629 0.000 14.6-0.1491 32.8 0.8 0.061 0.059 0.120 25.32 0.00 25.32 3.475 0.000 14.5.-0.2370 28.5 0.1 0.053 0.006 0.059 23.90 0.00 23.90 3.112 0.000 13.4-0.3249 0.0 0.0 0.000 0.000 0.000 0.00 0.00 0.00 0.000 0.000_-0.4127 0.0 0.0 0.000 0.000 0.000 0.00 0.00 0.00 0.000 0.000-0.5006 0.0 0.0 0.000 0.000 0.000 0.00 0.00 0.00 0.000 0.000-0.5885 0.0 0.0 0.000 0.000 0.000 0.00 0.00 0.00 0.000 0.000-0.6763 0.0 0.0 0.000 0.000 0.000 0.00 0.00 0.00 0.000 0.000-0.7642 0.0 0.0 0.000 0.000 0.000 0.00 0.00 0.00 0.000 0.000
Calculated Results:<a,> = 0.041 <ail> [1/m] =21.16 <<Ugl>>. [m/si = 3.441
<a 2> = 0.247 <ai2> [1/m] =-0.88 <<ug2>> [m/s] = 4.118
<aT> = 0.288 <aiT> [1/mi =22.03 <<ug>> [m/s] = 4.258
"-40)
f

77
1.0
0.5
S0.0
-0.5 1
-1.0
o0 0-0 a 0
o
0 a 13o do •
-o td0-o 3-o x-0 6
o I • lI
o n00
I ~a2D aT
1.0
0.5
0.0
-0.5
-1.0
-A 00-A 00
0 00
coc 00CO
a C
0
0 ail
A ai2
o aiT
0.0 0.2 0.4 0.6Void fraction, a
(a)
1.0
0.5
•0.0 _
-0.5
-1.0
0.8 1.0 0 20 40 60 80Interfacial area concentration, ai [1/m]
(b)
100
0A0 A
0 A0 A0 A0 A0 AO Ao A
A 0
00
0, , • o
0og
oug
0 2 4 6Bubble velocity, ug [m/s]
(c)
8 10
Figure 3.2.9.3 Profiles of local two-phase flow parameters for Run 9 acquired along the vertical radius of the tube atmeasurement port 4 (P4). (a) void fraction, (b) interfacial area concentration and (c) bubble velocity.

78
3.2.10 Summary of results for Run 10.

Table 3.2.10.1 Local two-phase flow parameters for Run 10 acquired along the vertical axis at measurement port 1 (P1)Run 10: jg,at = 2.371 [m/s] &jf= 0.555 [m/s]Measurement Location: L/D = 197 (Port 1)
Test Conditions: Sampling frequency: Measurement Time:Qg [acfin] = 3.763 Pback [psig] = 24.3 Jgloc [m/s] =2.206 fsl [ Is = 10,000 AT 1 [s] = 10Qf [gpm] = 17.50 Ploc [psig] = 1.1 jf [m/s[ = 0.556 f,2 [ I/s] = 10,000 AT 2 [s] = 10
r/R fb1 [1/s] fb2 [1/s] al a2 ET a al [1/]a 2 [1/mr] ani [1/rM Ugl [m/s] Ug2 [m/s] D.m [mm] D.2 [mm]
0.9054 19.1 0.6 0.031 0.874 0.905 17.73 0.00 17.73 2.926 0.000 10.50.8175 19.0 0.6 0.024 0.892 0.916 15.78 0.32 16.10 3.103 2.004 9.1 16726.90.7296 16.6 0.5 0.021 0.900 0.921 13.48 0.44 13.92 3.291 3.047 9.5 12270.00.6417 10.6 0.5 0.014 0.885 0.899 7.29 0.43 7.72 3.785 4.603 11.4 12348.80.5539 8.6 0.6 0.010 0.897 0.907 5.68 0.10 5.78 3.950 0.741 10.8 53802.00.4660 9.4 0.5 0.011 0.888 0.899 6.78 0.18 6.96 3.771 1.452 10.0 29586.70.3781 6.9 0.6 0.009 0.885 0.894 4.84 0.29 5.13 3.902 2.472 11.0 18302.10.2903 8.4 0.7 0.012 0.882 0.894 5.93 0.10 6.03 3.833 0.915 12.0 52908.00.2024 7.7 0.6 0.011 0.897 0.908 5.64 0.19 5.83 3.818 2.429 12.0 28310.50.1145 9.3 0.6 0.017 0.862 0.879 7.02 0.23 7.25 3.821 3.917 14.3 22497.40.0266 7.8 0.5 0.013 0.865 0.878 5.87 0.00 5.87 3.593 0.000 13.3-0.0612 8.1 0.8 0.014 0.797 0.811 6.43 0.00 6.43 3.292 0.000 13.3-0.1491 9.8 0.6 0.021 0.809 0.830 8.94 0.00 8.94 3.007 0.000 14.2-0.2370 9.2 0.8 0.020 0.792 0.812 8.60 0.00 8.60 3.022 0.000 13.9-0.3249 .15.6 1.0 0.040 0.647 0.687 20.64 0.00 20.64 2.193 0.000 11.6-0.4127 21.8 0.9 0.065 0.543 0.608 30.93 0.00 30.93 1.799 0.000 12.7-0.5006 15.9 0.8 0.048 0.264 0.312 19.21 0.00 19.21 1.809 0.000 15.0-0.5885 0.0 0.0 0.000 0.000 0.000 0.00 0.00 0.00 0.000 0.000_-0.6763 0.0 0.0 0.000 0.000 0.000 0.00 0.00 0.00 0.000 0.000-0.7642 0.0 0.0 0.000 0.000 0.000 0.00 0.00 0.00 0.000 0.000
Calculated Results:<a,> = 0.018 <ail> [1/m] =8.95 <<ugl>> [m/s] = 2.705
<%2> = 0.686 <an> [I/m] = 0.10 <<ug2>> [m/s] = 1.304
<aT> = 0.705 <aiT> [1/m] =9.05 <<ug>> [m/s] = 1.419
-"4(0

80
1.0
0.5
•0.0
-0.5
-1.0
-o AO
0ot
_o cc3
_o I no cc
0o AOo AO
o AO oal
A a20 aT
1.0
0.5
0.0
-0.5
0
CD
a
aa
o
00
a o a i l .a ai2
a3 aiT
-1.00.0 0.2 0.4 0.6
Void fraction, a
(a)
1.0
0.5
0.0
-0.5
-1.0
0.8. 1.0 0 10 20 30Interfacial area concentration, ai [1/m]
(b)
40
0A 0
AO
0 a0
A 0A 0A. 0A. 0A oA
10000
00
00
0ug
0 1 2 3Bubble velocity, ug [m/s]
(c)
4 5
Figure 3.2.10.1 Profiles of local two-phase flow parameters for Run 10 acquired along the vertical radius of the tube atmeasurement port 1 (P1). (a) void fraction, (b) interfacial area concentration and (c) bubble velocity.

Table 3.2.10.2 Local two-phase flow parameters for Run 10 acquired along the vertical axis at measurement port 3 (P3)Run 10: jgat= 2.371 [m/s] &jf=0.555 [m/s]Measurement Location: L/D = 250 (Port 3)
Test Conditions: Sampling frequency: Measurement Time:
Qg [acfm] = 3.160 Pback [psig] = 31.3 jg,lo [m/s] =2.199 fl [ IS] = 10,000 AT 1 [s] = 10Qf [gpm] = 17.60 Plo. [psig] = 1.0 jf [m/s] = 0.559 f2 [ I/s] = 10,000 AT 2 [s] = 10
r/R fb1 [I/s] fb 2 [I/s] aI a2 _ _ r ail [1/r] aP 2 [1/m] aiT [I/m] Ug1 [m/s] ug2 [m/s] D.m [mm] D.2 [mm]
0.9054 29.1 0.5 0.055 0.877 0.932 26.09 0.00 26.09 2.978 0.000 12.70.8175 30.3 0.4 0.051 0.880 0.930 26.94 0.11 27.05 2.971 0.698 11.2 47972.70.7296 29.2 0.5 0.038 0.871 0.909 24.84 0.41 25.25 3.076 5.605 9.1 12742.00.6417 21.8 0.5 0.027 0.883 0.909 17.50 0.35 17.85 3.283 3.481 9.2 15128.60.5539 13.4 0.6 0.015 0.877 0.892 10.16 0.35 10.51 3.421 3.592 8.8 15039.40.4660 11.5 0.6 0.013 0.878 0.890 8.52 0.35 8.87 3.590 4.508 8.9 15044.60.3781 8.1 0.6 0.010 0.871 0.881 5.97 0.44 6.41 3.670 4.431 10.4 11877.30.2903 7.9 0.5 0.010 0.872 0.881 5.58 0.31 5.89 3.879 4.387 10.2 16871.60.2024 6.5 0.6 0.008 0.870 0.878 4.95 0.31 5.26 3.837 3.689 9.8 16829.00.1145 7.1 0.6 0.010 0.848 0.858 5.61 0.22 5.83 3.614 3.644 10.7 23135.50.0266 7.4 0.6 0.011 0.829 0.840 5.72 0.03 5.75 3.768 0.813 11.0 165840.0-0.0612 9.6 0.7 0.016 0.823 0.839 8.13 0.00 8.13 3.292 0.000 12.0-0.1491 10.0 0.8 0.016 0.801 0.818 8.32 0.00 8.32 3.234 0.000 11.8-0.2370 13.9 0.7 0.029 0.750 0.779 13.34 0.00 13.34 2.832 0.000 13.0-0.3249 13.5 0.8 0.032 0.681 0.713 15.23 0.00 15.23 2.431 0.000 12.7-0.4127 18.7 0.8 0.050 0.523 0.574 23.83 0.00 23.83 1.941 0.000 12.7-0.5006 16.1 1.0 0.052 0.179 0.231 23.82 0.00 23.82 1.727 0.000 13.0-0.5885 3.4 0.0 0.010 0.000 0.010 4.01 0.00 4.01 0.796 0.000 15.6-0.6763 0.0 0.0 0.000 0.000 0.000 0.00 0.00 0.00 0.000 0.0001-0.7642 0.0 0.0 0.000 0.000 0.000 0.00 0.00 0.00 0.000 0.0001
Calculated Results:<ai> = 0.020 <ail> [1/m] = 10.72 <<Ugl>> [m/s] = 2.716
<a2> = 0.676 <ai2> [1/m] =0.14 <<u 2E>> [m/s] = 2.119
<aT> = 0.696 <aiT> [1/m] = 10.86. <<us>> [m/s] = 2.259
0,

82
1.000
00
0.5
0.0o
00_0
o [
-0.5 o a D
-1.0
0.0 0.2 0.4 0.6Void fraction, a
(a)
1.0
0.5
F0.0
-0.5
-1.0
ADAnAnAD
604343
'a
43
43
AD
o (a]
O3 aT
0.8. 1.0
1.0
0.5.
;40.0
-0.5
-1.0
oa
aa13•
D
00
a i0A ai2
0 aiT
0 10 20 30 40Interfacial area concentration, ai [1/m]
(b)
50
0A 0
o A
o ACACA0A
0aAI, 1 i 000
00
000
0 2 4 6Bubble velocity, ug [m/s]
(c)
8 10
Figure 3.2.10.2 Profiles of local two-phase flow parameters for Run 10 acquired along the vertical radius of the tube atmeasurement port 3 (P3). (a) void fraction, (b) interfacial area concentration and (c) bubble velocity.

Table 3.2.10.3 Local two-phase flow parameters for Run 10 acquired along the vertical axis at measurement port 4 (P4)
Run 10: jg,atm= 2.371 [m/s] &jf= 0.555 [m/s]
Measurement Location: L/D = 329 (Port 4)
Test Conditions: Sampling frequency: Measurement Time:Qg [acfm] = 3.160 Pback [psig] = 32.2 JgI.o [m/s] =2.228 fsl [I s] = 10,000 AT, [s] = 10Qf [gpm]= 17.30 P1oc [psig] = 1.1 jf [m/s] = 0.549 f2 [ Is] = 10,000 AT 2 [s] = 10
r/R fb1 [i/s] fb2 [I/s] ( 1 a 2 aT ail [1/m] a.2 [I/m] aT I [I/m] UgI [m/S] Ug2 [m/s] D., [mm] D.2 [mm]
0.9054 24.1 0.5 0.036 0.876 0.911 24.10 0.00 24.10 2.594 0.000 8.80.8175 20.2 0.5 0.024 0.886 0.910 17.64 0.60 18.24 2.880 2.886 8.2 8858.00.7296 15.2 0.5 0.017 0.877 0.894 13.23 0.35 13.58 2.928 3.376 7.7 15029.10.6417 10.9 0.5 0.012 0.881 0.894 8.53 0.31 8.84 3.358 3.181 8.7 17057.40.5539 6.6 0.5 0.007 0.880 0.887 5.16 0.16 5.32 3.459 1.479 8.5 32992.50.4660 6.3 0.5 0.007 0.888 0.896 4.74 0.32 5.06 3.657 3.337 9.2 16657.50.3781 6.6 0.5 0.007 0.865 0.873 4.97 0.34 5.31 3.636 3.081 8.9 15268.20.2903 5.2 0.5 0.006 0.886 0.891 3.99 0.25 4.24 3.509 2.734 8.4 21252.00.2024 5.5 0.5 0.007 0.869 0.876 4.09 0.03 4.12 3.707 0.893 10.4 173840.00.1145 6.4 0.6 0.009 0.862 0.872 4.80 0.09 4.89 3.680 2.156 11.6 57493.30.0266 6.2 0.5 0.009 0.832 0.842 4.67 0.00 4.67 3.606 0.000 11.8-0.0612 6.2 0.5 0.012 0.838 0.850 5.55 0.00 5.55 3.228 0.000 13.2-0.1491 6.8 0.7 0.012 0.813 0.826 5.56 0.00 5.56 3.348 0.000 13.4-0.2370 13.3 0.8 0.030 0.778 0.808 14.40 0.00 14.40 2.713 0.000 12.5-0.3249 17.1 0.8 0.041 0.638 0.679 22.22 0.00 22.22 2.035 0.000 11.0-0.4127 20.7 0.7 0.064 0.467 0.531 31.09 0.00 31.09 1.696 0.000 12.4
-0.5006 16.3 0.3 0.051 0.058 0.109 22.36 0.00 22.36 1.607 0.000 13.7-0.5885 0.0 0.0 0.000 0.000 0.000 0.00 0.00 0.00 0.000 0.000
-0.6763 0.0 0.0 0.000 0.000 0.000 0.00 0.00 0.00 0.000 0.000
-0.7642 0.0 0.0 0.000 0.000 0.000 0.00 0.00 0.00 0.000 0.000
Calculated Results:<a,> = 0.017 <ail> [1/m] = 8.93 <<Ugl>> [m/s] = 2.445
<a2> = 0.672 <aa> [I/m] = 0.11 <<u,2>> [m/s] = 1.393
<a-,> = 0.688 <aiT> [1r/m] = 9.04 <<ug>> [m/s] = 1.501

84
1.0
0.5
P0.0
-0.5
-1.0
-oo
0 43
0 MT
453
0 430 460 E
_0 a 0
0~ a 2G0 0T
1.0
0.5.
;0.0
-0.5
-1.0
(3
al aa
a
a o i
aa ai
0an
a0
0a ~ o ail
a ai2
a aiT
0.0 0.2 0.4 0.6Void fraction, a
(a)
1.0
0.5
0.0
-0.5
-1.0
0.8 1.0 0 10 20 30 40Interfacial area concentration, ai [1/m]
(b)
50
0
o AAO
A 0A 0
a 0A 0
A 0A 0
I I I 00
00
00
0
0 1 2 3Bubble velocity, ug [m/s]
(c)
4 5
Figure 3.2.10.3 Profiles of local two-phase flow parameters for Run 10 acquired along the vertical radius of the tube atmeasurement port 4 (P4). (a) void fraction, (b) interfacial area concentration and (c) bubble velocity.

85
3.2.11 Summary of results for Run 11.

Table 3.2.11.1 Local two-phase flow parameters for Run 11 acquired along the vertical axis at measurement port 1 (P1)Run 11: jga == 2.526 [m/s] &jf= 1.645 [m/s]Measurement Location: L/D = 197 (Port 1)
Test Conditions: Sampling frequency: Measurement Time:Qg [acfrn] = 3.400 Pback [psig] = 31.6 igJ.o [m/s] =2.199 f1l [ I/s] = 10,000 AT, [s] = 10Qf [gpm] = 51.80 Plo0 [psig] = 2.3 jf [m/s] = 1.645 f,2 [ 1/s] = 10,000 AT 2 [s] = 10
r/R fbl [1/s] fb2 [1/s] al a2 aT a., [1/m] a.2 [1/m] a1T [1/m ugl [rm/s] ug2 [m/si D., [mm] D.2 [mm]
0.9054 53.5 2.0 0.063 0.674 0.738 38.24 0.00 38.24 3.744 0.000 9.90.8175 47.7 2.0 0.054 0.702 0.756 32.32 0.73 33.05 4.008 3.213 10.0 5771.50.7296 45.0 1.8 0.051 0.701 0.752 30.23 0.61 30.84 4.144 3.650 10.0 6897.00.6417 41.0 2.0 0.046 0.697 0.743 27.59 0.54 28.13 4.170 3.631 10.0 7744.40.5539 36.5 2.0 0.041 0.707 0.748 23.66 1.15 24.81 4.343 6.189 10.5 3686.10.4660 31.9 1.9 0.038 0.696 0.734 21.03 0.87 21.90 4.392 6.717 10.8 4798.60.3781 28.1 2.2 0.037 0.696 0.733 18.39 0.86 19.25 4.524 4.990 12.2 4855.80.2903 27.4 2.1 0.036 0.696 0.732 17.40 0.91 18.31 4.603 6.279 12.3 4591.60.2024 32.1 2.0 0.048 0.667 0.714 20.63 0.93 21.56 4.463 5.859 13.9 4300.00.1145 39.4 2.1 0.062 0.666 0.728 26.65 0.40 27.05 4.228 3.143 13.9 9985.50.0266 37.6 2.3 0.059 0.611 0.670 24.25 0.31 24.56 4.397 2.022 14.6 11818.1-0.0612 50.8 2.1 0.084 0.572 0.655 36.12 0.00 36.12 3.985 0.000 13.9-0.1491 55.9 2.3 0.093 0.492 0.585 41.40 0.00 41.40 3.752 0.000 13.5-0.2370 70.7 2.1 0.124 0.340 0.464 59.02 0.00 59.02 3.273 0.000 12.6-0.3249 96.6 0.9 0.180 0.100 0.280 91.96 0.00 91.96 2.807 0.000 11.8-0.4127 64.8 0.0 0.102 0.001 0.104 58.86 0.00 58.86 2.555 0.000 10.4-0.5006 0.0 0.0 0.000 0.000 0.000 0.00 0.00 0.00 0.000 0.000-0.5885 0.0 0.0 0.000 0.000 0.000 0.00 0.00 0.00 0.000 0.000-0.6763 0.0 0.0 0.000 0.000 0.000 0.00 0.00 0.00 0.000 0.000-0.7642 0.0 0.0 0.000 0.000 0.000 0.00 0.00 0.00 0.000 0.000,
Calculated Results:<a,> = 0.059 <ail> [1/m] =29.14 <<ugs>> [m/s] = 3.509
<a 2> = 0.453 <an> [1/mi = 0.35 <<ug2>> [m/s] = 3.215
<aT> = 0.512 <aif> [1/m] =29.49 <<u,>> [m/s] = 3.452
<aT ><< uT >> 1=<_ I = 19.58%_ < jg. wo > I I

87
1.0
0.5
0.0
-0.5
-1.0
1.0o AODo ADo ADo ADo AD3o AD3-o AD3•o ADo AD
o ADO
O ADO0 a 0o A 0
0 4
o a l
A a 2
o a T
0.5
r#n n
aa
G
cai
a i
0 i
,, a ,
a l
o, ai2
AoaiT
-0.5
-1.00.0 0.2 0.4 0.6
Void fraction, a(a)
1.0
0.5
1 0.0 _
-0.5
-1.0
0.8 1.0 0 20 40 60 80Interfacial area concentration, ai [1/m]
(b)
100
0A o
AO0A0
0 A0 A0A0 A
0 AA 0
00
00
J € I •0 i I i 0 ug
A g
0 2 4. 6Bubble velocity, ug [m/s]
(c)
8 10
Figure 3.2.11.1 Profiles of local two-phase flow parameters for Run 11 acquired along the vertical radius of the tube atmeasurement port 1 (PI). (a) void fraction, (b) interfacial area concentration and (c) bubble velocity.

Table 3.2.11.2 Local two-phase flow parameters for Run 11 acquired along the vertical axis at measurement port 3 (P3)
Run 11: jgatm= 2.526 [m/s] &jf= 1.645 [m/s]
Measurement Location: L/D = 250 (Port 3)
Test Conditions: Sampling frequency: Measurement Time:I Qg [acfm] = 2.381 Pback [psig] = 49.6 Jglo• [m/s] =2.164 fa [ I/s = 10,000 AT 1 [s] = 10
Qf [gpm] = 51.90 Pl 0c [psig] = 2.1 jf[m/s]= 1.648 fa [ l/s] = 10,000 AT 2 [s]= 10
r/R fb1 [1/s] fb2 [1/s] o1 a 2 aT al [1/m] a12 [1/m] aiT [1/mi] ug [m/s] Ug2 [m/s] D. 1 [mm] D..2 [mm]
0.9054 74.9 2.0 0.104 0.678 0.782 50.89 0.31 51.20 3.958 1.346 12.3 13124.5
0.8175 68.7 1.9 0.093 0.685 0.778 46.01 0.42 46.43 4.122 2.309 12.1 9790.0
0.7296 58.0 1.9 0.070 0.681 0.750 36.25 0.96 37.21 4.109 5.754 11.5 4254.40.6417 51.9 2.1 0.060 0.700 0.759 31.86 1.22 33.08 4.183 6.700 11.3 3440.7
0.5539 43.4 2.0 0.051 0.686 0.737 26.93 1.16 28.09 4.170 6.168 11.3 3549.8
0.4660 37.9 2.0 0.042 0.678 0.721 23.29 0.94 24.23 4.272 5.161 10.8 4330.20.3781 33.8 2.0 0.040 0.669 0.709 20.54 0.94 21.48 4.319 6.057 11.7 4269.6
0.2903 30.3 2.1 0.037 0.667 0.704 18.63 0.62 19.25 4.309 5.144 11.8 6458.70.2024 31.2 2.2 0.040 0.645 0.685 19.23 0.79 20.02 4.309 7.155 12.5 4898.0
0.1145 37.1 2.0 0.053 0.613 0.666 25.02 0.00 25.02 4.083 0.000 12.80.0266 41.6 2.0 0.060 0.554 0.614 27.93 0.00 27.93 4.016 0.000 12.9-0.0612 50.2 2.2 0.080 0.493 0.572 35.42 0.00 35.42 3.723 0.000 13.5-0.1491 47.1 2.1 0.075 0.414 0.489 34.44 0.00 34.44 3.647 0.000 13.1-0.2370 59.2 1.6 0.108 0.236 0.343 50.99 0.00 50.99 3.082 0.000 12.6
-0.3249 86.3 0.7 0.169 0.086 0.255 83.77 0.00 83.77 2.697 0.000 12.1
-0.4127 88.5 0.1 0.179 0.013 0.192 92.24 0.00 92.24 2.345 0.000 11.7-0.5006 47.8 0.0 0.089 0.000 0.089 47.36 0.00 47.36 1.767 0.000 11.3-0.5885 0.0 0.0 0.000 0.000 0.000 0.00 0.00 0.00 0.000 0.000
-0.6763 0.0 0.0 0.000 0.000 0.000 0.00 0.00 0.00 0.000 0.000
-0.7642 0.0 0.0 0.000 0.000 0.000 0.00 0.00 0.00 0.000 0.000
Calculated Results:
<a,> = 0.067 <ail> [1/m] =33.13 <<Ugi>> [m/s] = 3.250
<a 2> = 0.421 <ai2> [1/m] =0.33 <<u,2>> [m/s] = 3.408
<aT> = 0.488 <ait> [1/m] =33.46 <<ug>> [m/s] = 3.588
aOaO

89
1.0
0.5
S0.0
o a. 0o ta 0
o
o tEo Oo Ao A-oo A
o a 0o a 0
0 00
o O cil
0~ a 0
0 aT
1.0
0.5
An
aG
'II
a
13
0 ail
a ai2
0 aiT
I.
-0.5 -0.5
-1.0-1.0
0.0 0.2 0.4 0.Void fraction
(a)
1.0
0.5
P0.0
-0.5
-1.0
6, a
0.8 1.0 0 20 40 60 80Interfacial area concentration, ai [1/m]
(b)
100
A 0A 0
0 Ao A0 Ao Ao A0 Ao a
0I 9 I r
0.0
00
0
0
oug
oug
0 2 4 6Bubble velocity, ug [m/s]
(c)
8 10
Figure3.2.11.2 Profiles of local two-phase flow parameters for Run 11 acquired along the vertical radius of the tube atmeasurement port 3 (P3). (a) void fraction, (b) interfacial area concentration and (c) bubble velocity.

Table 3.2.11.3 Local two-phase flow parameters for Run 11 acquired along the vertical axis at measurement port 4 (P4)Run 11: Jg,atm= 2.526 [m/s] &jf= 1.645 [m/s]
Measurement Location: L/D = 329 (Port 4)
Test Conditions: Sampling frequency: Measurement Time:Qg [acfin] = 3.113. Pback [psig] = 35.9 jg,,oc [m/s] =2.227 fsl [1 /s] = 10,000 AT1 [s] 10Qf [gpm] = 51.70 Ploc [psig] = 2.1 jf [m/s] = 1.641 f,2 [ 1/s]= 10,000 AT 2 [s] 10
r/R fbl [1/s] fb2 [1/s] a1 a2 (IT a.1 [1/m] a1 [1/mi air [1/m] ugl [m/s] u.2 [mr/s D. [mm] D.2 [mm]
0.9054 58.3 1.7 0.069 0.699 0.768 42.26 0.79 43.05 3.785 2.814 9.8 5307.30.8175 51.0 1.7 0.056 0.694 0.751 35.56 0.66 36.22 3.884 3.594 9.5 6311.80.7296 45.8 1.8 0.048 0.702 0.750 30.94 1.03 31.97 4.189 6.009 9.3 4087.60.6417 42.0 1.8 0.045 0.706 03750 28.26 1.14 29.40 4.256 6.329 9.5 3714.20.5539 37.9 1.7 0.040 0.687 0.726 25.04 0.95 25.99 4.374 6.799 9.5 4338.30.4660 31.9 1.8 0.035 0.708 0.743 21.44 1.05. 22.49 4.514 6.204 9.9 4044.00.3781 27.8 1.9 0.031 0.706 0.737 18.21 0.84 19.05 4.664 5.943 10.3 5043.60.2903 26.2 1.9 0.033 0.687 0.720 16.98 0.83 17.81 4.590 6.990 11.7 4964.80.2024 24.7 1.8 0.030 0.678 0.708 15.93 0.27 16.20 4.851 4.313 11.4 15071.10.1145 26.6 1.9 0.038 0.661 0.699 16.88 0.00 16.88 4.808 0.000 13.50.0266 30.7 1.8 0.044 0.593 0.638 20.58 0.00 20.58 4.534 0.000 12.9-0.0612 35.4 1.9 0.052 0.558 0.610 22.84 0.08 22.92 4.361 2.202 13.8 41812.5-0.1491 43.6 2.1 0.067 0.443 0.511 30.97 0.00 30.97 4.016 0.000 13.0-0.2370 54.6 2.1 0.093 0.221 0.314 41.94 0.00 41.94 3.665 0.000 13.3-0.3249 101.6 0.1 0.201 0.012 0.213 97.46 0.00 97.46 2.930 0.000 12.3-0.4127 108.6 0.0 0.199 0.000 0.199 110.12 0.00 110.12 2.493 0.000 10.8-0.5006 35.1 0.0 0.050 0.000 0.050 30.32 0.00 30.32 1.533 0.000 9.8-0.5885 0.0 0.0 0.000 0.000 0.000 0.00 0.00 0.00 0.000 0.000-0.6763 0.0 0.0 0.000 0.000 0.000 0.00 0.00 0.00 0.000 0.0001-0.7642 0.0 0.0 0.000 0.000 0.000 0.00 0.00 0.00 0.000 0.000 1
Calculated Results:<a,> = 0.057 <ail> [1/m] =29.51 <ugl>> [m/s] = 3.452
<a 2> = 0.438 <ai2> [1/m] = 0.33 <<ug2>> [m/s] = 3.856
<aT> = 0.495 <aiT> [1/m] =29.84 <<ug>> [m/s] = 4.044
(DC
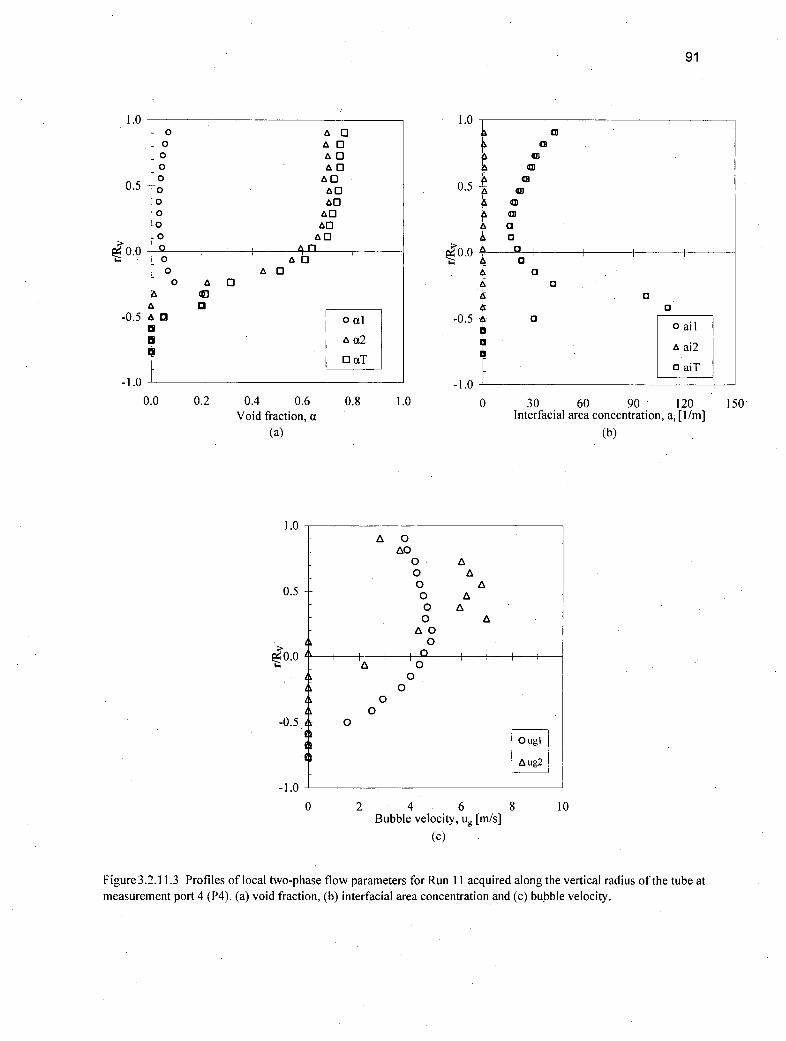
91
1.0o d[
o a 0o •o &o •
0.5 o&o •-o-o.o
-00.0 o 0 n
0* 0
o aT-
-0.5 Dou
-1.0
1.0
0.5
1 0.0
G 0
aai0ai
a
0
DI IIa
o ail
A ai2
o aiT
-0.5
-1.00.0 0.2 0.4 0.6
Void fraction, a(a)
1.0
0.5
10.0
-0.5
-1.0
0.8 1.0 0 30 60 90 120Interfacial area concentration, ai [1/m]
(b)
150
A 0AO
0 ao Ao Ao Ao Ao A
0
101A 0
00
00
00Og
AOg
0 2 4 6Bubble velocity, u. [m/s]
(c)
8 10
Figure 3.2.11.3 Profiles of local two-phase flow parameters for Run 11 acquired along the vertical radius of the tube atmeasurement port 4 (P4). (a) void fraction, (b) interfacial area concentration and (c) bubble velocity.

92
3.2.12 Summary of results for Run 12.

Table 3.2.12.1 Local two-phase flow parameters for Run 12 acquired along the vertical axis at measurement port 1 (P1)
Run 12: jg,a.a= 2.648 [m/s] &jf= 2.204 [m/s]
Measurement Location: L/D = 197 (Port 1)
Test Conditions: Sampling frequency: Measurement Time:Qg [acfm] = 3.477 Pback [psig] = 32.8 Jgloc [m/s] =2.185 ft [ l/s] = 10,000 AT 1 [s] = 10Qf [gpm] -- 69.50 Po [psig] = 3.1 jf [mls] = 2.207 fa [ I/s] = 10,000 AT 2 [s] = 10
r/R fb1 [1/s] fb2 [1/s] a1 a2 aT afi [I/m] a,2[1/m] aiT [1/mI] Up [m/s] u2 [mis] D. 1 [mm] D.2 [mm]
0.9054 67.8 2.5 0.081 0.591 0.672 44.71 0.36 45.07 4.121 1.511 10.9 9843.30.8175 62.4 2.6 0.073 0.603 0.675 40.86 1.26 42.12 4.287 4.862 10.7 2869.00.7296 55.8 2.5 0.063 0.597 0.660 35.85 1.14 36.99 4.428 5.229 10.5 3142.60.6417 56.5 2.6 0.064 0.613 0.677 35.87 1.45 37.32 4.596 7.298 10.8 2536.10.5539 49.5 2.7 0.054 0.596 0'651 30.27 1.07 31.34 5.106 5.267 10.8 3343.20.4660 48.3 2.6 0.056 0.596 0.652 29.92 1.16 31.08 5.144 6.715 11.2 3084.80.3781 42.0 2.8 0.050 0.607 0.657 26.16 1.32 27.48 5.170 6.931 11.5 2756.80.2903 38.0 2.9 0.050 0.589 0.639 23.66 1.22 24.88 5.192 7.360 12.6 2898.70.2024 37.5 2.8 0.048 0.577 0.626 23.34 0.97 24.31 5.103 6.616 12.4 3570.30.1145 36.3 2.9 0.050 0.535 0.585 22.58 0.89 23.47 5.200 6.260 13.2 3609.40.0266 47.7 2.6 0.069 0.482 0.551 29.63 0.00 29.63 4.859 0.000 13.9-0.0612 55.6 2.7 0.086 0.401 0.486 35.67 0.12 35.79 4.566 0.980 14.4 20035.0-0.1491 64.7 2.6 0.101 0.240 0.341 43.12 0.00 43.12 4.305 0.000 14.0-0.2370 77.2 0.7 0.123 0.052 0.175 54.20 0.00 54.20 4.043 0.000 13.6-0.3249 96.6 0.0 0.155 0.001 0.156 73.73 0.00 73.73 3.568 0.000 12.6-0.4127 78.6 0.0 0.108 0.000 0.108 60.24 0.00 60.24 3.142 0.000 10.7-0.5006 0.0 0.0 0.000 0.000 0.000 0.00 0.00 0.00 0.000 0.000-0.5885 0.0 0.0 0.000 0.000 0.000 0.00 0.00 0.00 0.000 0.0001-0.6763 0.0 0.0 0.000 0.000 0.000 0.00 0.00 0.00 0.000 0.000 1-0.7642 0.0 0.0 0.000 0.000 0.000 0.00 0.00 0.00 0.000 0.0001
Calculated Results:<al> = 0.064 <ail> [1/m] = 30.68 <<Ugl>> [m/s] = 4.150
<a2> = 0.348 <ai2> [1/m] =0.51 <<Ug2>> [m/s] = 4.772
<aT> = 0.411 <aiT> [I/m] = 3 1.19 <<ug>> [m/s] = 4.975
(0

94
1.0
0.5
;40.0
-0.5
-1.0
o a 0o •1o a 0o •1o a1oo ao 1
o •
0 0
o • 0000 a 0o0 a T0 ao.
0o 0
a a
1.0
0.5
•0.0
CDCD
CID
ao0
o ail
a ai2
o aiT
-0.5
-1.00.0 0.2 0.4 0.6
Void fraction, a(a)
1.0
0.5
F0.0
-0.5
-1.0
0.8 1.0 0 20 40 60 80Interfacial area concentration, ai [1/m]
• (b)
100
A 00A0 A0 A
0 A0 A0 A0 A0 A
I r ', q 1 i IA 0
00
00
0 2 4 6Bubble velocity, Ug [m/s]
(c)
8 10
Figure 3.2.12.1 Profiles of local two-phase flow parameters for Run 12 acquired along the vertical radius of the tube atmeasurement port 1 (P1). (a) void fraction, (b) interfacial area concentration and (c) bubble velocity.

Table 3.2.12.2 Local two-phase flow parameters for Run 12 acquired along the vertical axis at measurement port 3 (P3)
Run 12: jg,an= 2.648 [m/s] &jf= 2.204 [mIs]Measurement Location: L/D = 250 (Port 3)
Test Conditions: Sampling frequency: Measurement Time:Qg [acfin] = 3.324 Pbak [psig] = 34.6 jg,1oc [m/s] =2.199 fo [I s] = 10,000 AT, [s] = 10Qf [gpm] = 69.40 Pl.. [psig] = 3.0 jf [m/s] = 2.203 fa [ i/s] = 10,000 AT 2 [s] = 10
r/R fbI [1/s] fb2 [1/s] a1 a2 aT ail [1/m] a2 [I/m] aiT [I/rm] UgI [m/S] Ug2 [m/s] D., [mm] D.2 [mm]
0.9054 78.2 2.5 0.099 0.590 0.689 48.37 0.00 48.37 4.502 0.000 12.30.8175 72.1 2.7 0.089 0.610 0.699 44.36 0.62 44.98 4.853 3.339 12.0 5900.30.7296 66.9 2.6 0.079 0.608 0.687 40.60 0.90 41.50 5.148 4.335 11.7 4050.70.6417 60.7 2.7 0.069 0.603 0.672 37.64 1.12 38.76 5.158 7.145 11.0 3230.40.5539 51.9 2.7 0.060 0.614 0.674 32.66 0.87 33.53 5.195 5.550 11.0 4232.40.4660 48.1 2.5 0.054 0.603 0.657 29.87 1.30 31.17 5.208 8.088 10.9 2783.10.3781 43.8 2.8 0.049 0.606 0.654 27.85 1.18 29.03 5.249 8.104 10.5 3078.80.2903 41.8 2.9 0.050 0.587 0.637 26.56 1.00 27.56 5.283 7.064 11.2 3522.00.2024 43.1 2.8 0.051 0.539 0.590 27.06 0.66 27.72 5.273 5.520 11.3 4900.00.1145 46.3 2.5 0.059 0.496 0.556 29.63 0.68 30.31 5.138 5.551 12.0 4379.10.0266 52.3 2.7 0.072 0.431 0.503 33.74 0.00 33.74 4.925 0.000 12.8-0.0612 60.0 2.4 0.088 0.354 0.442 40.04 0.10 40.14 4.438 0.858 13.1 21252.0-0.1491 68.9 2.3 0.102 0.275 0.377 46.74 0.00 46.74 4.236 0.000 13.1-0.2370 78.9 1.4 0.133 0.155 0.287 59.47 0.00 59.47 3.809 0.000 13.4-0.3249 92.0 0.8 0.161 0.078 0.238 71.06 0.00 71.06 3.612 0.000 13.6-0.4127 101.6 0.0 0.170 0.001 0.171 84.61 0.00 84.61 3.144 0.000 12.1-0.5006 62.6 0.0 0.090 0.000 0.090 49.98 0.00 49.98 3.030 0.000 10.8-0.5885 0.0 0.0 0.000 0.000 0.000 0.00 0.00 0.00 0.000 0.000-0.6763 0.0 0.0 0.000 0.000 0.000 0.00 0.00 0.00 0.000 0.000-0.7642 0.0 0.0 0.000 0.000 0.000 0.00 0.00 0.00 0.000 0.000
Calculated Results:<a,> = 0.074 <ail> [1/m] =36.56 <<ug»>> [m/s] = 4.111
<a 2> = 0.348 <ai2> [1/m] =0.41 <<ug2>> [m/s] = 4.541
<a-> = 0.422 <ai-> [1/m] =36.97 <<u,>> [m/s] = 4.717
C.0C n

96
1.000oo
o0.5 0 a 0
o a3o 40o ao
F0.0 0 A i
0 000 a 0
-0.5 0
-1.0
0.0 0.2 0.4 0.6Void fraction, a
(a)
0003
0 a|
0.8 1.0
1.0
0.5
140.0
-0.5
-1.0
an
CM
13C)
0ai
aai
0ai
0 20 40 60 80Interfacial area concentration, ai [1/m]
(b)
100
1.0
0.5
p40.0
-0.5
-1.0
0A C
A Co AOAo Ao Ao ACA
O A
A oC
oC
CC
C0g
0ug
0 2 4 6
Bubble velocity, Ug [m/s]
(c)
8 10
Figure 3.2.12.2 Profiles of local two-phase flow parameters for Run 12 acquired along the vertical radius of the tube atmeasurement port 3 (P3). (a) void fraction, (b) interfacial area concentration and (c) bubble velocity.

Table 3.2.12.3 Local two-phase flow parameters for Run 12 acquired along the vertical axis at measurement port 4 (P4)
Run 12: jg,atm= 2.648 [m/s] &jf= 2.204 [m/s]
Measurement Location: L/D = 329 (Port 4)
Test Conditions: Sampling frequency: Measurement Time:Qg [acfifl] = 3.2 10 Pback [psig] = 36.5 jg,lo, [m/s] =2.205 f.l [Il/s] = 10,000 AT 1 [s] = 10Qf [gpm] = 69.30 Pl.. [psig] = 3.0 jf [m/s] = 2.200 f2 [ l/s] = 10,000 AT 2 [s] = 10
r/R fb 1 [1/si fb 2 [1/sI al a2 aT ail [1/r] a2 [1/m] aiT [1/mi Ugl [m/s] ug [m/s] D., [mm] D.2 [mm]
0.9054 57.9 2.5 0.065 0.619 0.683 39.32 0.00 39.32 4.217 0.000 9.90.8175 60.0 2.3 0.066 0.615 0.681 40.40 0.63 41.03 4.328 3.026 9.7 5857.10.7296 53.4 2.3 0.057 0.621 0.678 36.53 0.75 37.28 4.544 5.164 9.4 4970.40.6417 48.8 2.4 0.053 0.631 0.684 33.06 0.98 34.04 5.010 6.725 9.6 3861.40.5539 45.8 2.4 0.050 0.620 0.670 31.38 1.23 32.61 5.164 6.467 9.5 3024.90.4660 44.2 2.5 0.048 0.621 0.669 29.88 0.89 30.77 5.198 6.195 9.6 4189.20.3781 40.5 2.7 0.045 0.617 0.662 27.34 0.75 28.09 5.229 4.538 9.9 4938.40.2903 37.6 2.6 0.044 0.614 0.658 26.05 1.02 27.07 5.208 8.169 10.1 3610.00.2024 33.1 2.9 0.041 0.599 0.640 22.60 0.43 23.03 5.249 4.051 10.8 8363.70.1145 36.8 2.7 0.047 0.554 0.602 24.99 0.00 24.99 5.237 0.000 11.40.0266 41.7 2.6 0.057 0.515 0.573 27.79 0.00 27.79 5.168 0.000 12.3-0.0612 48.4 2.6 0.069 0.432 0.501 31.45 0.14 31.59 5.121 1.555 13.2 18514.3-0.1491 64.2 2.8 0.104 0.289 0.393 42.67 0.00 42.67 4.454 0.000 14.7-0.2370 75.4 1.2 0.117 0.089 0.206 52.61 0.00 52.61 4.185 0.000 13.4-0.3249 111.1 0.0 0.182 0.003 0.184 86.26 0.00 86.26 3.614 0.000 12.6-0.4127 103.3 0.0 0.144 0.000 0.144 83.53 0.00 83.53 3.122 0.000 10.4-0.5006 31.1 0.0 0.036 0.000 0.036 24.66 0.00 24.66 1.825 0.000 8.7-0.5885 0.0 0.0 0.000 0.000 0.000 0.00 0.00 0.00 0.000 0.000-0.6763 0.0 0.0 0.000 0.000 0.000 0.00 0.00 0.00 0.000 0.000-0.7642 0.0 0.0 0.000 0.000 0.000 0.00 0.00 0.00 0.000 0.000 _
Calculated Results:<a,> = 0.063 <ail> [1/m] =32.97 <<u»l>> [m/si = 4.182
<a2> = 0.367 <ai2> [1/mr] 0.33 <<ug2>> [mi/s] = 3.734
<aT> = 0.430 <aiT> [l/m] = 33.30 <<ug>> [m/s] = 4.041
(-0

98
1.0
0.5
P0.0
-0.5
-1.0
o A [3O LiOO a O
0 Li0
0 A 0
0 C0 0O
&0 . 0,o S
1.0
0.5
0.0
-0.5
G0aoa
a
a
000
ao
o o ail
Li ai2
o aiT
-1.0
0.0 0.2 0.4 0.6Void fraction, cE
(a)
1.0
0.5
F0.0
-0.5
-1.0
0.8 1.0 0 20 40 60 80Interfacial area concentration, ai [1/m]
(b)
100
0 2 4 6Bubble velocity, u, [m/s]
(c)
8 10
Figure 3.2.12.3 Profiles of local two-phase flow parameters for Run 12 acquired along the vertical radius of the tube atmeasurement port 4 (P4). (a) void fraction, (b) interfacial area concentration and (c) bubble velocity.

99
3.2.13 Summary of results for Run 13.
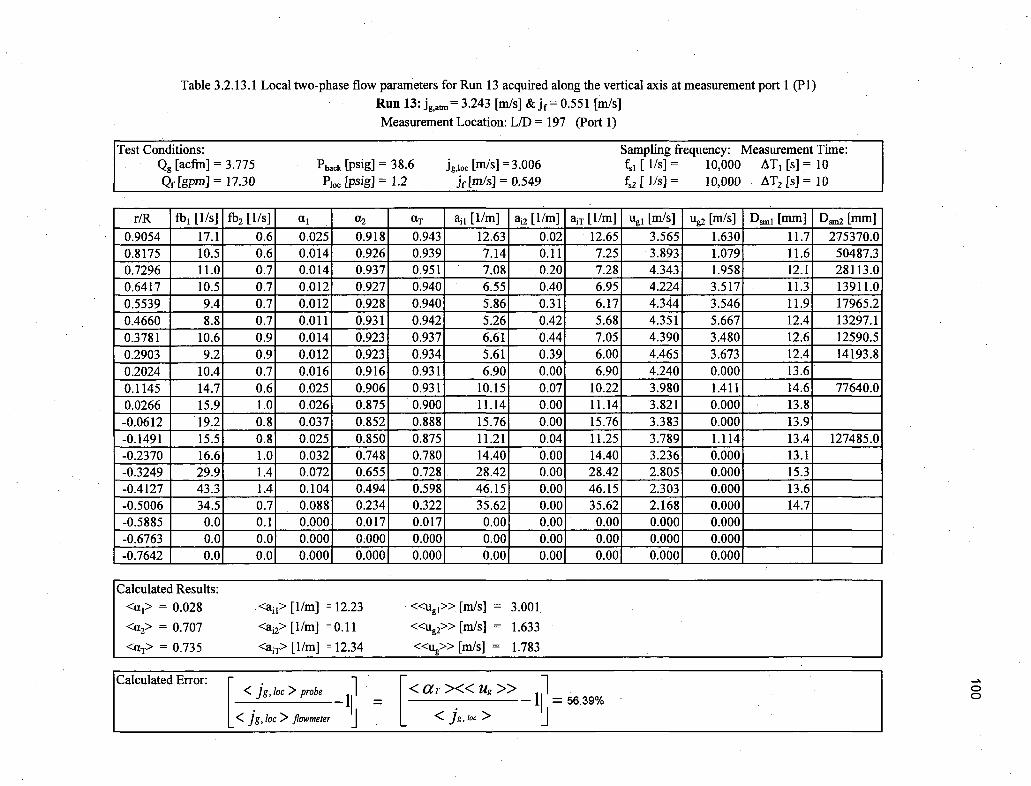
Table 3.2.13.1 Local two-phase flow parameters for Run 13 acquired along the vertical axis at measurement port 1 (P1)Run 13: jg,at= 3.243 [m/s] &jf= 0.551 [m/s]
Measurement Location: L/D = 197 (Port 1)
Test Conditions: Sampling frequency: Measurement Time:Qg [acfm] = 3.775 Pback [psig] = 38.6 ig,loc [m/s] =3.006 fl [ I/s] = 10,000 AT, [s] 10Qf [gpmj = 17.30 Pfoc [psig] = 1.2 jf mWs] = 0.549 f,2 I l/s] = 10,000 AT 2 [s] 10
r/R fb1 [I/s] fb2 [/s] aL1 a2 ET ail [1/m] a,2 [1/m] aff [l/mi Ug, [m/S] Ug2 [m/S] D. 1 [mm] D.2 [mm]0.9054 17.1 0.6 0.025 0.918 0.943 12.63 0.02 12.65 3.565 1.630 11.7 275370.00.8175 10.5 0.6 0.014 0.926 0.939 7.14 0.11 7.25 3.893 1.079 11.6 50487.30.7296 11.0 0.7 0.014 0.937 0.951 7.08 0.20 7.28 4.343 1.958 12.1 28113.00.6417 10.5 0.7 0.012 0.927 0.940 6.55 0.40 6.95 4.2241 3.517 11.3 13911.00.5539 9.4 0.7 0.012 0.928 0.940 5.86 0.31 6.17 4.344 3.546 11.9 17965.20.4660 8.8 0.7 0.011 0.931 0.942 5.26 0.42 5.68 4.351 5.667 12.4 13297.10.3781 10.6 0.9 0.014 0.923 0.937 6.61 0.44 7.05 4.390 3.480 12.6 12590.50.2903 9.2 0.9 0.012 0.923 0.934 5.61 0.39 6.00 4.465 3.673 12.4 14193.80.2024 10.4 0.7 0.016 0.916 0.931 6.90 0.00 6.90 4.240 0.000 13.60.1145 14.7 0.6 0.025 0.906 0.931 10.15 0.07 10.22 3.980 1.411 14.6 77640.00.0266 15.9 1.0 0.026 0.875 0.900 11.14 0.00 11.14 3.821 0.000 13.8-0.0612 19.2 0.8 0.037 0.852 0.888 15.76 0.00 15.76 3.383 0.000 13.9-0.1491 15.5 0.8 0.025 0.850 0.875 11.21 0.04 11.25 3.789 1.114 13.4 127485.0-0.2370 16.6 1.0 0.032 0.748 0.780 14.40 0.00 14.40 3.236 0.000 13.1-0.3249 29.9 1.4 0.072 0.655 0.728 28.42 0.00 28.42 2.805 0.000 15.3-0.4127 43.3 1.4 0.104 0.494 0.598 46.15 0.00 46.15 2.303 0.000 13.6-0.5006 34.5 0.7 0.088 0.234 0.322 35.62 0.00 35.62 2.168 0.000 14.7-0.5885 0.0 0.1 0.000 0.017 0.017 0.00 0.00 0.00 0.000 0.000-0.6763 0.0 0.0 0.000 0.000 0.000 0.00 0.00 0.00 0.000 0.000-0.7642 0.0 0.0 0.000 0.000 0.000 0.00 0.00 0.00 0.000 0.000 1
Calculated Results:<a,> = 0.028 .<ail> [1/m] = 12.23 <<u»l>> [m/s] = 3.001
<a 2> = 0.707 <a 2> [I/m] =0.11 <<ug2>> [m/s] = 1.633
<ar> = 0.735 <ai1> [1/m] = 12.34 <<ug>> [m/s] = 1.783
00

101
1.0
0.5
F0.0
-0.5
-1.0
o0 AID
o Ao El0 43
-o D0 I3o A0
-0 amO
0 a o0u0 0T
1.0
0.5
140.0
-0.5
-1.0
aQ
a
ao
O
a0
o c, ail
a ai2
o aiT
0.0 0.2 0.4 0.6Void fraction, a
(a)
0.8 1.0 0 20 40Interfacial area concentration, ai [1/m]
(b)
60
1.0
0.5
;0.0
-0.5
A C
A 0A 0A 0
0 AA 0
A 00
A 0
0A 0
00
00
1.0
0 2 4 6Bubble velocity, Ug [m/s]
(c)
8 10
Figure 3.2.13.1 Profiles of local two-phase flow parameters for Run 13 acquired along the vertical radius of the tube atmeasurement port 1 (P1). (a) void fraction, (b) interfacial area concentration and (c) bubble velocity.
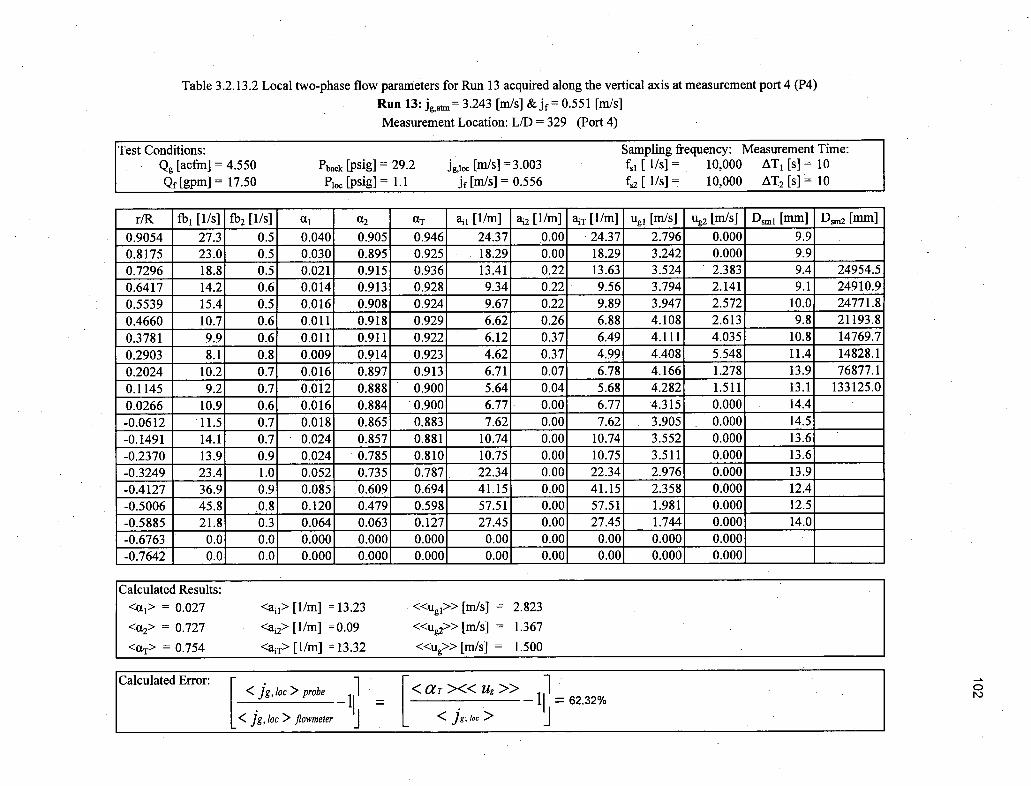
Table 3.2.13.2 Local two-phase flow parameters for Run 13 acquired along the vertical axis at measurement port 4 (P4)
Run 13: jg.atm= 3.243 [m/s] &jf= 0.551 [m/s]
Measurement Location: L/D = 329 (Port 4)
Test Conditions: Sampling frequency: Measurement Time:Qg [acfm] = 4.550 Pback [psig] = 29.2 Jg,lo• [m/s] =3.003 fs [ I/SN = 10,000 AT1 [s] = 10
Qf [gpm] = 17.50 Plo. [psig] = 1.1 jf [m/s] = 0.556 f2 [1 /si = 10,000 AT 2 [s] = 10
r/R fbI [i/s] fb2 [i/s] a, a2 aT a,, [1/m] ai [1/m] aiT [1/m] ug, [m/s] ug [m/s] D., [mm] D.2 [mm]
0.9054 27.3 0.5 0.040 0.905 0.946 24.37 0.00 24.37 2.796 0.000 9.90.8175 23.0 0.5 0.030 0.895 0.925 18.29 0.00 18.29 3.242 0.000 9.90.7296 18.8 0.5 0.021 0.915 0.936 13.41 0.22 13.63 3.524 2.383 9.4 24954.50.6417 14.2 0.6 0.014 0.913 0.928 9.34 0.22 9.56 3.794 2.141 9.1 24910.90.5539 15.4 0.5 0.016 0.908 0.924 9.67 0.22 9.89 3.947 2.572 10.0 24771.80.4660 10.7 0.6 0.011 0.918 0.929 6.62 0.26 6.88 4.108 2.613 9.8 21193.80.3781 9.9 0.6 0.011 0.911 0.922 6.12 0.37 6.49 4.111 4.035 10.8 14769.70.2903 8.1 0.8 0.009 0.914 0.923 4.62 0.37 4.99 4.408 5.548 11.4 14828.10.2024 10.2 0.7 0.016 0.897 0.913 6.71 0.07 6.78 4.166 1.278 13.9 76877.10.1145 9.2 0.7 0.012 0.888 0.900 5.64 0.04 5.68 4.282 1.511 13.1 133125.00.0266 10.9 0.6 0.016 0.884 0.900 6.77 0.00 6.77 4.315 0.000 14.4-0.0612 11.5 0.7 0.018 0.865 0.883 7.62 0.00 7.62 3.905 0.000 14.5-0.1491 14.1 0.7 0.024 0.857 0.881 10.74 0.00 10.74 3.552 0.000 13.6-0.2370 13.9 0.9 0.024 0.785 0.810 10.75 0.00 10.75 3.511 0.000 13.6-0.3249 23.4 1.0 0.052 0.735 0.787 22.34 0.00 22.34 2.976 0.000 13.9-0.4127 36.9 0.9 0.085 0.609 0.694 41.15 0.00 41.15 2.358 0.000 12.4-0.5006 45.8 0.8 0.120 0.479 0.598 57.51 0.00 57.51 1.981 0.000 12.5-0.5885 21.8, 0.3 0.064 0.063 0.127 27.45 0.00 27.45 1.744 0.000 14.0
-0.6763 0.0 0.0 0.000 0.000 0.000 0.00 0.00 0.00 0.000 0.000
-0.7642 0.0 0.0 0.000 0.000 0.000 0.00 0.00 0.00 0.000 0.000
Calculated Results:<a,> = 0.027 <ail> [1/m] i 13.23 <<u, 1>> [m/s] = 2.823
<a 2> = 0.727 <an> [1/m] =0.09 <<u»2>> [m/s] = 1.367
<aT> = 0.754 <aiT> [1/m] = 13.32 <<ug>> [nis] = 1.500
C

103
1.0
0.5
S0.0
-0.5
-1.0
1.0-o AD.o AD
0 401p 43
-5 M3
o 43
o 4
_o AD
o Ano A
o A 03 o cl
004
0 to0 0a a2
[0 QT
0.5
•0.0
-0.5
-1.0
0
0
a
0
0
0
o
a o ail
A ai20 ail
0.0 0.2 0.4 0.6Void fraction, a
(a)
0.8 1.0 0 20 40 60 80Interfacial area concentration, ai [1/m]
(b)
100
I Al
0.5
g0.0
00
A 0A 0A 0A 0
0 AA 0
A 0
100
00
00
0 Og0AIugI-0.5.
-1.0
.0 2 4 6 8 10Bubble velocity, Ug [m/s]
(c)
Figure 3.2.13.2 Profiles of local two-phase flow parameters for Run 13 acquired along the vertical radius of the tube atmeasurement port 4 (P4). (a) void fraction, (b) interfacial area concentration and (c) bubble velocity.

104
3.2.14 Summary of results for Run 14.

Table 3.2.14.1 Local two-phase flow parameters for Run 14 acquired along the vertical axis at measurement port 1 (P1)Run 14: jg,a•= 3.528 [m/s] &jf= 1.644 [m/s]
Measurement Location: L/D = 197 (Port 1)
Test Conditions: Sampling frequency: Measurement Time:Qg [acffi] = 3.960 Pback [psig] = 40.3 jgIo [m/s] =2.990 f [i/s] = 10,000 AT, [s] = 10Qf [gpm] = 51.80 P10. [psig] = 2.6 jf [m/s] = 1.645 f2 [1/s] = 10,000 AT 2 [s] = 10
r/R fbi [1/s] fb 2 [i/s] at1 a2 aT ail [1/m] ak2 [1/m] a1T [1/nM] ugI [m/S] ug2 [m/s] Ds 1 [mm] D.2 [mm]
0.9054 34.1 1.8 0.044 0.732 0.776 21.79 0.00 21.79 4.037 0.000 12.10.8175 30.0 2.1 0.035 0.765 0.800 17.65 1.30 18.95 4.473 7.414 11.8 3531.70.7296 30.6 1.9 0.035 0.766 0.801 16.93 1.27 18.20 4.628 6.724 12.5 3618.90.6417 27.8 2.0 0.033 0.754 0.787 15.18 0.83 16.01 4.958 5.578 12.9 5450.60.5539 27.8 2.0 0.033 0.779 0.811 14.70 0.87 15.57 5.271 6.319 13.3 5369.70.4660 27.1 2.2 0.031 0.751 0.782 13.86 0.93 14.79 5.520 5.991 13.4 4845.20.3781 27.0 2.4 0.032 0.757 0.789 13.87 1.05 14.92 5.445 6.634 13.6 4327.40.2903 28.1 2.4 0.035 0.741 0.776 14.53 0.81 15.34 5.542 6.625 14.5 5488.90.2024 27.5 2.5 0.035 0.717 0.752 14.52 0.27 14.79 5.549 2.384 14.4 15935.60.1145 30.2 2.5 0.039 0.699 0.738 16.08 0.17 16.25 5.509 1.205 14.6 24660.00.0266 41.8 2.8 0.062 0.628 0.691 24.24 0.34 24.58 4.696 2.742 15.4 11089.4-0.0612 45.5 2.6 0.069 0.578 0.647 26.01 0.56 26.57 4.720 5.217 15.9 6190.7-0.1491 56.9 2.9 0.087 0.502 0.589 35.43 0.00 35.43 4.472 0.000 14.8-0.2370 69.8 1.9 0.113 0.328 0.442 47.36 0.05 47.41 4.067 3.128 14.4 39396.0-0.3249 116.2 0.9 0.202 0.105 0.307 90.12 0.09 90.21 3.506 1.056 13.4 7000.0-0.4127 126.9 0.1 0.216 0.012 0.228 109.29 0.00 109.29 3.093 0.000 11.9-0.5006 97.4 0.0 0.142 0.000 0.142 83.20 0.00 83.20 2.847 0.000 10.2-0.5885 0.0 0.0 0.000 0.000 0.000 0.00 0.00 0.00 0.000 0.000-0.6763 0.0 0.0 0.000 0.000 0.000 0.00 0.00 0.00 0.000 0.000-0.7642 0.0 0.0 0.000 0.000 0.000 0.00 0.00 0.00 0.000 0.000
Calculated Results:<a,> = 0.064 <ail> [1/m] =29.17 <<ug>> [m/s] = 3.908
<a2> = 0.480 <ai2> [1/m] = 0.43 <<ug2>> [m/s] = 4.381
<aT> = 0.544 <aiT> [1/m] =29.59 <<ug>> [m/s] = 4.586
Ccn

106
1.0
0.5
P0.0
-0.5
-1.0
1.0
0.5
•>0.0a
ao ail
aa ai2
0 aiT
-0.5
-1.00.0 0.2 0.4 0.6
Void fraction, a
(a)
0.8 1.0 0 30 60 90 120Interfacial area concentration, ai [1/m]
(b)
150
1.0
0.5
P0.0
-0.5
0o Ao A
0 A0 A
0A0 A0 A
A 0A 0,, , A I 0 : i i I i
0A0
A 0A 0
00
0 g
-1.0
0 2 4 6Bubble velocity, ug [m/s]
(c)
8 10
Figure 3.2.14.1 Profiles of local two-phase flow parameters for Run 14 acquired along the vertical radius of the tube atmeasurement port 1 (PI). (a) void fraction, (b) interfacial area concentration and (c) bubble velocity.

Table 3.2.14.2 Local two-phase flow parameters for Run 14 acquired along the vertical axis at measurement port 4 (P4)Run 14: jg,atm= 3.528 [m/s] &jf= 1.644 [m/s]
Measurement Location: L/D = 329 (Port 4)
Test Conditions: Sampling frequency: Measurement Time:Qg [acfin] = 4.600 Pback [psig] = 33.0 Jg,.oc [m/s] =3.012 fs [1 /s] = 10,000 AT1 [s] = 10
Qf [gpm] = 51.70 Pl.. [psig] = 2.6 jf [m/s] = 1.641 fs2 [ I/s] = 10,000 AT 2 [s] = 10
r/R fb1 l [1/si fb2 [/si aL a2 a-T aii [1/nM] a,2 [1/m] aiT [l/m] Ug1 [m/s] Ug2 [m/s] D. 1 [mm] D.. [mm]
0.9054 44.1 1.7 0.056 0.728 0.784 30.60 0.00 30.60 3.755 0.000 11.00.8175 38.4 1.7 0.044 0.753 0.797 22.57 0.84 23.41 4.378 6.553 11.6 5376.40.7296 34.9 1.6 0.038 0.745 0.783 20.41 0.77 21.18 4.475 4.738 11.2 5803.60.6417 33.6 1.6 0.038 0.750 0.788 18.54 0.86 19.40 4.735 6.731 12.2 5231.20.5539 32.2 1.7 0.033 0.749 0.782 16.88 0.72 17.60 5.407 5.483 11.7 6242.50.4660 32.4 1.8 0.034 0.749 0.784 17.19 0.94 18.13 5.274 6.491 12.0 4781.50.3781 28.0 1.6 0.031 0.744 0.776 14.78 0.72 15.50 5.488 6.937 12.7 6202.50.2903 27.6 1.8 0.030 0.739 0.769 14.64 0.50 15.14 5.452 5.254 12.5 8862.00.2024 27.6 1.8 0.032 0.732 0.764 14.61 0.51 15.12 5.579 5.651 13.1 8608.20.1145 26.0 1.8 0.032 0.721 0.752 14.00 0.24 14.24 5.598 2.547 13.7 18012.50.0266 32.6 1.9 0.043 0.688 0.730 17.60 0.00 17.60 5.502 0.000 14.6
-0.0612 45.8 2.0 0.065 0.645 0.709 26.28 0.07 26.35 5.034 1.252 14.7 55260.0-0.1491 45.6 1.9 0.063 0.565 0.628 26.26 0.00 26.26 4.862 0.000 14.5-0.2370 57.0 2.2 0.082 0.449 0.531 34.74 0.00 34.74 4.491 0.000 14.2-0.3249 120.4 1.6 0.199 0.203 0.401 88.28 0.00 88.28 3.755 0.000 13.5-0.4127 161.1 0.3 0.288 0.031 0.319 135.15 0.00 135.15 3.225 0.000 12.8-0.5006 137.5 0.0 0.221 0.000 0.221 117.33 0.00 117.33 2.923 0.000 11.3-0.5885 29.3 0.0 0.041 0.000 0.041 23.48 0.00 23.48 1.709 0.000 10.5
-0.6763 0.0 0.0 0.000 0.000 0.000 0.00 0.00 0.00 0.000 0.000,
-0.7642 0.0 0.0 0.000 0.000 0.000 0.00 0.00 0.00 0.000 0.0001
Calculated Results:<a,> = 0.069 <ail> [1/m] = 32.22 <<uI>> [m/s] = 3.920
<a2> = 0.505 <ai2> [1/m] =0.29 <<Ug>> [m/s] = 3.653
<ar> = 0.574 <aiT> [1/m] = 32.50 <<ug>> [m/s] = 3.908
< ><< Ug >>1 2< jg, I,o> 2559 "-4

108
1.0
0.5
1 0.0
-0.5
-1.0
o AD0 a 0-0 60o - Ao A0
70 60-o AD-o AD-o AD.o AD
o &0o AD0 oo ADE0 oo
o oAD0D a 0 20
A 00
1.0
0.5
0.0
-0.5
-1.0
aaaaaQ
aa
a
aCD
a
0a
a
a o ail
a ai2
0 aiT
0.0 0.2 0.4 0.6Void fraction, a
(a)
0.8 1.0 0 50 100 150Interfacial area concentration, ai [1/m]
(b)
200
1.0
0.5
;0.0
-0.5
-1.0
0
OAo A
o A0 Ato
A 0i I I I i I I I -
A00
00
000
0 2 4 6 8 10Bubble velocity, ug [m/s]
(c)
Figure 3.2.14.2 Profiles of local two-phase flow parameters for Run 14 acquired along the vertical radius of the tube at
measurement port 4 (P4). (a) void fraction, (b) interfacial area concentration and (c) bubble velocity.

109
3.2.15 Summary of results for Run 15.

Table 3.2.15.1 Local two-phase flow parameters for Run 15 acquired along the vertical axis at measurement port 1 (P1)
Run 15: jg,am= 3.812 [m/s] &jf= 2.202 [m/s]
Measurement Location: L/D = 197 (Port 1)
Test Conditions: Sampling frequency: Measurement Time:Qg [acfm] 4.390 Pback [psig] = 39.5 jgjlo [mi/s] =3.038 f., [ l/s] = 10,000 AT, [s] = 10Qf [gpm] 69.50 P1oc [psig] = 3.9 jf [m/s] = 2.207 f,2 [ l/s] = 10,000 AT 2 [s] 10
r/R fbl [1/si fb2 [1/sI ul a2 aT a. [1/61] a / [1/m] aiT [1/m] ugl [m/s] ug2 [m/s] D., [mmn D.2 [mrm]
0.9054 36.4 2.7 0.045 0.640 0.685 20.99 0.00 20.99 4.446 0.000 13.00.8175 34.5 2.4 0.043 0.674 0.717 18.49 1.52 20.01 5.256 5.279 14.1 2659.30.7296 33.8 2.5 0.039 0.674 0.713 17.41 1.59 19.00 5.515 8.256 13.4 2543.00.6417 36.8 2.6 0.044 0.677 0.722 18.63 1.43 20.06 5.541 8.383 14.3 2841.80.5539 37.4 2.6 0.044 0.667 0.711 18.69 1.15 19.84 5.519 6.984 14.2 3480.00.4660 36.4 2.7 0.044 0.661 0.705 18.68 1.09 19.77 5.619 7.889 14.2 3637.40.3781 35.5 2.7 0.044 0.661 0.705 18.25 1.04 19.29 5.638 7.997 14.5 3814.00.2903 37.2 2.8 0.048 0.652 0.700 19.12 1.17 20.29 5.687 8.605 15.1 3344.60.2024 38.0 3.1 0.049 0.633 0.682 19.19 0.77 19.96 5.622 5.929 15.4 4933.2
0.1145 45.4 2.9 0.063 0.618 0.682 24.14 0.38 24.52 5.598 3.557 15.7 9762.60.0266 46.7 3.2 0.066 0.584 0.650 24.57 0.00 24.57 5.613 0.000 16.1-0.0612 60.7 3.3 0.086 0.499 0.586 32.95 0.41 33.36 5.521 3.399 15.7 7308.3-0.1491 80.3 2.9 0.121 0.378 0.499 46.89 0.15 47.04 4.789 1.683 15.5 15100.0-0.2370 106.8 2.4 0.167 0.221 0.388 66.14 0.00 66.14 4.439 0.000 15.1-0.3249 146.6 0.6 0.226 0.045 0.271 98.78 0.00 98.78 4.006 0.000 13.7-0.4127 143.3 0.0 0.195 0.003 0.197 95.70 0.00 95.70 3.888 0.000 12.2-0.5006 71.5 0.0 0.080 0.000 0.080 45.40 0.00 45.40 3.810 0.000 10.6-0.5885 0.0 0.0 0.000 0.000 0U000 0.00 0.00 0.00 0.000 0.000-0.6763 0.0 0.0 0.000 0.000 0.000 0.00 0.00 0.00 0.000 0.000-0.7642 0.0 0.0 0.000 0.000 0.000 0.00 0.00 0.00 0.000 0.000
Calculated Results:<a,> = 0.074 <ail> [1/mi =31.50 <<ugl>> [m/s] = 4.587
<a2> = 0.412 <ai2> [1/mi =0.52 <<ug2>> [m/s] = 5.307
<aT> = 0.487 <ai-> [1/m] = 32.02 <<u»>> [m/s] = 5.529
C

111
1.0
0.5
•0.0
-0.6
o I-0o6o a 00 a 0
A 0 00
0 0
0~ a 0
0 a 0
00 &o Sr
1.0
CD
a a3i0.5
(M]
CDi
a
~0.0 G
aC
-0.5 a 0 aill
a ai2
0 aiT
-1.0
-0.5
-1.0
0.0 0.2 0.4 0.6Void fraction, a
(a)
1.0
0.5
1 0.0
-0.5
-1.0
0.8 1.0 0 20 40 60 80Interfacial area concentration, ai [1/m](b)
100
0 oAo A0 Ao A0 A0 a0 AOA
A 0i l I
A 0A .0
0000
0og
o g
0 2 4 6Bubble velocity, ug [rn/s]
(c)
8 10
Figure 3.2.15.1 Profiles of local two-phase flow parameters for Run 15 acquired along the vertical radius of the tube atmeasurement port 1 (P1). (a) void fraction, (b) interfacial area concentration and (c) bubble velocity.

Table 3.2.15.2 Local two-phase flow parameters for Run 15 acquired along the vertical axis at measurement port 4 (P4)Run 15: jg~atm= 3.812 [m/s] &jf= 2 .2 0 2 [m/s]Measurement Location: L/D = 329 (Port 4)
Test Conditions: Sampling frequency: Measurement Time:Qg [acfin] = 4.231 Pback [psig] = 40.1 j,,o0 [m/s] =2.993 fl [ Is] = 10,000 AT 1 [s] = 10Qf [gpm] = 69.10 P1oc [psig] = 3.7 jf [m/s] = 2.194 f2 [ I/s] = 10,000 AT 2 [s] = 10
r/R fbl [i/s] fb2 [1/si al a2 aT a.1 [1/m] a.2 [l/m] a1T [/iM] UgI [mi/S] Ug2 [m/s] D.m [mm] D.2 [mni]
0.9054 39.0 2.3 0.050 0.646 0.696 22.94 0.00 22.94 4.396 0.000 13.00.8175 33.3 2.4 0.038 0.681 0.720 17.81 0.48 18.29 5.207 2.802 12.9 8517.50.7296 33.8 2.4 0.039 0.677 0.716 17.47 0.42 17.89 5.500 3.102 13.4 9667.10.6417 34.4 2.3 0.038 0.676 0.714 17.67 1.01 18.68 5.557 7.540 12.9 4015.80.5539 34.9 2.4 0.039 0.682 0.721 17.79 0.91 18.70 5.579 6.597 13.1 4495.40.4660 34.5 2.6 0.039 0.693 0.732 17.71 0.98 18.69 5.690 7.380 13.3 4242.90.3781 35.1 2.5 0.040 0.672 0.712 17.91 0.94 18.85 5.708 7.851 13.3 4289.40.2903 33.7 2.4 0.039 0.670 0.709 13.89 0.96 14.85 6.218 8.492 16.8 4189.40.2024 33.2 3.0 0.039 0.655 0.694 10.87 0.80 11.67 6.701 9.509 21.5 4909.50.1145 35.4 2.8 0.044 0.639 0.683 14.94 0.64 15.58 6.215 6.294 17.6 5993.40.0266 43.9 2.7 0.057 0.591 0.649 23.38 0.30 23.68 5.734 2.928 14.7 11828.0-0.0612 51.1 3.1 0.069 0.527 0.596 27.45 0.25 27.70 5.523 2.662 15.0 12657.6-0.1491 57.9 2.8 0.078 0.464 0.541 31.57 0.00 31.57 5.550 0.000 14.7-0.2370 83.0 3.3 0.116 0.299 0.415 46.55 0.20 46.75 5.162 2.247 15.0 8961.0-0.3249 139.3 1.0 0.211 0.081 0.291 88.22 0.00 88.22 4.418 0.000 14.3-0.4127 181.8 0.0 0.279 0.001 0.280 125.72 0.00 125.72 3.914 0.000 13.3-0.5006 134.2 0.0 0.167 0.000 0.167 87.18 0.00 87.18 3.852 0.000 11.5-0.5885 38.1 0.0 0.038 0.000 0.038 22.66 0.00 22.66 3.120 0.000 10.0-0.6763 0.0 0.0 0.000 0.000 0.000 0.00 0.00 0.00 0.000 0.000-0.7642 0.0 0.0 0.000 0.000 0.000 0.00 0.00 0.00 0.000 0.000
Calculated Results:<a,> = 0.072 .<ail> [1/m] =31.26 <<Ugl>> [mis] = 4.677
<a 2> = 0.433 <ai2> [1/m] = 0.40 <<ug2>> [m/s] = 5.013
<ar> = 0.506 <ai-> [l/m] =31.66 <<ug>> [m/s] = 5.268
<aT><<«Ug>>_ 1 -)
"- Jg910 c ,- I

113
1.0o A l-Io ADlo AD
-o A00.5 -o ADO
-0 a00 60
0.0 0a_0 A0-0 AD
-0 A0> 0 A 0
A- 000 0 70
-0.5 0 ocil0 0
0~ a 0
0 0T2
-1.0
-1.0
1.0
0.5
>0.0t-
Q
o) 0 ailai2
0 aiT
-0.5
-1.0
0.0 0.2 0.4 0.Void fraction,
(a)
1.0
0.5
•0.0
6,'a
0.8 1.0 0 30 60 90 120Interfacial area concentration, ai [1/m]
(b)
150
0A 0
A 00 A0 A0 A0 A
0 A0 A01
', 4 I , 0A 0
0A 0
0000oug-0.5
-1.0
0 2 4 6Bubble velocity, Ug [m/s]
(c)
8 10
Figure 3.2.15.2 Profiles of local two-phase flow parameters for Run 15 acquired along the vertical radius of the tube atmeasurement port 4 (P4). (a) void fraction, (b) interfacial area concentration and (c) bubble velocity.