Embed Size (px)
Citation preview
1
Title: Observation of incretin effects during enteral feed transitions of critically ill 1
patients 2
3
Authors: Ummu K. Jamaludina, Paul D. Dochertya, J.Geoffrey Chasea, Aaron Le Comptea, 4
Geoffrey M. Shawb, Thomas Desaivec, Jean-Charles Preiserd 5
a Department of Mechanical Engineering, Centre of Bioengineering, University of 6
Canterbury, Christchurch, New Zealand 7
b Department of Intensive Care, Christchurch Hospital, Christchurch School of Medicine, 8
University of Otago, Christchurch, New Zealand 9
c Cardiovascular Research Centre, University of Liege, Liege, Belgium 10
d Department of Intensive Care, Erasme University Hospital, Brussels, Belgium 11
12
List of Abbreviations: 13
• ICU = Intensive Care Unit 14
• SPRINT = Specialised Relative Insulin and Nutrition Titration 15
• TGC = Tight Glycaemic Control 16
• SI = Insulin sensitivity metric (model-based) 17
• ΔSI% = 3 hours median percentage changes in insulin sensitivity 18
• IQR = Interquartile range 19
• APACHE = Acute Physiology And Chronic Health Evaluation 20
• EN = Enteral nutrition 21
• PN = Parenteral nutrition 22
2
23
Address for correspondence: Ummu K. Jamaludin, Department of Mechanical 24
Engineering, University of Canterbury, Private Bag 4800, Christchurch, New Zealand; email 25
address [email protected] 26
27
Conference presentation: Jean-Charles Preiserd has presented for an oral presentation in 28
33rd ESPEN Congress Gothenburg, Sweden (3rd – 6th September 2011). 29
30
3
Abstract 31
Background & Aim: 32
Critically ill patients are regularly feed via constant enteral (EN) nutrition infusions. 33
However, the incretin effect or its impact on endogenous insulin concentration remains 34
unclear. This study determines whether there is an EN-driven incretin effect in critically ill 35
patients requiring glycaemic control. 36
Methods: 37
Clinically validated, model-based time-variant insulin sensitivity (SI) profiles were identified 38
for 52 non-diabetic patients on Specialized Relative Insulin Nutrition Titration (SPRINT) 39
glycemic control during transitions off EN (ON/OFF), and back on to EN (OFF/ON). Incretin 40
effects were observable via increased modelled SI after the OFF/ON transition or a decreased 41
SI after the ON/OFF transition. 42
Results: 43
Patients exhibited a median -36% (IQR -82% to 24% p=0.001) reduction after the ON/OFF 44
feed transition, and a median of +32% (IQR -5% to 53%, p=0.05) rise in measured SI after 45
the OFF/ON transition. However, 32% of patients exhibited increased SI at the OFF/ON 46
transition, and 37% exhibited reduced SI at the ON/OFF transition. The results are likely due 47
to changes in patient condition over the 5-8 hours considered outweighing this effect. Blood 48
glucose was the same during both transitions with median shifts of -2% and -3% after the 49
ON/OFF, and OFF/ON transitions (p>0.5), respectively. 50
Conclusions: 51
4
Results imply a significant incretin effect is observed at a cohort level. The impact was 52
stronger for the OFF/ON transition indicating that this effect may be blunted by long-term 53
continuous EN infusions. These results provide the data to design conclusive studies, and to 54
inform glycemic control protocol development and implementation. 55
56
Keywords: incretin effect, enteral nutrition, insulin sensitivity, Specialized Relative Insulin 57
Nutrition Titration, tight glycemic control, enteral feed transition 58
59
5
1. Introduction 60
61
Critically ill patients exhibit increased gluconeogenesis, reduced insulin secretion and 62
increased insulin resistance, resulting in hyperglycemia, increased complications and 63
increased risk of death.1-‐2 Studies show that glycemic control can reverse these outcomes.2-3 64
However, intensive insulin therapy can also lead to increased hypoglycaemia and mortality.4-5 65
Variable patient-specific levels of endogenous insulin secretion may also play a role, 66
particularly in early, acute phases of care.5 In addition, the route used for the provision of 67
nutrition can also influence the effect of intensive insulin therapy on outcome. A recent meta-68
analysis6 demonstrated that intensive insulin therapy was not associated with an improved 69
outcome when enteral nutrition was used as the predominant source of calories. This finding 70
is consistent with the presence of an incretin effect, i.e. the stimulation of endogenous insulin 71
by enteral feeding. 72
73
The incretin effect plays an important role in regulation of glucose metabolism in healthy 74
subjects.7 Incretin enhances the postprandial appearance of insulin. The underlying 75
mechanisms involve the release of the hormones glucose-dependent insulinotropic 76
polypeptide (GIP) and glucagon-like peptide-1 (GLP-1), which are released from the 77
intestinal mucosa when glucose is ingested. As a result insulin secretion is enhanced in 78
excess of what would have been released if the glucose were administered parenterally.8 79
Studies have shown that the incretin effect can enhance the insulin response to oral glucose 80
by 50-70% in comparison to an equivalent IV dose. 9-10 81
82

6
Although many incretin effect studies have addressed the distinct physiology of diabetic and 83
non-diabetic individuals,9 the incretin effect remains to be observed in a critically ill cohort. 84
85
Critically ill patients are fed differently, typically relying on constant enteral (EN) infusions. 86
Hence, it is possible that there is no incretin effect in these patients, who otherwise display 87
significantly enhanced endogenous insulin secretion.11 Equally, their highly counter-regulated 88
state and wide range of insulin secretion rate1 may result in a blunting of this responses as 89
seen similarly in individuals with type 2 diabetes.9 90
91
This study uses dense clinical data and a model-based analysis to observe the incretin effect 92
via tracking the model-based insulin sensitivity (SI) in a cohort of critically ill patients. 93
Specifically, we hypothesized that model-based SI would fall during interruptions of EN and 94
would rise when EN is re-started. These changes in SI would support the presence of an EN-95
related incretin effect in the population of non-diabetic critically ill patients studied. 96
97
2. Methods 98
2.1. Patient cohort 99
100
The data used in this paper was obtained from the Specialized Relative Insulin Nutrition 101
Titration (SPRINT) study.12 Blood glucose concentration (BG) and enteral (EN) nutrition 102
data from 371 critically ill patients on SPRINT study are used. These 371 patients were 103
undergoing SPRINT tight glycaemic control (TGC), with 97% of patients had 50% or more 104
7
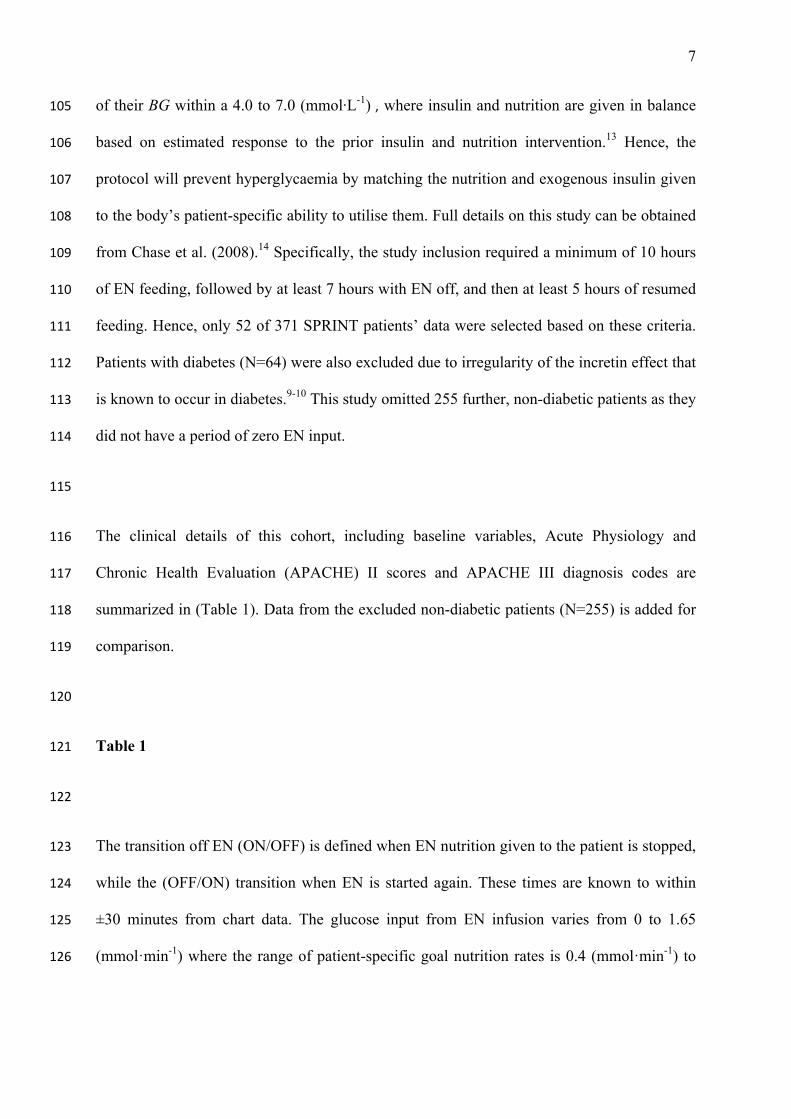
of their BG within a 4.0 to 7.0 (mmol·L-1) , where insulin and nutrition are given in balance 105
based on estimated response to the prior insulin and nutrition intervention.13 Hence, the 106
protocol will prevent hyperglycaemia by matching the nutrition and exogenous insulin given 107
to the body’s patient-specific ability to utilise them. Full details on this study can be obtained 108
from Chase et al. (2008).14 Specifically, the study inclusion required a minimum of 10 hours 109
of EN feeding, followed by at least 7 hours with EN off, and then at least 5 hours of resumed 110
feeding. Hence, only 52 of 371 SPRINT patients’ data were selected based on these criteria. 111
Patients with diabetes (N=64) were also excluded due to irregularity of the incretin effect that 112
is known to occur in diabetes.9-10 This study omitted 255 further, non-diabetic patients as they 113
did not have a period of zero EN input. 114
115
The clinical details of this cohort, including baseline variables, Acute Physiology and 116
Chronic Health Evaluation (APACHE) II scores and APACHE III diagnosis codes are 117
summarized in (Table 1). Data from the excluded non-diabetic patients (N=255) is added for 118
comparison. 119
120
Table 1 121
122
The transition off EN (ON/OFF) is defined when EN nutrition given to the patient is stopped, 123
while the (OFF/ON) transition when EN is started again. These times are known to within 124
±30 minutes from chart data. The glucose input from EN infusion varies from 0 to 1.65 125
(mmol·min-1) where the range of patient-specific goal nutrition rates is 0.4 (mmol·min-1) to 126
8
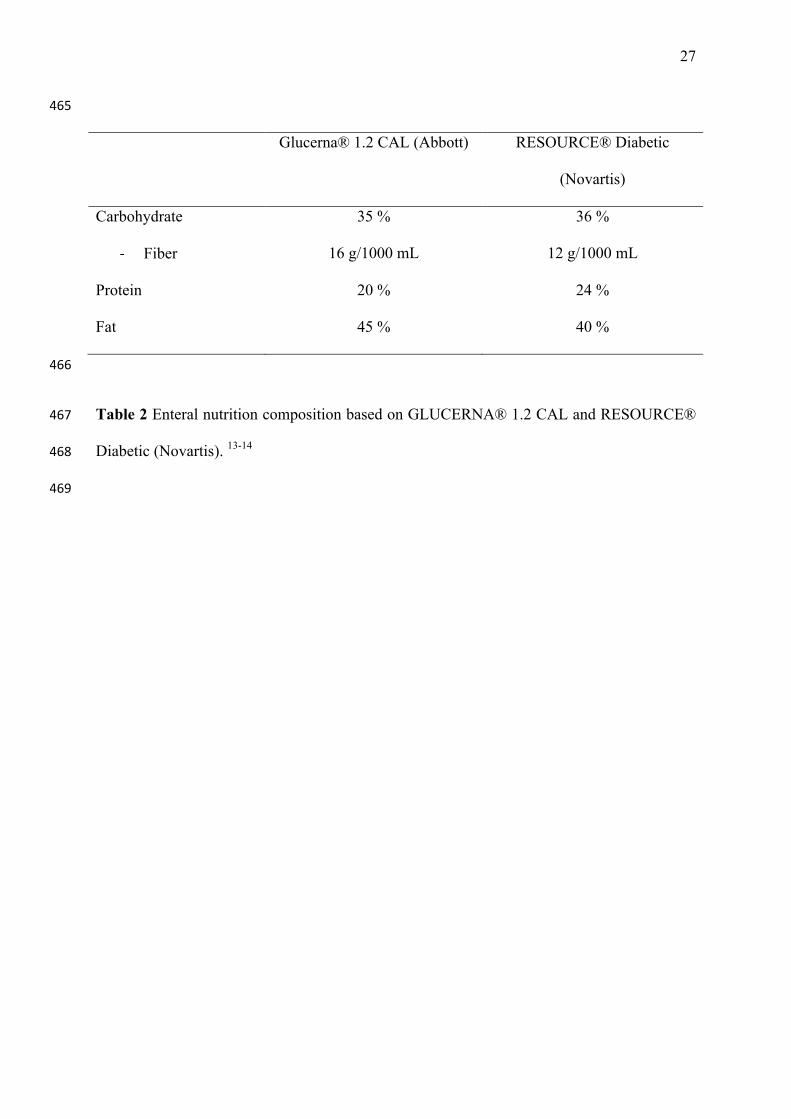
0.8 (mmol·min-1).12 The compositions of EN were either from Glucerna® 1.2 CAL (Abbott)15 127
or RESOURCE® Diabetic (Novartis)16. The nutritional compositions are given in (Table 2). 128
129
Table 2 130
131
2.2. Identification of Model-Based SI 132
133
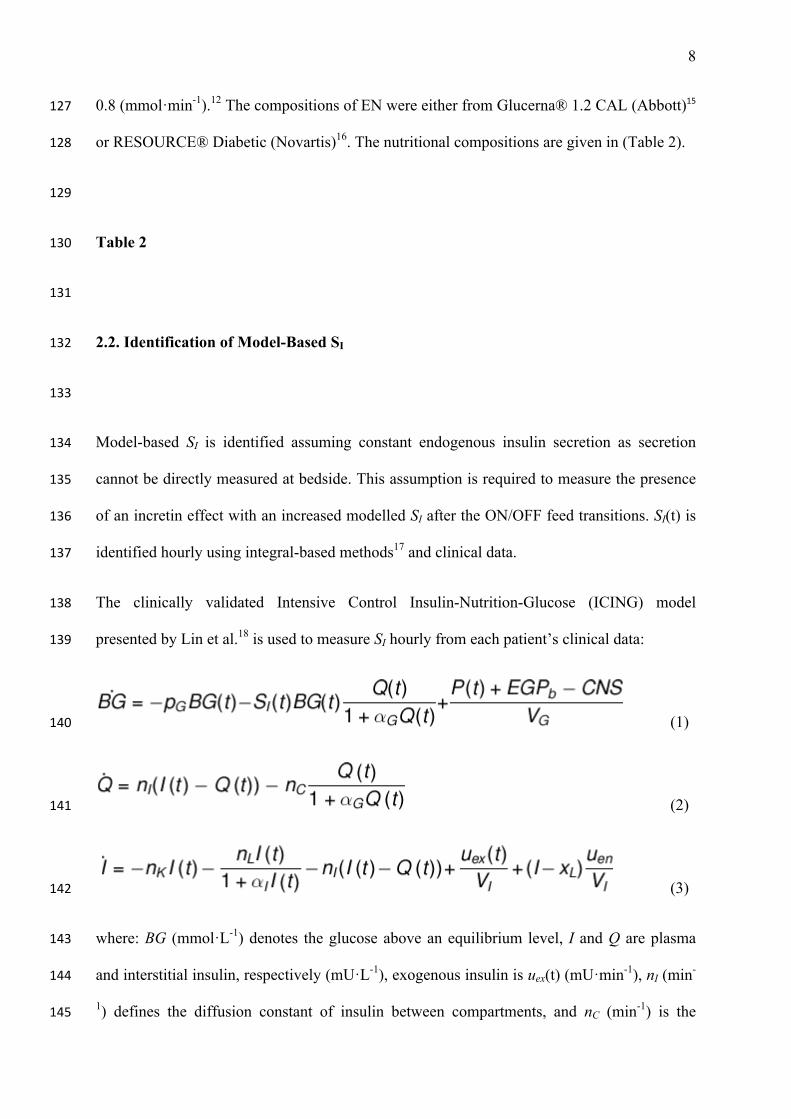
Model-based SI is identified assuming constant endogenous insulin secretion as secretion 134
cannot be directly measured at bedside. This assumption is required to measure the presence 135
of an incretin effect with an increased modelled SI after the ON/OFF feed transitions. SI(t) is 136
identified hourly using integral-based methods17 and clinical data. 137
The clinically validated Intensive Control Insulin-Nutrition-Glucose (ICING) model 138
presented by Lin et al.18 is used to measure SI hourly from each patient’s clinical data: 139
(1) 140
(2) 141
(3) 142
where: BG (mmol·L-1) denotes the glucose above an equilibrium level, I and Q are plasma 143
and interstitial insulin, respectively (mU·L-1), exogenous insulin is uex(t) (mU·min-1), nI (min-144
1) defines the diffusion constant of insulin between compartments, and nC (min-1) is the 145

9
cellular insulin clearance rate from interstitium. Patient endogenous glucose removal and 146
insulin sensitivity are pG (min-1) and SI (L·mU-1·min-1), respectively, glucose and insulin 147
distribution volume are VG (L) and VI (L), Michaelis-Menten functions are used to portray 148
saturations, with αI (L·mU-1) dictating the saturation of plasma insulin clearance, and αG 149
(L·mU-1) for saturation of insulin-mediated glucose removal, nK (min-1) and nL (min-1) are the 150
renal and hepatic insulin clearance rates, respectively, xL is the first pass hepatic clearance 151
ratio19, while uen is the endogenous insulin production (1000 mU·min-1). 152
Enteral nutrition (EN), P(t) is defined with Equations 4-6: 153
(4) 154
(5) 155
(6) 156
157
where: P1 and P2 (mmol) represent the glucose in the stomach and gut, respectively, P(t) is 158
the glucose appearance in plasma (mmol·min-1) from enteral nutrition. The parameters d1 and 159
d2 are used to describe the rate of glucose transport through the enteral route into the 160
bloodstream. These parameters are assumed constant across the cohort (d1 = 0.0347 min-1 and 161
d2 = 0.0069 min-1),18 whereas both parameters can vary significantly between individuals, 162
potentially affecting description of transient changes in plasma glucose appearance after 163
changes in EN feeding, and thus the modelling of SI. The rate of transport from P2 is limited 164
to the maximal gut glucose flux (Pmax = 6.11 mmol·min-1), and also D(t) represents the 165
glucose input from EN infusion (mmol·min-1). 166
167
10
This model has been clinically validated with median prediction error less than 4-5%18 and is 168
currently used in several clinical glycaemic control trials.20-21 169
170
2.3. Data Analysis 171
172
A reduction in observed SI after the ON/OFF transition implies an un-modelled decrease in 173
the rate of endogenous insulin production due to incretin effects. In contrast, an increase in 174
observed SI implies an incretin effect at the OFF/ON transition. The SI change (ΔSI) across 175
the ON/OFF and OFF/ON transitions indicates an incretin effect for this cohort. ΔSI was 176
calculated as: 177
(7) 178
The blood glucose changes, ΔBG were also calculated similar to the ΔSI. 179
180
The analysis uses a 3-hour moving average to reduce the effect of measurement error, noise, 181
and the influence of transient effects caused by the cohort-constant assumption of these 182
model terms. SI profiles are derived over periods starting 3 hours before a transition until 5 183
hours after the transition. The 5-hour limit allows full gut emptying after ON/OFF transition 184
or full resumes of the effect EN after the OFF/ON transition. Between these times, an incretin 185
effect would show a steady biased shift in SI, if it exists. Results are illustrated via Bland – 186
Altman plots, while Wilcoxon rank sum tests are used to compare distributions and the 187
significance of any shift in SI(t) over the cohort. 188
189
11
3. Results 190
191
Measured glucose data, EN model input data as well as ICING model fits of BG, I, Q, SI and 192
P are shown in (Fig. 1) for a typical case. The incretin effect is observed directly via insulin 193
sensitivity changes (ΔSI) at ON/OFF and OFF/ON transitions. 194
195
Fig. 1. 196
197
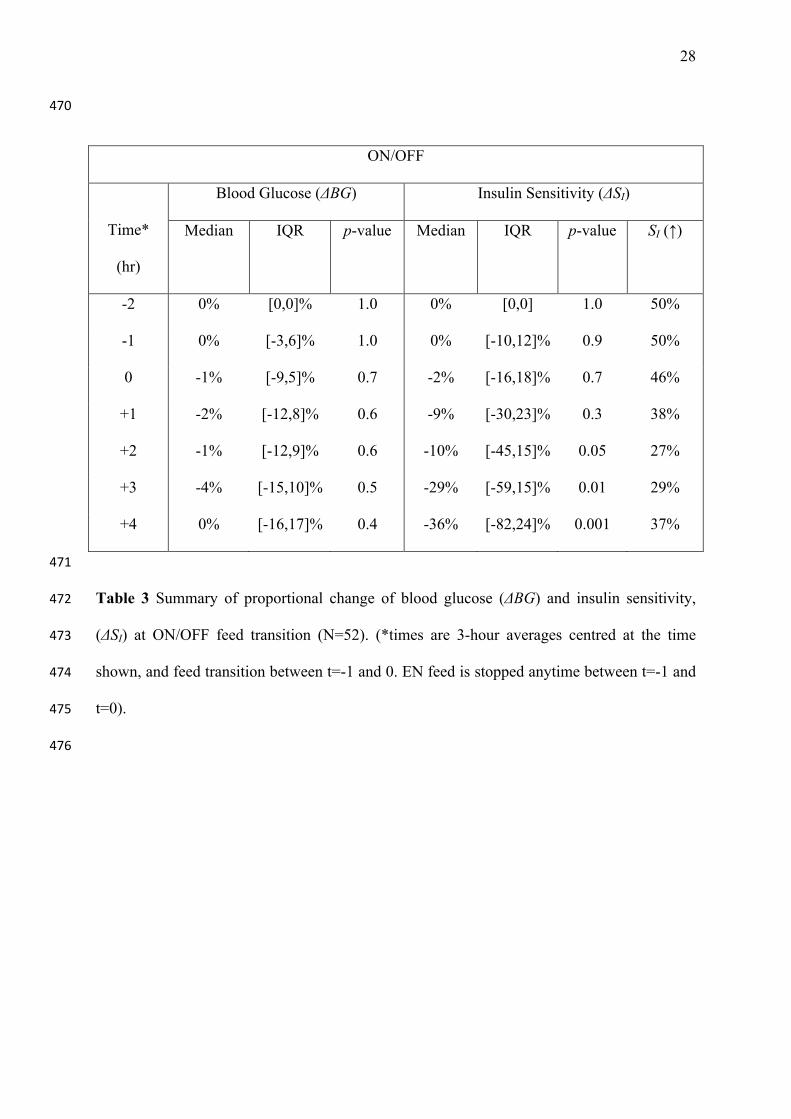
(Table 3) summarises ΔSI at the ON/OFF transition across the cohort. SI decreased after the 198
ON/OFF transition until t=+4 hours, where it settled to a median reduction of -36%. The 199
right-most column shows the number of confounders (ΔSI>0). This implies that inter-patient 200
or intra-patient variation obscures the observation or that the effect itself it is not always 201
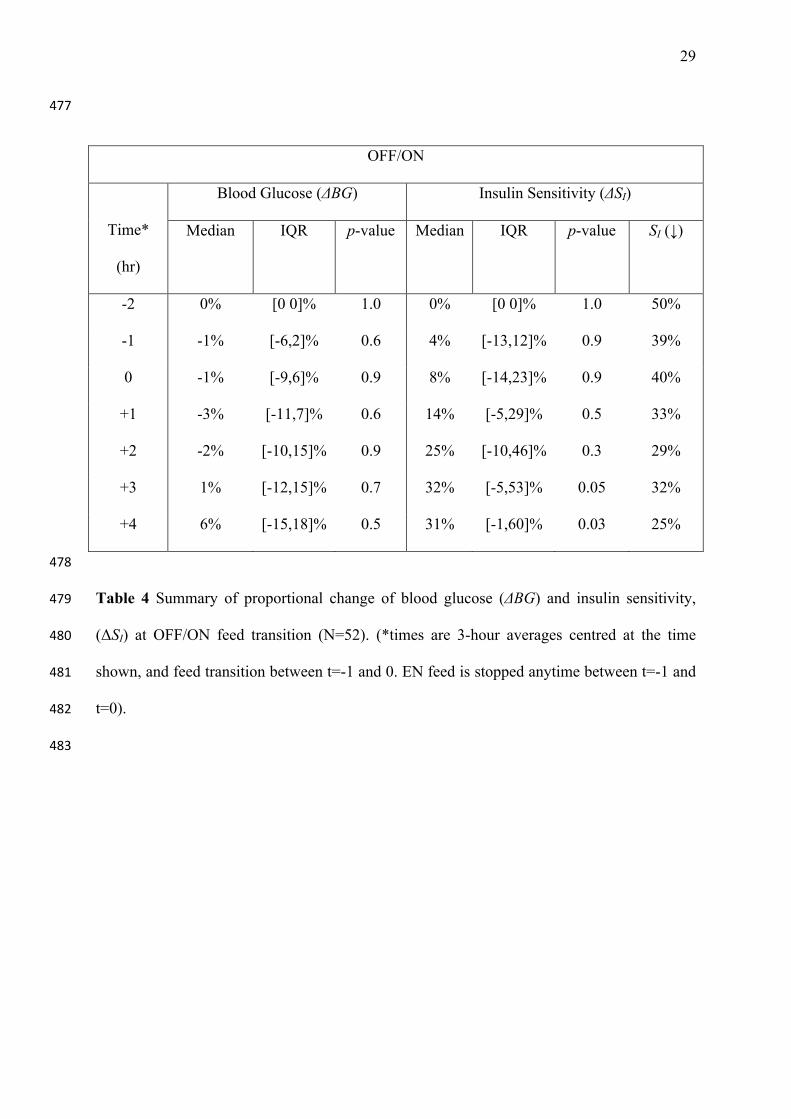
observable. ΔSI data after the OFF/ON transition are shown in (Table 4). Median ΔSI 202
increased by +32% (IQR -1 to 60%) at t=+3 hours after the OFF/ON feed transition. The 203
number of confounders was slightly lower after the OFF/ON feed transition. In both cases, 204
BG remains effectively constant with only small changes. Hence, the impact of the incretion 205
effect on glycaemia was quickly accounted for by the SPRINT glycaemic control protocol. 206
207
Table 3 208
209
Table 4 210
211
12
SI correlations over the ON/OFF (r=0.49, median=-36%, p=0.0001) and OFF/ON (r=0.60, 212
median=+31%, p=0.03) transitions for t=+4 hours are shown in (Fig. 2). The changes in 213
(Table 3–4) are evidenced by the bias about the equality line. (Fig. 2) shows the diversity of 214
ΔSI across both transitions. 215
216
Fig. 2. 217
218
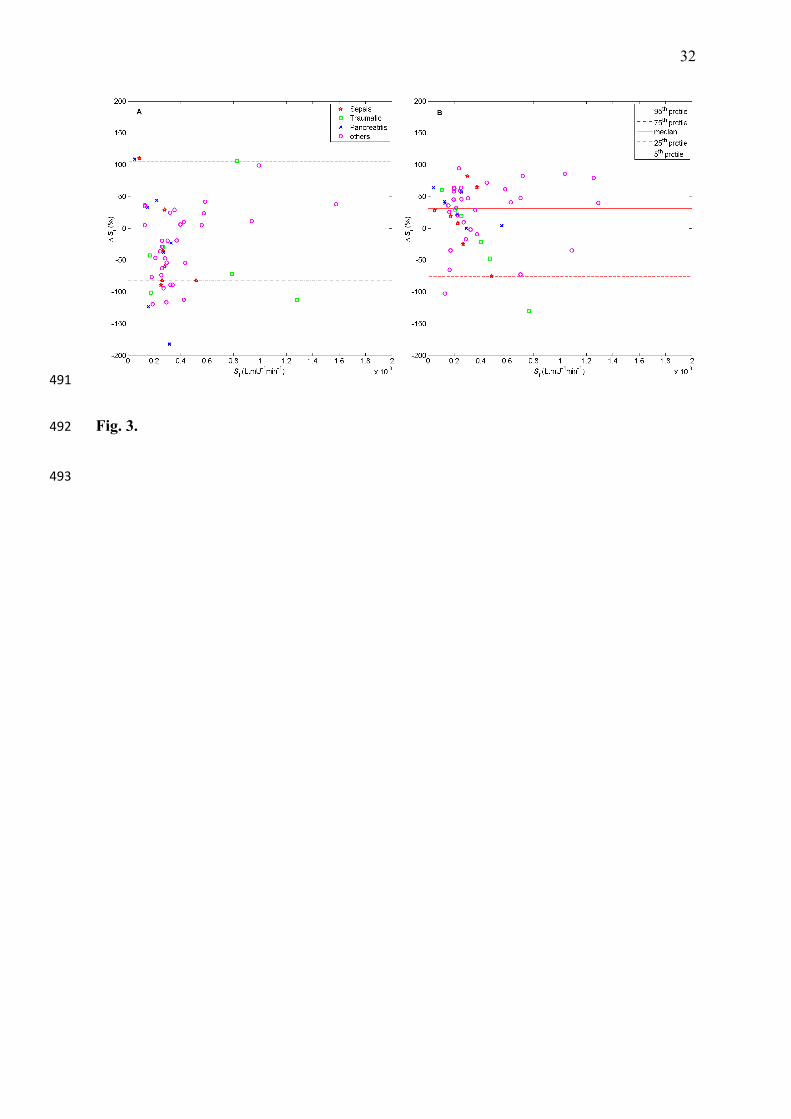
Fig. 3. 219
220
Bland-Altman representations of the ΔSI changes between t=-2 and t=+4 hours are shown in 221
(Fig. 3). Only 3 patients clearly showed high ΔSI measurements (>100%). These patients 222
were diagnosed with either sepsis or pancreatitis. Both conditions significantly affect 223
endogenous insulin secretion independently. Most changes show a clear shift with relatively 224
consistent behaviours. 225
226
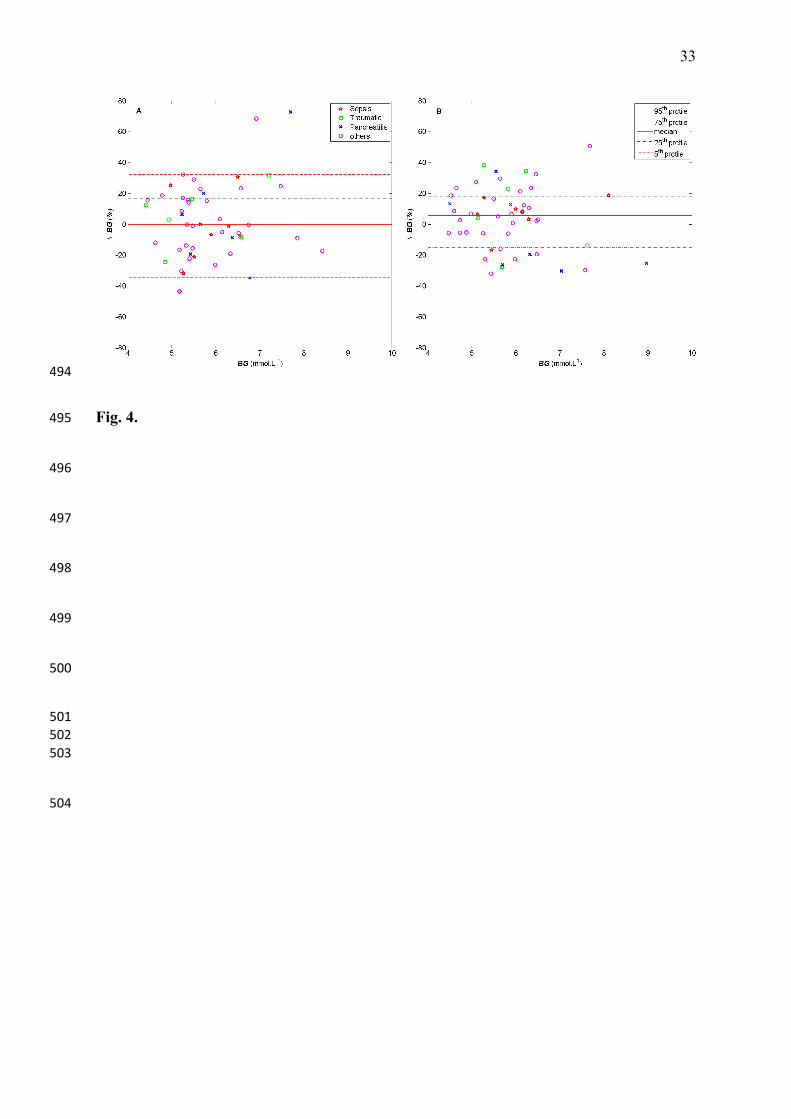
Fig. 4. 227
228
Bland-Altman representations the shifts in BG after the ON/OFF and OFF/ON transitions 229
between t= -2 and t=+4 hour’s are shown in (Fig. 4). The maximal median BG shift across the 230
cohort was -4% at the ON/OFF transition and +6% at the OFF/ON transition when t=+3 and 231
t=+4 respectively. Median difference between these two transitions was approximately -1% 232
at t=-1, +1, and +2 indicating tight consistent glucose levels across the cohort. The few 233
13
patients outside the 90% confidence interval (CI) were identified as having pancreatitis or 234
similar diseases that significantly affect insulin secretion and thus, this analysis. 235
236
4. Discussion 237
238
This study showed the potential existence of an incretin effect after EN transitions (ON/OFF 239
and OFF/ON) in a cohort with similar controlled BG levels. The incretin effect was observed 240
via changes in model-based SI after transitions onto and off EN feed. This effect has been 241
previously observed using different techniques in various, non-critically ill cohorts.22 In this 242
study, a slightly stronger incretin effect is observed at OFF/ON EN feed transition. 243
244
The changes in plasma insulin via insulin secretion and activation by the liver were assumed 245
to be observable through changes in measured SI.18 The variability observed was outside the 246
normal variation, which is centred around zero.23 Thus, the incretin effect was measured 247
using the shift in SI after EN feed transitions as a surrogate rather than direct insulin 248
measurement. Nauck et al.10 found that C-peptide responses after oral and intravenous 249
glucose were less marked than between insulin responses. This implies that a considerable 250
part of the different insulin responses to oral and intravenous glucose may be due to altered 251
hepatic insulin extraction.24 Thus, it could be concluded that insulin sensitivity changes are 252
more efficient indicator for post-hepatic endogenous insulin appearance,10 given the two 253
possible outcome causes noted. A further study to confirm these findings could be verified 254
with added insulin and/or C-peptide data. 255
256
14
ΔBG changes were insignificant over these transitions indicating there was no bias to this 257
factor in the model-based analysis. Equally, this model and SI metric have been clinically 258
validated on independent matched cohorts,13 in several clinical TGC studies,12 and against the 259
gold-standard euglycaemic clamp.25 260
261
The insulin response to EN glucose was noticeably enhanced after the OFF/ON transition, 262
most likely as a result of the concomitant actions of incretins and neural responses to enteral 263
nutrition. The predominant effect of incretin hormones is to enhance the endogenous insulin 264
secretion that is triggered when the β-cells are exposed to rapid increases in glucose flux.24 At 265
a cohort level, ΔSI stabilised at t=+4 hours after EN transitions as the feed was designed for 266
enhanced glycaemic stability via slow digestion.15-16 Hence, both transitions should have 267
excited a change, but the OFF/ON transition may have observed better or more rapid change 268
due to the essentially fasted patient state. 269
270
The Bland-Altman plots of ΔSI (Fig. 3) show that the few larger outliers were diagnosed with 271
chronic diseases that influence the pharmaco-dynamics of insulin and glucose. Patients with 272
sepsis, trauma or pancreatitis can exhibit more drastic SI changes26 due to excessive counter-273
regulatory and acute immune response, as well as the direct affect on secretion with 274
pancreatitis. Hence, the variability of results was reasonably expected, where the analysis 275
without these 3-5 subjects did not change the overall results. Also, studies show that many 276
metabolic abnormalities associated with stress, injury or infections were related to a loss of 277
tissue sensitivity to insulin.26 Sepsis, trauma and other clinical states are characterized by a 278
strong counter-regulatory hormone response. These hormone responses are believed to 279
induce insulin resistance in vivo, although some clinical studies failed to demonstrate 280

15
correlations between the counter-regulatory hormone response and defective insulin-mediated 281
glucose disposal.27 However, the overall evidence is still inconclusive concerning the exact 282
cellular and molecular mechanisms underlying insulin resistance in critical illness and their 283
relationship to the observed metabolic abnormalities.27 284
285
Specifically, this analysis consists of a group selected from a general ICU cohort (see Table 1 286
with a representative mixture of typical ICU diagnostic codes) who met the criteria that 287
would enable the incretin effect to be observed in this study if the effect existed. It is not 288
designed, as a trial to guarantee representation of any specific ICU cohort in particular. 289
However, as seen in Table 1 the groups are similar in age and severity of illness compare to 290
the remaining (non-diabetic) SPRINT cohort from which these 52 were extracted. The 291
diagnostic groupings are less similar but still broadly represent a medical ICU cohort. Hence, 292
the cohort analysed were not different from the overall SPRINT cohort or a typical medical 293
ICU cohort, except in that they had nutritional stoppages for clinical reasons that enabled this 294
study. Thus, these results justify a more direct clinical validation trial with measurement of 295
insulin, C-peptide and incretin hormones during enteral and parenteral feed transitions. This 296
may provide direct evidence of the incretin effect observed in this study and also provide 297
enough data to allow generalisation of the result for broader cohorts. These results are 298
sufficient to justify and define the needed cohort size to power such a validation trial. . 299
300
It is generally accepted that intravenous parenteral nutrition (PN) prompts a lesser 301
endogenous insulin secretion than EN nutrition,9 and thus may limit the incidence of 302
hypoglycaemia due to un-modelled insulin secretion. Plasma insulin responses to glucose 303
given by gastric or jejunal intubation were significantly greater than those seen after IV 304

16
infusion of the same glucose load in some studies.8 Likewise, Petrov et al.28 reported a higher 305
prevalence of hyperglycemia during parenteral than enteral nutrition. Hence, if the risk of 306
hypoglycaemia could be mitigated via advanced modelling methodology, the potential 307
benefits of the incretin effect could aid patient recovery. In addition, enteral nutrition is also 308
associated with a significantly lower incidence of infection, sepsis and bacterial translocation 309
that may reduce the need for surgical interventions to control pancreatitis and a reduced 310
length of hospital stay.29 311
312
This study examined changes in SI about EN feeding transitions. Limited PN data (N<6) 313
somewhat limited observation of the incretin effect with EN according to its most commonly 314
used definition in comparison to PN.30 In this study, the SPRINT glycaemic control protocol 315
also modulates enteral dextrose carbohydrate to aid control of hyperglycaemia, rather than 316
the characterising the overall nutritional profile. Hence, a cross-over analysis with PN was 317
not possible. A study conducted by Van den berghe et al.31 found that a high glucose loading, 318
via PN, with inadequate glycemic control is associated with increased morbidity and 319
mortality rates. Thus, an ideal study design for the observation of incretin in critically ill 320
patients that also used PN feeding in a cross-over format might have ethical limitations. In 321
contrast, future studies could incorporate direct measurement of incretin hormones, such as 322
GIP and GLP-1.9 This approach would also allow direct incorporation and identification of 323
additional incretin hormone-related model parameters, as well as direct measurement of the 324
effect without relying on PN analysis. 325
326
5. Conclusions 327
17
328
Overall, the findings of this study show the distinct existence of an incretin effect as an 329
observable aspect of critically ill patient physiology. The findings were consistent with the 330
presence of an EN-related incretin effect in a majority of critically ill patients. Clinically, the 331
existence of this effect at EN nutrition transitions should also be considered in the 332
management of glycaemia and could influence design of this therapy. Finally, while the 333
results observed valid surrogates of the incretin effect, a prospective study with direct 334
measurement and powered by these results may be required to confirm the outcomes directly. 335
336

18
Conflict of Interest: 337
The authors declare that they have no competing interests. 338
339
19
Statement of Authorship: 340
All authors have made substantial contributions and final approval of the conceptions, 341
drafting, and final version of the manuscript. 342
343

20
Acknowledgments: 344
Financial support provided by: 345
Ummu Jamaludin: Malaysian Higher Education Department – under Universiti Malaysia 346
Pahang. 347
Aaron Le Compte: New Zealand Tertiary Education Commission and NZ Foundation for 348
Research Science and Technology Post-Doctoral Fellowship Grant 349
350
21
References 351
1. Capes S E, Hunt D, Malmberg K, Gerstein H C. Stress hyperglycaemia and increased 352
risk of death after myocardial infarction in patients with and without diabetes: a 353
systematic overview. Lancet 2000; 355(9206):773-778. 354
2. Van den Berghe G, Wouters P, Weekers F, Verwaest C, Bruyninckx F, Schetz M, 355
Vlasselaers D, Ferdinande P, Lauwers P, Bouillon R. Intensive insulin therapy in the 356
critically ill patients. N Engl J Med 2001; 345(19):1359-1367. 357
3. Krinsley J S. Effect of an intensive glucose management protocol on the mortality of 358
critically ill adult patients. Mayo Clin Proc 2004; 79(8):992-1000. 359
4. Chase J G, Le Compte A J, Suhaimi F, Shaw G M, Lynn A, Lin J, Pretty C G, Razak 360
N, Parente J D, Hann C E et al. Tight glycemic control in critical care - The leading 361
role of insulin sensitivity and patient variability: A review and model-based analysis. 362
Comput Methods Programs Biomed 2011; 102(2):156-171. 363
5. Bagshaw S M, Bellomo R, Jacka M J, Egi M, Hart G K, George C. The impact of 364
early hypoglycemia and blood glucose variability on outcome in critical illness. Crit 365
Care 2009; 13(3):R91. 366
6. Marik P E, Preiser J-C. Toward Understanding Tight Glycemic Control in the ICU. 367
Chest 2010; 137(3):544-551. 368
7. Schirra J, Katschinski M, Weidmann C, Schäfer T, Wank U, Arnold R, Göke B. 369
Gastric emptying and release of incretin hormones after glucose ingestion in humans. 370
The Journal of Clinical Investigation 1996; 97(1):92-103. 371
8. McIntyre N, Holdsworth C D, Turner D S. Intestinal Factors in the Control of Insulin 372
Secretion. Journal of Clinical Endocrinology & Metabolism 1965; 25(10):1317-1324. 373
9. Muscelli E, Mari A, Casolaro A, Camastra S, Seghieri G, Gastaldelli A, Holst J J, 374
Ferrannini E. Separate Impact of Obesity and Glucose Tolerance on the Incretin 375
22
Effect in Normal Subjects and Type 2 Diabetic Patients. Diabetes 2008; 57(5):1340-376
1348. 377
10. Nauck M A, Homberger E, Siegel E G, Allen R C, Eaton R P, Ebert R, Creutzfeldt W. 378
Incretin Effects of Increasing Glucose Loads in Man Calculated from Venous Insulin 379
and C-Peptide Responses. Journal of Clinical Endocrinology & Metabolism 1986; 380
63(2):492-498. 381
11. Whyte M B, Jackson N C, Shojaee-Moradie F, Treacher D F, Beale R J, Jones R H, 382
Umpleby A M. Metabolic effects of intensive insulin therapy in critically ill patients. 383
American Journal of Physiology - Endocrinology And Metabolism 2010; 384
298(3):E697-E705. 385
12. Chase J G, Shaw G M, Lotz T, LeCompte A, Wong J, Lin J, Lonergan T, Willacy M, 386
Hann C E. Model-based insulin and nutrition administration for tight glycaemic 387
control in critical care. Curr Drug Deliv 2007; 4(4):283-296. 388
13. Chase J G, Pretty C, Pfeifer L, Shaw G, Preiser J-C, Le Compte A, Lin J, Hewett D, 389
Moorhead K, Desaive T. Organ failure and tight glycemic control in the SPRINT 390
study. Critical Care 2010; 14(4):R154. 391
14. Chase J G, Shaw G, Le Compte A, Lonergan T, Willacy M, Wong X-W, Lin J, Lotz 392
T, Lee D, Hann C. Implementation and evaluation of the SPRINT protocol for tight 393
glycaemic control in critically ill patients: a clinical practice change. Critical Care 394
2008; 12(2):R49. 395
15. Glucerna® 1.2 Cal nutrition information. Ohio, US: Abbott Nutrition, 2005. 396
(Accessed 08/11, 2011, at http://abbottnutrition.com/Products/glucerna-1_2-cal) 397
16. RESOURCE® Diabetic nutrition information. US: Nestle Nutrition, 2005. (Accessed 398
08/11, 2011, at 399
http://www.nutrition.nestle.ca/en/our_products/NUTRIHEP/resource_diabetic) 400

23
17. Hann C E, Chase J G, Lin J, Lotz T, Doran C V, Shaw G M. Integral-based parameter 401
identification for long-term dynamic verification of a glucose–insulin system model. 402
Computer Methods and Programs in Biomedicine 2005; 77(3):259-270. 403
18. Lin J, Razak N N, Pretty C G, Le Compte A, Docherty P, Parente J D, Shaw G M, 404
Hann C E, Geoffrey Chase J. A physiological Intensive Control Insulin-Nutrition-405
Glucose (ICING) model validated in critically ill patients. Comput Methods Programs 406
Biomed 2011; 102(2):192-205. 407
19. Lotz T, Chase J G, Lin J, Wong X W, Hann C E, McAuley K A, Andreassen S. 408
Integral-Based Identification of a Physiological Insulin and Glucose Model on 409
Euglycaemic Clamp Trials. In: 14th IFAC Symposium on System Identification 410
(SYSID 2006): March 29-31; Newcastle, Australia: IFAC; 2006. 411
20. Le Compte A, Chase J G, Lynn A, Hann C E, Shaw G M, Lin J. Blood Glucose 412
Control in Neonatal Intensive Care with Model-Based Controllers. In: Modelling and 413
Control in Biomedical Systems: 2009; Aalborg, Denmark; 2009. 414
21. Penning S, Le Compte A J, Moorhead K T, Desaive T, Massion P, Preiser J-C, Shaw 415
G M, Chase J G. First pilot trial of the STAR-Liege protocol for tight glycemic 416
control in critically ill patients. Computer Methods and Programs in Biomedicine (0). 417
22. Lauritsen K, Moody A. The response of Gastric Inhibitory Polypeptide (GIP) and 418
insulin to glucose in duodenal ulcer patients. Diabetologia 1978; 14(3):149-153. 419
23. Lin J, Lee D, Chase J G, Shaw G M, Le Compte A, Lotz T, Wong J, Lonergan T, 420
Hann C E. Stochastic modelling of insulin sensitivity and adaptive glycemic control 421
for critical care. Computer Methods and Programs in Biomedicine 2008; 89(2):141-422
152. 423
24. Cobelli C, Toffolo G M, Man C D, Campioni M, Denti P, Caumo A, Butler P, Rizza 424
R. Assessment of β-cell function in humans, simultaneously with insulin sensitivity 425

24
and hepatic extraction, from intravenous and oral glucose tests. American Journal of 426
Physiology - Endocrinology And Metabolism 2007; 293(1):E1-E15. 427
25. Lotz T. High resolution clinical model-based assessment of insulin sensitivity. [PhD 428
Thesis]. University of Canterbury, Christchurch, New Zealand; 2007. 429
26. Carlson G L. Insulin resistance in sepsis. British Journal of Surgery 2003; 90(3):259-430
260. 431
27. Thorell A, Nygren J, Ljungqvist O. Insulin resistance: a marker of surgical stress. 432
Current Opinion in Clinical Nutrition & Metabolic Care 1999; 2(1):69-78. 433
28. Petrov M S, Zagainov V E. Influence of enteral versus parenteral nutrition on blood 434
glucose control in acute pancreatitis: A systematic review. Clinical Nutrition 2007; 435
26(5):514-523. 436
29. Marik P E, Raghavan M. Stress-hyperglycemia, insulin and immunomodulation in 437
sepsis. Intensive Care Medicine 2004; 30(5):748-756. 438
30. Marik P E, Zaloga G P. Meta-analysis of parenteral nutrition versus enteral nutrition 439
in patients with acute pancreatitis. Bmj 2004; 328(7453):1407. 440
31. Van den Berghe G. How does blood glucose control with insulin save lives in 441
intensive care? J Clin Invest 2004; 114(9):1187-1195. 442
443
444
25
Figure legends 445
446
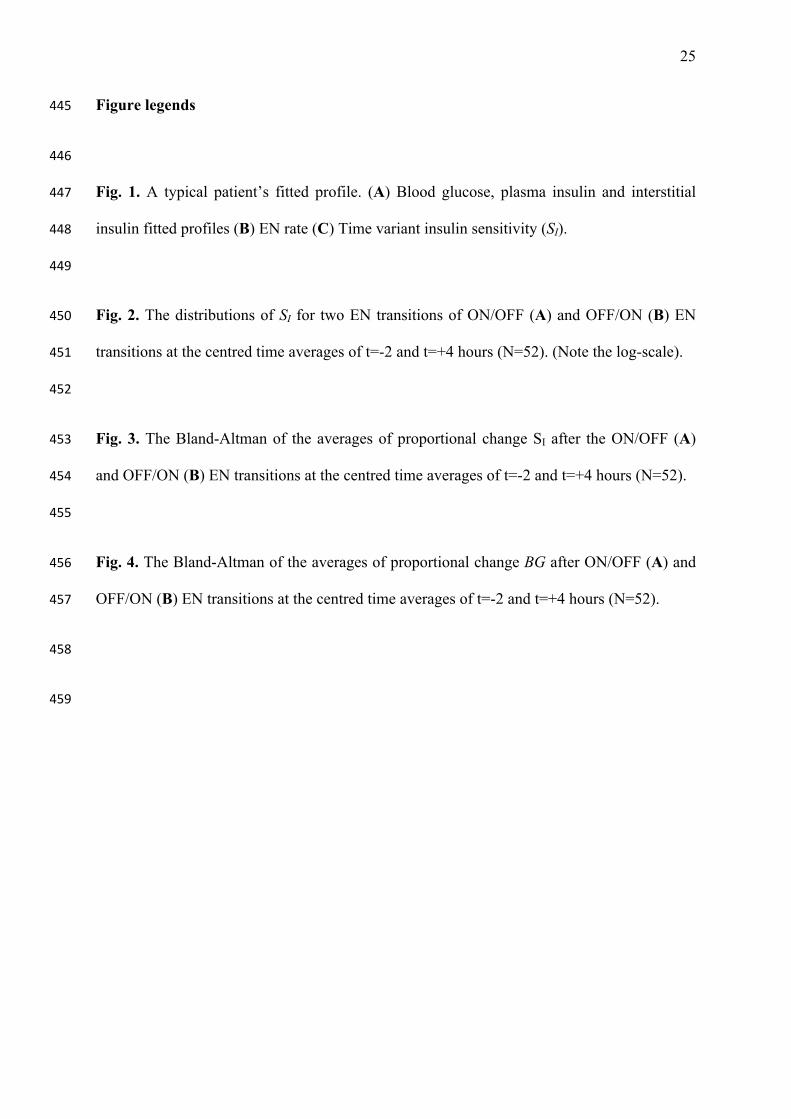
Fig. 1. A typical patient’s fitted profile. (A) Blood glucose, plasma insulin and interstitial 447
insulin fitted profiles (B) EN rate (C) Time variant insulin sensitivity (SI). 448
449
Fig. 2. The distributions of SI for two EN transitions of ON/OFF (A) and OFF/ON (B) EN 450
transitions at the centred time averages of t=-2 and t=+4 hours (N=52). (Note the log-scale). 451
452
Fig. 3. The Bland-Altman of the averages of proportional change SI after the ON/OFF (A) 453
and OFF/ON (B) EN transitions at the centred time averages of t=-2 and t=+4 hours (N=52). 454
455
Fig. 4. The Bland-Altman of the averages of proportional change BG after ON/OFF (A) and 456
OFF/ON (B) EN transitions at the centred time averages of t=-2 and t=+4 hours (N=52). 457
458
459

26
Patient Data from SPRINT
Excluded, Non-Diabetic Cohort
Included Cohort
N=255 *N=52
Age (years) 65 [51-74] 65 [49-72] p=0.86
% Male 70% 67%
APACHE II score 18 [14-23] 19 [17-28] p=0.07
APACHE III
Diagnosis Number of Patients (%)
Cardiovascular 38 (15%) 5 (10%)
Respiratory 64 (25%) 8 (15%)
Pancreatitis 11 (4%) 7 (13%)
Neurological 21 (8%) 6 (12%)
Trauma 38 (15%) 6 (12%)
Sepsis 12 (5%) 7 (13%)
Other
(Renal, metabolic,
orthopaedic)
71 (28%) 13 (25%)
*N=52 are the patient data used in this study. Note N=255 and N=52 exclude diabetic data.
Table 1 SPRINT Cohort baseline variables for included patients and non-diabetic excluded 460
patients. Data are expressed as median [IQR]. (APACHE = Acute Physiology and Chronic 461
Health Evaluation). 462
463
464
27
465
Glucerna® 1.2 CAL (Abbott) RESOURCE® Diabetic
(Novartis)
Carbohydrate
-‐ Fiber
35 %
16 g/1000 mL
36 %
12 g/1000 mL
Protein 20 % 24 %
Fat 45 % 40 %
466
Table 2 Enteral nutrition composition based on GLUCERNA® 1.2 CAL and RESOURCE® 467
Diabetic (Novartis). 13-14 468
469
28
470
ON/OFF
Time*
(hr)
Blood Glucose (ΔBG) Insulin Sensitivity (ΔSI)
Median IQR p-value Median IQR p-value SI (↑)
-2 0% [0,0]% 1.0 0% [0,0] 1.0 50%
-1 0% [-3,6]% 1.0 0% [-10,12]% 0.9 50%
0 -1% [-9,5]% 0.7 -2% [-16,18]% 0.7 46%
+1 -2% [-12,8]% 0.6 -9% [-30,23]% 0.3 38%
+2 -1% [-12,9]% 0.6 -10% [-45,15]% 0.05 27%
+3 -4% [-15,10]% 0.5 -29% [-59,15]% 0.01 29%
+4 0% [-16,17]% 0.4 -36% [-82,24]% 0.001 37%
471
Table 3 Summary of proportional change of blood glucose (ΔBG) and insulin sensitivity, 472
(ΔSI) at ON/OFF feed transition (N=52). (*times are 3-hour averages centred at the time 473
shown, and feed transition between t=-1 and 0. EN feed is stopped anytime between t=-1 and 474
t=0). 475
476
29
477
OFF/ON
Time*
(hr)
Blood Glucose (ΔBG) Insulin Sensitivity (ΔSI)
Median IQR p-value Median IQR p-value SI (↓)
-2 0% [0 0]% 1.0 0% [0 0]% 1.0 50%
-1 -1% [-6,2]% 0.6 4% [-13,12]% 0.9 39%
0 -1% [-9,6]% 0.9 8% [-14,23]% 0.9 40%
+1 -3% [-11,7]% 0.6 14% [-5,29]% 0.5 33%
+2 -2% [-10,15]% 0.9 25% [-10,46]% 0.3 29%
+3 1% [-12,15]% 0.7 32% [-5,53]% 0.05 32%
+4 6% [-15,18]% 0.5 31% [-1,60]% 0.03 25%
478
Table 4 Summary of proportional change of blood glucose (ΔBG) and insulin sensitivity, 479
(ΔSI) at OFF/ON feed transition (N=52). (*times are 3-hour averages centred at the time 480
shown, and feed transition between t=-1 and 0. EN feed is stopped anytime between t=-1 and 481
t=0). 482
483

30
Figures 484
485
Fig. 1. 486
487

31
488
Fig. 2. 489
490
32
491
Fig. 3. 492
493
33
494
Fig. 4. 495
496
497
498
499
500
501 502 503
504