Embed Size (px)
Citation preview
UML Sequence Diagrams
Michael L. Collard, Ph.D.
Department of Computer Science
Kent State University
Kent State University 2
Types of Diagrams
• Structural Diagrams – focus on static aspects of the software system– Class, Object, Component, Deployment
• Behavioral Diagrams – focus on dynamic aspects of the software system– Use-case, Interaction, State Chart,
Activity
Kent State University 3
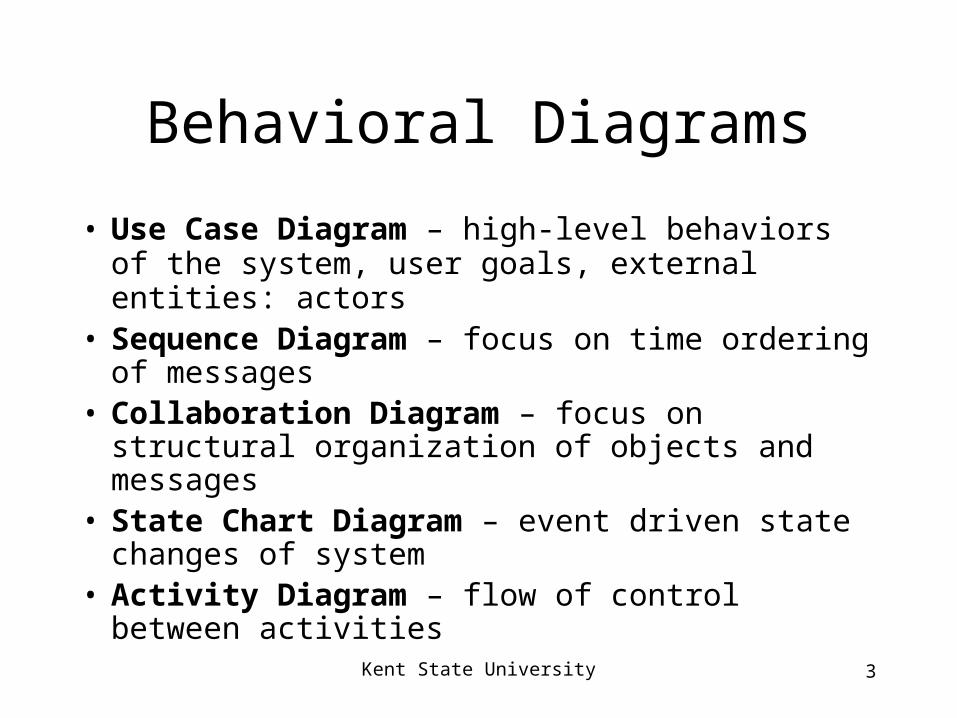
Behavioral Diagrams
• Use Case Diagram – high-level behaviors of the system, user goals, external entities: actors
• Sequence Diagram – focus on time ordering of messages
• Collaboration Diagram – focus on structural organization of objects and messages
• State Chart Diagram – event driven state changes of system
• Activity Diagram – flow of control between activities
Kent State University 4
Refining the Object Model• Typically, only very simplistic object models can be
directly derived from use cases.
• A better understanding of the behavior of each use case is necessary (i.e., analysis)
• Use interaction diagrams to specify and detail the behavior of use cases
• This helps to identify and refine key abstractions and relationships
• Operations, attributes, and messages are also identified during this process
Kent State University 5
Interaction Diagrams
• There is one (or more) Interaction diagram per use case– Represent a sequence of interactions– Made up of objects, links, and messages
• Sequence diagrams– Models flow of control by time ordering– Emphasizes passing messages wrt time– Shows simple iteration and branching
• Collaboration diagrams– Models flow of control by organization– Structural relationships among instances in the interaction– Shows complex iteration and branching
Kent State University 6
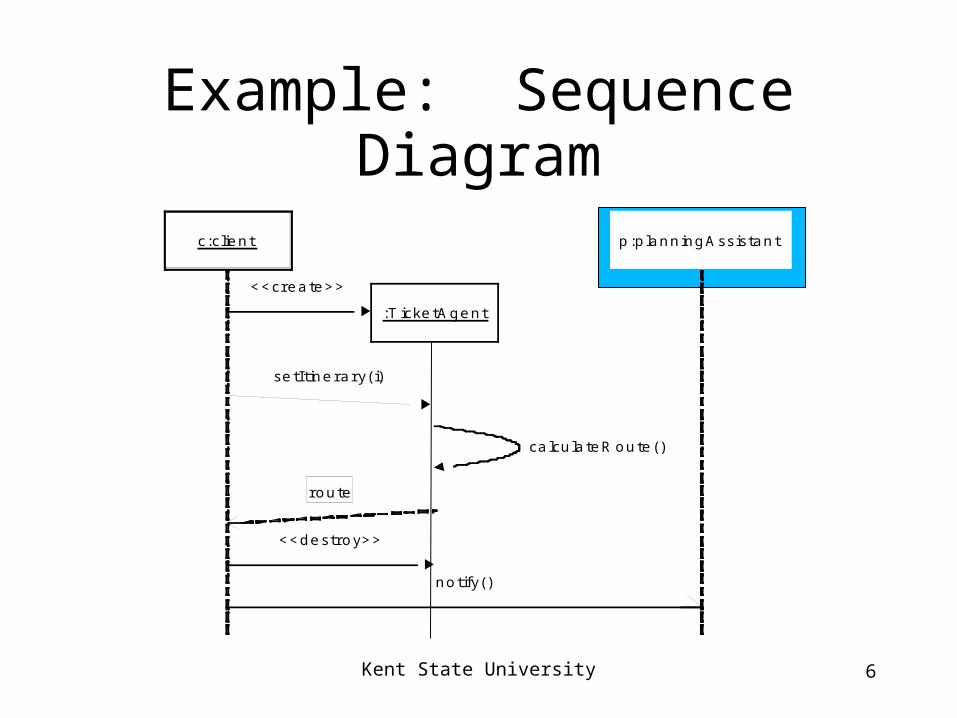
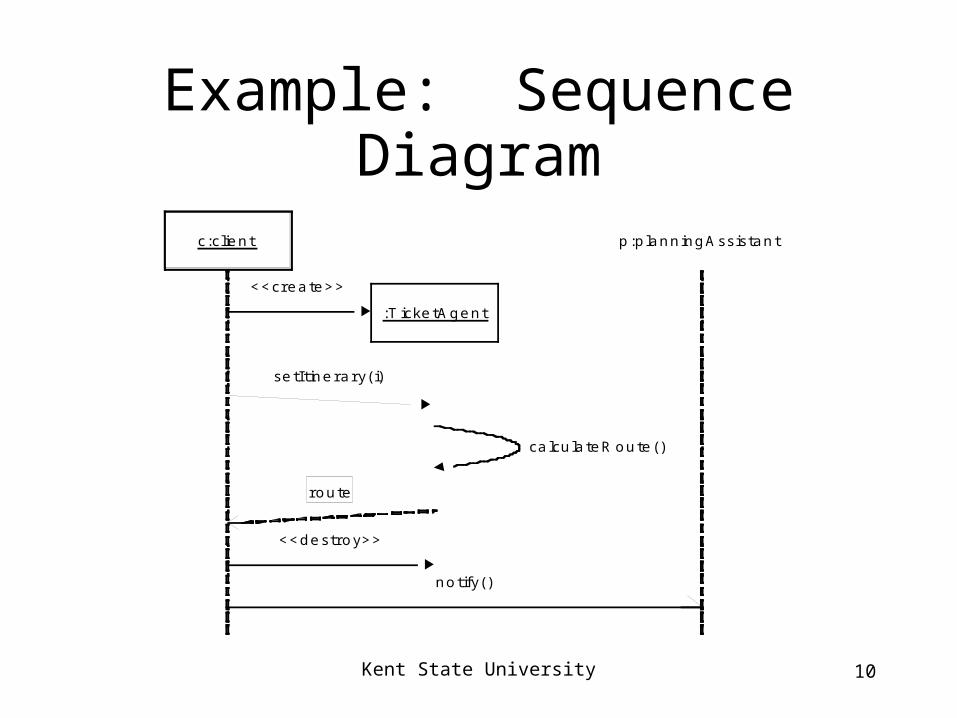
Example: Sequence Diagram
c :c lie n t p :p la n n in g A ss is ta n t
:T icke tA g e n t
< < cr e a te > >
se tI t in e r a r y ( i)
ca lcu la te R o u te ( )
r o u te
< < d e s tr o y> >
n o t ify ( )

Kent State University 7
Sequence Diagrams
• X-axis is objects – Object that initiates interaction is left most– Object to the right are increasingly more
subordinate
• Y-axis is time– Messages sent and received are ordered by time
• Object life lines represent the existence over a period of time
• Activation (double line) is the execution of the procedure.

Kent State University 8
Example: Sequence Diagram
c :c lie n t p :p la n n in g A ss is ta n t
:T icke tA g e n t
< < cr e a te > >
se tI t in e r a r y ( i)
ca lcu la te R o u te ( )
r o u te
< < d e s tr o y> >
n o t ify ( )
Kent State University 9
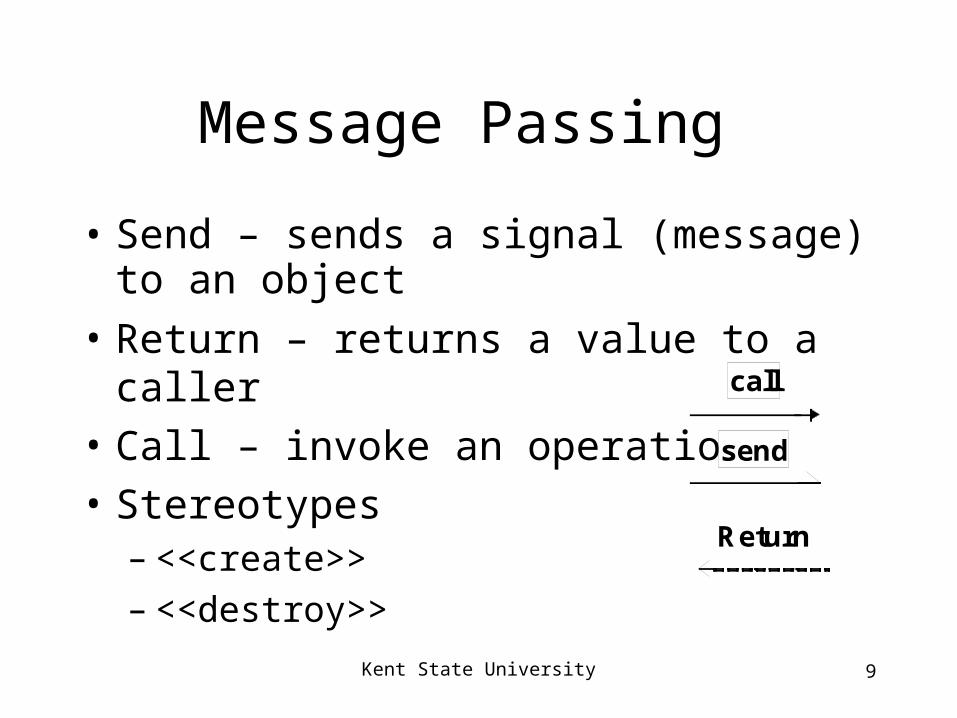
Message Passing
• Send – sends a signal (message) to an object
• Return – returns a value to a caller
• Call – invoke an operation
• Stereotypes – <<create>> – <<destroy>>
call
send
Return
Kent State University 10
Example: Sequence Diagram
c :c lie n t p :p la n n in g A ss is ta n t
:T icke tA g e n t
< < cr e a te > >
se tI t in e r a r y ( i)
ca lcu la te R o u te ( )
r o u te
< < d e s tr o y> >
n o t ify ( )
Kent State University 11
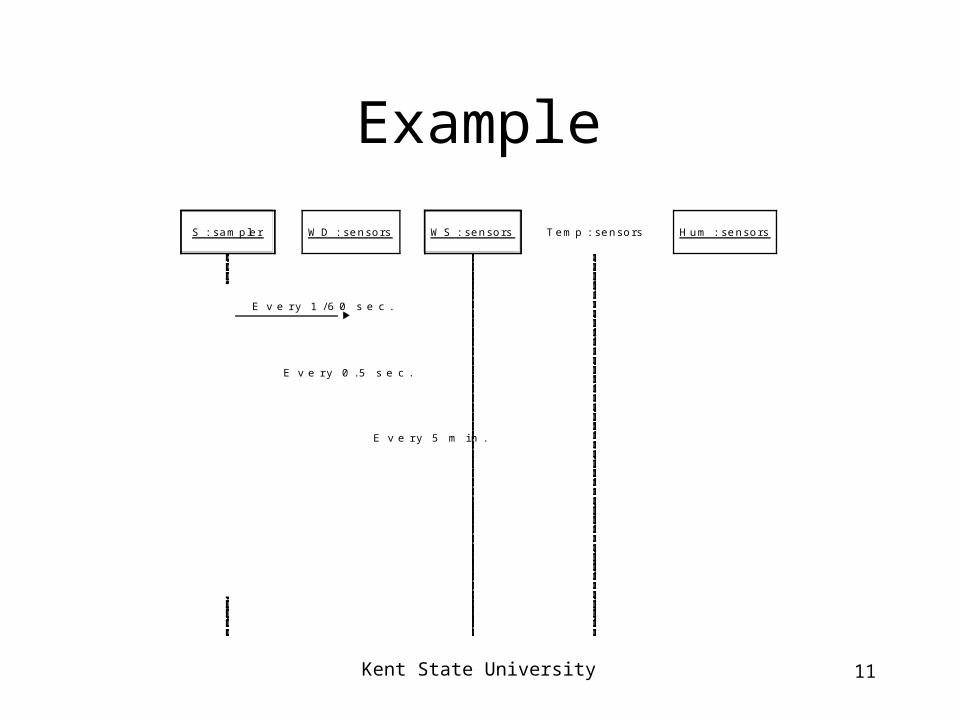
Example
S : sa m p le r W D : se n so r s W S : se n so r s T e m p : se n so r s H u m : se n so r s
E v e r y 1 / 6 0 s e c .
E v e r y 0 . 5 s e c .
E v e r y 5 m i n .
Kent State University 12
Properties of Sequence Diagrams
• Initiator is leftmost object (boundary object)
• Next is typically a control object
• Then comes entity objects
Kent State University 13
Collaboration Diagrams
• Emphasizes the organization of the objects that participate in an interaction
• Classifier roles
• Association
• Messages, flow, and sequencing

Kent State University 14
Example Collaboration Diagram
o r d e r T a ke r T icke tD B
C r e d itB u r e a u
R e q u e s t( o r d e r , cu s to m e r ) 2 : co s t:= r e se a r ce ( o r d e r )
1 : ch e ckC r ed it(cu s to m e r)
3: d eb it(cu s to m e rco s t)
Kent State University 15
Collaboration vs Sequence
• The two diagrams really show the same information
• Collaboration diagrams show more static structure (however, class diagrams are better at this)
• Sequence diagrams clearly highlight the orderings and very useful for multi-tasking

Kent State University 16
Summary (Interaction Diagrams)
• Well structured interaction diagrams:– Is focused on communicating one aspect of a
system’s dynamics– Contains only those elements that are essential to
understanding– Is not so minimal that it misinforms the reader
about the semantics that are important• Diagrams should have meaningful names• Layout diagram to minimize line crossings• Use branching sparingly (leave for activity
diagram)
Kent State University 17
State Diagrams
• Finite state machines (i.e., automata, Mealy/Moore, state transition)
• Used to describe the behavior of one object (or sometimes an operator) for a number of scenarios that affect the object
• They are not good for showing interaction between objects (use interaction diagrams)
• Only use when the behavior of a object is complex and more detail is needed
Kent State University 18
State Diagram Features
• Event – something that happens at a specific point– Alarm goes off
• Condition – something that has a duration– Alarm is on– Fuel level is low
• State – an abstraction of the attributes and relationships of an object (or system)– The fuel tank is in a too low level when the fuel
level is below level x for n seconds
Kent State University 19
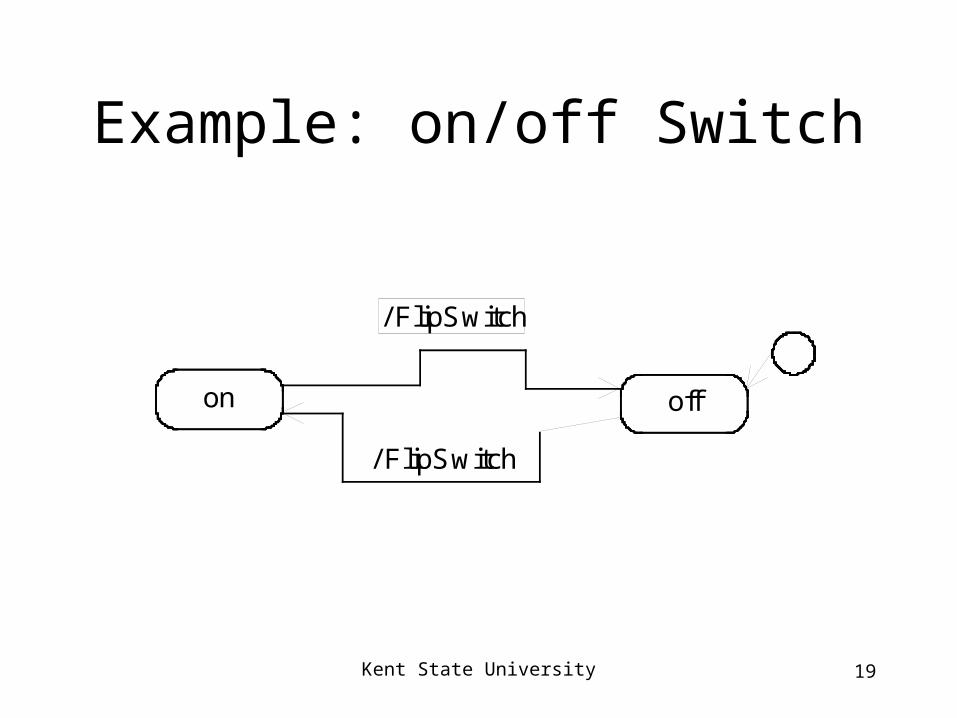
Example: on/off Switch
on off
/ FlipSwitch
/ FlipSwitch

Kent State University 20
Using guards and actions
Waiting
Confirmcredit Cancel
order
Processorder
recieveOrder [amount<25]
recieveOrder [amount>25]approve / debitAccount()
reject
trigger event guard
action
Kent State University 21
Activity Diagrams
• Special form of a state machine (flow chart) – intended to model computations and workflows
• States of the executing the computation not the states of an object
• Flow between activity states is caused by the end of a computation rather then an event

Kent State University 22
Why Activity Diagrams
• Flowcharts (abet a bit glorified) are not very amiable to OO
• Not part of any previous notations• Suitable for modeling the business
activities• OO and UML is becoming very
prevalent in business applications• Introduced to help sell products?
Kent State University 23
Component Diagrams
• A component is a physical thing that conforms to and realizes a set of interfaces
• Bridge between logical and physical models• Can represent object libraries, COM
components, Java Beans, etc.• Classes represent logical abstractions,
components represent physical things that reside on a node (machine).
• Components are reachable only through interface

Kent State University 24
Examples
Transactions
«table»AccountATM-GUI
U p d a t e
s p e l l - c h e c k
s y n o n y m sDictionary
a d d - n e w - w o r d

Kent State University 25
Deployment Diagrams
• Nodes are physical elements that represent a computational resource (machine)
• Association between nodes• Components are allocated to nodes (one or
more)• Components represent the physical
packaging of logical elements• Nodes represent the physical deployment of
components
Kent State University 26
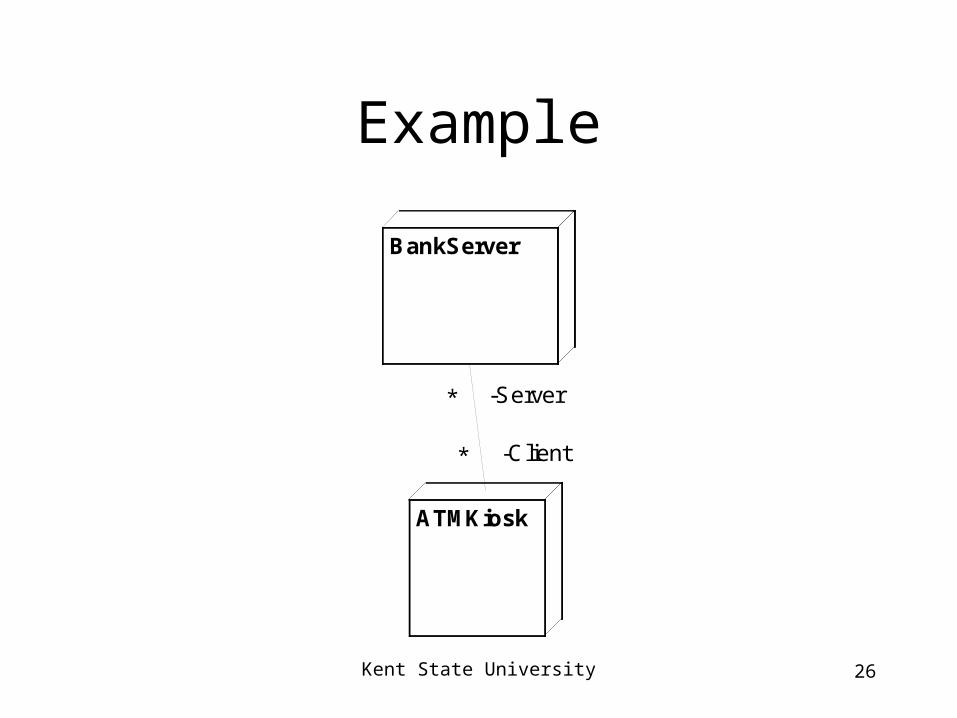
Example
BankServer
ATMKiosk
-Server*
-Client*

Kent State University 27
With Components
BankServer
ATMKiosk
-server1
-client*
A T M - G U I
T r a n s a c t i o n s
«table»A c c o u n t
Update

Kent State University 28
Weather StationClock
Computer
LCDDisplay
Keypad
WindDirectionSensor
WindSpeedSensor
TempatureSensor
HumiditySensor
Barometer

Kent State University 29
Modeling Source Code
M a i l b o x . c p p
M a i l b o x . h
M a i l s y s t e m . c p p
I n p u t r e a d e r . h