Embed Size (px)
Citation preview
Umicore reaches Horizon 2020 targets two years
8 February 2019
ahead of schedule and reaffirms upside potential
Highlights 2018
Reaching Horizon 2020 targets 2 years ahead of schedule
Current market environment and Umicore developments
2018 Performance
Reaffirming upside potential
Q&A
Overview
2018 results 2
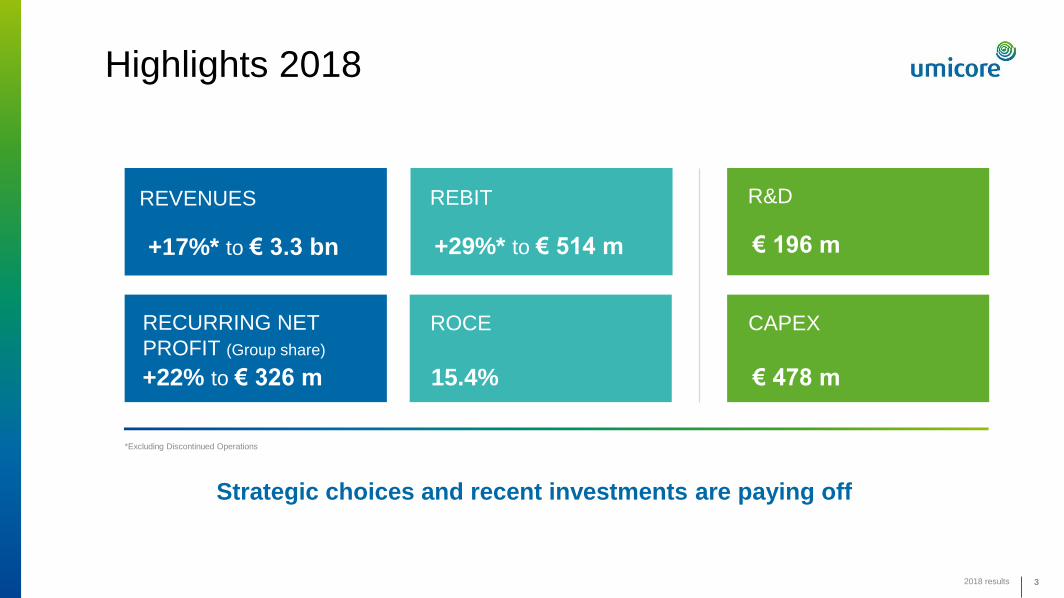
Highlights 2018
2018 results 33
Strategic choices and recent investments are paying off
+17%* to € 3.3 bn
REVENUES
+22% to € 326 m
RECURRING NET
PROFIT (Group share)
15.4%
ROCE
+29%* to € 514 m
REBIT
€ 478 m
CAPEX
€ 196 m
R&D
*Excluding Discontinued Operations
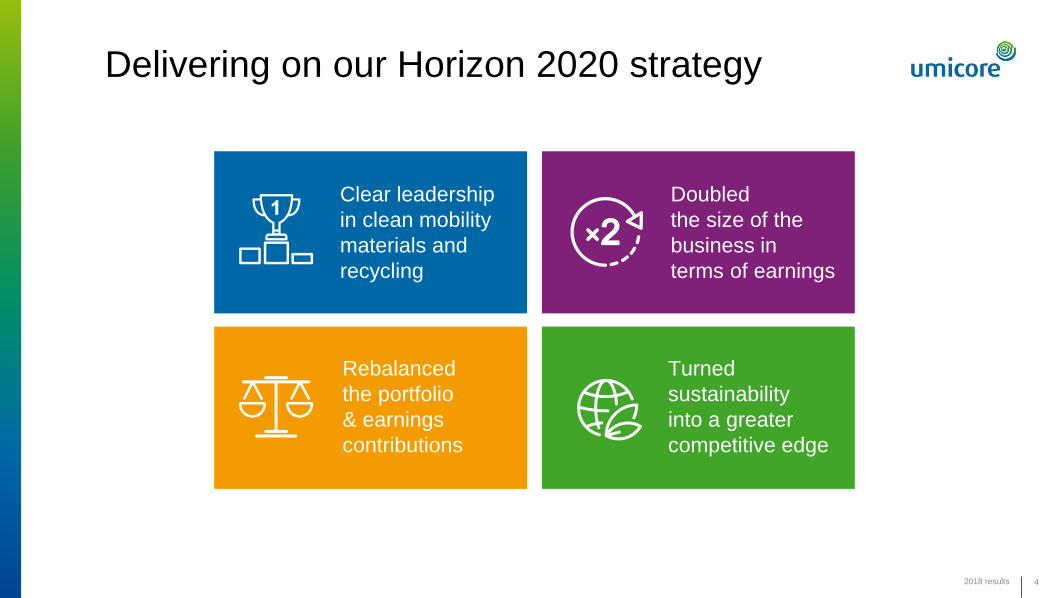
Clear leadership
in clean mobility
materials and
recycling
Rebalanced
the portfolio
& earnings
contributions
Doubled
the size of the
business in
terms of earnings
Turned
sustainability
into a greater
competitive edge
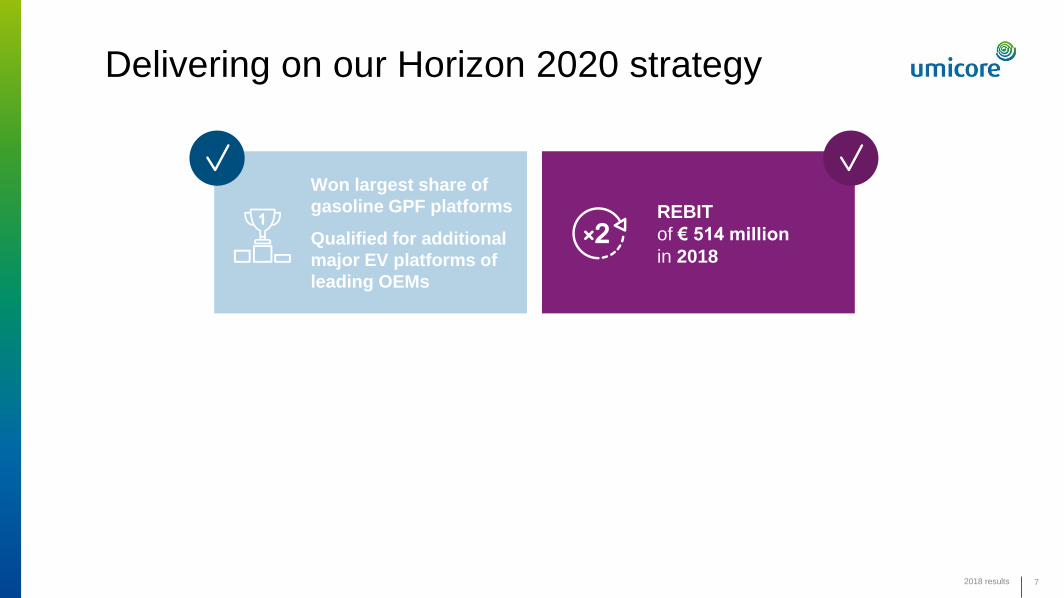
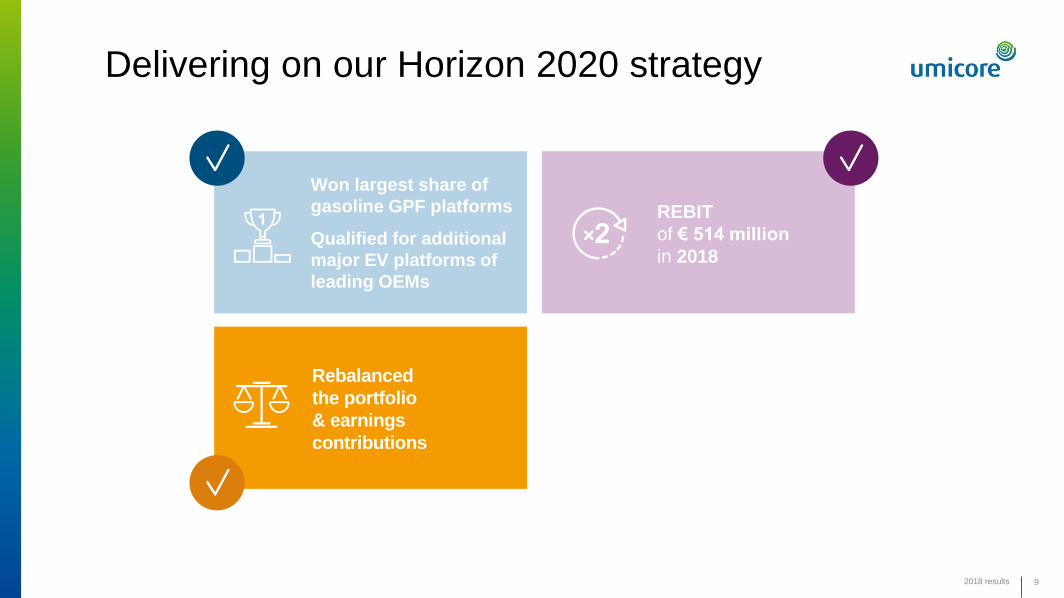
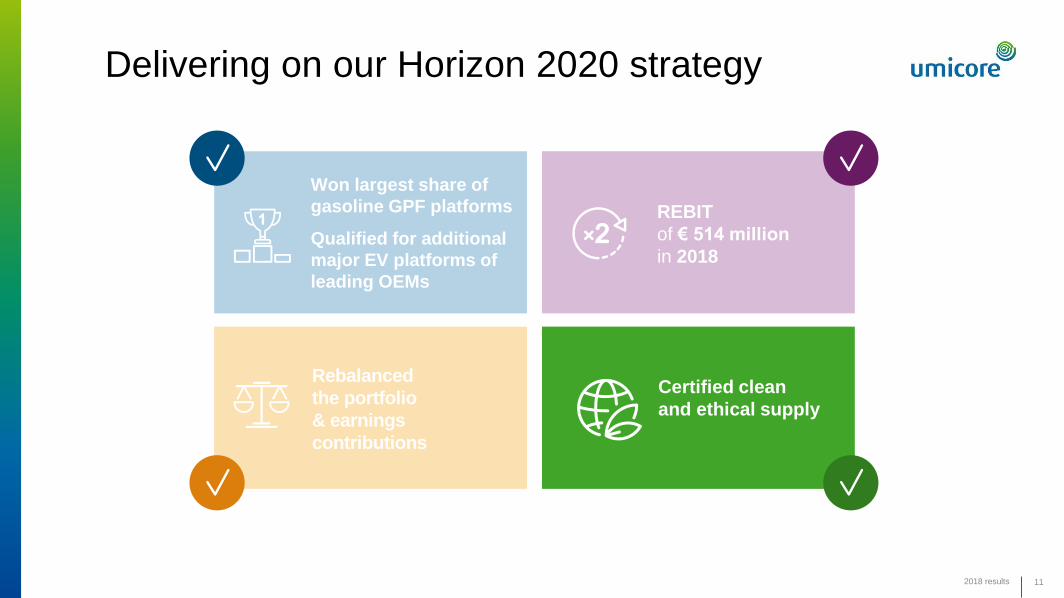
Delivering on our Horizon 2020 strategy
42018 results
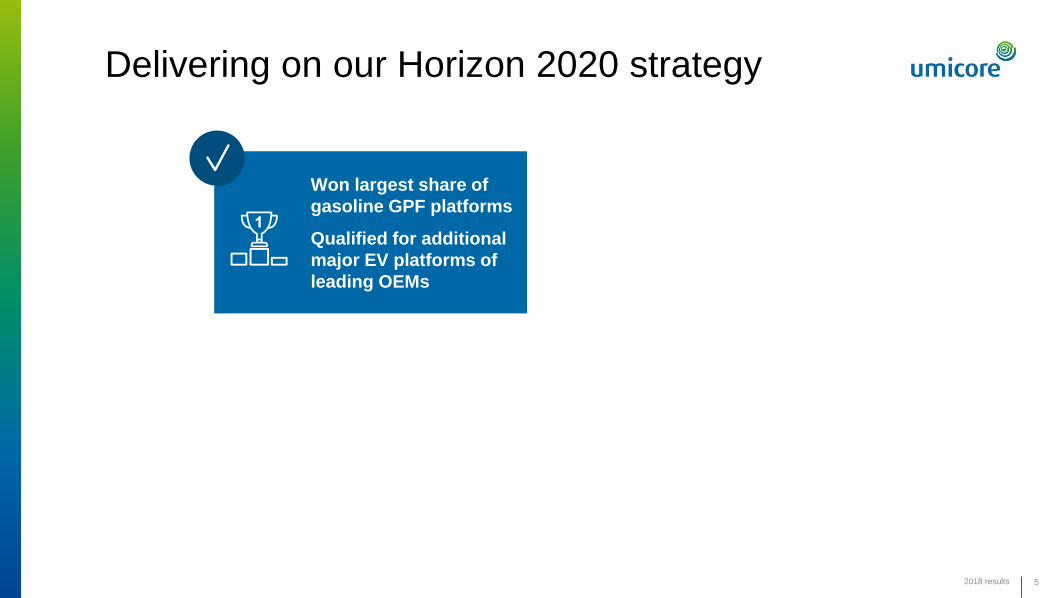
Won largest share of
gasoline GPF platforms
Qualified for additional
major EV platforms of
leading OEMs
Delivering on our Horizon 2020 strategy
5
Completion of first € 460 million investment wave
ahead of schedule
2018 results
2018 results 6
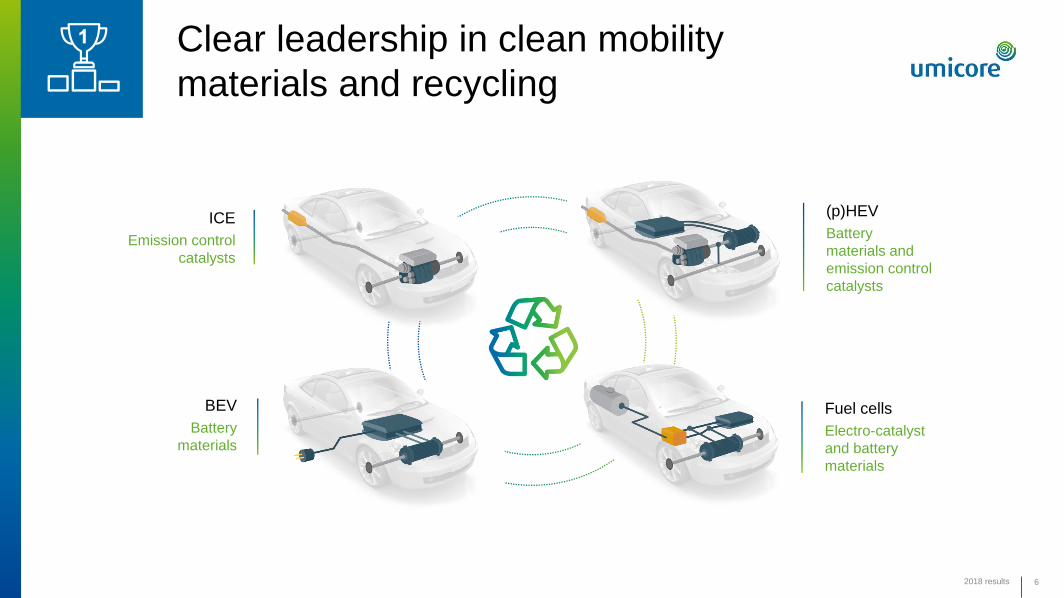
ICE
Emission control
catalysts
(p)HEV
Battery
materials and
emission control
catalysts
Fuel cells
Electro-catalyst
and battery
materials
BEV
Battery
materials
Clear leadership in clean mobility
materials and recycling
Won largest share of
gasoline GPF platforms
Qualified for additional
major EV platforms of
leading OEMs
Delivering on our Horizon 2020 strategy
7
Completion of first € 460 million investment wave
ahead of schedule
2018 results
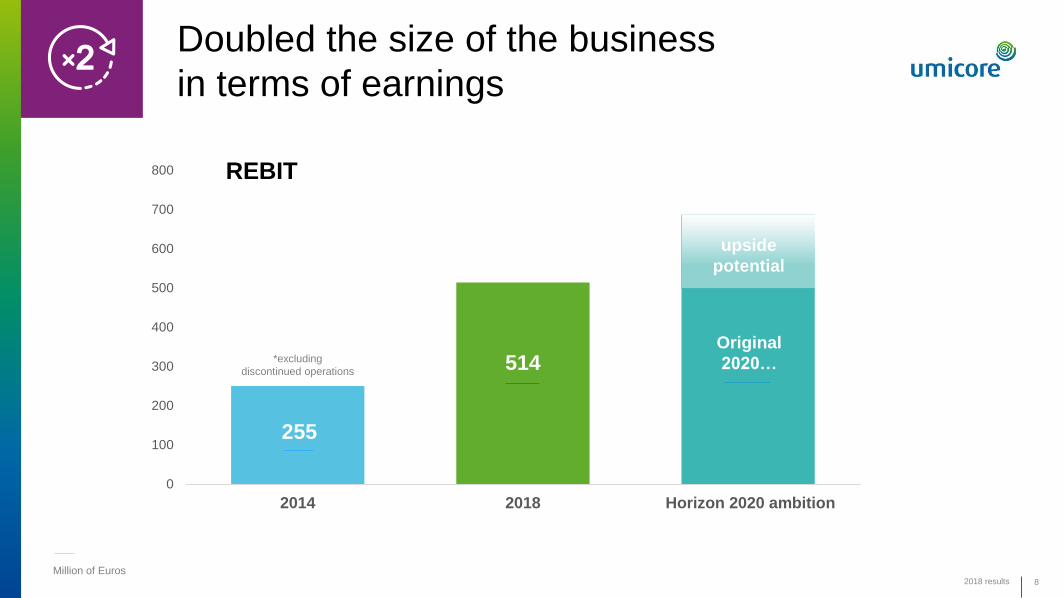
REBIT
of € 514 million
in 2018
0
100
200
300
400
500
600
700
800
2014 2018 Horizon 2020 ambition
8
REBIT
Million of Euros
*excluding
discontinued operations
2018 results
Doubled the size of the business
in terms of earnings
255
514Original
2020…
upside
potential
Won largest share of
gasoline GPF platforms
Qualified for additional
major EV platforms of
leading OEMs
Delivering on our Horizon 2020 strategy
9
Completion of first € 460 million investment wave
ahead of schedule
2018 results
REBIT
of € 514 million
in 2018
Rebalanced
the portfolio
& earnings
contributions
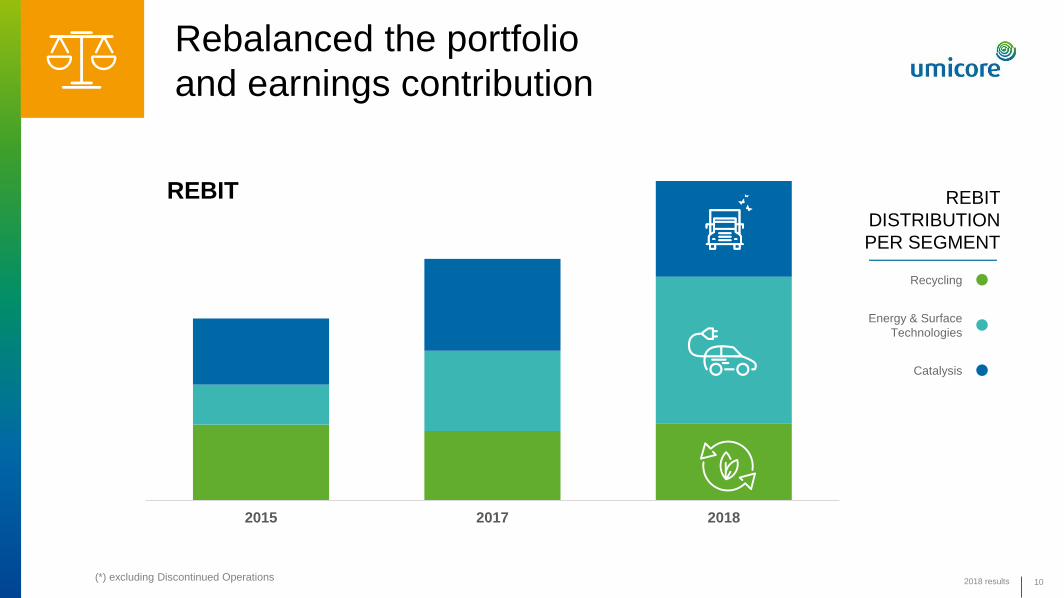
REBIT
DISTRIBUTION
PER SEGMENT
Recycling
Energy & Surface
Technologies
Catalysis
10
2015 2017 2018
REBIT
Rebalanced the portfolio
and earnings contribution
2018 results(*) excluding Discontinued Operations
Won largest share of
gasoline GPF platforms
Qualified for additional
major EV platforms of
leading OEMs
Delivering on our Horizon 2020 strategy
11
Completion of first € 460 million investment wave
ahead of schedule
2018 results
REBIT
of € 514 million
in 2018
Rebalanced
the portfolio
& earnings
contributions
Certified clean
and ethical supply
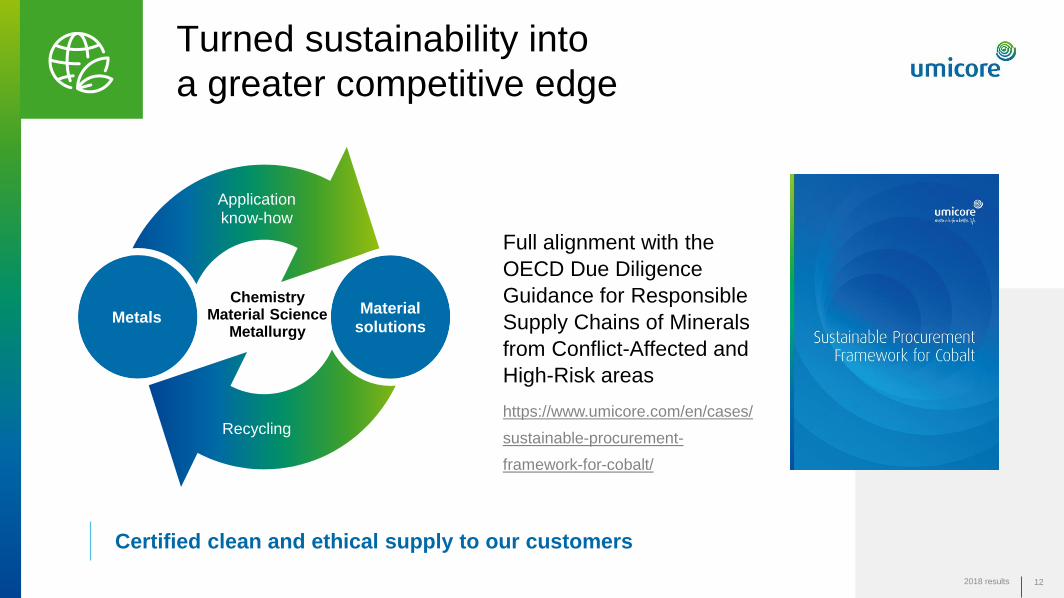
Turned sustainability into
a greater competitive edge
2018 results 12
Full alignment with the
OECD Due Diligence
Guidance for Responsible
Supply Chains of Minerals
from Conflict-Affected and
High-Risk areas
https://www.umicore.com/en/cases/
sustainable-procurement-
framework-for-cobalt/
Certified clean and ethical supply to our customers
ChemistryMaterial Science
Metallurgy
Materialsolutions
Metals
Application know-how
Recycling
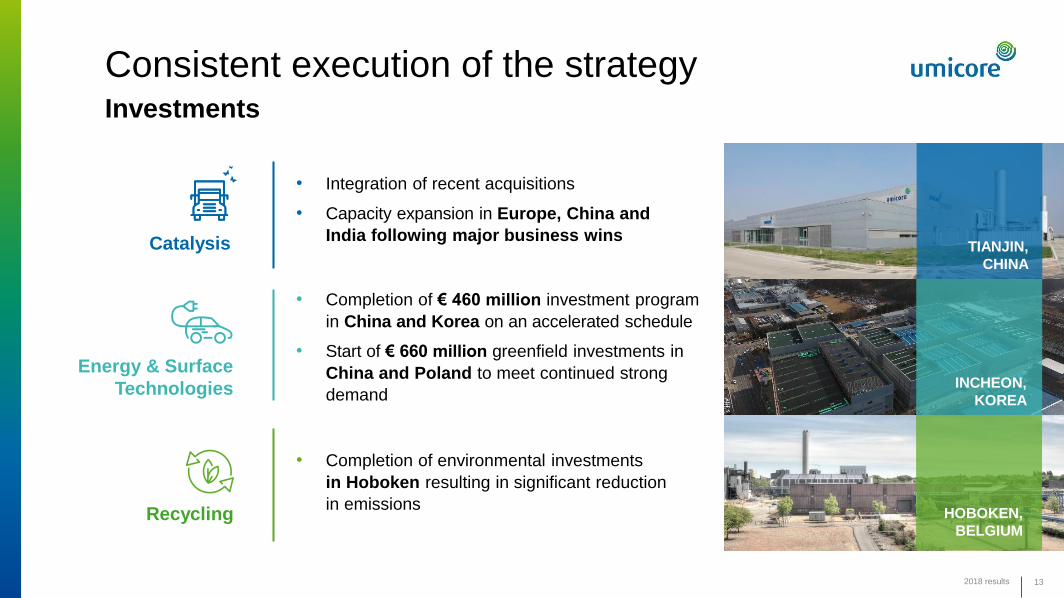
• Completion of € 460 million investment program
in China and Korea on an accelerated schedule
• Start of € 660 million greenfield investments in
China and Poland to meet continued strong
demand
Consistent execution of the strategyInvestments
13
• Integration of recent acquisitions
• Capacity expansion in Europe, China and
India following major business wins
Energy & Surface
Technologies
Catalysis
Recycling HOBOKEN,
BELGIUM
• Completion of environmental investments
in Hoboken resulting in significant reduction
in emissions
INCHEON,
KOREA
TIANJIN,
CHINA
2018 results
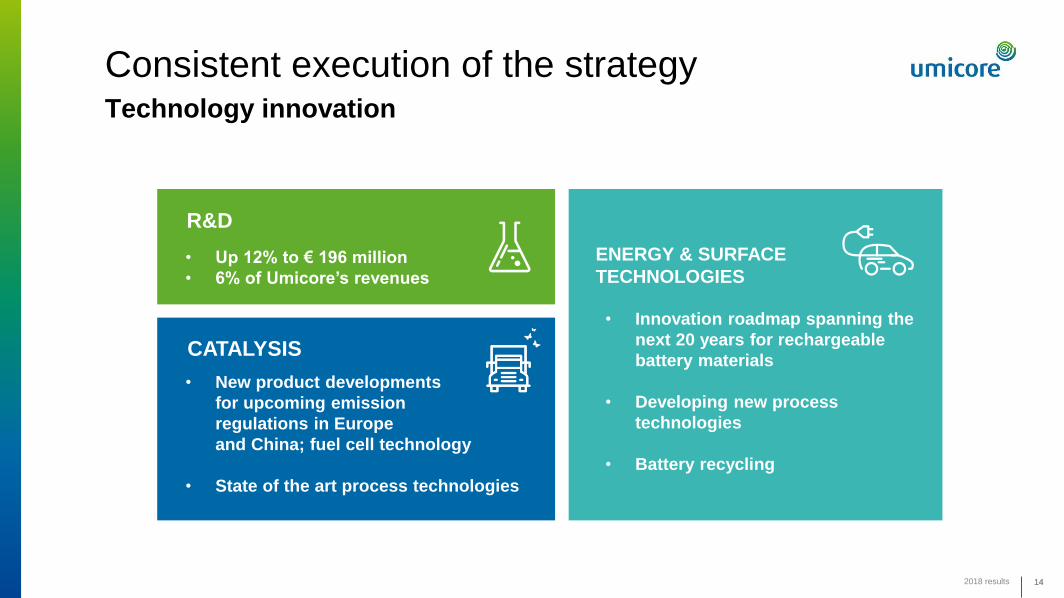
Consistent execution of the strategyTechnology innovation
2018 results 1414
• Up 12% to € 196 million
• 6% of Umicore’s revenues
R&D
• New product developments
for upcoming emission
regulations in Europe
and China; fuel cell technology
• State of the art process technologies
CATALYSIS
ENERGY & SURFACE
TECHNOLOGIES
• Innovation roadmap spanning the
next 20 years for rechargeable
battery materials
• Developing new process
technologies
• Battery recycling
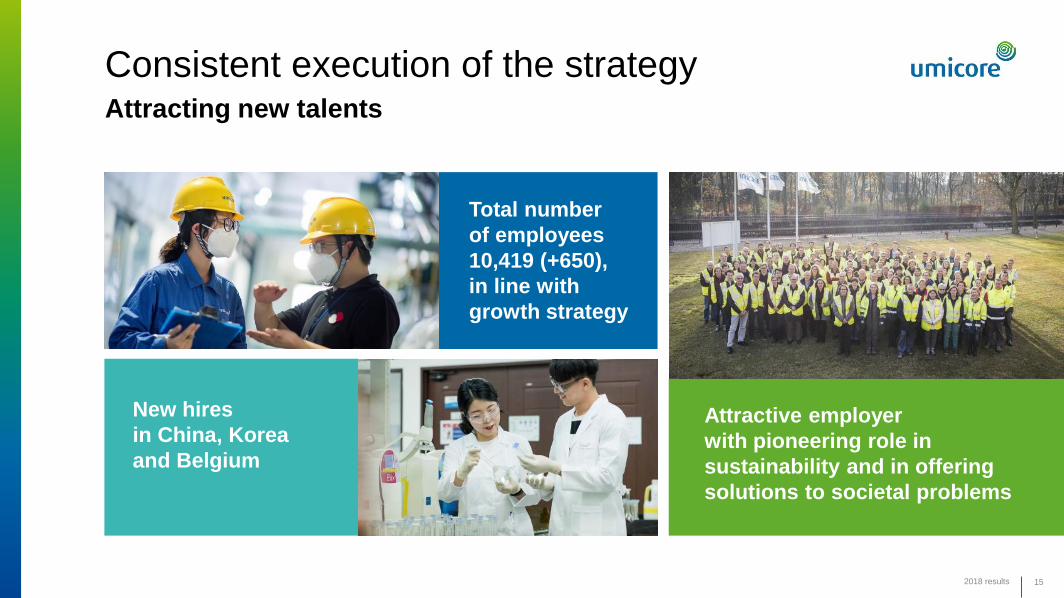
Consistent execution of the strategyAttracting new talents
2018 results 15
Total number
of employees
10,419 (+650),
in line with
growth strategy
New hires
in China, Korea
and Belgium
Attractive employer
with pioneering role in
sustainability and in offering
solutions to societal problems
2018 results 16
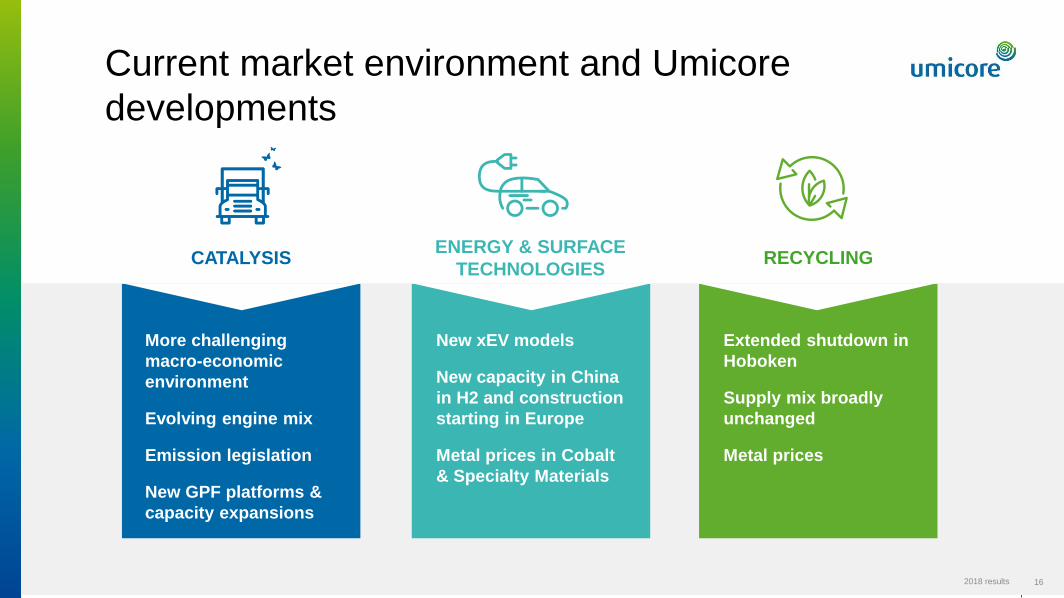
More challenging
macro-economic
environment
Evolving engine mix
Emission legislation
New GPF platforms &
capacity expansions
CATALYSISENERGY & SURFACE
TECHNOLOGIESRECYCLING
Current market environment and Umicore
developments
New xEV models
New capacity in China
in H2 and construction
starting in Europe
Metal prices in Cobalt
& Specialty Materials
Extended shutdown in
Hoboken
Supply mix broadly
unchanged
Metal prices
2018
performance
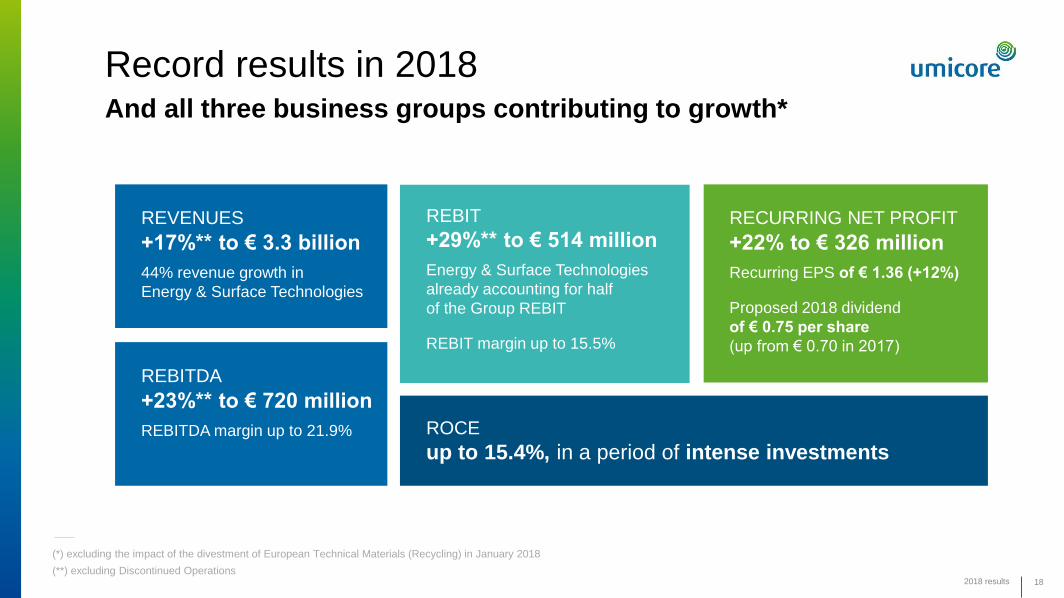
Record results in 2018And all three business groups contributing to growth*
2018 results 18
(*) excluding the impact of the divestment of European Technical Materials (Recycling) in January 2018
REVENUES
+17%** to € 3.3 billion
44% revenue growth in
Energy & Surface Technologies
REBITDA
+23%** to € 720 million
REBITDA margin up to 21.9%
REBIT
+29%** to € 514 million
Energy & Surface Technologies
already accounting for half
of the Group REBIT
REBIT margin up to 15.5%
RECURRING NET PROFIT
+22% to € 326 million
Recurring EPS of € 1.36 (+12%)
Proposed 2018 dividend
of € 0.75 per share
(up from € 0.70 in 2017)
ROCE
up to 15.4%, in a period of intense investments
(**) excluding Discontinued Operations
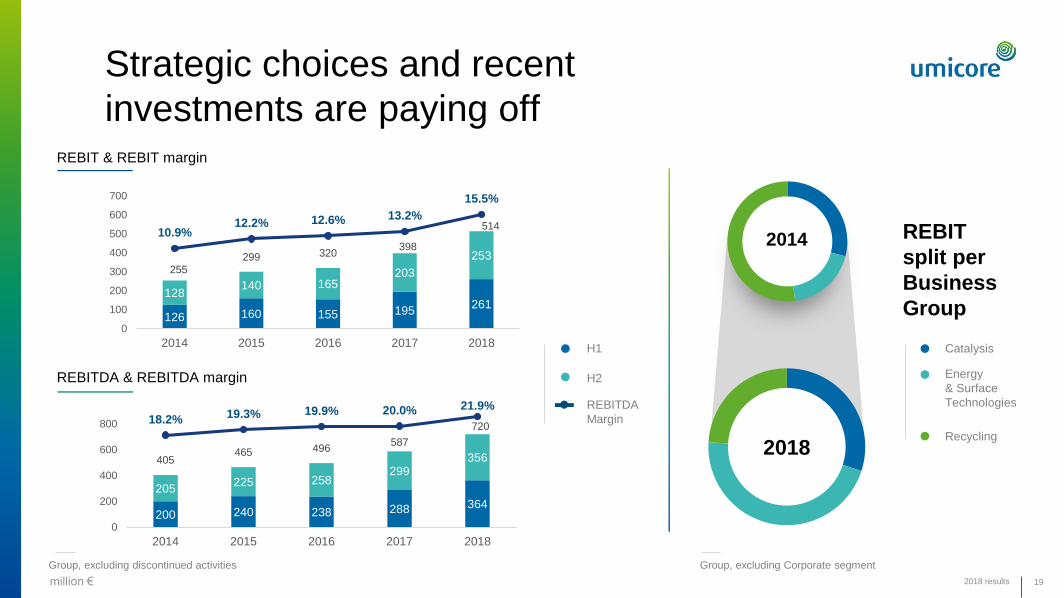
Strategic choices and recent
investments are paying off
2018 results 19
REBITDA & REBITDA margin
REBIT & REBIT margin
2018
2014
Catalysis
Energy
& Surface
Technologies
Recycling
H1
REBITDA
Margin
REBIT
split per
Business
Group
H2
Group, excluding Corporate segment
126 160 155 195261
128140 165
203
253255
299 320398
51410.9%
12.2% 12.6% 13.2%
15.5%
0
100
200
300
400
500
600
700
2014 2015 2016 2017 2018
200 240 238 288 364
205225 258
299356405
465 496587
72018.2% 19.3% 19.9% 20.0% 21.9%
0
200
400
600
800
2014 2015 2016 2017 2018
Group, excluding discontinued activities
million €
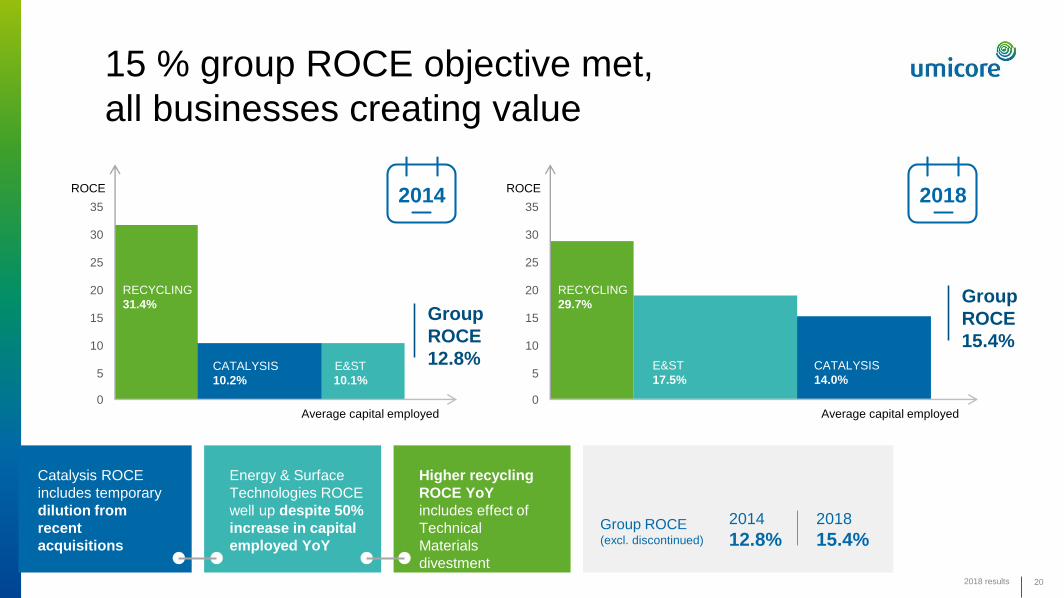
CATALYSIS
14.0%
E&ST
17.5%
15 % group ROCE objective met,
all businesses creating value
2018 results 20
CATALYSIS
10.2%
E&ST
10.1%5
0
15
10
20
25
30
35
RECYCLING
31.4%
ROCE
Average capital employed
Group
ROCE
12.8%
2014`
5
0
15
10
20
25
30
35
RECYCLING
29.7%
ROCE
Average capital employed
Group
ROCE
15.4%
2018`
Catalysis ROCE
includes temporary
dilution from
recent
acquisitions
Higher recycling
ROCE YoY
includes effect of
Technical
Materials
divestment
Energy & Surface
Technologies ROCE
well up despite 50%
increase in capital
employed YoY
2014
12.8%2018
15.4%Group ROCE (excl. discontinued)
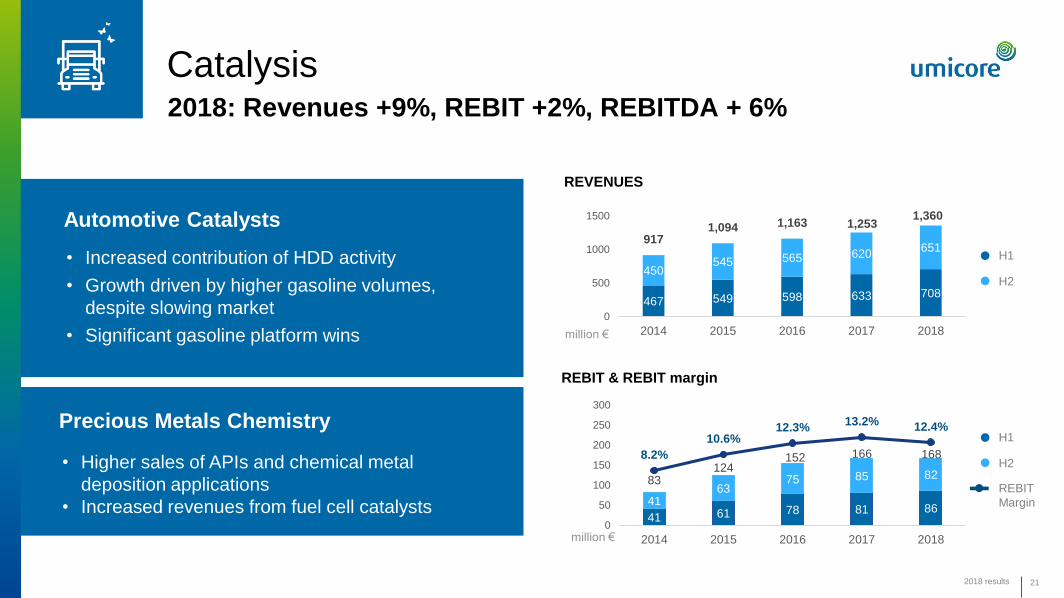
Catalysis
21
• Increased contribution of HDD activity
• Growth driven by higher gasoline volumes,
despite slowing market
• Significant gasoline platform wins
2018: Revenues +9%, REBIT +2%, REBITDA + 6%
million €
2018 results
• Higher sales of APIs and chemical metal
deposition applications
• Increased revenues from fuel cell catalysts
Automotive Catalysts
Precious Metals Chemistry
REVENUES
REBIT & REBIT margin
H1
H2
H1
REBIT
Margin
H2
million €
467 549 598 633 708
450545 565 620
651917
1,094 1,163 1,2531,360
0
500
1000
1500
2014 2015 2016 2017 2018
41 61 78 81 8641
6375 85 8283
124152 166 1688.2%
10.6%12.3%
13.2% 12.4%
0
50
100
150
200
250
300
2014 2015 2016 2017 2018
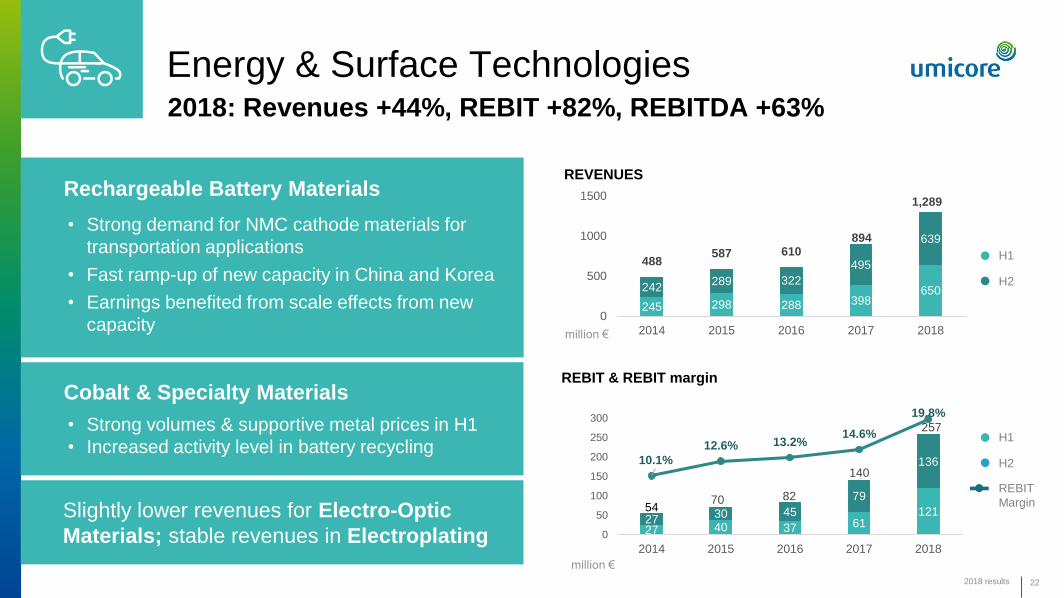
Energy & Surface Technologies
22
• Strong demand for NMC cathode materials for
transportation applications
• Fast ramp-up of new capacity in China and Korea
• Earnings benefited from scale effects from new
capacity
2018: Revenues +44%, REBIT +82%, REBITDA +63%
million €
2018 results
• Strong volumes & supportive metal prices in H1
• Increased activity level in battery recycling
Rechargeable Battery Materials
Cobalt & Specialty Materials
REVENUES
REBIT & REBIT margin
H1
H2
H1
REBIT
Margin
H2
Slightly lower revenues for Electro-Optic
Materials; stable revenues in Electroplating
million €
27 40 37 61121
2730 45
79
136
5470 82
140
257
10.1%
12.6% 13.2%14.6%
19.8%
0
50
100
150
200
250
300
2014 2015 2016 2017 2018
245 298 288 398650242
289 322
495
639
488587 610
894
1,289
0
500
1000
1500
2014 2015 2016 2017 2018
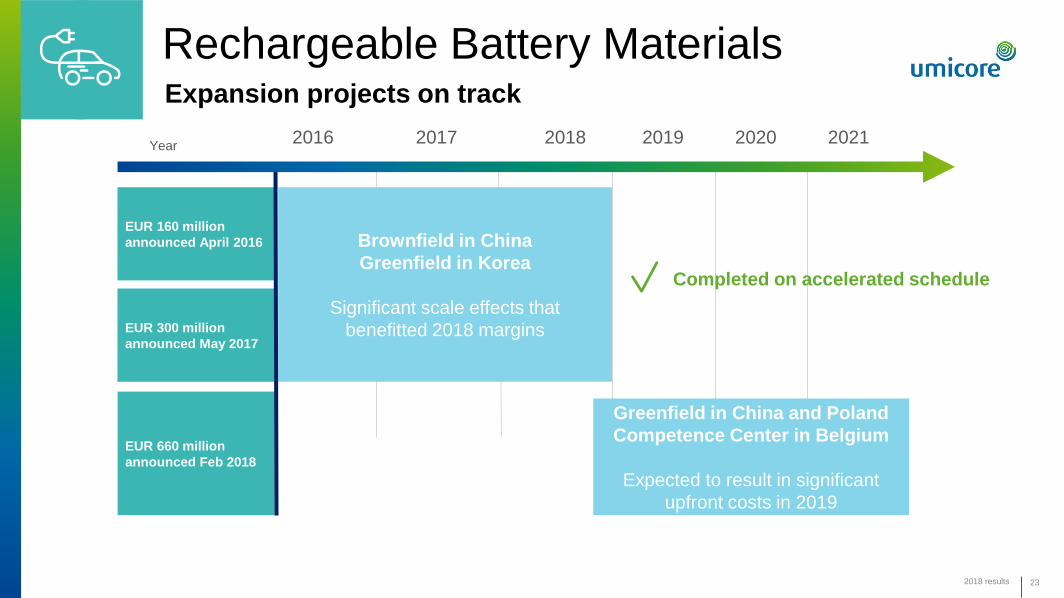
Rechargeable Battery Materials
EUR 160 million
announced April 2016
EUR 300 million
announced May 2017
EUR 660 million
announced Feb 2018
2016 2017 2018 2019 2020 2021Year
232018 results
Expansion projects on track
Brownfield in China
Greenfield in Korea
Significant scale effects that
benefitted 2018 margins
Completed on accelerated schedule
Greenfield in China and Poland
Competence Center in Belgium
Expected to result in significant
upfront costs in 2019
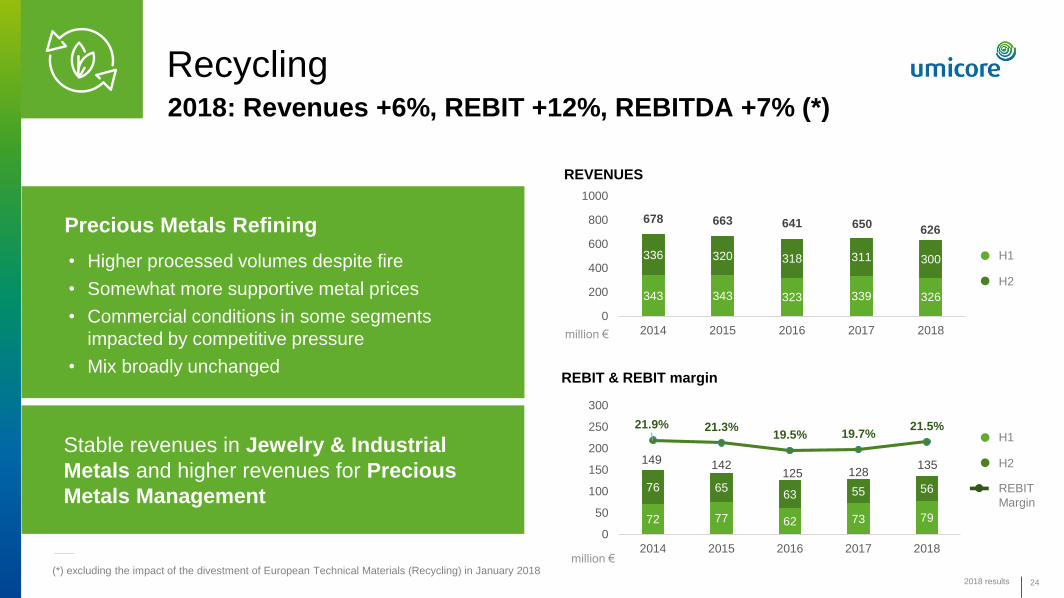
Recycling
24
• Higher processed volumes despite fire
• Somewhat more supportive metal prices
• Commercial conditions in some segments
impacted by competitive pressure
• Mix broadly unchanged
2018: Revenues +6%, REBIT +12%, REBITDA +7% (*)
million €
2018 results
Precious Metals Refining
REVENUES
REBIT & REBIT margin
H1
H2
H1
REBIT
Margin
H2
Stable revenues in Jewelry & Industrial
Metals and higher revenues for Precious
Metals Management
(*) excluding the impact of the divestment of European Technical Materials (Recycling) in January 2018 million €
72 77 62 73 79
76 6563 55 56
149 142125 128
135
21.9% 21.3%19.5% 19.7%
21.5%
0
50
100
150
200
250
300
2014 2015 2016 2017 2018
343 343 323 339 326
336 320 318 311 300
678 663 641 650626
0
200
400
600
800
1000
2014 2015 2016 2017 2018
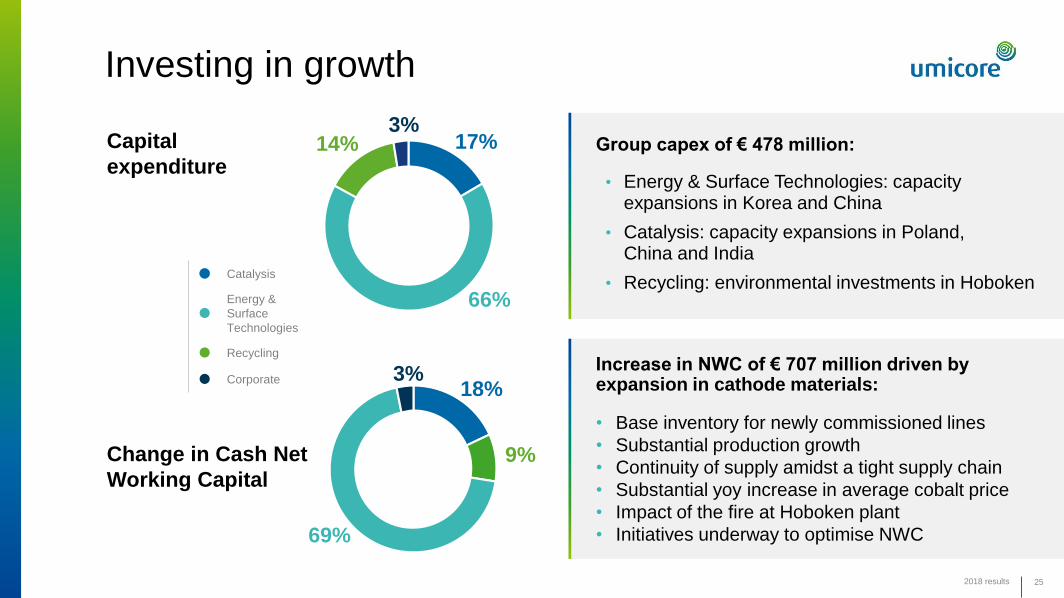
Investing in growth
2018 results 25
Capital
expenditure
Increase in NWC of € 707 million driven by expansion in cathode materials:
• Base inventory for newly commissioned lines
• Substantial production growth
• Continuity of supply amidst a tight supply chain
• Substantial yoy increase in average cobalt price
• Impact of the fire at Hoboken plant
• Initiatives underway to optimise NWC
Group capex of € 478 million:
• Energy & Surface Technologies: capacity expansions in Korea and China
• Catalysis: capacity expansions in Poland, China and India
• Recycling: environmental investments in Hoboken
Change in Cash Net
Working Capital
Catalysis
Energy &
Surface
Technologies
Recycling
Corporate
17%
66%
14%3%
18%
9%
69%
3%
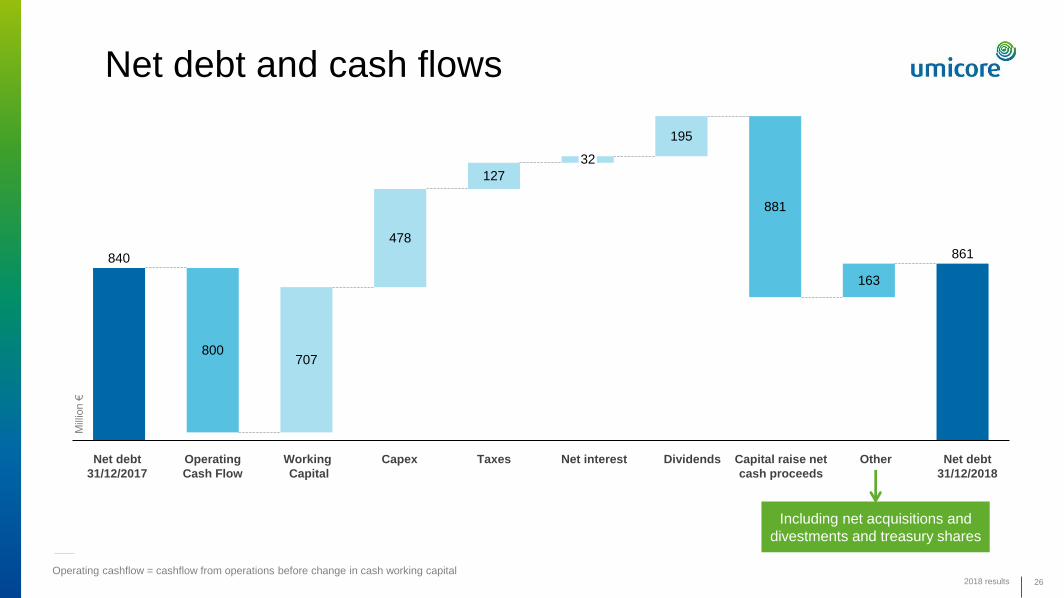
Net debt and cash flows
2018 results 26
Including net acquisitions and
divestments and treasury shares
Working
Capital
Net debt
31/12/2018
Operating
Cash Flow
Net debt
31/12/2017
Capex Taxes Net interest Dividends OtherCapital raise net
cash proceeds
Mill
ion €
Operating cashflow = cashflow from operations before change in cash working capital
840 861
800707
478
127
195
881
163
32
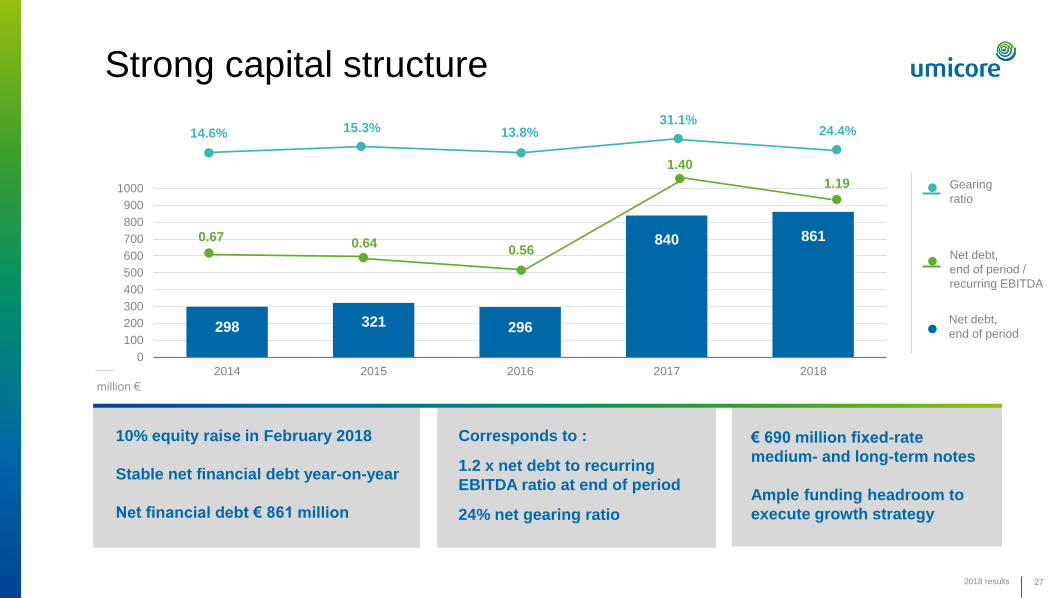
Strong capital structure
2018 results 27
298 321 296
840 861
0
100
200
300
400
500
600
700
800
900
1000
2014 2015 2016 2017 2018
0.560.64
0.67
1.40
1.19
15.3%14.6% 13.8%31.1%
24.4%
10% equity raise in February 2018
Stable net financial debt year-on-year
Net financial debt € 861 million
€ 690 million fixed-rate
medium- and long-term notes
Ample funding headroom to
execute growth strategy
Corresponds to :
1.2 x net debt to recurring
EBITDA ratio at end of period
24% net gearing ratio
Net debt,
end of period
Gearing
ratio
Net debt,
end of period /
recurring EBITDA
million €
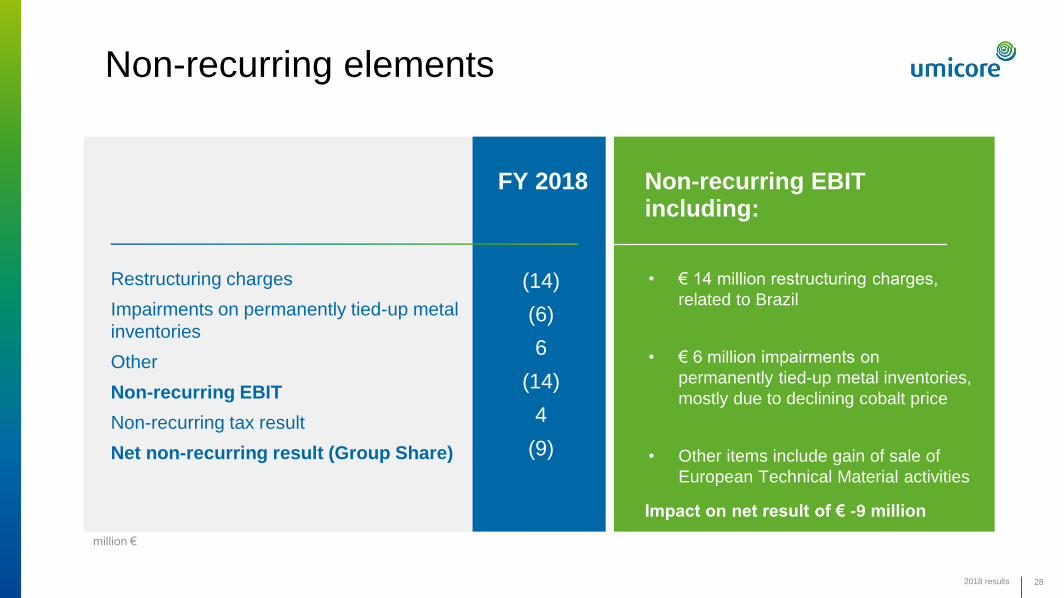
Non-recurring elements
2018 results 28
Non-recurring EBIT including:
• € 14 million restructuring charges,
related to Brazil
• € 6 million impairments on
permanently tied-up metal inventories,
mostly due to declining cobalt price
• Other items include gain of sale of
European Technical Material activities
Impact on net result of € -9 million
Million €
FY 2018
(14)
(6)
6
(14)
4
(9)
Restructuring charges
Impairments on permanently tied-up metal
inventories
Other
Non-recurring EBIT
Non-recurring tax result
Net non-recurring result (Group Share)
million €

Reaffirming upside
potential
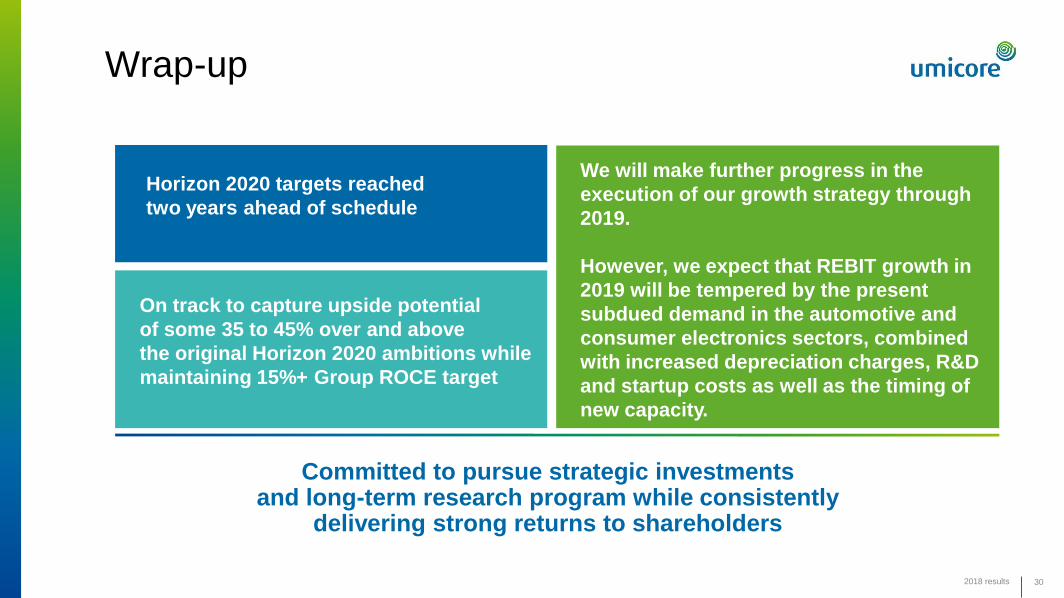
Wrap-up
2018 results 30
Horizon 2020 targets reached
two years ahead of schedule
On track to capture upside potential
of some 35 to 45% over and above
the original Horizon 2020 ambitions while
maintaining 15%+ Group ROCE target
Committed to pursue strategic investments and long-term research program while consistently
delivering strong returns to shareholders
We will make further progress in the
execution of our growth strategy through
2019.
However, we expect that REBIT growth in
2019 will be tempered by the present
subdued demand in the automotive and
consumer electronics sectors, combined
with increased depreciation charges, R&D
and startup costs as well as the timing of
new capacity.
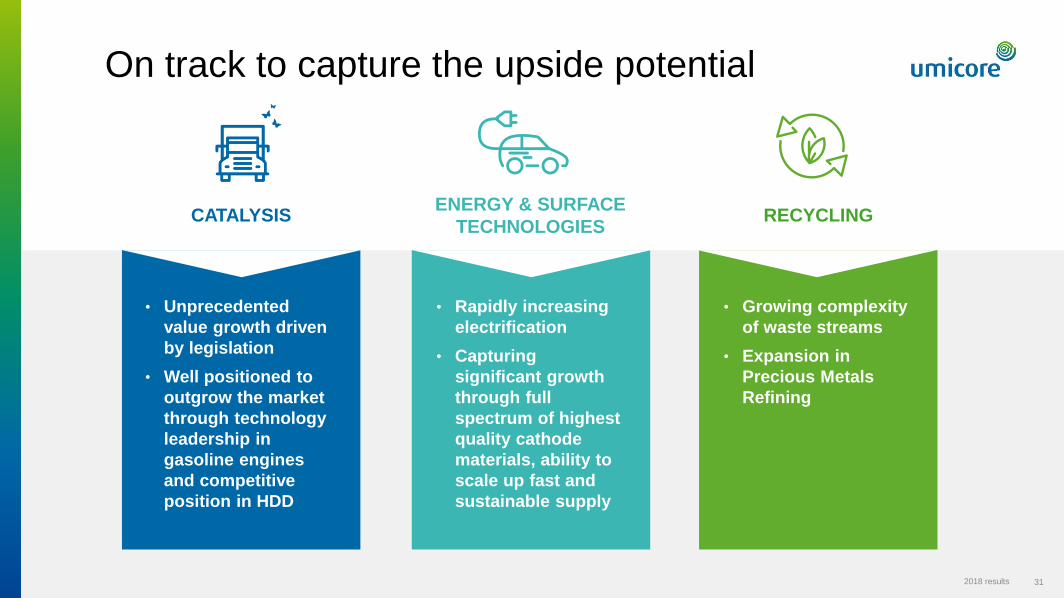
On track to capture the upside potential
2018 results 31
• Unprecedented
value growth driven
by legislation
• Well positioned to
outgrow the market
through technology
leadership in
gasoline engines
and competitive
position in HDD
CATALYSISENERGY & SURFACE
TECHNOLOGIESRECYCLING
• Rapidly increasing
electrification
• Capturing
significant growth
through full
spectrum of highest
quality cathode
materials, ability to
scale up fast and
sustainable supply
• Growing complexity
of waste streams
• Expansion in
Precious Metals
Refining
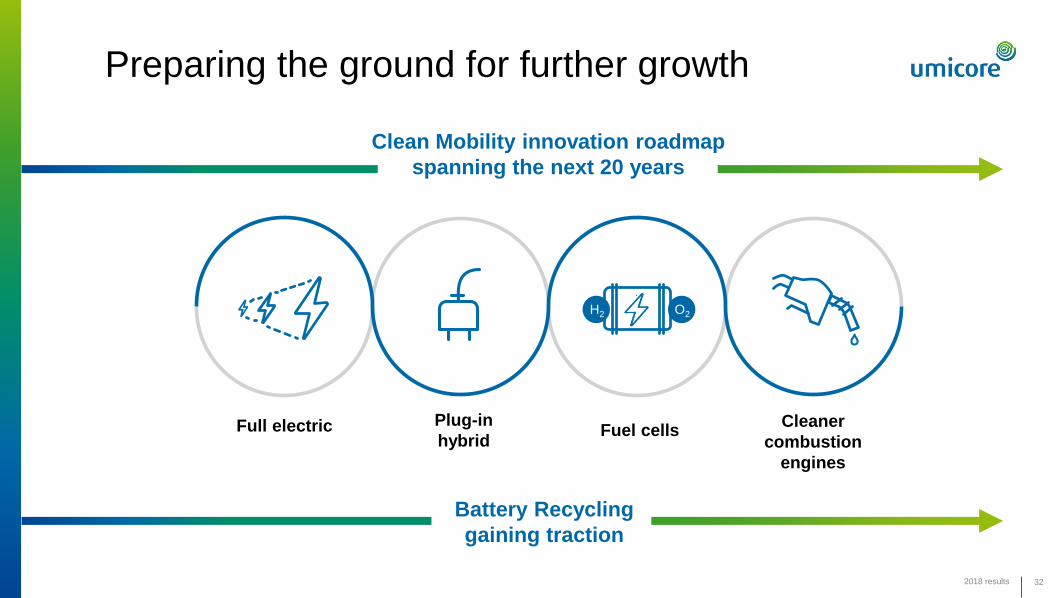
Preparing the ground for further growth
32
Full electric Plug-in
hybridFuel cells
Cleaner
combustion
engines
Clean Mobility innovation roadmap
spanning the next 20 years
Battery Recycling
gaining traction
2018 results
H2 O2
Q&A

Financial calendar
25 April 2019
29 April 2019
30 April 2019
2 May 2019
31 July 2019
Ordinary General Meeting of Shareholders
Ex-dividend date
Record date for the dividend
Dividend payment date
Half Year Results 2019
`
2018 results 34
Financial calendarForward-looking statements
This presentation contains forward-
looking information that involves risks
and uncertainties, including statements
about Umicore’s plans, objectives,
expectations and intentions.
Readers are cautioned that forward-
looking statements include known and
unknown risks and are subject to
significant business, economic and
competitive uncertainties and
contingencies, many of which are
beyond the control of Umicore.
Should one or more of these risks,
uncertainties or contingencies materialize,
or should any underlying assumptions
prove incorrect, actual results could vary
materially from those anticipated,
expected, estimated or projected.
As a result, neither Umicore nor
any other person assumes any
responsibility for the accuracy of these
forward-looking statements.
2018 results 35