Embed Size (px)
Citation preview

NOTE TO USERS
The original manuscript received by UMI contains pages with print exceeding margin guidelines, and slanted print. Pages
were microfilmed as received.
This reproduction is the best copy available
UMI

THE INFLUENCE OF FLY ASH AND EARLY-AGE CURING
TEMPERATURE ON THE DURABILITY AND S W N G T H OF HIGH
PERFORMANCE CONCRETE
Christopher Michael Evans
A thesis submitted in conformity with the requirements
for the degree of Master of Applied Science
Graduate Department of Civil Engineering
University of Toronto
O Copyright by Christopher Michael Evans, 1997
National Library 1+1 of Canada Bibliothèque nationale du Canada
Acquisitions and Acquisitions et Bibliographie Services services bibliographiques
395 Wellington Street 395. rue Wellington OttawaON K1AON4 Ottawa ON K I A O N 4 Canada Canada
The author has granted a non- L'auteur a accordé une licence non exclusive licence allowing the exclusive permettant à la National Library of Canada to Bibliothèque nationale du Canada de reproduce, loan, disiribute or sell reproduire, prêter, distribuer ou copies of ths thesis in microform, vendre des copies de cette thèse sous paper or electronic formats. la forme de rnicrofiche/fih, de
reproduction sur papier ou sur format électronique.
The author retains ownership of the L'auteur conserve la propriété du copyright in this thesis. Neither the droit d'auteur qui protège cette thèse. thesis nor substantial extracts fkom it Ni la thèse ni des extraits substantiels may be prhted or othewise de celle-ci ne doivent être imprimés reproduced without the author's ou autrement reproduits sans son permission. autorisation.
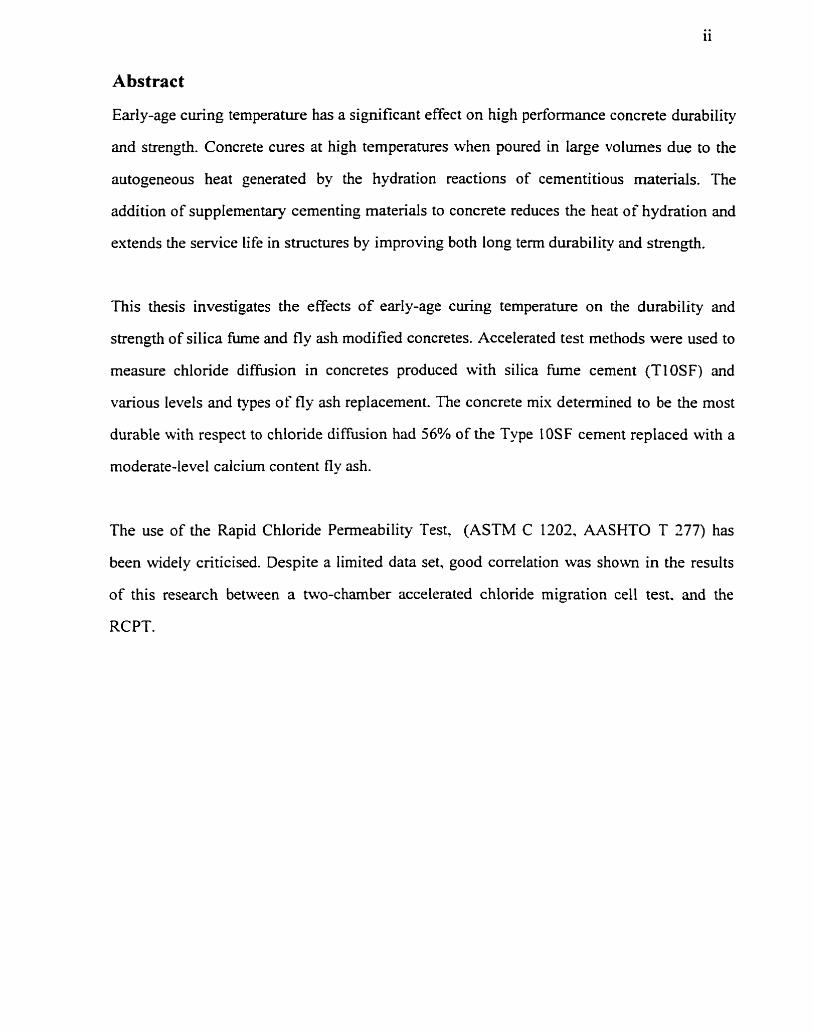
Abstract
Early-age curing temperature has a significant effect on high performance concrete durability
and strength. Concrete cures at high temperatures when poured in large volumes due to the
autogeneous heat generated by the hydration reactions of cementitious materiais. The
addition of supplementary cementing materials to concrete reduces the heat of hydration and
extends the service life in structures by improving both long term durability and strength.
This thesis investigates the effects of early-age curing temperature on the durability and
strength of silica fume and fly ash modified concretes. Accelerated test methods were used to
measure chlonde difision in concretes produced with silica fume cernent (TIOSF) and
various levels and types of fly ash replacement. The concrete mix determined to be the most
durable with respect to chloride diffusion had 56% of the Type 1 OSF cernent replaced with a
moderate-level calcium content fly ash.
The use of the Rapid Chloride Penneability Test, (ASTM C 1202, AASHTO T 277) has
been widely criticised. Despite a limited data set, good correlation was shown in the results
of this research between a two-chamber accelerated chloride migration ce11 test. and the
RCPT.

Acknowledgments
1 would like to sincerely thank Professor Michael Thomas for his supervision throughout this
endeavour. 1 aiso wish to thank the Department of Civil Engineering at the University of
Toronto and the Ontario Centre for Materiais Research for their financial assistance, and
Lafarge Canada Inc. for cementitious materials and chemical analyses. 1 was forninate to
have a supervisor who, while keeping me on track, nevertheless remembered and reminded
me that "some things are more important than concrete," and 1 thank him for his tnendship
arid for his fabulous curry recipe.
My deepest thanks to my parents for their love and support, personally and financially,
throughout this project, and throughout my life. And to my wonderhl housemates,
particularly my roomrnate, at 54 Hewitt Avenue, for their patience, humour and fnendship
over the past 29 months, 1 am forever indebted. Thanks also to my sister and my aunts for
many excellent dinners, and to my nephew Alistair for his laughter and t e m .
The ever expanding concrete materials laboratory at the University of Toronto provided a
fnendly environment and 1 thank Professors Nataliya Hearn and Doug Hooton and al1 of the
students and research staff for their conscientious assistance. Particularly 1 thank Roland
Bleszynski, Pat McGrath, Ursula Nytko, Jan Cao, Evan Bentz, Ali Evans. Terry Ramlochan.
Helen Yip, Steve Demis, Joe Ramani and Dana Drmanic for their many and varied
contributions to my research.
In Kingston I thank Gregg Logan, Che Wojtyk, Matthew Kaye, and my parents for their
Fnendship and support, and for access to facilities at Queen's University, the Royal Military
College of Canada, and at home.
CONTENTS .................................................................................................................. 1 NmODUCXON 1
................................................................ 2 .2 . SUPPLEMMARY C E M ~ W G MATEMALS 10 2.2.1. Silica Fume ........................................................................................................ 11 2.2.2. FIy Ash ............................................................................................................... 11 2.2.3. SIag ............................................................................................... 12 2.2.4. Effect of Supplementary Cementing Materials on Diffusion .......+.................... 13
............................................................... 2.2.5. Effect of SCM's on Chloride Binding 15 2.2.6. Effect of SCM's on ChIoride Thresho[d ............................................................ 17
8 . APPENDICES
Appendix A BuIk D i f i i o n Test Data
Appendix B Migration Ce11 Data and Sarnpie Calculations
FIGURES
Figure 2.1 . Temperature rise with t h e in 28.4m3-block for control concrete with a Portland
cement content of 400 kg/rn3 . [Langley et al, 1 9921 ................................................... 7
Figure 3.1 - High temperature curing regime used in this work imposed on measured large
concrete block adiabatic curing temperatures . [Barnforth 19801 ........................a.*... 34
Figure 3 -2 - Chloride migration test apparatus . wcGrath, 1 9961 ........................................... 36
Figure 4.1 . Ambient cured samples çtrength gain .................................................................. 44
Figure 4.2 - Oven cured saples Swength gain ........................................................................ 45
Figure 4.3 . Compressive Strengths at 1 82 Days ..................................................................... 45
Figure 4.4 . A typicd chlonde bulk difhision profile . Sample is knbient Cured CESFZ,
stored in 0.5 m o n NaCl, 0.3 moVL NaOH at 23°C for 182 days ........................... 47
Figure 4.5 . 70C Bulk Difiion Test Coefficients .................................................................. 48
Figure 4.6 . 23°C Bulk Diffusion Test Coefficients ................................................................ 48
Figure 4.7 - 48°C Bulle Diffusion Test Coefficients .............................-.................................. 49
Figure 4.8 - Effect of Temperature on Diffusion Coefficients [Page et al, 198 11 W.....*............ 50
Figure 4.9 - Apparent Diffusion Coefficients fimn the Bulk Diffusion Test. .......................... 51
Figure 4.10 . Relationship between Fly Ash Content, Temperaime and Cl- Diffusion p h i r et
ai, 19931 ..................................................................................................................... 52
Figure 4.1 1 . Bulk Difhsion Coefficients for sarnples stored at 23OC .........o........................*. 53
Figure 4.12 . A typical migration cell concentration profile . Chloride conducted in mg,
measured by silver nitrate titration, plotted venus time . Sample is oven cured
CEFS25. .................................................................................................................... 55
Figure 4.13. Migration Ceil Breakthrough Time Diffusion Coefficients ........a......................- 57
Figure 4.14 . Migration Ce11 Steady State Diffusion Coefficients. .......................................... 58
Figure 4-15 . Modified Migration Cell Diffusion Coefficients ............................................... 60
Figure 4.16 - Effect of Fly Ash Type on Diffusion Coefficients for Ambient Cured Samples.62
Figure 4.17 - Effect of Fly Ash Type on Diffusion Coefficients for Oven Cured Samp1es.-62
Figure 4.1 8 - RC'T - Ambient Cured Sample Resdts .-... . .. ... ....... - ..... .-. ..-. ...... . ...... .. . ... . .. . .. .... 64
Figure 4-19 - RCPT - Oven Cured Sample Results .................................... ............. .......- ........ 64
Figure 4.20 - RCPT - Effect of Fly ksh Content, Arnbient Curing, 28 Day T e s t s - - - - ~ - 65
Figure 4.21 - RCPT - Effect of Fly Ash Content, Ambient Curing, 182 Day Tests-----.--------- 66
Figure 4.22 - RCPT - Effect of Fly Ash Content, Oven Curing, 28 Day Tests - - * - - - - - - - - - . - . o . - . - g - - 66
Figure 4.23 - RCPT - Effect of Fly Ash Content, Oven Curing, 182 Day Tests - - . - - - - - - * . - - - . . - . . o o 67
Figure 5.1 - Dur vs. RCPT Results ........- ................ --..--........- .......... . ..... ... .................. . ............ 69
Figure 5.2 - Dur vs, RCPT Resdts ...... . .......... . ............. ..----..- ....... ..........-......-... ...................... 70
Figure 5.3 - Effect of time on ambient cured RCPT test data ......... . .......................... . ............. 78
Figure 5.4 - Effect of time on aven cured RCPT test data ..... ..... .. . . . . .. ... . . .. . .. . .... ... .. . .. ... . . .. .. .. . . 78
Figure 5.5 - Time Dependence of Ambient cured RCPT s~~p~es~---~~-...--.-...---.---.~..~~~~~~~~- 82
. . . V l l l
TABLES
Table 2.1 - Nonvegian test. Rate of Chlonde Penetration in ppmlday. [Detwiler, 19931 ..-*..* 14
Table 2.2 - nireshold Chloride Levels [Thomas, 1 9961 . ...... .. .. .... .. ... . .-. . - ... . . ..... . . . . . .. . . . . . . .. . .. . . . . 18 Table 3 -1 - Chemical Andysis of Cementitious Materials . . . . . . . . . . . . . . . . . . . . . -. . . . . . . . . . . . . . . . . . . . . . . . . . . . . . . . 30
Table 3.2 - Bogue Compositions of the Host T20 Cernent pogue, 1955].--------*-*.--**.--.*---..--- 30
Table 3 -3 - Mix Designs ..... . . .. ... .. ..... .. . ... . .. ... . . . . . . -. .. . .. .. . . . . . ..-. . . . . . . . . . ... .. . . . . . . .- .. . . . . . .. .. . . . . . . . . . . . . .. . .. . . 32
Table 4.1 - Fresh Mix Properties . .... .. . . . . . .. .. . . . . . -. . ... .. . .. .. . . . .. . ... . . .. . . . . .........- .. . . . . . . . . . .. . . . . . . . . . . . . . . . . . . . 43
Table 4.2 - Strength Properties (MPa) (Average of three replicates). . . - .- .~~-~----~~--. .------~---~~~ 43
Table 4.3 - 1 1 OOC Propond Pororsity Values (O/o) .. ..... . ... . . .. . .. .. . ..... ....... . . .. .... . .. . ... .... . . .--. . . .... .. . 46
Table 4.4 - Apparent Diffusion Coefficients nom Bulk Diffusion Test (x10 -14 m2/s ) ..-..--.-. 47
Table 4.5 - Migration Ce[l Diffusion Coefficients (*1 0-'4m2/s) . . ... . . . . . ... . . .. . . .. . . .. . .. . .. . .. . . . .... . .... 56 14 2 Table 4.6 - Modified Migration Ceil Diffusion Coefficients (x 10- m /s) .-.-.*.----------------------. 59
Table 4.7 - Rapid Chlonde Permeability Test Data (Average of two replicates) O - - - - . - - - - . - - - - - - - . - 63
Table 5.1 - Ranking of Arnbient Cured Mixes in Difision and RCPT Tests-.....*--*------.---*---- 72
Table 5.2 - Ranking of Oven Cured Mixes in Diffusion and RCPT Tests 72
Table 5.3 - Overali R d i n g of Mixes ..................................................................................... 73

INTRODUCTION
The predominant area of concrete research has always been structurai, with the prime
consideration being the strength of the concrete. To this end, concrete research
investigating the eariy age curing temperature has focused primarily on the strength
properties, often being directed by the precast concrete industry. A strength rneasurement
can help to indicate the total porosity of the concrete, but says nothing about the
continuity of the pore structure. Although the durability of these concretes is at l e s t as
important fiom an economical standpoint, direct investigation into the effects of early-age
curing temperature on concrete durability has been scarce.
Increasingly cornmon however, are problems of detenoration and failure of concrete
structures due to corrosion of the reinforcing steel, caused by penetration into the concrete
of chioride ions present fiom road deicing salts and in marine environments. Lnitially, the
presence of chloride ions around the steel lowers the pH and breaks down the protective
passivating layer, and the comosion process begins. The chloride ions subsequently
accelerate the corrosion process. Reinforcement corrosion due to the attack of the steel by
deicing and marine salts is costing astmnomical arnounts in repair and rehabilitation.
Hence, there is an increasing amount of research being done to investigate methods of
preventing corrosion, or to minimize damage where it has already begun.
The time at which corrosion is initiated and the rate at which it proceeds are dependent
upon the rate of diffision of the chloride ions through the concrete. Although there are
alternative solutions such as impermeable coatings for the concrete and epoxy coatings
for the steel, in most situations the most economical solution is to improve the concrete
itself such that the resistance to penetration of chioride ions is improved.
During early age c u ~ g , concrete expenences an uicrease in temperature due to the
exothemiic hydration of cernent. The pouring of large concrete masses in projects such as
bndge abutments, gravity dams, and offshore oil projects causes considerable autogenous
heating and temperature increase. High temperatures also occur in the precast concrete
industry, where steam curing has been an accepted method of accelerating the strength
gain for many years. This method consists of curing concrete in steam at atmosphenc
pressure, at temperatures of up to 70°C. High early-age curing temperatures have a
significant effect on the concrete microstructure and concomitantly, on concrete
durability. This phenornenon is often negated or overlooked in research where small
specirnens are maintained at the ambient laboratory temperature throughout the curing
period.
The use of fly ash and silica fume is becorning more cornmon because they improve
concrete durability and strength, especially where high early age curing temperatures
occur. High replacement levels of fly ash are uncornmon however, because of resistance
to change by the cernent industry and because of concerns about the early-age strength
and the quality of concretes produced with high cernent replacement levels.
This work was undertaken to improve the understanding of the effects of the early age
curing temperature on the durability of various concretes, al1 of which were modified by
silica fume and by various types and replacement levels of fly ash. Concretes produced
with as much as 56% replacement of the cernent with fly ash were shown to be of
excellent durabi lity and strength.
Chapter 2 contains a detailed literature review of the many inter-related aspects associated
with chlonde transport into concrete. Chapter 3 details the experimental procedures

which were undertaken in this research project, and a surnmary of the test results is
contained in Chapter 4. Individual results for every test undertaken are contained in the
appendices. Discussion of results and cornparisons and correlation of results with
previously published data are contained in C hapter 5. Conclusions and recornmendations
follow in Chapter 6.
LITERATURE REVIEW
In theory, reinforced concrete structures should be very strong and durable. Steel and
concrete are a good combination, both physicaliy and chemically. Hardened concrete
bonds to the steel, surrounding and protecting it, while steel provides strengthening
reinforcement for the concrete. Concrete's pH, generally above 13, provides an alkaline
environment where steel should not be susceptible to corrosion.
Corrosion of the reinforcing steel however, is costing incredible amounts in repair and
rehabilitation [Dunker and Rabbat, 1993; Stix, 19931. It has been calculated that $1 0
million is spent annually in Canada on production of concrete, and $20 billion is spent on
repair, rehabilitation and related expenses [Concrete Canada, 19941. There is an
increasing amount of research being performed to investigate rnethods of corrosion
prevention, or to minirnize corrosion damage where it has already begun. There is an
obvious need to improve the product, but inevitably there will aiso be a perpetual need for
repair and rehabilitation.
One of the main causes of deterioration of concrete structures is chloride induced corrosion
of the ernbedded steel reinforcement, caused by the penetration of chlonde ions into
reinforced concrete. Concrete is exposed to chlondes fiom salts used for de-icing purposes,
and in sea water in marine environments.
Assuming it will extend the service life of stmchues in severe environrnents, there has been
a gradua1 acceptance of high performance concrete (HPC). HPC is characterized by a low
waterkementitious matenals ratio, (generally <0.35), high dosages of superplasticizer and
the incorporation of supplementary cementing materiais.
Chioride ions may be present in concrete in a number of states [Arya et al, 19871:
f i e , dissolved or dissociated in the pore solution.
chemically bound, where they have chemically reacted with the hydration
compounds of cernent, particularly tri-calcium alunilnate (C3A) to f o m
calcium rnonochloroaluminate, Friedel's salt.
physically bound or attracted to pore surfaces by weak Van der Waal's forces.
in a chemisorbed state.
Only fiee chloride ions influence the deterioration of reinforced concrete, by initiating and
accelerating the corrosion of the steel reinforcement.
Due to the high alkaiinity of the pore solution of concrete, dissociated hydroxyl ions
create a passive film of iron oxide which surrounds the steel relliforcement. A lowering of
the pH by penetration of fkee chloride ions through the concrete cover to the steel, or by
the carbonation of the concrete cover due to penetration of atmospheric carbon dioxide,
can cause breakdown of the passive layer. There is continuous opposition to passivity
breakdown by the film-repairing action of hydroxyl ions (OH-) ~ a u s m a n n , 19671.
Corrosion can start when the ratio of fkee chloride ions to hydroxyl ions exceeds a threshold
value which is influenced considerably by the type of cement used, the type and
replacement level of supplementary cementing materials (SCM's), and the cation associated
with the chloride ion, arnong other factors. Subsequently, the presence of chloride ions can
accelerate the corrosion process.
Initial penetration of chloride ions into concrete can occur due to contaminated water being
absorbed into the concrete due to hydraulic pressure gradients or capillary suction, but the
process occurs primarily via non-steady state diffusion. The time at which corrosion is
initiated and the rate at which it proceeds are dependent upon the rate of diffusion of the
chloride ions through the concrete, and hence, highly dependent upon the concrete itself.
Although there are alternative solutions such as impermeable coatings for the concrete
and epoxy coatings for the steel, in most situations the most economical solution is to
improve the concrete itself, so that the resistance to penetration of chlondes is improved.
A variety of approaches can be taken to make concrete more resistant to chloride ion
penetration. A low total water content, a low water to cementitiou materials ratio (W/CM)
and the use of SCM's are al1 of prime importance. The cover depth, or depth of concrete
covering the reinforcing steel, curing regimes, compaction, and construction details are also
important considerations.
Chloride diffusion in concrete is a complex phenornenon which is poorly understood.
Binding reactions between diffusing chloride ions and the hydrated compounds of cernent
delay the progress of chlonde penetration. The volume of large, capillary pores is initially
set by the total water content of the concrete. Over t h e , reaction products cause a
refinement in the pore structure of the concrete, which serves to reduce the diffusion rates.
Conversely, cracks caused by shrinkage, k z i n g and thawing, alkali aggregate reaction or
structural effects can shorten the distance chlondes must travel to reach the reinforcing
steel.
High temperature curing occurs in large scale projects, where temperature rise is a naturai,
autogeneous process, caused by the exothermic hydration reaction of the cernent. This
temperature nse begins irnmediately, and depending on the size of the pour, the natural
curing cycle can cause sustained curing at temperatures of up to 80°C for several days.
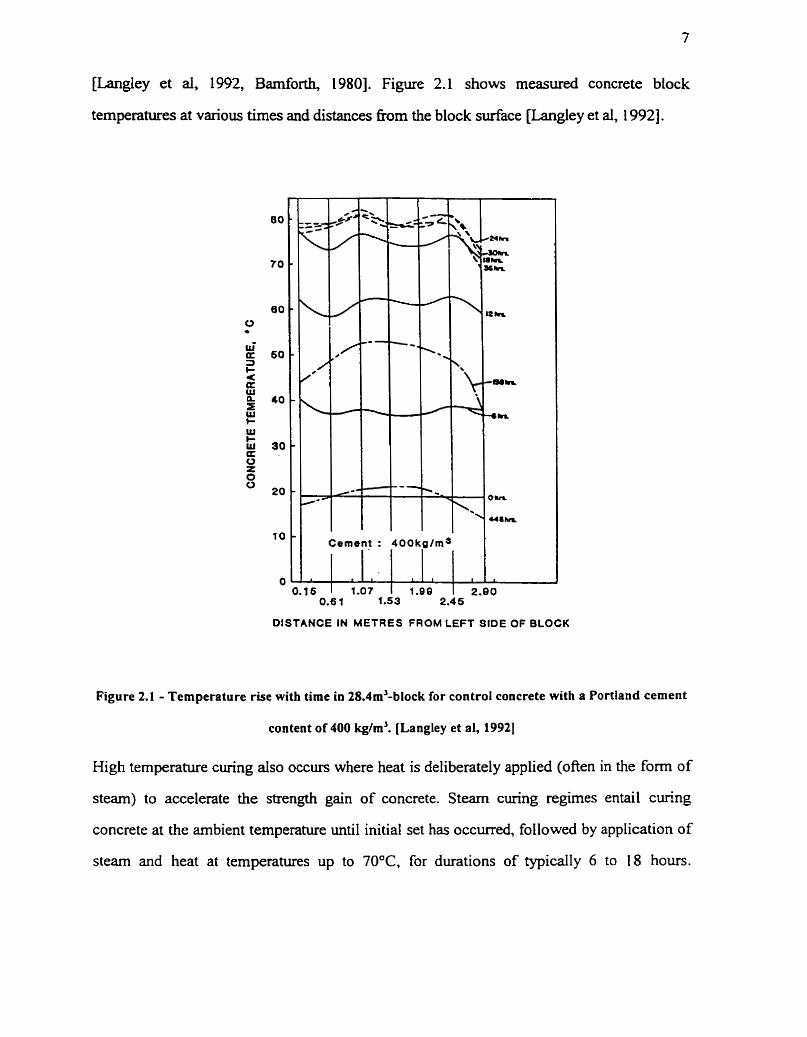
[Langley et al, 1992, Barnforth, 19801. Figure 2.1 shows measured concrete block
temperatures at variou times and distances fkom the block surface [Langley et al, 19921.
Cernent : 400kplrni 1
DISTANCE IN METRES FROM LEFT SlDE OF BLOCK
Figure 2.1 - Temperature rise with time in 28.4111'-block for control concrete with a Portland cernent
content of 400 kg/rn'. [Langley et al, 19921
High temperature curing also occurs where heat is deliberately applied (often in the form of
stearn) ta accelerate the strength gain of concrete. Steam c e n g regimes entail cur.ng
concrete at the arnbient temperature until initial set has occurred, followed by application of
stearn and heat at temperatures up to 70°C, for durations of typically 6 to 18 hours.
Accelerated curing regimes increase the efficiency and economy of precast production
plants by allowing for earlier handling and removal of concrete h m the moulds or
prestressed beds. Unfortunately, this can ais0 have deleterious effects on the durability of
the precast product.
There has been little research perfonned investigating the effects of elevated curing
temperatures on concrete durability. Since the early 1930's however, extensive literature has
been produced on the effects of eady age curing temperature cycles on the strength
development and the microstructure of concrete. Much of the research has b e n on
compressive strength which has been directed by the precast concrete industry, to optimise
their short, high temperature stem curing regimes.
Davey [1933] published a paper describing research which compared the strengths of
specirnens cured at different ternperatures. Onginating with Davis and Troxell [193 11,
reports ever since have indicated that early strength is improved with an increase in curing
temperature, however, at the age of 28 days and at subsequent ages, this improvement in
strength is negated. Shce the iate 194OYs, reports recommend that a delay prior to the
application of stem, and longer overall steaming periods, are beneficial to early
compressive strength vigginson, 196 1, Saul 195 1, Shideler, 1 9491. Hanson [ 1 9631
determined conditions which optimised these contrasting demands, in fixed cycle tirne plant
operations.
in an extensive study, Klieger [1958] determined that the optimum early-age curing
temperature for the highest eventuai strength was 13OC for OPC, and as low as 4OC for
rapid hardening PC, after measuring the strength of moist cured specimens cured at
temperatures of up to 49OC at 7 and 28 days of age. Field tests reported by Dodson LI9791
support this, claiming a decrease of 1.9 MPa in strength for every increase of 5°C in curing
temperature. Klieger [1958] showed that the effect on water-cured concretes was similar.
Higher water-curing temperattri-es resulted in higher concrete strengihs during the fim few
days, but afler one to four weeks, this was no longer the w e . Neville [198 11 demonstrated
the relationship between compressive strength and curing time of cernent pastes cured at
different temperatures. Pastes cured at lower temperatures, despite lower initial strengths,
have higher eventuai strengths.
Although there are economical benefits of early strength gain, and possible benefits to
drying shrinkage and sulphate resistance, Higginson [1960] and Hanson 119631 indicated
that steam curing had an adverse effect on final compressive strength, heze-thaw durability
and permeability. G j m and Martinsen CI9931 detemiùied that elevated curùig temperatures
of up to 90°C affected neither capillary sorption nor porosity. Their research with a chloride
migration test however, found that high temperature curing at 90°C increased chloride
d i f i i o n at 20°C by a factor of 4.
investigation wjellsen 1990a] into the effect of elevated curing temperatures found an
increase in total porosity. This was predicted by the theory of Verbeck and Heimuth [1968]
who suggested at elevated temperatures that the hydration products do not have suficient
time to disperse evenly before solidification occurs. This has the effect of creating a
rnicrostmcture consisting of relatively dense shells of hydration products around the cernent
grains and an open, porous structure between the grains petwiler et al, 19941.
Backscattered electron irnaging by Kjellsen et al, [1990b, 199 11 provided evidence
supporting this theory. BET parameters obtained fiom desorption isothems, [Radjy and
Richards, 19731 and mercury porosimetry research, [Sellevold 19741 also determined that
curing cernent pastes at elevated ternperatures resulted in a coarser pore structure.
Skalny and Oder [t 9721 examineci the effect of temperature on the hydration of ûicalciurn
silicate (C3S) pastes. They measured the surface areas of hydration products and found at
25°C that the surface area increased continuously with the degree of hydration, but at higher
temperahires, the surface areas reached a maximum and then decreased with tirne. This was
explained by the existence of recrystallisation processes which result in a coarsening of the
hydration products cured for prolonged penodç at elevated temperahires. They also found
that the degree of hydration at 28 days decreased with increases in the hydration
temperature. Similar results were reported by Kondo et al., [ 19731.
As expected, the uneven distribution of hydration products has an efTect on the strength as
well as porosity. A high early age curing temperature causes porosity in the interstitial space
and the gekpace ratio in the interstices to be lower than it would be for concretes at the
sarne degree of hydration, cureci at lower tempemes [Neville, 198 11. Detwiler et al [ 199 1 ]
found that the calcium silicate hydrates (CSH) near the cernent grains were stronger and
more dense in pastes cured at higher temperatures. The overall strength in these specimens
was lower however, and this was amibuted to the strength being controlled by porous CSH
in the interstices between the cernent grains. These local areas of wealcness lowered the
overall strength of the paste, and therefore the concrete. Patel et al [1995] observed using
backscattered electron imaging that ordinary Podand Cernent (OPC) concrete cast at 85OC
increased the coarse porosity, and caused significant microcracking.
Despite precast industry claims that highquality, durable concretes can be produced at high
curing temperatures, the bulk of research has shown that elevated curing temperatures
reduce the resistance to chionde diffusion of plain Portland cernent concretes. Little
research has ken done however, to investigate the effect of elevated curing temperatures on
the durability of concretes produced with supplernentary cernentitious materials.
The use of supplernentary cementing materials has becorne common in the construction
industry to reduce the initiai heat of hydration caused by the exothermic hydration of
cernent. This has the concomitant benefit of reducing stockpiles of these industrial waste
products. There are ais0 potentid benefits to the concrete of improved strength and
durability. SCM's commoniy used in the construction industry are fly ash, slag, and silica
fume.
2.2.1. Silica Fume
Silica fume is the by-product of metallurgical processes used in the production of silicon
and ferrosilicon alloys. It is comprised of extremely fine sphencal particles of amorphous
silica, typically > 90% Si02 of average diarneter of O. 1 Pm, with a high surface area in the
order of 20,000 m2/kg. If silica fume particles are adequately dispersed throughout the
mix, significant improvement to the strength and durability of concrete can occur.
Together with the use of water reducing admixtures, silica h e has been largely
responsible for the development of high performance concretes. In Canada, silica fume is
generally used in the form of a blended cernent containing up to 10% silica fume. (10%
silica fume is the maximum cernent replacement level allowed in construction in Canada, as
specified by CSA A B . 1).
2.2.2. Fly Ash
Fly ash is gathered fiom the flue gases of coal-fired thermal generating plants by
mechanical and electrostatic precipitators. Fly ash is compnsed of fine, glassy, spherical
particles (1 to 150 pm) of alumino-silicate glasses containing various proportions of
calcium, iron, magnesium and alkali metals. The exact composition of a specific ash varies
depending upon the coal composition and the burning conditions in the boiler. Used as a
supplementary cementitious matenal, it reacts with water and lime released by the
hydrating cernent. As a cheap replacement for cernent, the concrete produced is also more
economical [Gifford et al, 19931. Fly ash is divided by ASTM C6 1 8 into two categories:
Class C
ASTM requirement; SiO2 + &O3 + F403 > 50%
usually produced from lignite or sub-bituninous coals
high calcium contents, typically 8 to 30% Ca0
may possess some hydraulic properties in addition to pozzolanic properties
Class F
ASTM requirement; Si02 + Al2 O3 + Fe203 > 70%
usually produced £?om bituminous or lignite coal
low cdcium content, typically less than 8% Ca0
possesses pozzolanic properties (needs source of lime or other activator to react)
2.2.3. Blastfumace Slag
Blastfumace slag is the by-product of the iron-making indusw. It is the surface residue
consisting of a mixture of calcium, aluminum and magnesium silicates. Granulated slag,
ground to the fineness of cernent has good hydraulic and pozzolanic properties. The
reactivity of slag, as with fly ash, is dependent upon the chernical and mineralogical
composition. Pozzolanic reactions b e ~ e e n slag or fly a h , and hydrating cernent cause the
formation of more calcium-silicate-hydrates (CSH), and a less porous and less continuous
pore structure.
2.2.4. Effect of Supplementary Cementing Materials on Dinusion
It is anticipated that both the strength and durability of concrete decrease as porosity
increases. Diffuçion occun through pore solution, hence with an increase in porosity,
difiivity increases. In concrete cured at low temperatures, the products of hydration have
sufficient t h e to diffuse throughout the cernent paste maû-ix and precipitate uniformly. The
rate at which supplementary cernenting materials react is slower than the hydrating reaction
of cernent. This ailows better dispersion of the hydration products before the paste hardens.
The use of these supplementary cementing materials decreases the porosity of the concrete,
increasing long-terni strength and durability, and reducing the likelihood of early thermal
cracking. [Barnforth 1984, Mangat and Malloy, 19911
Page et al [198 1 ] found h t SCM modXed cernent bIends had a greater total and more
coarse porosity than OPC alone, but the diffusion coefficients were lower. One explanation
for this is that SCM modified concretes ciiffer in the geometry of the pore structure. Despite
having a higher overall porosity, the reaction of pozzolanic materials with calcium
hydroxide is thought to block pores at critical locations WcGrath, 19961. Roy and Parker
[1983] used mercury intrusion porosimetry to conclude that in SCM systems, there is a finer
pore structure.
Roy and Parker [1983] with cernent-slag pastes, Marsh et al [1985], with cement pastes
containing fly ah, and Villadsen [1989] with cernent and silica fume pastes have suggested
that supplementary cementing materials improve the performance of concretes cured at
elevated temperatures. Fapohunda [ 1 9921 concluded that although the chloride intrusion
into concretes containing silica fume and slag increased with temperature, these concretes
performed better than OPC concretes cured at higher temperatures.
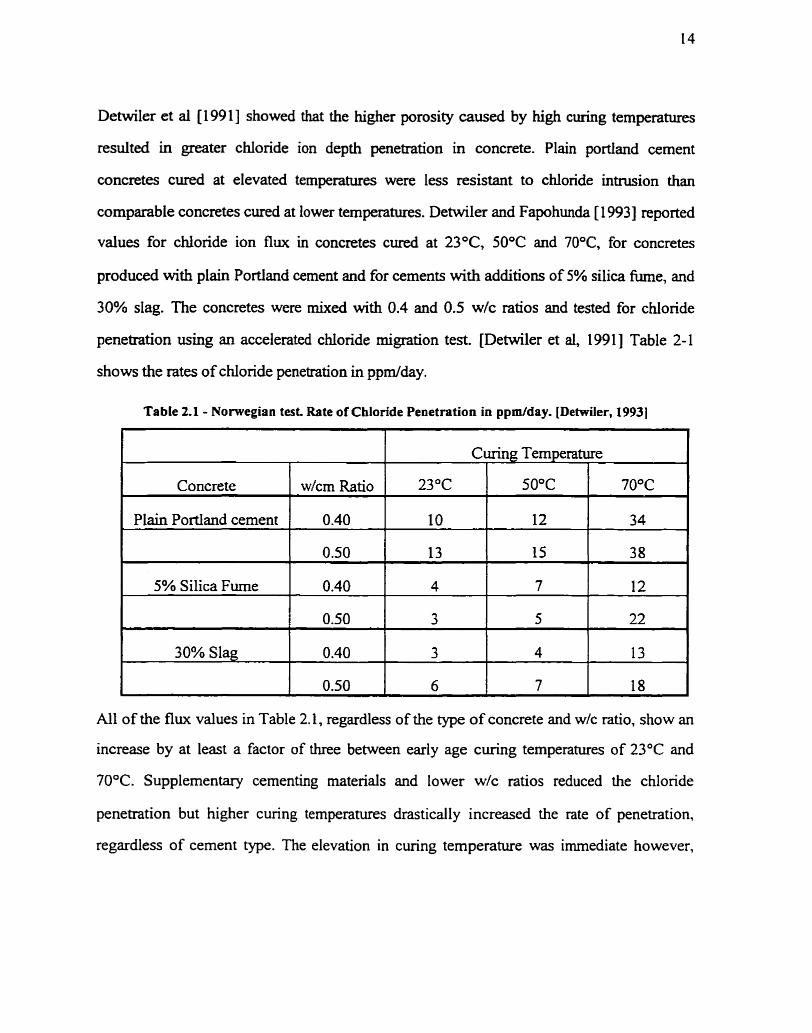
Detwiler et al [1991] showed that the higher porosity caused by high curing temperatures
resulted in greater chloride ion depth penetration in concrete. Plain portland cernent
concretes cured at elevated temperatures were less resistant to chloride intrusion than
comparable concretes cured at Io wer temperatures. Detwiler and Fapohunda [ 1 9931 reported
values for chloride ion flux in concretes cured at 23OC, 50°C and 70°C, for concretes
produced with plain Portland cernent and for cements with additions of 5% silica fume, and
30% slag. The concretes were mixed with 0.4 and 0.5 wlc ratios and tested for chloride
penetration using an accelerated chioride migration test. pehviler et al, 19911 Table 2- 1
shows the rates of chloride penetration in ppdday.
Table 2.1 - Nonvegian test Rate of Chloride Peaetration in ppdday. [Detwiler, 19931
All of the flux values in Table 2.1, regardless of the type of concrete and w/c ratio, show an
increase by at least a factor of three between early age curing temperatures of 23°C and
70°C. Supplernentary cementing materials and Iower w/c ratios reduced the chloride
penetration but higher curing temperatures drastically increased the rate of penetration,
regardless of cernent type. The elevation in curing temperature was immediate however,
Concrete
Plain Portland cement
5% Silica Fume
30% Slag
w/cm Ratio
0.40
0.50
0.40
0.50
0.40
0.50
Curing Temperature
23°C
10
13
4
3
3
6
50°C
12
15
7
5
4
7
70°C
34
38
12
22
13
18
whereas in the precast induûy, steam curing usuaily is delayed until after initial set, so
these results proved to be controversial [Perenchio et al, 199 1, Detwiler et al, 19941.
Almost without exception, research shows that as the curing temperature increases, the final
strength and durability of OPC concretes decmes. Partial replacement of OPC in concretes
cured at elevated temperatures, with materials which react more slowly such as slag and fly
ash, has been shown to improve the strength and durability of these concretes in some
research. Malek et ai, [1985] found that fly ash cured at 38OC had a lower results in the
rapid chloride permeability test than material cured at 27OC. Observations by Cao and
Detwiler [1995] using backscattered electron imaging supported these results showing that
additions of 5% silica fume or 30% slag to concretes cured at elevated curing temperatures
reduced the s i x and continuity of the pores.
2.2.5. Effect of SCM's on Chloride Binding
The ability of hydrates in concrete to bind chlonde ions is a significant factor in chloride
ion diffusion. Chloride ions have been found to react with tri-calcium aluminate (C3A)
[Rasheduzzafar et al, 1992; Arya et al, 1990; Midgley and Illston, 1 984; Page et al, 1 98 1 ;
Mehta, 19771 and it has also been suggested that binding occurs with calcium silicate
hydrates (CSH) [Ramachandran, 1971 ; Beaudoin et al, 1990; Tang and Nilsson, 19931,
though this has been questioned Lambert et al, 19851.
Page and Vennesland [1983] found that the stability of calcium chloroaiuminate hydrates
depends on the alkalinity of the pore solution, and that it is more soluble at lower pH
values. This was supported by Kayyali and Haque [1988] who f o n d for mortar samples
of a lower pH, there were higher concentrations of fiee chloide ions. Supplementary
cernenting materials affect the binding capacity of penetrating chlorides, though their
effect has not been well quantified, and is obviously CO-dependent upon factors such as
carbonation Wyyali and Qasrawi, 19921, which reduces the pH of the pore solution.
Arya et al [1990] and Page and Vennesland [1983] fomd that partial replacement of OPC
with silica fume caused a decrease in the chloride binding capacity of the concrete. This
was attributed to a decrease in the alkalinity of the pore solution. Arya et al [ 1 9901 found
the binding capacity of a 70% OPC replacement with blastfumace slag paste mix to be
higher than d l other mixes, including those with 15 and 30% OPC replacement with fly
ash. This was attributed to an increase in the amount of adsorbed chloride.
Arya et al [1990] and Byfors et al [1986] found that the presence of fly ash increased the
chloride binding capacity, and that the higher the fly ash content, the higher the binding
capacity, due to a higher surface area and adsorptivity of fly ash cernent [Byfors et al,
1986; Roy et al, 19861. This has also been attributed to an increase in the formation of
Friedel's salt after pozzolanic reactions have occurred [Worthington et al, 1989; Qasrawi,
19891.
Unfomuiately, much of the chlonde binding research cited above was performed on
intemal chlorides which were dissolved into the mix water at the time of mixing, a
practice banned in the field. The chlonde binding capacity has been shown to be much
lower with extemal chlorides introduced to hardened concrete [Arya et al, 1990; Midgley
and Illston, 1984; Ramachandran, 197 11 The higher binding ability of internally mixed
chlondes has been attributed to reactions with clinker compounds during hydration.
Tang and Nilsson (19931 developed a comprehensible method for evaluating chloride
binding capacities based on the adsorption fiom solution. Chloride concentrations in
solutions containhg paste and mortar samples were monitored until the concentration no
longer decreased. At this point it was assumed that al1 of the sites available for binding
were occupied, and that the change in concentration corresponded to the amount of
chlorides which had been bound. They proposed that the relationship between bound and
free chloride concentrations could be descnbed by Freundlich isotherms at high fiee
chloride concentrations and by Langmuir isotherms at low fiee chloride concentrations.
2.2.6. Effect of SCM's on Chloride Threshold
Reported threshold chlonde levels required to initiate steel reinforcernent corrosion Vary
tremendously, and are highly dependent on the specific environment. Rosenberg et al
[1989] reported factors having influence on the threshold chloride level as:
cernent composition (C3A, S04, alkali and pozzolan contents) and total
content.
W/CM ratio.
carbonation.
temperature and humidity.
cation associated with chloride.
nature of the steel.
The level of the threshold concentration level of chloride ions that can be tolerated
without significant corrosion occurring to reinforcing steel has been found to decrease
with an increase in fly ash content. The rate of corrosion has also been found to be higher
in fly ash concrete [Arya and Xu, 19951. Thomas [L996] reported the threshold chloride
levels tabulated below.
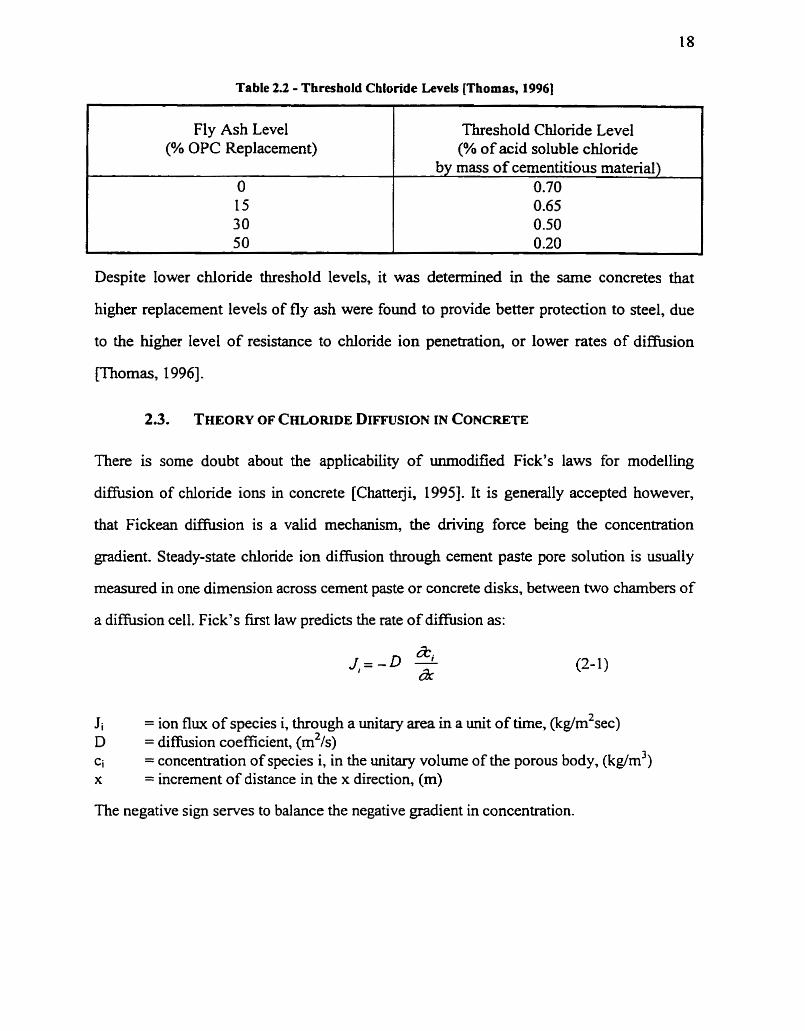
Table 2.2 - ThreshoId Chloride Levels [Thomas, 19961
Fly Ash LeveI (% OPC Replacement)
Threshold Chloride Level (% of acid soluble chloride
Despite lower chioride threshold levels, it was determined in the same concretes that
O 15 30
higher replacement levels of fly ash were found to provide better protection to steel, due
by mass of cementitious material) 0.70 0.65 0.50
to the higher level of resistance to chloride ion penetration, or lower rates of diffusion
[Thomas, 19961.
There is some doubt about the applicability of unmodified Fick's laws for rnodelling
d i f i i o n of chlonde ions in concrete [Chatte@, 19951. It is generally accepted however,
that Fickean diffusion is a valid mechanism, the driving force being the concentration
gradient. Steady-state chloride ion diffusion through cernent paste pore solution is usualiy
measured in one dimension across cernent paste or concrete disks, between two chambers of
a diffusion cell. Fick's first law predicts the rate of diffusion as:
J i = ion flux of species i, through a unitary area in a unit of tirne, (kg/m2sec) D = diffusion coefficient, (m2/s) Ci = concentration of species i, in the unitary volume of the porous body, (kg/m3) x = increment of distance in the x direction, (m)
The negative sign serves to balance the negative gradient in concentration.
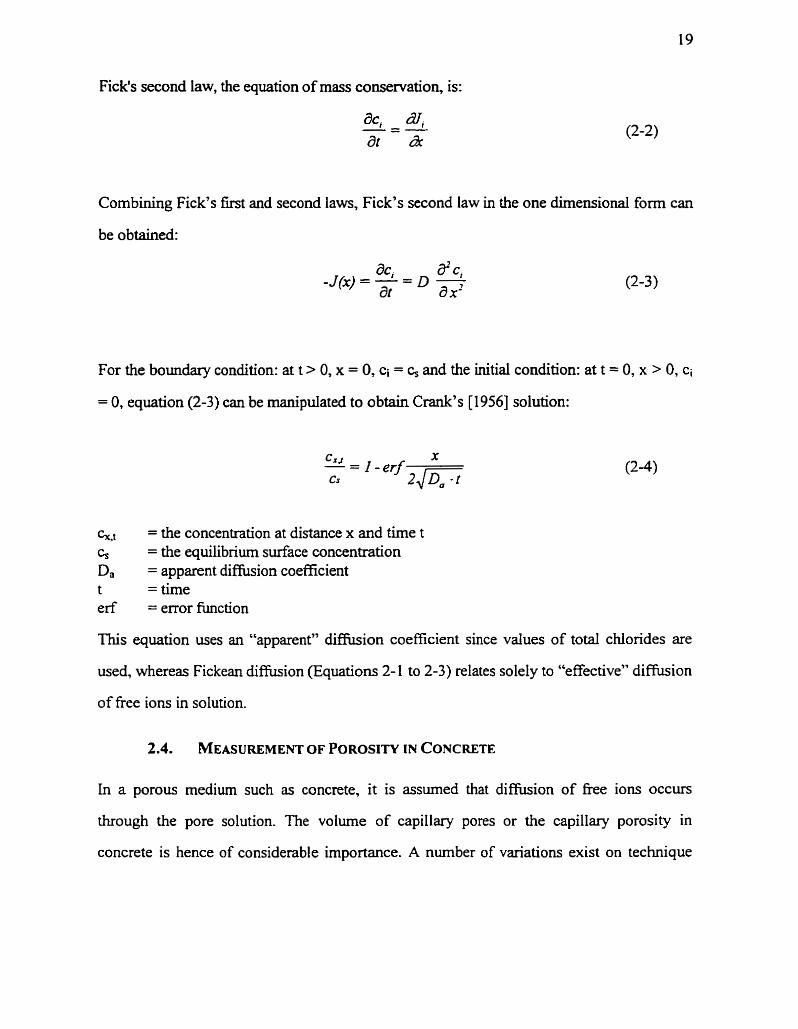
Fick's second law, the equation of mass conservation, is:
Combining Fick's first and second laws, Fick's second law in the one dimensional f o m c m
be obtained:
For the boundary condition: at t > O, x = 0, Ci = c, and the initial condition: at t = O, x > O, ci
= O, equation (2-3) can be manipulateci to obtain Crank's [1956] solution:
%t = the concentration at distance x and time t % = the equilibriurn surface concentration Da = apparent d i h i o n coefficient t = time erf = error hc t ion
This equation uses an "apparent" diffusion coefficient since values of total chlorides are
used, whereas Fickean diffusion (Equations 2- 1 to 2-3) relates solely to "effective" diffusion
of free ions in solution.
In a porous medium such as concrete, it is assumed that diffusion of free ions occurs
through the pore solution. The volume of capillary pores or the capillary porosity in
concrete is hence of considerable importance. A number of variations exist on technique
used to measure concrete porosity but in essence the procedure consists of comparing the
density of concrete d e r saturation with a fluid of known density, with the density of the
same concrete after the evaporable water and saturation fluid (if other than water) content is
driven out WcGrath, 19961.
Equation 2-4 is cornmonly used in predictions of the service Life of concrete structures. If
diffusion coefficients and surface concentrations are known, equation 2-4 can be used to
determine the chloride ion concentration profile in the concrete at any t h e . Altematively, if .
a chloride concentration profile is detemiined by measuring the chloride concentrations at
incremental depths fiom the exposed surface of an existing structure or laboratory
specirnen, diffusion coefficients can be determined by fitthg the equation to the data, and
subsequent predictions can be made.
This technique of measuring naturai, buk difhision has been utilised by many researchers
including Thomas [1991], Sergi et al, [1992] and G j m and Vennesland. [1979]. Test
methods Vary in time and temperature of exposure, and in the solution concentration to
which the sample is exposed. Samples are usually saturated to eliminate capillary suction, to
limit truisport to diaision, and are created such that diffusion is in one direction and on a
semi-infinite surface, so the above boundary conditions can be applied.
Drawbacks of this method are that Crank's solution, (Equation 24), assumes a linear
relationship between bound and free chlorides, which has been shown to be non-linear.
[Sergi et al, 19921. The resulting diffusion coefficient is also a diffusion value averaged
over the entire testing time period. This value has been shown repeatedly to decrease
rnarkedly over time, especially in fly ash and slag modified concretes. Counter-diffusion of
hydroxyl ions out of the samples is another potentid problem, and the use of high
concentration chloride solutions may complicate analysis due to the non-linear nature of
binding. In tests using solutions of high chloride concentration, well above concentrations
encountered in field conditions, the arnount of chionde ions bound is very small,
proportionally. This may mask the true and significant influence of binding.
Because nahiral chloride penetration testing is very t h e consuming, accelerated chioride
migration c d tests are often performed. These tests involve placing a concrete disc between
two electrodes which are immersed in chambers on either side of the disc. The chambers are
usually mled with NaOH and NaCl and an electrical potential is applied across the sample,
to draw the ions through. When the driving force behind diffusion is the potential gradient
as well a s the concentration gradient, Fick's laws must be modified.
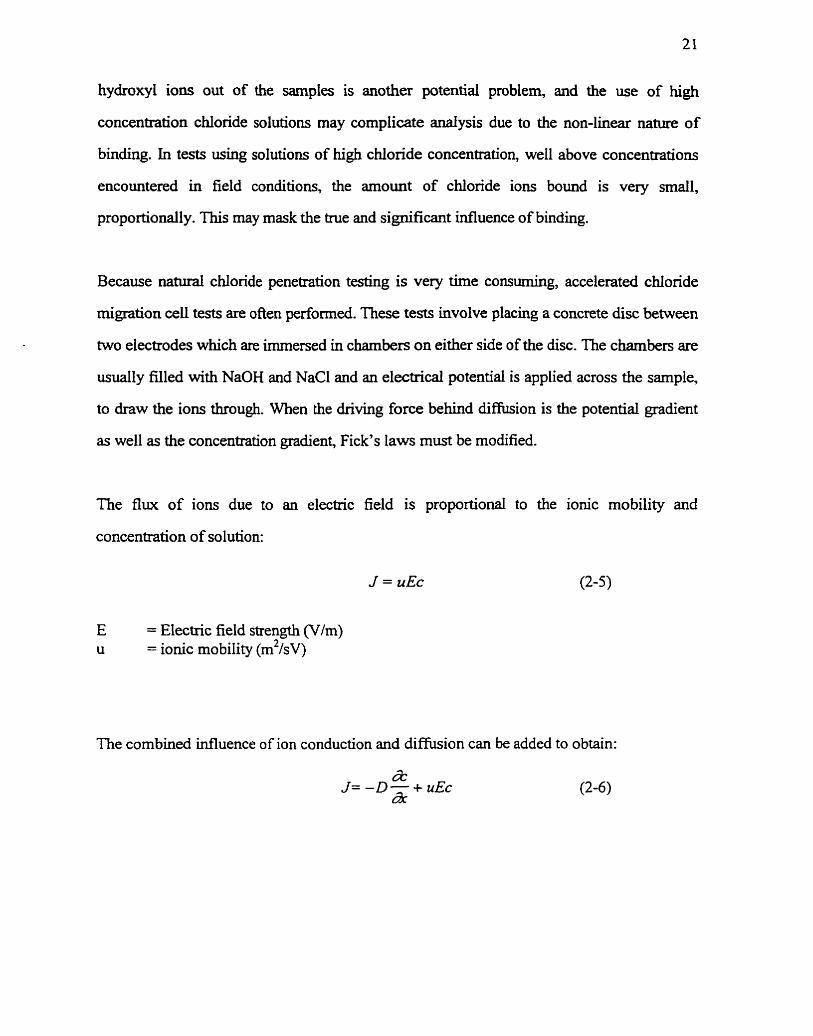
The flux of ions due to an electric field is proportional to the ionic mobility and
concentration of solution:
E = Electrïc field strength (Wm) u = ionic mobility (rn2/sv)
The combined influence of ion conduction and difh ion can be added to obtain:

According to the Einstein reiationship, the ionic mobility is:
D = diffusion coefficient (m2/s) z = i o ~ . valency (equiv/mol) F = Faraday's constant (96486.7 coul/mol) R = gas constant (8.3 143 kJ/mol-K) T = absolute temperature (K)
Combining Equations 2-6 and 2-7 gives:
For the combined e k t of diffusion and conduction, the Nernst-Plank equation (2-9), a
modified version of Fick's second law, (2-2) has been used to describe ion transport in
accelerated chloride ion migration tests [Tang and Nilsson, 19921.
The exact analytical solution for Equation 2-9 is [Tang and Nilsson, 19921:
AV = potential &op across the sarnple (V) 1 = sample length (m) c = pore solution concentration at any depth and time (mo~rn') CO = pore solution concentration at the surface (mol/m3) erfc = the complement to the error fûnction = (1 -erf)
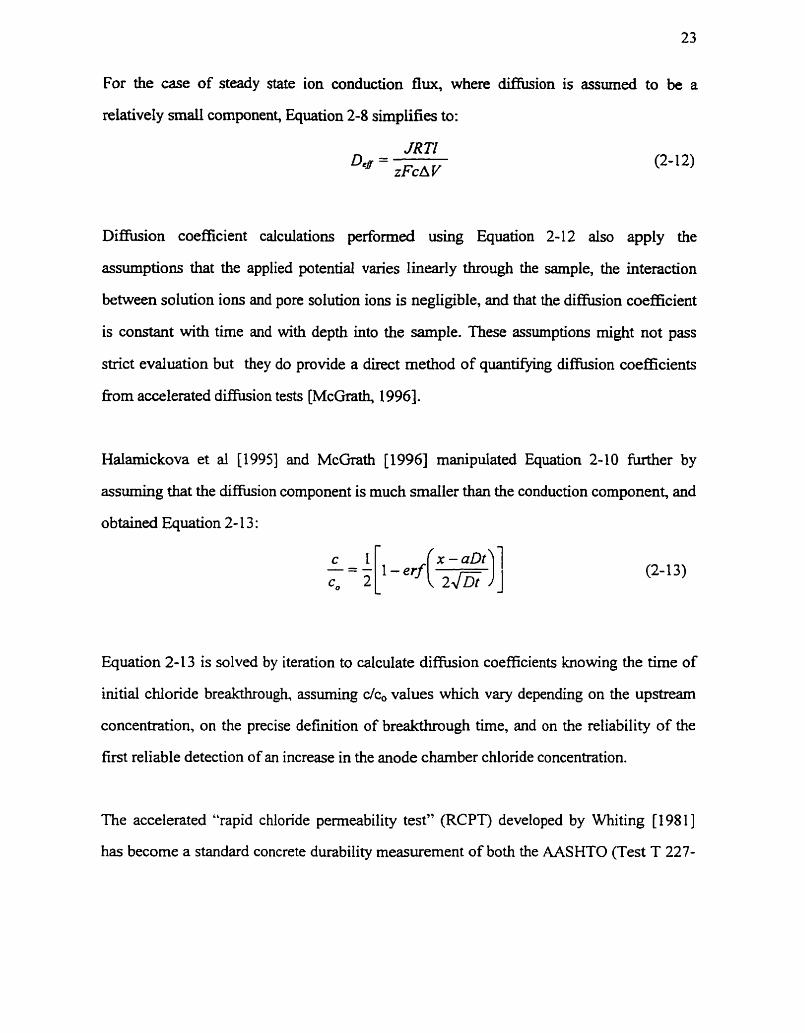
For the case of steady state ion conduction flux, where dinusion is assumai to be a
relatively s m d component, Equation 2-8 simplifies to:
Diffusion coefficient calculations perfonned using Equation 2- 12 also apply the
assumptions that the applied potential varies linearly through the sample, the intemction
between solution ions and pore solution ions is negligible, and that the diaision coefficient
is constant with time and with depth into the sample. These assumptions rnight not p a s
strict evaluation but they do provide a direct method of quantifjmg diaision coefficients
fiom accelerated diffusion tests WcGrath, 19961.
Halamickova et al [1995] and McGrath [1996] manipulated Equation 2-10 M e r by
assuming that the diffusion component is much smaller than the conduction component, and
obtained Equation 2- 1 3 :
Equation 2-1 3 is solved by iteration to calculate diffusion coefficients knowing the tirne of
initial chloride breakthrough, assuming dc, values which Vary depending on the upstream
concentration, on the precise definition of breakthrough tirne, and on the reliability of the
fmt reliable detection of an increase in the anode charnber chloride concentration.
The accelerated "rapid chloride pemeability test" (RCPT) developed by Whiting [198 11
has become a standard concrete durability measurement of both the AASHTO (Test T 227-
83) and the ASTM (ASTM C 1202). A 60 volt potential is applied across a saturaed
concrete sample, and the total charge passed through in six hours is measured in coulombs.
Initially the test ce11 contains 3.0% NaCl on one side and 0.3 N NaOH on the other, and the
potential is applied such that the NaOH side is anodic.
This rapid chloride permeability test has been criticised for various reasons. The test
measures ion transport under a high potential difference. Only the total charge passed in
coulombs is measured, providing no infornation specific to chloride ion. It is difficuit to
estimate chloride d i f i ion specificdy fiom this total coulomb value. The contribution to
this value is likely to be significant h m hydroxyl ions as well as fiom chlonde ions, as the
ionic mobility, or tramference number of chlonde ions is much lower. Thus, the pH of the
pore solution also has a significant effect on RCPT results.
Additionally, the evolution of heat is a problem in porous OPC concretes, and the validity
of cornparison of OPC and SCM rnodified concretes tested with the RCPT is questionable.
SCM's considerably reduce the concentration of ions in the pore solution. With 10%
replacement of cernent with silica fume, Page and Vennesland [1983] found reduction of
hydroxyl ions in cernent paste of about 75%. Cornparison of SCM modified concretes with
OPC concretes under the RCPT will obviously favour the modified concretes.
Zhang and Gjarv [1991] indicated that small defects in the concrete would have a
considerable effect on the results, and that the measurement of ion penetration occurs before
steady-state flux is reached.
The consistency of this test has also been questioned. Hooton [1988] found the coefficient
of variation (2) to be 41.4% with three sets of RCPT data with six replicate specimens in
each set.
Andrade [1993] cnticised the RCPT for ignoring processes such as metal dissolution and
evolution of gases which occur during the test, and developed a theoretical basis for
improving the experimental set-up of the RCPT. Andrade and Sanjuin, [1994] proposed an
experimentai procedure to improve the RCPT, but the RCPT remains a common and
popular test.
Despite its many liabilities, the RCPT test has been widely accepted as a usefid test method.
The ability of this test to provide an indication of permeability within 6 hours c m be
usefûl for quality control and quality assurance purposes.
Many other accelerated methods of measuring chloride diffusion in two charnber cells have
been investigated [Goto and Roy, 1981; El-Belbol and Buenfeld, 1989; McGrath and
Hooton, 19961. Compared to the RCPT, most operate at lower potential differences and the
migration of chlorides is determined directly, by rneasuring the t h e for chlonde
breakthrough, the change in chloride concentration in the anodic d l , or by the achial depth
of penetration of chlorides into the sample.
Tang and Nilsson [1992] applied 30 volts DC across paste and morta. specimens for 3
months. The cathodic solution was lime water and the anodic solution was 3% NaCl.
Chloride penetration depths were measured by a colorimetric method [Collepardi et al,
19701 and diffusion coefficients were calculated using Equation 2-9.
Detwiler and Fapohunda [1993] cornpareci the RCPT test with what they termed the
'?40nvegian" test. Using the same anodic and cathodic ce11 solutions as the RCPT, the
Norwegian test applied only 12 volts across the sample and ran for weeks instead of six
hours. Diffusion of chloride ions was measured directiy by monitoring the chloride
concentration in the NaOH solution as a h c t i o n of time. This elirninated cuncerns of the
RCPT about transport mechanisms and about which ion is being transported. The
requirements of extra testing tirne, and of chloride analysis by titration, chromatography or
neutron activation are practical disadvantages of the Nonvegian test
With most two-chamber d i f i ion test methods there are common problems. The time for
significant cidonde penetration is lengthy, especially with low W/C ratio, SCM modified
samples, unless thin samples are used. With slender samples however, excessively high
diffusion coefficients may resdt due to large interco~ected pores traveaing across the
entire sample. Testhg with paste and mortar samples also fails to be influenced by any
potentiai differences in diffusion through the aggregate interfacial zone. Arsenault et al,
[1995] found that diffusion values may be influence by concentration gradient and sample
thickness. The choice of cation and the concentration of solutions also affects the pore
solution chemistry and influences the rate of diffusion.
McGrath and Hooton [1996] quantifieci the magnitude of the polarization of the potential
applied across the anode and cathode in one type of migration cell, and found the difference
berneen applied potentiai and measured voltage to Vary considerably with the applied
voltage.
Though its limitations have been widely discussed, the RCPT may in Fact provide a very
useful indication of concrete durability. McGrath [1996] correlated RCPT results with
diffusion coefficients calculateci on the same concretes in steady-state migration cells, and
included results calcuiated by Thomas and Jones 119961 in the same marner. The
correlation found a linear relationship, and a coefficient of variation of 0.723.
The service life of a structure is an estimate of the useful lifetime, before deterioration
reaches a level such that repairs or replacement have to be implemented. Service life
estimates are criticai in life cycle cost analyses, and important in econornic assessrnent of
construction options and alternatives. A reliable service life mode1 would enable an
engineer to choose materials and dictate construction details to ensure that the design life
of a structure is met [Thomas et al, 19951.
The service life of a concrete structure in an environment where chlorides exist is difficult
to predict. Empirical [Beaton and Stratfiill, 1963; Clear, 1976; Shuman et al., 19891
models have been developed fiom existing data, but these are not likely accurate when
predictions for SCM modified high performance concretes are required. Mathematical
[Browne, 1980; Tutti, 1982; Bazant, 1 979a; 1979b3 models are generally simplistic and
deficient, and fail to consider aspects such as differentiation between the effects of
sorption and diffusion, the chloride binding capacity, the decrease in d i h i v i t y over time
with fly ash and slag modified concretes, and the chloride threshold level specific to the
concrete. Furthermore, many of these parameters are not constant over time, nor are they
inherent properties of the concrete. Measured diffusion coefficients rnay depend
considerably upon the expenmental method used, and the method of calculation.
Calculated values will also be strongly affected by curing conditions, and strongly
dependent upon the environrnent where the structure is to be constmcted. The hurnidity

and temperature of the intended environment may experience signifiant seasonal
variation, and may also be changing over time.
At the design stage, the choice of cementing materials is critical if the structure is to reach
its desired service life, especially in a severe chloride environment. There is however, a
dearth of performance data for supplementary cementing materiai blends. It is only
recently that the use of supplementary cementing materials has become cornmonplace.
Even without this shortage of relevant data however, two significant problems will
always remain in service life prediction. The availability and composition of
supplementary cementing materials, especially fly ash, varies even within Canada, and to
a tremendous degree around the world.
Obviously the difision of marine salt into the Northumberland Straights Crossing will
differ fiom the diffusion of road salt into a bridge deck on Ontario's Highway 401, even
if the concretes produced in both locals codd be identical. Utilisation of diffusion
coefficients calculated using field data nom a bridge deck in Europe, for aesign of a
harbour pier in Tasmania would have to be treated with cynicism.
To thoroughly deal with al1 aspects of chloride ingress would be a monumental task.
Concurrent deterio ration mechanisms such as fieeze thaw and sulphate attack and alkali
aggregate reaction would have to be considered.
This research Frogram aimed to evaluate a set of cementing materials available in central
Canada for their chloride diffusion and binding capacities, and this data would help to
reduce the size of this task.
3. EXPERIMENTAL PROCEDURE
Cementitiou matends and aggregates were obtained at the start of the project and were
used for the duration of the research program. The cernent used was Marge Type 10 SF,
a CSA A5 Type 10 cernent blended with 8% silica fume. The fly ashes used were
Edgewater, a high-calcium (Type C) fly ash, Sundance, a moderate-calcium level Type C
ash, and Fort Martin Allegheny, a low-calcium Type F (CSA A23.5) ash. The chernical
compositions of al1 cementitious matends are shown in Table 3-1.
The coarse aggregate used was a washed 20 mm, low chloride (0.0097 % acid soluble
chloride), dolomitic limestone fiom the Lafarge Point Anne quany near Belleville,
Ontario (absorption = 0.30 %, specific gravity = 2.70). Glacial sand from Standard
Aggregate's Stouatille pit (absorption = 0.86 %, specific gravity = 2.68, fineness
modulus = 2.60) was used as the fine aggregate. The coarse aggregate was washed after
early mixes exhibited poor interfacial bonding and low strengths.
Admixtures produced by Master Builden were used in al1 mixes. The air entraining agent
used was Micro Air, the water reducer was 25XL, and the superplasticizer was SPN.
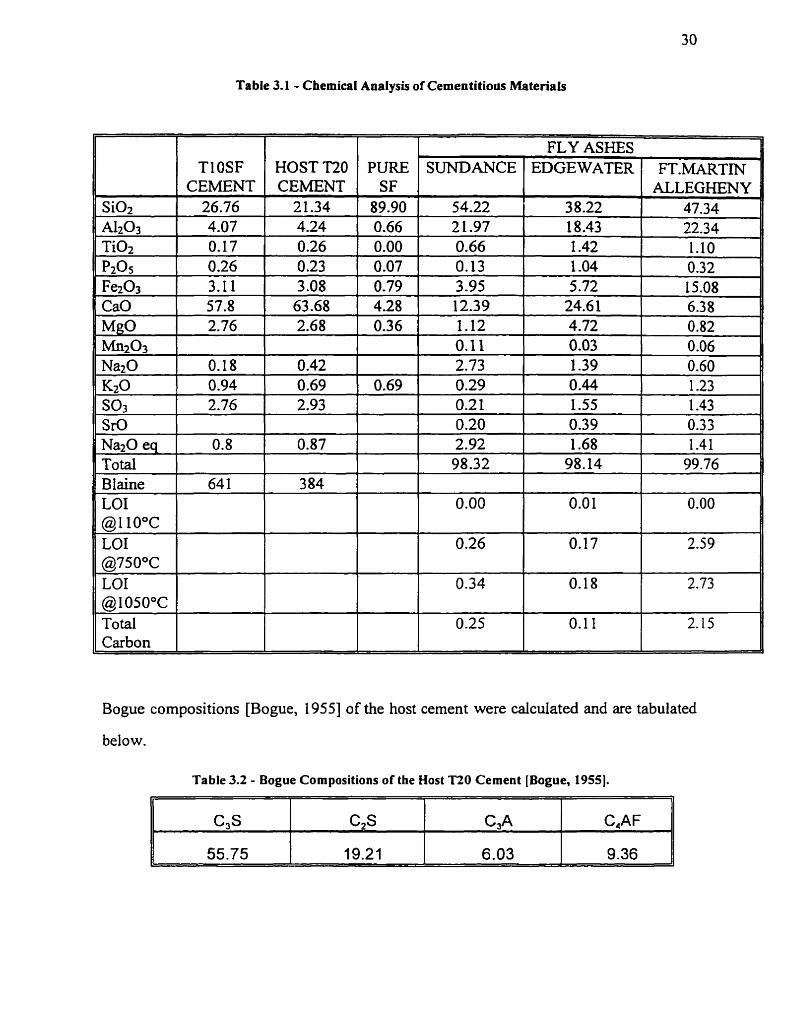
Table 3.1 - Chernical Analysis of Cementitious Materiais
Bogue compositions [Bogue, 19551 of the host cernent were calcdated and are tabulated
below.
1
Si02 , A 1 2 0 3
TiOz ', p205
Fe203
Ca0 Mg0 Mn203
Na20 K2O so3 S r 0
Tl OSF CEMENT 26.76 4.07 0.17 0.26 3.1 1 57.8 2.76
0.18 0.94 2.76
HOST T20 CEMENT 2 1.34 4.24 0.26 0.23 3 .O8 63.68 2.68
0.42 0.69 2.93
Table 3.2 - Bogue Compositions of the Host T20 Cernent [Bogue, 19551.
C3S
55.75
PURE SF 89.90 0.66 0.00 0.07 0.79 4.28 0.36
0.69
Na20 eq To ta1 B laine LOI @l 1O0C LOI @750°C LOI @losooc To ta1
I Carbon
2.92 98.32
0.00
0.26
0.34
0.25 1 1
0.8
64 1
I
C,AF
9.36
C2S
19.21
1
SUNDANCE
54.22 21 -97 0.66 O. 13 3.95
1.681 98.14
0.0 1
C3A
6.03
0.87
3 84
1
0.17
0.18
0.1 1
12.39 1.12 0.1 1 2.73 0.29 0.2 1 0.20 --
FLY ASHES
1
2.59
2.73
2.15
EDGEWATER
38.22 18.43 1.42 1 .O4 5.72
1 II
F T . W m ALLEGHlENY
47.34 22.34 1.10 0.32 15.08
24.6 1 4.72 0.03 1.39 0.44 1.55 0.39
6.38 0.82 0.06 0.60 1.23 1.43 0.33
Initially, thirteen trial mixes were produced with various water cernent (w/cm) ratios,
total cementitious contents, admixture levels, and fly ash replacement levels and types, to
optimize slump, workability, air content, plastic density, and strength.
Subsequentiy, eight concrete mixes were produced with 8% silica fume, Lafarge Tl OSF
cernent, with 25, 40, and 56% fly ash replacement, using three types of fly ash. These
mixes were denoted with the author's initiais, the fiy ash source, and replacement level,
Le., the mixes with 25% fly ash replacement using Sundance, Edgewater and Fort Martin
Allegheny ashes were abbreviated CE25FS, CE25FE, and CE25FM, respectively. Slurnp,
air content and plastic density values were measured during each mix, and strengths were
measured at ages of 1, 3, 7 and 28 days, and at 6 months. Low water cernent ratio mixes
were produced to simulate reaiistic mix designs for high performance concrete. These
eight mixes were subjected to the rapid chloride permeability test, ASTM C 1202, to bulk
chioride diffusion tests, to porosity measurements, and to chlonde migration tests. The
procedures used are described in detail in the next section. Specific mix designs are
described in Table 3-3. Finally, 8 paste mixes were produced with the same proportions
of cementitious materials and at the sarne wfcm ratios used in concrete, for chloride
binding measurements.
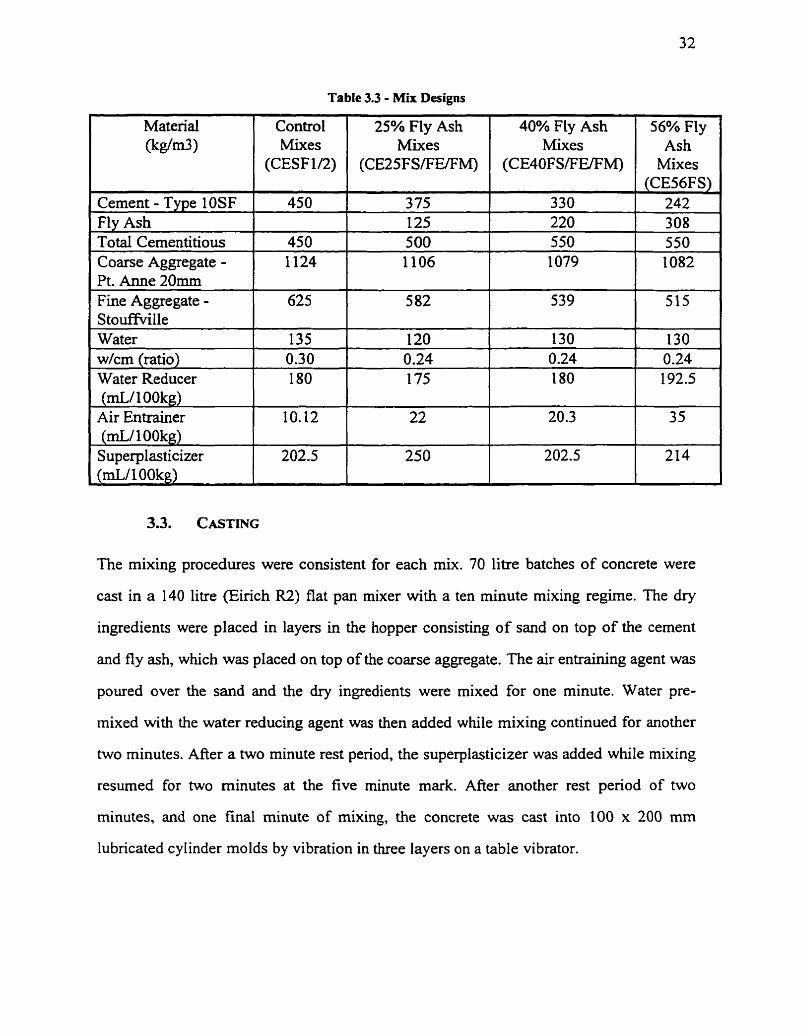
Table 3.3 - Mix Designs ---
Material @dm31
Cernent - Type 1 OSF Fly Ash Total Cementitious Coarse Aggregate - Pt. Anne 20mm Fine Aggregate - S tou&iIle Water w/cm (ratio) Water Reducer (mL/ 100kg)
Air Entrainer (mu1 OOkg) Superplasticizer (mL/1 OOkg)
Contro 1 Mixes
(CESF 1/2)
25% Fly Ash Mixes
(CE25FS/FE/FM)
40% Fly Ash Mixes
(CE40FS/FE/FM)
56% Fly Ash
Mixes (CE56FS)
242
The mixing procedures were consistent for each mix. 70 litre batches of concrete were
cast in a 140 litre (Eirich R2) flat pan mixer with a ten minute mixing regirne. The dry
ingredients were placed in layea in the hopper consisting of sand on top of the cernent
and fly ash, which was placed on top of the coarse aggregate. The air entraining agent was
poured over the sand and the dry ingredients were mixed for one minute. Water pre-
mixed with the water reducing agent was then added while mixing continued for another
two minutes. After a two minute rest penod, the superplasticizer was added while mixing
resumed for two minutes at the five minute mark. After another rest penod of two
minutes. and one final minute of mixing, the concrete was cast into 100 x 200 mm
lubricated cylinder molds by vibration in three layers on a table vibrator.
The use of
[Jefferis and
cylindncal mouids in concrete durability research has been questioned
Mangabhai, 19891 due to concem about potential edge effects created by
casting concrete into cylinden. There could be a lower aggregate fiaction at the edge of
cylinders when compared to cores. However, research performed at the British Research
Establishment on cylinders and cores has shown that there is no statistically significant
effect on gas and water penneability [Thomas, 19971.
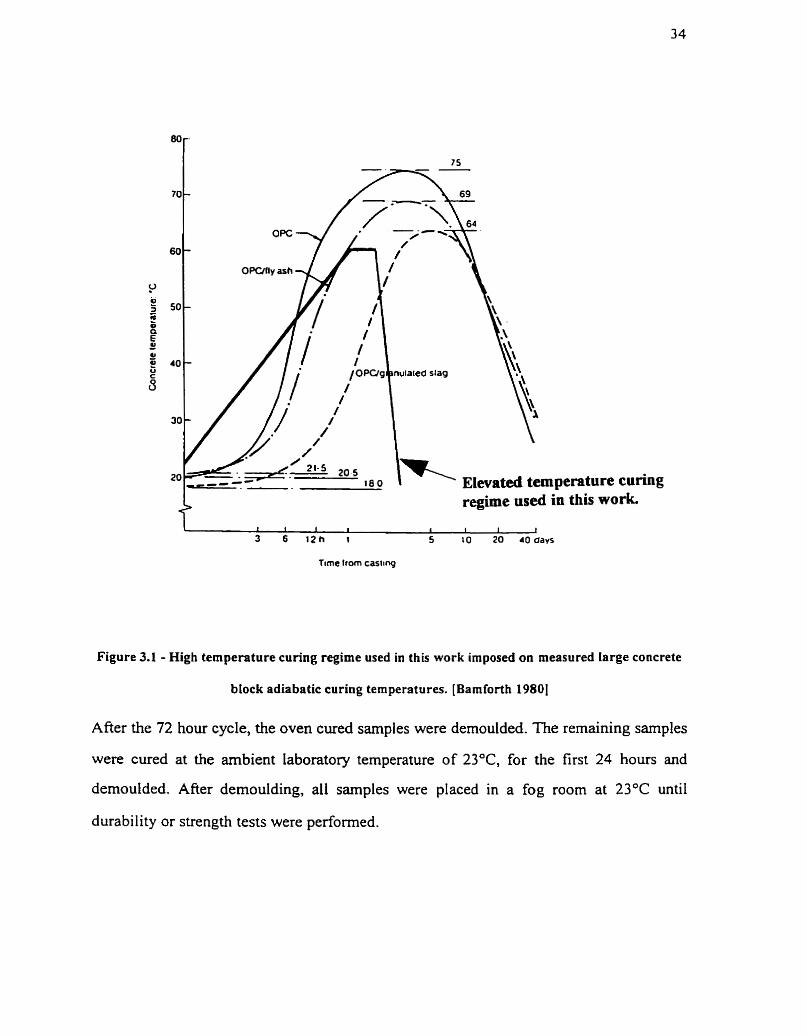
Mer each mix, half of the cylinders were immediately transferred for 72 hours into an
environmental chamber. n i e cornputer controlled temperature in the chamber was
increased linearly from 23 to 60°C over the first 24 hours, maintained at 60°C for the
second 24 hour phase, and decreased steadily back to 23°C over the final 24 hours. This
temperature controlled curing regime simulates a typical autogenous heating cycle that
might occur in casting on large industrial scale projects m g l e y et al, 1992; Barnforth,
19801. Figure 3.1 shows the hi& temperature curing regirne employed in this work
superimposed upon the adiabatic or autogenous heating cycles measured by Barnforth
[l98O].
70 -
60 -
50 -
Elevated tempemture curing + regime used in this work.
l ime ttom casiing
Figure 3.1 - High temperature cunng regime used in this work imposed on measured large conerete
bIock adiabatic curing temperatures. [Barnforth 19801
After the 72 hour cycle, the oven cured samples were demoulded. The remaining samples
were cured at the arnbient laboratory temperature of 23T, for the first 24 hours and
demoulded. After demoulding, al1 samples were placed in a fog roorn at 23°C until
durabi lity or strength tests were performed.
3.5.1. Rapid Chloride Permeability Test
At 28 days and 6 months after casting, each mix was subjected to the rapid chloride
permeability test. The test is simila. to AASHTO T277 and ASTM C 1202 (Electrical
Indication of Concrete's Ability to Resist Chloride Ion Penetration). Discrepancies were
in sarnple preparation, and in the fact that samples were 10Omm in diameter, not 95mm.
The results were norrnalized to the standard 95mm diameter as per ASTM C 1202.
In preparation of the samples, one day before testing, lOOmm diameter specimens of both
the oven cured and ambient cured samples were cut into 5 1mm thick slices and vacuum-
saturated in water for 18 hours. The cross-sectional surfaces were then protected with
tape while the remaining outer surface was air-dried and thoroughiy coated with epoxy
paste. The tape was removed, and after a minimum of 6 hours hardening, the sample was
vacuum-saturated for an additional 3 hours to replace any moistue ioss in the exposed
faces. The RCPT is capable of testing 4 samples at the same tirne, so two oven cured
samples and two ambient cured samples were always tested concurrently.
3.5.2. Chloride Migration Test
Sample Preparation
After 26 days of curing, entire cylinders were coated with a 5mm thick epoxy annulus
cast around the circurnference of the sarnple using alurninum moulds. Afier 24 hours
setting time, 5Omm thick samples were saw cut fiom the interior and vacuum saturated
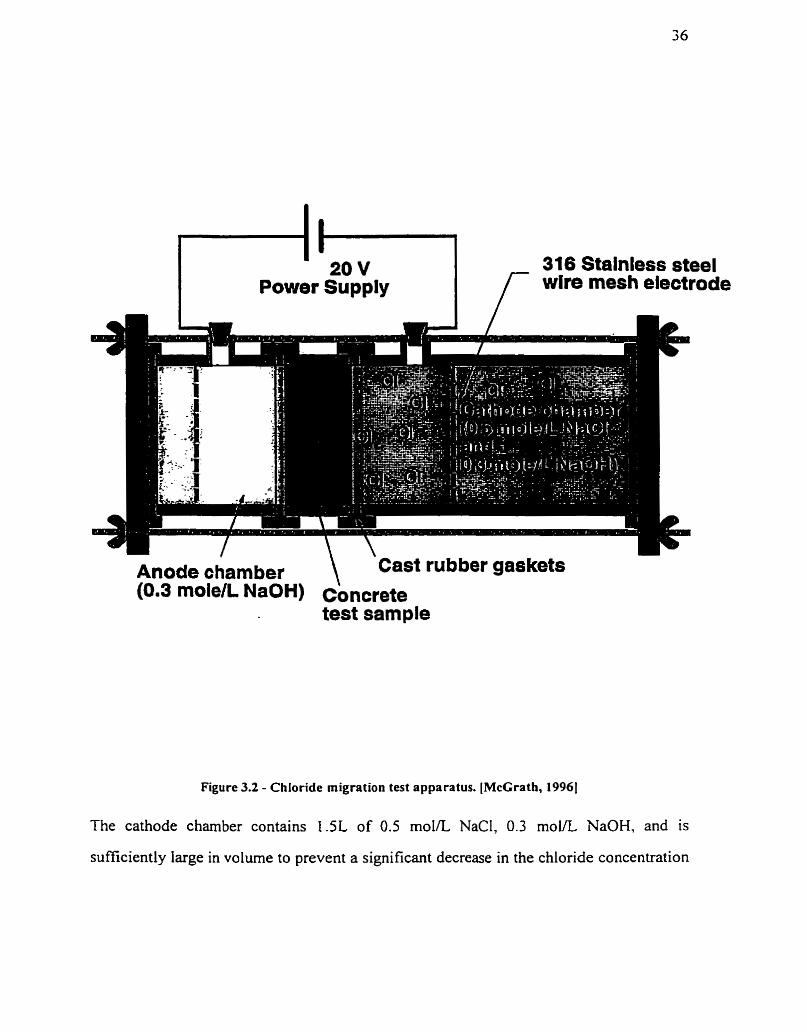
for 18 hours. At 28 days age after casting, samples were placed in the migration ce11
developed by McGrath [1996] and currently being utilised in several projects in the
concrete materials group at the University of Toronto, shown in Figure 3-2.
I r 1 Power Supply 316 Stalnless steel wire mesh electrode
Anode chamber \ Cast rubber gaskets (0.3 molelL NaOH) ~,,,,,t,
test sample
Figure 3.2 - Chloride migration test apparatus. [McGrath, 19961
The cathode charnber contains 1.5L of 0.5 mol/L NaCI, 0.3 mol/L NaOH, and is
sufficiently large in volume to prevent a significant decrease in the chloride concentration
or change in the OH- concentration. The anode chamber volume is small enough such that
any penetrating chlorides will have a noticeable impact on the chamber concentration,
and early detection of chloride ion breakthrough will be detected. The anode chamber
solution contains 0.6 L of 0.3 m o n NaOH.
A 22.3 V potential was applied across the sample by a power supply using 3 1 6 Stainless
steel wire mesh electrodes. The voltage drop due to polarization in migration cells of this
exact design with sarnples of the same thickness were rneasured by McGrath and Hooton
[1996]. By applying 22.3 V between the electrodes, the resultant potentiai drop across the
ce11 after polarization is exactly 20.0 V. The current passing through the test ce11 is
monitored by measuring the voltage across a known resistor in the circuit using a digital
voltmeter. n i e chlonde concentration was monitored in the anode chamber by removal of
10 rnL aliquots using an auto-pipette. The anode chamber was then refilled with the
addition of 10 mL of the initial 0.3rnoVL NaOH, to maintain a constant ce11 volume. The
chloride removed by the 10 r d sampling affects the mass flow rate of chlonde through
the sample so a correction to the flow rate was made by adding to the flux the determined
amount of chloride in the lOmL sample at each sample time.
Chloride titration
Potentiometric titrations of the 10 mL sarnples were performed on a Metrohrn 71 6 DMS
Titrino automatic titrator. This titrator uses 0.01 mol/L silver nitrate and a silver billet
electrode. Titrate is automatically dispensed, and chloride concentrations computed in
ppm, based on the inflection point in the potential versus titrant volume plot.
Early sarnples with little or no chlofide content were titrated with the addition of a
measured volume of a known NaCl concentration solution to obtain a more distinct
inflection point. The chloride content of the known addition was subtracted to determine
the actual chionde concentration. Samples of a high chloride concentration collected fiom
the end of the migration test were diluted to minimise the arnount of titrant and time
required for each titration.
3.5.3. Chloride Bulk Diffusion Test
Sam~le Preaaration
Similar to sample preparation for the rapid chlonde permeability test, 27 days after
casting, lOOrnm diameter specimens of both the oven cured and ambient cured sarnples
were cut into 50mm thick slices, and vacuum-saturated in water for 18 hours. One of the
cut surfaces was then protected with masking tape while the remaining surfaces were air-
dried and coated with epoxy. After hardening, the sample was placed in water under
vacuum for an additional 3 hours to replace any lost rnoisture. At 28 days of age,
specimens were placed in closed containers with the exposed face down in solutions of
0.5 m o n NaCl and 0.3 m o n NaOH, at temperatures of 7,23 and 48OC for 6 months. To
ensure accurate chlonde concentrations, the NaCl was dried at 105OC prior to preparation
of solutions.
Profile Grinding
AAer 182 days of exposure to the salt solutions, the sarnples were immediately profile
ground or tightly sealed in polyethylene bags and frozen at -1 8OC to minimise further
diffusion, until grinding could be performed. It is possible that there were areas where the
epoxy did not bind well with the sample, and solution could have travelled into the
sample along this interface. To reduce the effects that this could have had on chloride
penetration into the sample, opposite edges of the sample were chiselled away to
minimize any edge effects before profile grinding. The sample was ground or fiozen
quickly after removal fiom solution to minimize any possible rnovement of chloride ions
during evaporation of the pore solution.
The sample was ground layer by layer on a (Van Norman) precision milling machine
using an AXTIAWT 50mm outer diameter diamond edge core drill bit rotating at 320
rpm. The bit traveled across the sample at 50mrn/min. Layers of 0.5 1 to 1 .O2 mm (0.020
to 0.040 inches) were ground and the dust collected between most grinds. Usually 10
ground layers were saved for analysis fiom each sample. Between each g ~ d , the sample
and the drill bit were vacuumed and blown with compressed air to avoid contamination of
dust into deeper pores.
Sample Digestion
This procedure, developed by McGrath [1996] is similar to the ASTM C 1 14 Standard
Test Method for Chernical Analysis of Hydraulic Cernent, Section 19-Chloride. The
powder samples were dried at 105OC to eliminate any evaporable water, cooled in a
dessicator, and passed through a 3 15 pm sieve. Two grams of each sample were weighed
out into a 250mL beaker. The sifting ensured that only fme powder was digested,
allowing for complete dissociation of the ions into solution, and also preventing
contamination of larger particles £tom other layers. To each sample, 7rnL of 1: 1 nitric
acid and 35 mL of distilled water were added and this solution was stirred for 20 seconds.
AAer 4 minutes of standing time, each beaker was brought to a boil. After cooling, the
digested sample was filtered through medium grade, number 8 filter paper in a 90mm
Buchner filter h e l into an Erlenrneyer filter flask.
Chloride titration
The final stage in the bulk diffusion analysis is potentiometric titxation of the digested
solutions using 0.01 moVL silver nitrate and a silver billet electrode. The same automatic
tihator as used for the migration ce11 anaylsis (Metrohm 7 16 DMS Titrino) was used to
dispense titrate and compute chloride concentrations in parts per million @pm) based on
the infiection point in the potential versus titrant volume plot. This pprn value was
converted to a percentage value of the initial dry mass of the concrete.
3.5.4. Porosity Measurements
To account for diffusion being limited to the pore solution, and allow for bulk diffision
coefficients to be converted into pore solution diffision coefficients, measurement of the
porosity of samples was perfomed. This technique WcGrath, 19961 consisted of
vacuum-saturation of samples for 3 hours in water, measurement of the sahirated,
suspended mass in water and the satwated surface dry (ssd) mass. Following 7 days of
evaporation at 1 10°C, final mass measurements were taken. Dry mass measurements
were made again at 14 days to ensure no more weight loss had occurred. The vacuum-
saturation stage was perfomed at the start and dry mass measurements made aftenvards
such that any pore cracking and collapse would occur d e r vacuum saturation had already
been perfomed, and would not intluence the porosity measurement. The possibility that
vacuum-saturation would dissolve precipitated compounds and increase the measured
porosity was ignored.
Porosity was calculated as:
3.5.5. Chloride Binding Measurements
To produce chlonde binding isotherms for the 8 mixes, the procedure of Tang and
Nilsson [1993] was adopted. Initially, eight paste mixes were produced with the same
W/CM ratios, the same types and replacement levels of fly ash, and the sarne amounts,
proportionally, of superplasticizers to the 8 concrete mixes tested for diffusion. Paste
mixes were produced in accordance with ASTM C 305-94, the standard practice for
mechanical mixing of hydradic cernent pastes and mortars of plastic consistency .
M e r 24 hours initial curing, the samples were immersed and matured for 28 days in lime
water at 38°C. The samples were then sliced into discs of 1-1 Smm thickness and vacuum
dried for 3 days with anhydrous silica gel, and soda lime to prevent carbonation.
Aftewards, the samples were air dned in a dessicator with sahirated LiCl until 11%
relative hurnidity was reached in the chamber, and specimens of each paste type were
removed for moisture content and degree of hydration measurements.
Afier subsequent vacuum-dryng, solutions of 0.00 (for degree of hydration
measurements), 0.10, 0.50, 1.0 M NaCl, and sea water (produced in accordance with
ASTM D 1 14 1 -9O(Reapproved 1992) standard specification for Substitute Ocean Water)
were introduced under vacuum to paste specimens of al1 8 mix designs. Replicate
specimens at 1.0 M NaCl were also produced for each of the rnix designs to monitor
concentration until the end of the decrease in the chloride concentration was reached.

EXPERIMENTAL RESULTS
4.1. PHYSICAL MIX PROPERTIES AND STRENGTH RESULTS
After the ten minute rnixing regime, the concrete mixes produced for the research
program were tested for slump, air content and plastic density. At 3,7, 28 days and at 6
months of age, compressive strength was measured on ail mixes. Strength was also
measured at 1 day on arnbient cured samples. Three cylinders were tested fiom each mix
at each age to ensure representative results. The 72 hour elevated temperature curing
regime precluded oven cured sample strength measurements at 1 day.
Table 4-1 shows the fiesh properties of each of the 9 mixes tested for durability. Air
content was consistent between mixes but slump was more difficult to control. Table 4-2
shows the strength data for al1 mixes and for both curing regimes, at each age. The
control mix CESF 1, was duplicated as mix SF2 after problems were encountered with the
initial epoxy type intended for use in migration and bulk diffusion tests. For this reason,
only strength and rapid chloride permeability tests were canied out for mix CESF 1. The
strength testing procedure conformed with CSA A23 .2-9C.
CS A A23.1 Exposure Class C 1 concrete specifies W/CM< 0.40, air-entrainment and 28
day strength exceeding 35 MPa. This was easily met in each case, though overall
strengths were lower than anticipated. The limiting factor was deemed to be low strength
of the Pt. Anne coarse aggregate. In a similar research project, Pun [1997] experienced
strength increases of between 6 and 18 MPa when the coarse aggregate source in concrete
mixes of similar rnix designs was switched fiom Pt. Anne to Manitoulin.
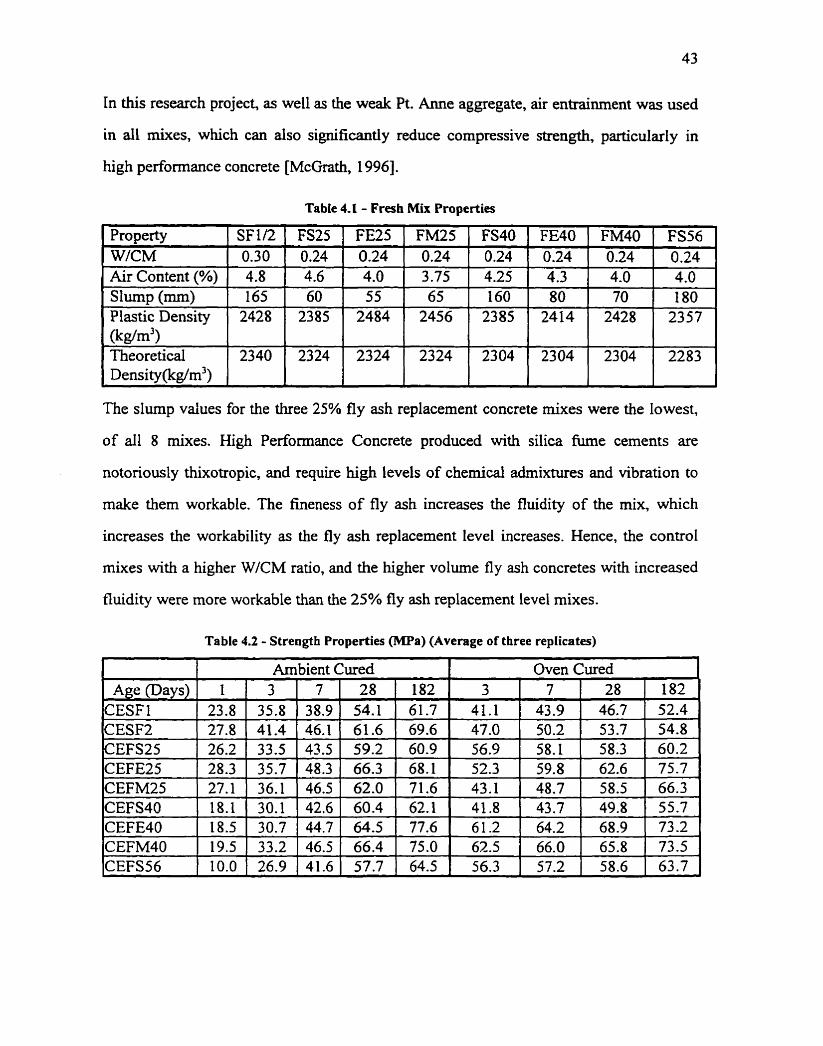
In this research projecf as well as the weak Pt. Anne aggregate, air entrainment was used
in al1 mixes, which can also significantly reduce compressive strength, particularly in
high performance concrete WcGrath, 1 9961.
The slump vaiues for the three 25% fly ash replacement concrete mixes were the lowest,
of al1 8 mixes. High Performance Concrete produced with silica fume cements are
notonously thixotropic, and require high levels of chernical admixtures and vibration to
make them workable. The fmeness of fly ash increases the fluidity of the mix, which
increases the workability as the fly ash replacement level increases. Hence, the control
mixes with a higher W/CM ratio, and the higher volume fly ash concretes with increased
fluidity were more workable than the 25% fly ash replacement level mixes.
Tabte 4.1 - Fresh Mix Properties
Table 4.2 - Strength Properties (MPa) (Average of three replicates)
1 1 Ambient Cured 1 Oven Cured 1
Property W/CM Air Content (%)
, S~=P (mm) Plastic Density W d Theoretical Density(ks/m3)
Age pays) I 3 7 28 182 3 7 2 8 182 CESFl 23.8 35.8 38.9 54.1 61.7 41.1 43.9 46.7 52.4 CESF2 27.8 41.4 46.1 61.6 69.6 47.0 50.2 53.7 54.8
SF1/2 0.30 4.8 165
2428
2340
FS25 0.24 4.6 60 2385
2324
FE25 0.24 4.0 55 2484
2324
FM25 0.24 3.75 65 2456
2324
FS40 0.24 4.25 160 2385
2304
FE40 0.24 4.3 80 2414
2304
FM40 0.24 4.0 70 2428
2304
FS56 0.24 4.0 180
2357
2283
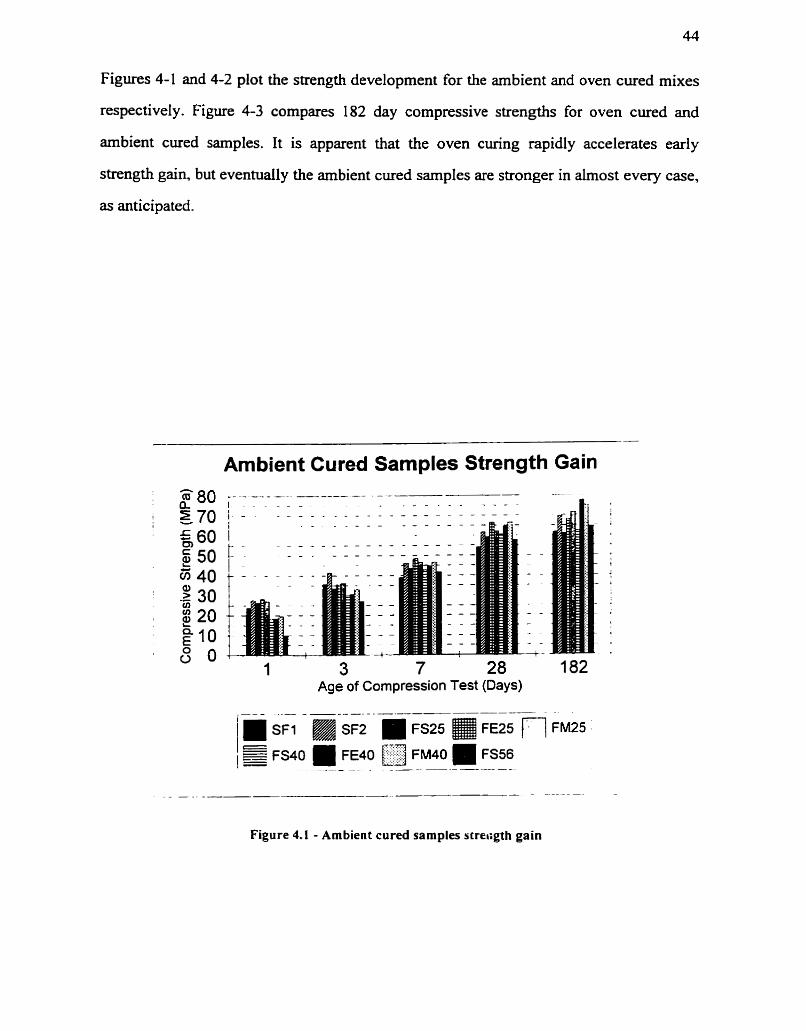
Figures 4-1 and 4-2 plot the strength development for the ambient and oven cured mixes
respectively. Figure 4-3 compares 182 day compressive strengths for oven cured and
arnbient cured sarnples. It is apparent that the oven curing rapidly accelerates early
strength gain, but eventually the arnbient cured samples are stronger in almost every case,
as anticipated.
Arnbient Cured Samples Strength Gain
Age of Compression Test (Days)
Figure 4.1 - Ambient cured samples screiigth gain
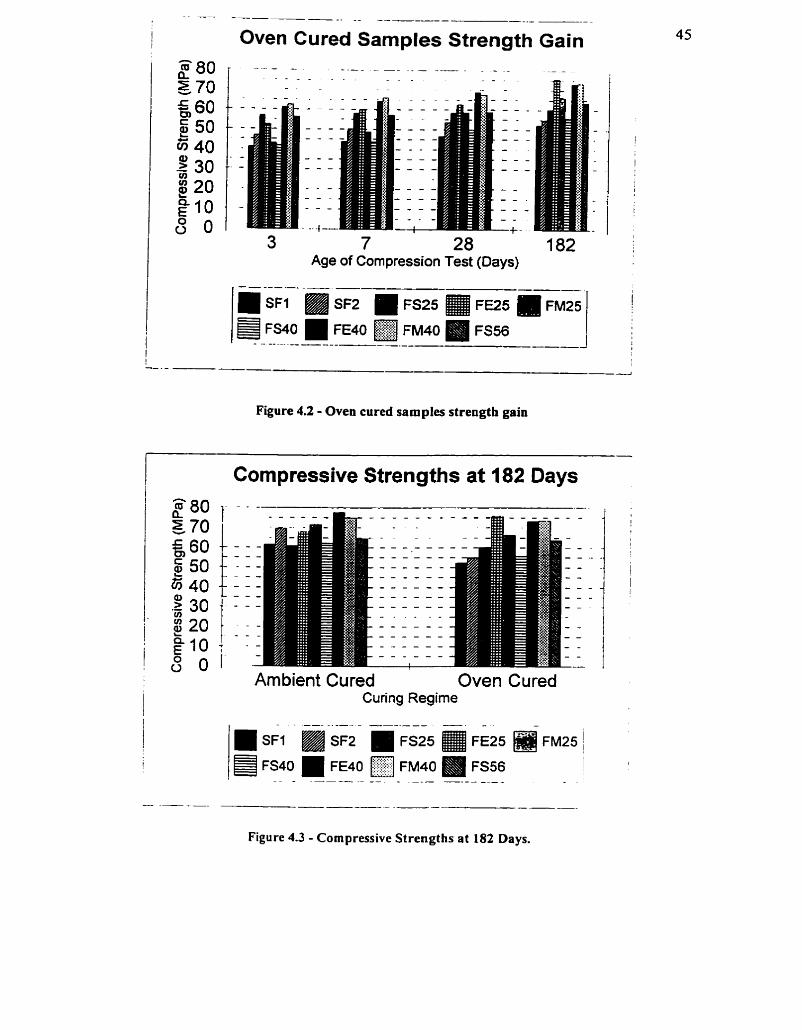
3 7 28 182 Age of Compression Test (Days)
Figure 4.2 - Oven cured samples strength gain
Compressive Strengths at 182 Days
Am bient Cured Oven Cured Curing Regime
Figure 4-3 - Compressive Strengths at 182 Days.
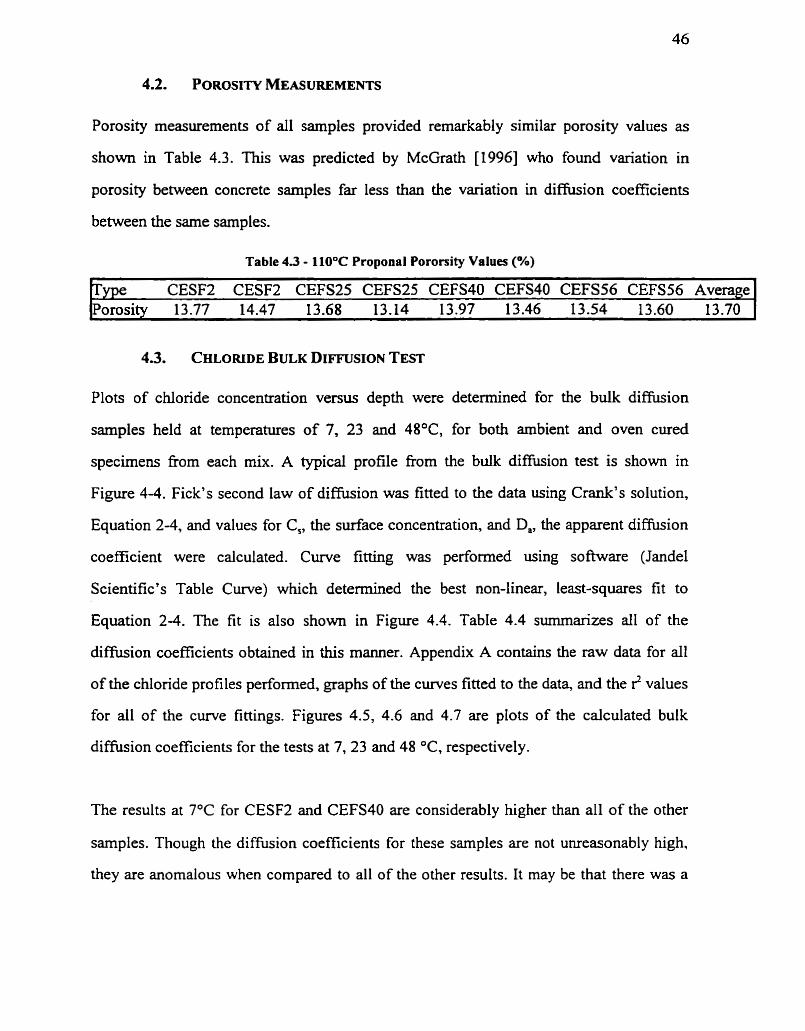
Porosity measurements of al1 samples provided remarkably similar porosity values as
shown in Table 4.3. This was predicted by McGrath [1996] who found variation in
porosity between concrete samples far less than the variation in diffusion coefficients
between the same samples.
Table 4 3 - 1 10°C Propoaal Pororsity Values (%)
Type CESFZ CESFZ CEFS25 CEFS25 CEFS40 CEFS40 CEFS56 CEFS56 Average Porosity 13.77 14.47 13.68 13.14 13.97 13.46 13.54 13.60 13.70
Plots of chloride concentration versus depth were detennined for the buk d i f i i o n
samples held at temperatures of 7, 23 and 48"C, for both ambient and oven cured
specimens £iom each mix. A typical profile fiom the bulk diffusion test is shown in
Figure 4-4. Fick's second law of diffusion was fitted to the data using Crank's solution,
Equation 2-4, and values for Cs, the surface concentration, and Da, the apparent diffusion
coefficient were calculated. Curve fitting was performed using software (Jandel
Scientific's Table Curve) which detemiined the best non-linear, least-squares fit to
Equation 2-4. The fit is also shown in Figure 4.4. Table 4.4 summarizes al1 of the
dimision coefficients obtained in this manner. Appendix A contains the raw data for d l
of the chloride profiles performed, graphs of the curves fitted to the data, and the 3 values
for ail of the curve fittings. Figures 4.5, 4.6 and 4.7 are plots of the calculated bulk
diffusion coefficients for the tests at 7, 23 and 48 O C , respectively.
The results at 7OC for CESFZ and CEFS40 are considerably higher than al1 of the other
samples. Though the diffùsion coefficients for these samples are not unreasonably high.
they are anomalous when compared to al1 of the other results. It may be that there was a
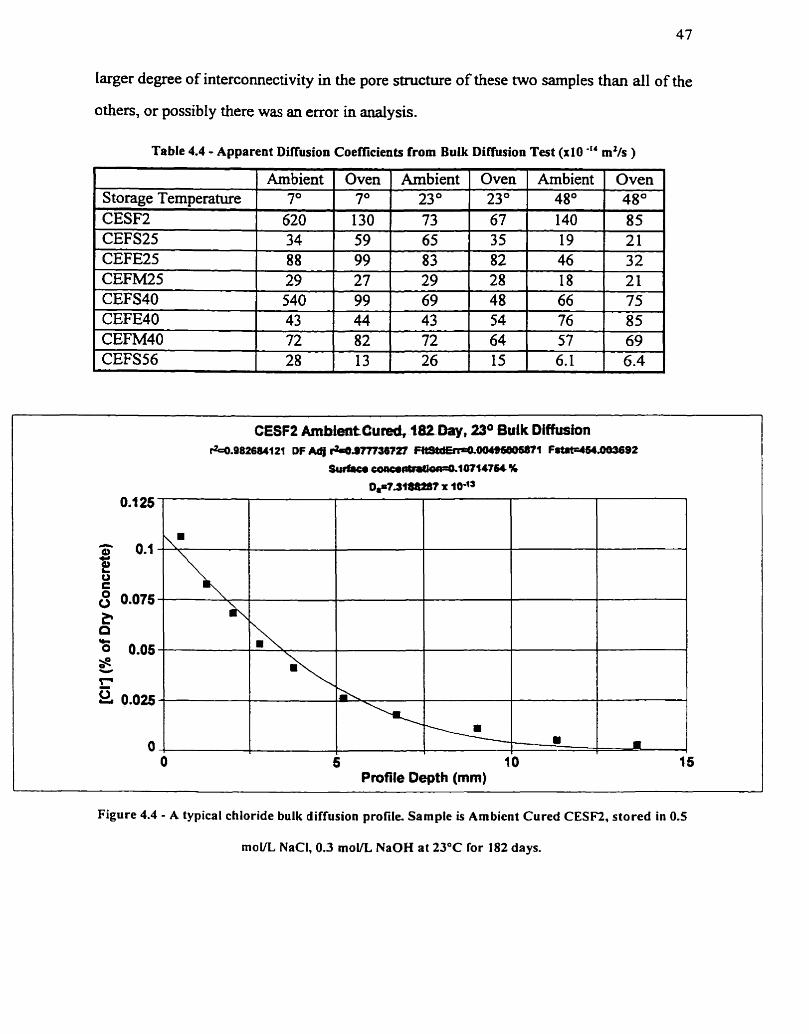
larger degree of intercomectivity in the pore stnicture of these two samples than al1 of the
others, or possibly there was an error in analysis.
Table 4.4 - Apparent Diffusion Coefficients from Bulk Diffusion Test (x10 '" mL/s )
CESF2 A m h i e n t C u ~ t82 Day, 23O Buik Diffwbn &.982684121 DF Adj r4i6.977736727 F-.ûO3692
Sudua c o a œ ~ 1 O 7 l 4 7 â 4 %
D ~ 7 . 3 ~ 7 x 10-
Storage Temperature CESF2
Figure 4.4 - A typical chloride bulk diffusion profile. Sample is Ambient Cured CESM, stored in 0.5
moüL NaCI, 0.3 mol& NaOH at 23OC for 182 days.
Ambient 7" 620
Oven 7" 130
Oven 23" 67
Ambient 23" 73
Arnbient 48" 140
Oven 48" 85
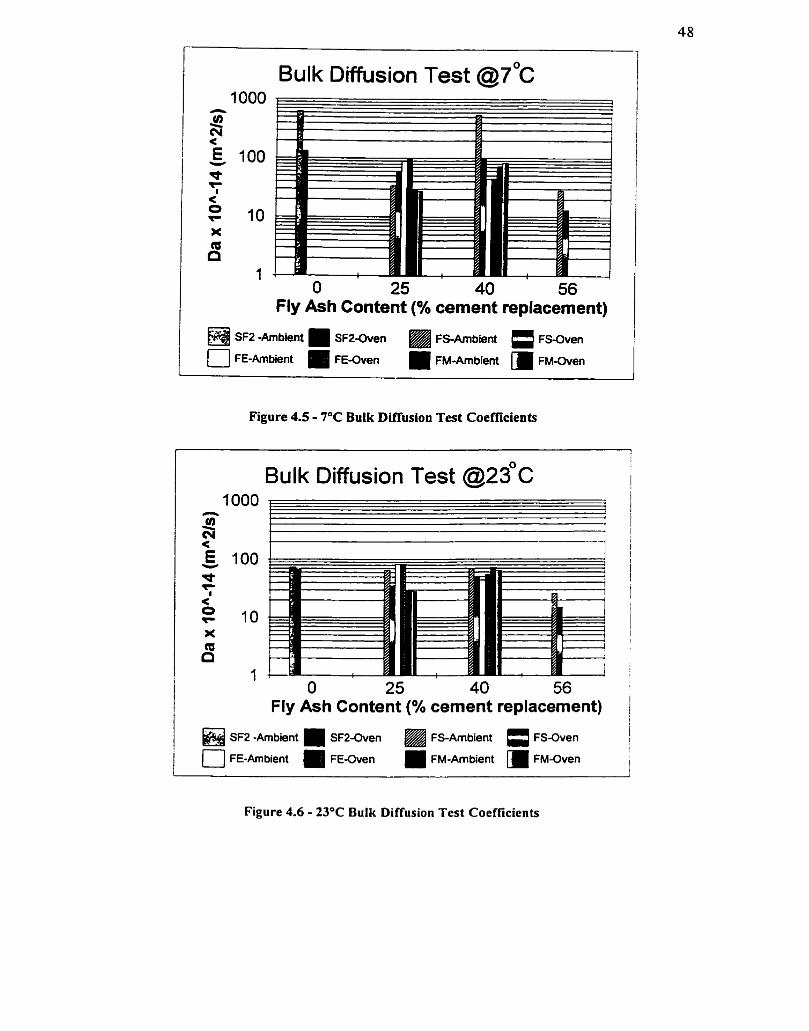
Bulk Diffusion Test @7*~
O 25 40 56 Fly Ash Content (% cernent replacement)
Figure 4.5 - 7°C Bulk Diffusion Test Coefficients
Bulk Diffusion Test @23*~
O 25 40 56 Fly Ash Content (% cernent replacement)
Figure 4.6 - 23°C Bulk Diffusion Test Coefficients
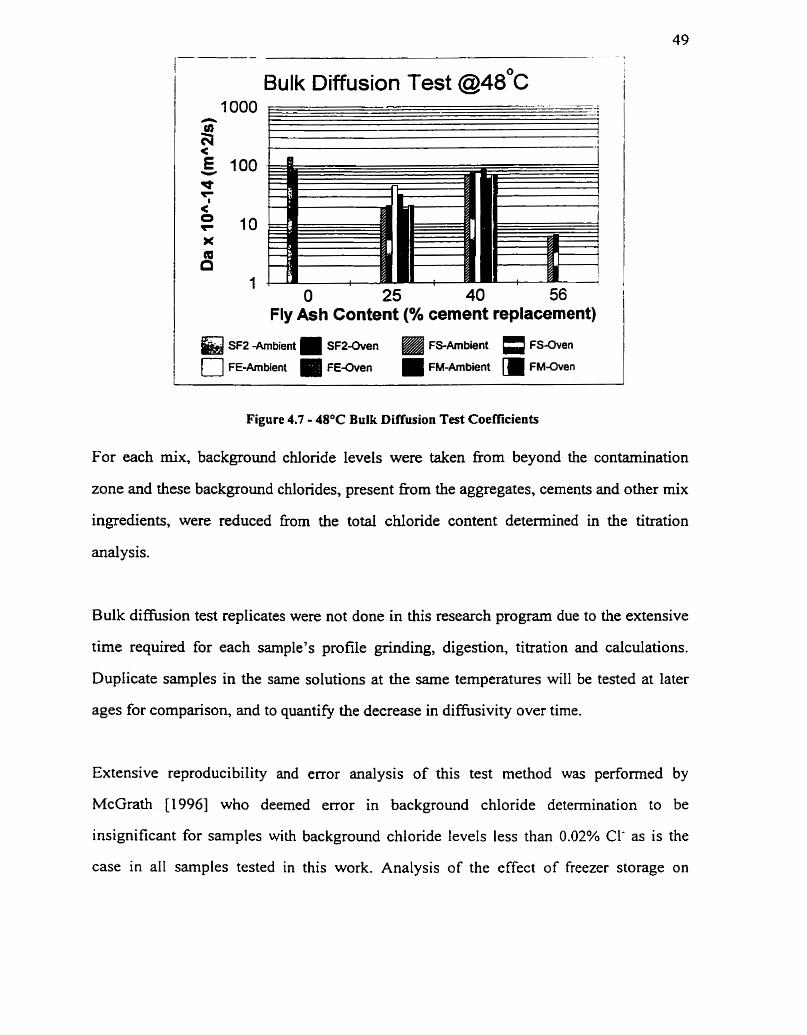
Bulk Diffusion Test @ 4 8 * ~
O 25 40 56 Fly Ash Content (% cernent replacement)
Figure 4.7 - 4a°C Bulk Diffusion Test Coefficients
For each mix, background chloride levels were taken fiom beyond the contamination
zone and these background chlondes, present f?om the aggregates, cements and other rnix
ingredients, were reduced fiom the total chloride content determined in the titration
analysis.
Bulk diffusion test replicates were not done in this research program due to the extensive
time required for each sample's profile grinding, digestion, titration and calculations.
Duplicate samples in the same solutions at the same temperatures will be tested at later
ages for cornparison, and to quantifi the decrease in diffusivity over time.
Extensive reproducibility and error analysis of this test method was performed by
McGrath [1996] who deemed error in background chloride determination to be
insignificant for samples with background chionde levels less than 0.02% Cl- as is the
case in a11 samples tested in this work. Analysis of the effect of freezer storage on
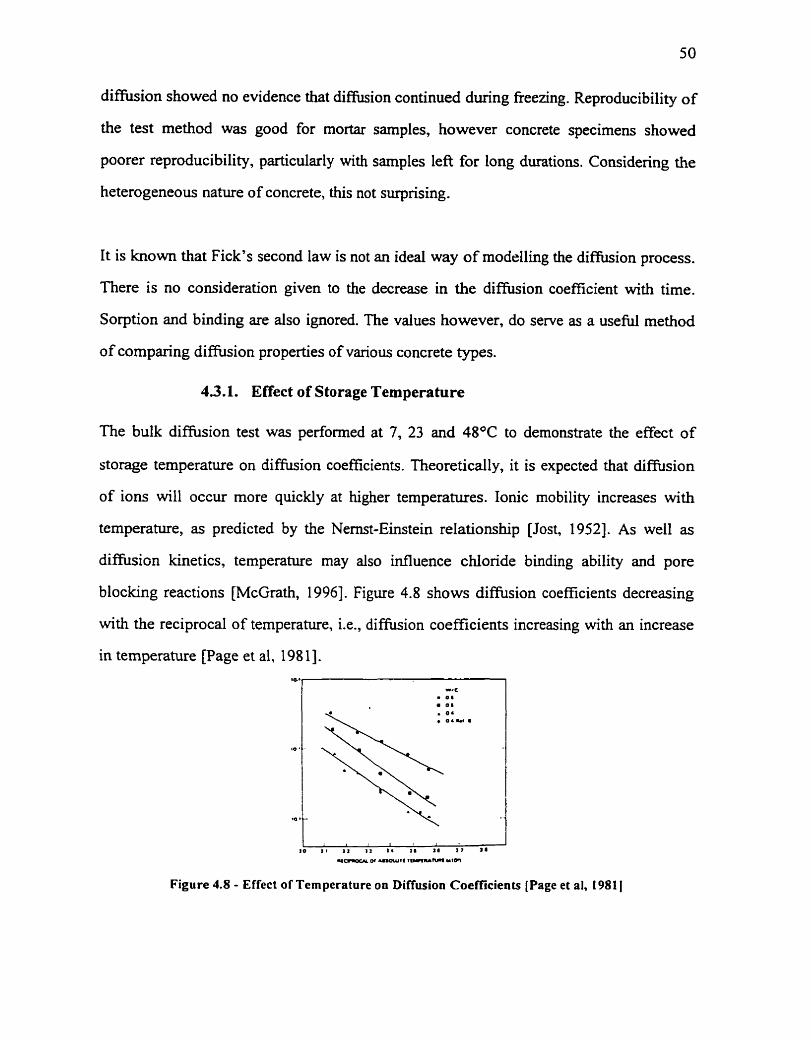
diffusion showed no evidence that diffusion continued during fieezing. Reproducibility of
the test method was good for mortar samples, however concrete specimens showed
poorer reproducibility, particdarly with samples left for long durations Considering the
heterogeneous nature of concrete, this not surprising.
It is known that Fick's second law is not an ideal way of modalling the difision process.
There is no consideration given to the decrease in the diffision coefficient with time.
Sorption and binding are also ignored. The values however, do serve as a useful method
of comparing diffision properties of various concrete types.
4.3.1. Effect of Storage Temperature
The bulk diffusion test was performed at 7, 23 and 48OC to demonstrate the effect of
storage temperature on diffusion coefficients. Theoretically, it is expected that difision
of ions will occur more quickly at higher temperatures. Ionic mobility increases with
temperature, as predicted by the Nernst-Einstein relationship [Jost, 19521. As weil as
difision kinetics, temperature may also influence chloride binding ability and pore
blocking reactions [McGrath, 19961. Figure 4.8 shows diffision coefficients decreasing
with the reciprocal of temperature, Le., diffision coeffkients increasing with an increase
in temperature page et al, 198 11.
Figure 4.8 - Effect of Temperature on Diffusion Coeffkients [Page et al, 1981 1
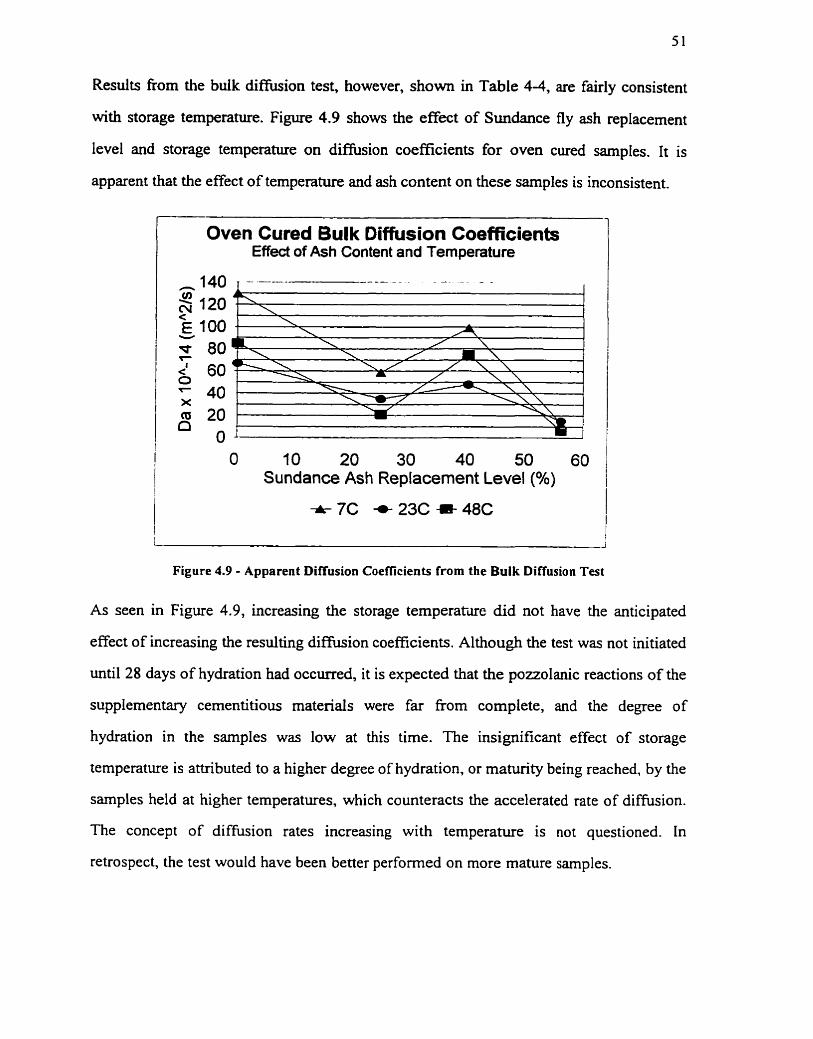
5 1
Results fiom the bulk diffusion test, however, s h o w in Table 4-4, are fairly consistent
with storage temperature. Figure 4.9 shows the effect of Sundance fly ash replacement
level and storage temperature on diffusion coefficients for oven cured sarnples. It is
apparent that the effect of temperature and ash content on these samples is inconsistent.
Oven Cured Bulk Diffusion Coefficients Effect of Asti Content and Temperature
O ?O 20 30 40 50 60 Sundance Ash Replacement Level (%)
Figure 4.9 - Apparent Diffusion Coefficients from the Bulk Diffusion Test
As seen in Figure 4.9, increasing the storage temperatrire did not have the anticipated
effect of increasing the resulting diffusion coefficients. Although the test was not initiated
until 28 days of hydration had occurred, it is expected that the povolanic reactions of the
supplementary cementitious materiais were far from complete, and the degree of
hydration in the sarnples was low at this time. The insignificant effect of storage
temperature is attributed to a higher degree of hydration, or maturity being reached, by the
samples held at higher temperatures, which counteracts the accelerated rate of ciiffision.
The concept of diffusion rates increasing with temperature is not questioned. In
retrospect, the test would have been better performed on more mature samples.
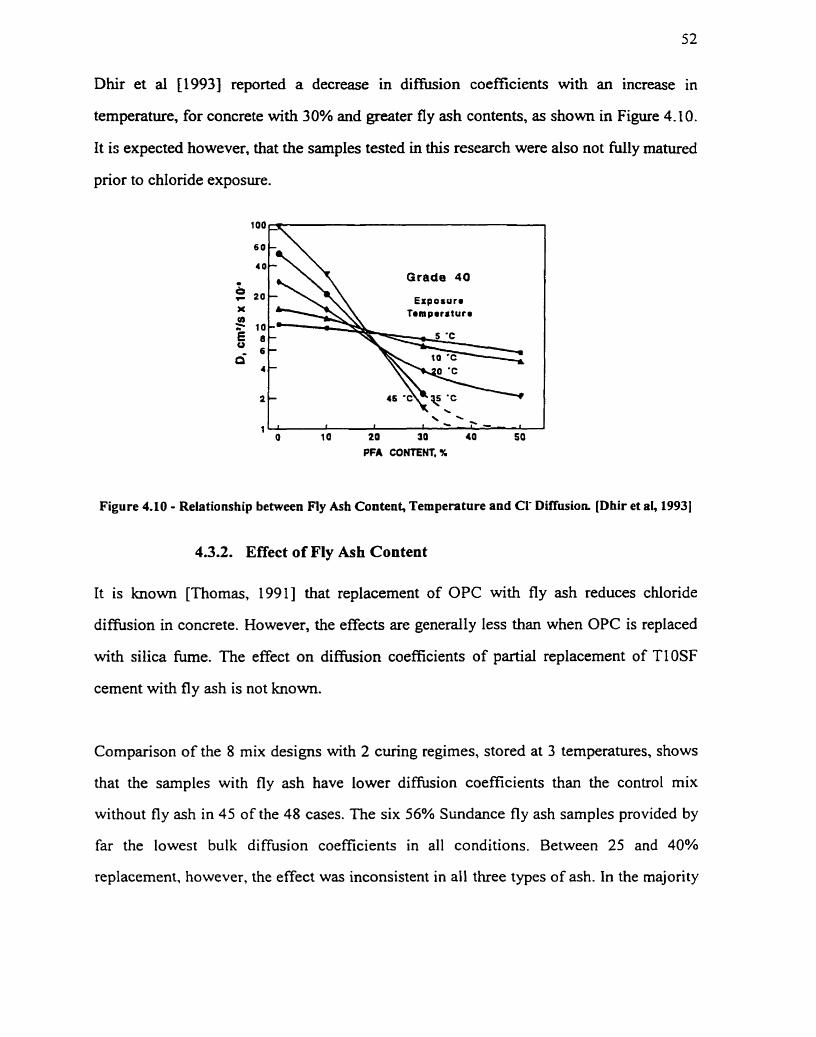
Dhir et al 119931 reported a decrease in diffusion coefficients with an increase in
temperature, for concrete with 3 0% and greater fly ash contents, as s h o w in Figure 4.1 0.
It is expected however, that the samples tested in this research were also not Mly matured
exposure.
'O0 0
PFA CONTENT, X
Figure 4-10 - Relationship between Fly Ash Content, Temperature and CI- Diffusion. [Dhir et al, 19931
4.3.2. Effect of Fly Ash Content
It is known [Thomas, 19911 that replacement of OPC with fly ash reduces chlonde
diffusion in concrete. However, the effects are generally Iess than when OPC is replaced
with silica fume. The effect on diaision coefficients of partial replacement of TlOSF
cernent with fly ash is not known.
Cornparison of the 8 mix designs with 2 curing regimes, stored at 3 ternperatures, shows
that the sarnples with fly ash have Iower diffision coefficients than the control rnix
without fly ash in 45 of the 48 cases. The six 56% Sundance fly ash samples provided by
far the lowest bulk diffusion coefficients in al1 conditions. Between 25 and 40%
replacement, however, the effect was inconsistent in al1 t hee types of ash. In the majority
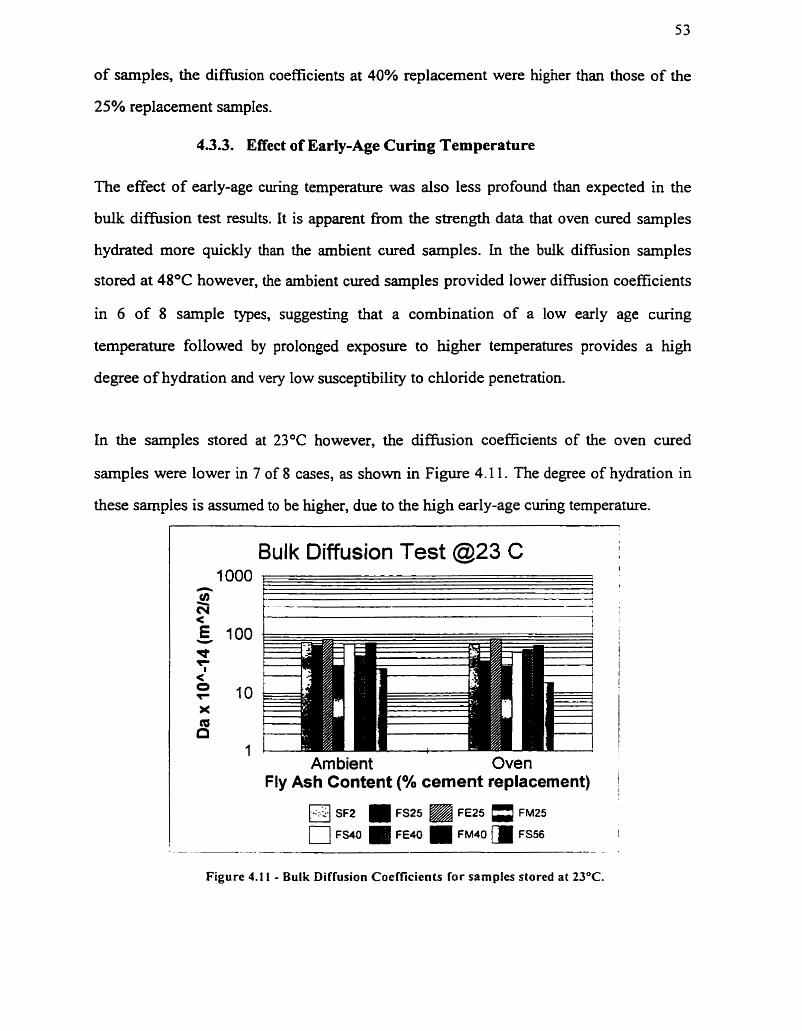
of samples, the diffusion coefficients at 40% replacement were higher than those of the
25% replacement samples.
43.3. EEect of EarIy-Age Curing Temperature
The effect of early-age curïng temperature was also less profound than expected in the
buk diffusion test results. It is apparent nom the strength data that oven cured sarnples
hydrated more quickly than the ambient cured sarnples. In the bulk diffusion samples
stored at 48OC however, the ambient cured samples provided lower diffusion coefficients
in 6 of 8 sample types, suggesting that a combination of a low early age curing
temperature followed by prolonged exposure to higher temperatures provides a high
degree of hydration and very low susceptibility to chioride peneîzation.
In the samples stored at 23OC however, the diffusion coefficients of the oven cured
samples were lower in 7 of 8 cases, as shown in Figure 4.1 1. The degree of hydration in
these samples is assumed to be higher, due to the high early-age curing temperature.
Bulk Diffusion Test @23 C 1000 1
Am bient Oven Fly Ash Content (% cernent replacement)
-. p--- -- -. -
Figure 4.1 1 - Bulk Diffusion Coefficients for sampies stored at 23OC.
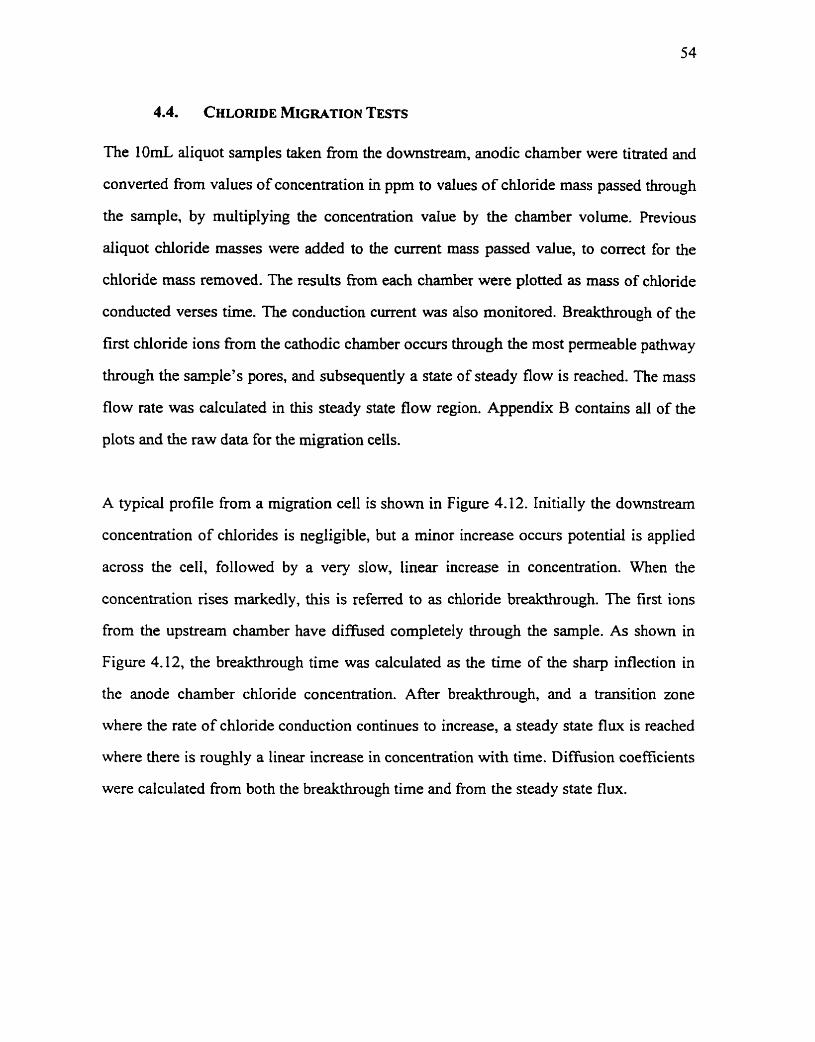
The 1Om.L aliquot samples taken frorn the downstream, anodic chamber were titrated and
converted from values of concentration in ppm to values of chloride mass passed through
the sample, by multiplying the concentration value by the chamber volume. Previous
aliquot chloride masses were added to the current mass passed value, to correct for the
chloride mass removed. The results from each charnber were plotted as mass of chloride
conducted verses time. The conduction current was also monitored. Breakthrough of the
first chloride ions from the cathodic chamber occurs through the most permeable pathway
through the smple's pores, and subsequently a state of steady flow is reached. The mass
flow rate was calculated in this steady state flow region. Appendix B contains al1 of the
plots and the raw data for the migration cells.
A typical profile fiom a migration ce11 is shown in Figure 4.12. Initially the downstream
concentration of chlorides is negligible, but a minor increase occurs potential is applied
across the cell, followed by a very slow, linear increase in concentration. When the
concentration nses markedly, this is referred to as chloride breakthrough. The first ions
from the upstream charnber have d i f i e d completely through the sample. As shown in
Figure 4.12, the breakthrough time was calculated as the time of the sharp inflection in
the anode chamber chioride concentration. Afier breakthrough, and a transition zone
where the rate of chloride conduction continues to increase, a steady state flux is reached
where there is roughly a linear increase in concentration with time. Difision coefficients
were calculated from both the breakthrough time and from the steady state flux.
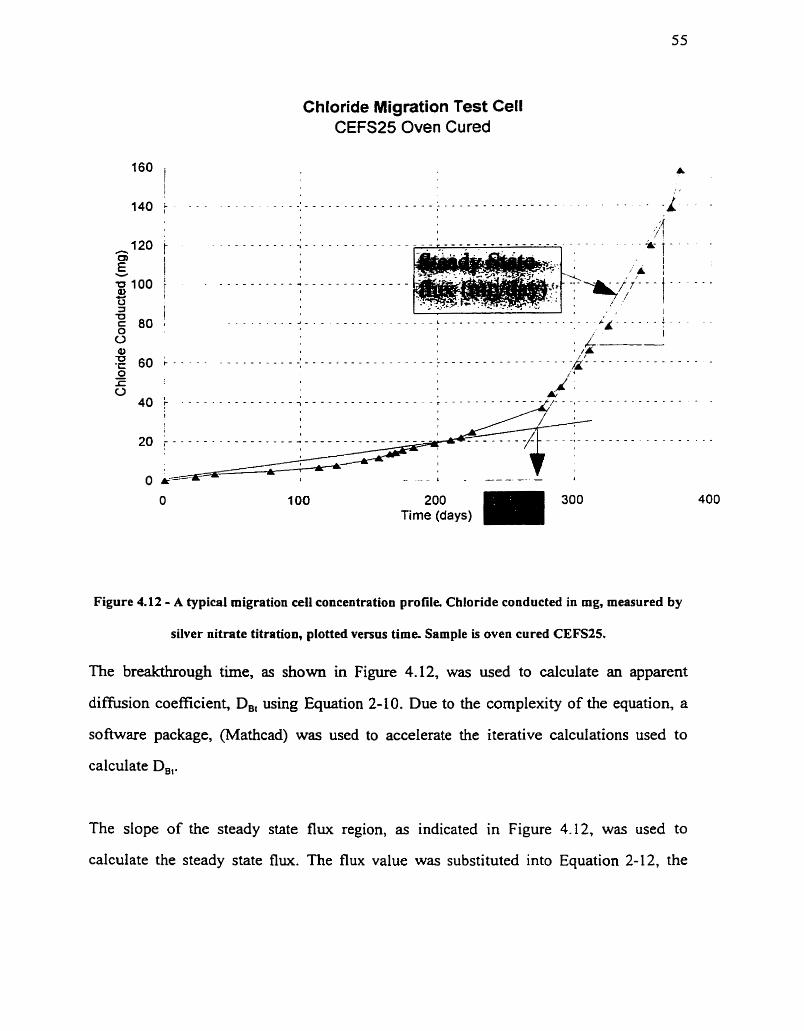
Chloride Migration Test Cell CEFS25 Oven Cured
Time 200 (days) 300
Figure 4.12 - A typical migration cell concentration profile. Chlonde conducted in mg, messured by
silver nitrate titration, plotted versus time. Sample is oven cured CEFS25.
The breakthrough time, as shown in Figure 4.12, was used to calculate an apparent
diffusion coefficient, D,, using Equation 2-10. Due to the complexity of the equation, a
software package, (Mathcad) was used to accelerate the iterative calculations used to
calculate D,,.
The dope of the steady state flux region, as indicated in Figure 4.12, was used to
calculate the steady state flux. The flux value was substituted into Equation 2-12, the
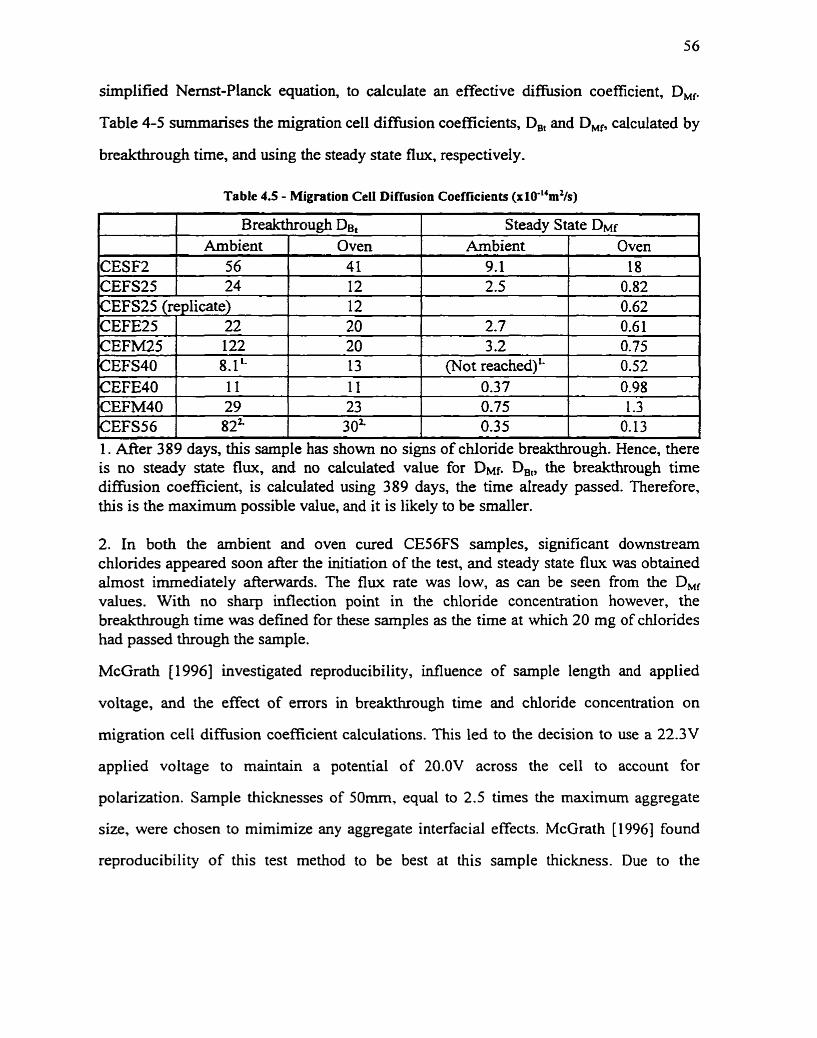
simplified Nernst-Planck equation, to calculate an effective diffusion coefficient, DM,
Table 4-5 summarises the migration ce11 diffusion coefficients, D , and DM, calculated by
breakthrough tirne, and using the steady state flw, respectively.
Table 4.5 - Migration CeIl Diffusion Coefficients (xlO*"mZ/s)
1 1 Breakthrough De, Steady State DMf 1 1 1 Ambient 1 Oven 1 Ambient 1 Oven I
1. s e r 389 days, this sample has shown no signs of chloride breakthrough. Hence, there is no steady state flux, and no calculated value for DMf. DBi, the breakthrough time diffision coefficient, is calculated using 389 days, the time already passed. Therefore, this is the maximum possible value, and it is likely to be smaller.
CESF2 CEFS25
2. In both the ambient and oven cured CE56FS samples, significant downstream chlorides appeared soon f i e r the initiation of the test, and steady state flux was obtained almost immediately aftenvards. The flux rate was low, as can be seen from the DM, values. With no sharp inflection point in the chloride concentration however, the breakthrough time was defined for these samples as the tirne at which 20 mg of chlorides had passed through the sample.
McGrath [ 1 9961 investigated reproducibility, influence of sarnple length and applied
56 24
voltage, and the effect of errors in breakthrough time and chloride concentration on
migration cell diffision coefficient calculations. This led to the decision to use a 22.3V
41 12
CEFS25 (replicate)
applied voltage to maintain a potential of 20.OV across the ce11 to account for
12 20 20 13
CEFE25 CEFM25 CEFS40
polarization. Sample thicknesses of 5 0 m , equal to 2.5 times the maximum aggregate
9.1 2.5
22 122 8.1'-
size, were chosen to mimimize any aggregate interfacial effects. McGrath [1996] found
-
18 0.82
2.7 3.2
(Not reached) '- CEFE40
reproducibility of this test method to be best at this sarnple thickness. Due to the
0.62 0.6 1 0.75 0.52
0.37 I I 1 I l 0.98
excessive length of testing however, and having 8 mixes with two curing regimes and a
limited number of migration cells available, only one replicate was performed, with a
CEFS25, oven cured sample. As c m be seen in Table 4-5 however, the replicate result
was very good.
McGrath 119961 defined breakthrough tirne with two methods, the method used here and
also as the tirne at which 20mg of chiorides had passed through the sample. In this
research however, due to the low permeability of the concrete, the time between these
breakthrough times and also before steady state flux was reached was considerable in
many samples, so the first breakthrough time definition was chosen to be more consistent
and suitable in this research.
General plots of the breakthrough time and steady state migration ce11 diffusion
coefficients follow as Figures 4- 1 3 and 4- 14, respectively .
Migration Cell Diffusion Coefficients A nnn Breakthrough CalculatÏons
- Ambient Cured Oven Cured
Figure 4.13- Migration Cell Breakthrough Time Diffusion Coefficients
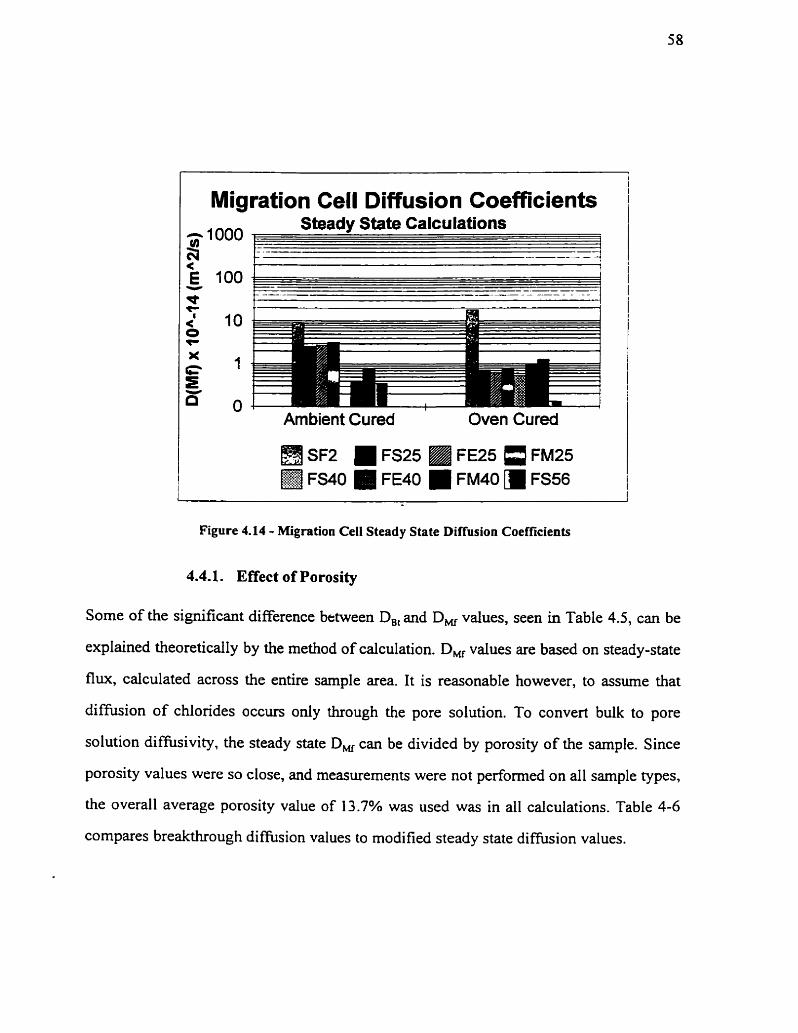
Migration Cell Diffusion Coefficients Steadv State Calculations
Arnbient Cured Oven Cured
Figure 4.14 - Migration Celi Steady State Diffusion Coefficients
4.4.1. Effect of Porosity
Some of the significant difference bctween D,, and D, values, seen in Table 4.5, can be
explained theoretically by the rnethod of calculation. D, values are based on steady-state
flux, calculated across the entire sample area. It is reasonable however, to assume that
diffusion of chlorides occurs oniy through the pore solution. To convert bulk to pore
solution diffisivity, the steady state D, can be divided by porosity of the sample. Since
porosity values were so close, and measurernents were not performed on al1 sample types,
the overall average porosity value of 13.7% was used was in al1 calculations. Table 4-6
compares breakthrough difision values to modified steady state diffision values.
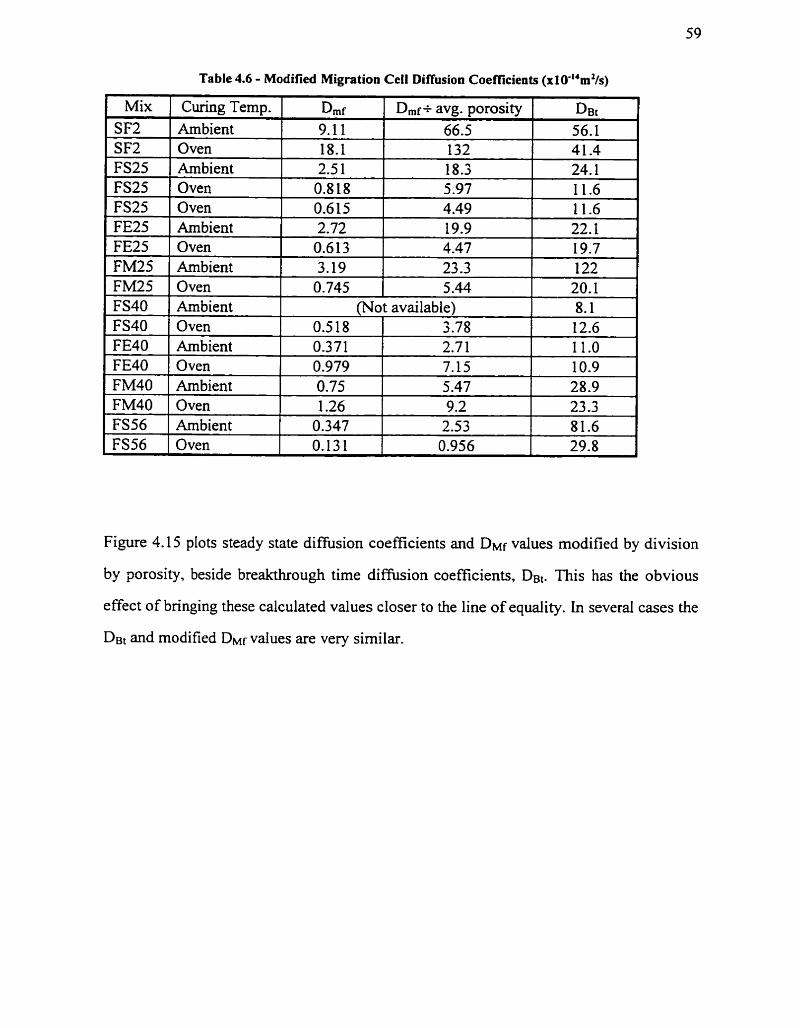
Table 4.6 - Modified Migration Cel l Diffusion Coefficients (x10"'m2/s)
Figure 4.15 plots steady state diffusion coefficients and DMf values modified by division
by porosity, beside breakthrough time difision coefficients, DBt. This has the obvious
effect of bringing these calculated values closer to the line of equality. In several cases the
Del and modified DMf values are very similar.
Mix 1 Curing Temp. Dmf
9.1 1 18.1 2.5 1 0.8 18 0.6 15
SF2 SF2 FS25 FS25 FS25 FE25 FE25 FM25 FM25 FS40 FS40 FE40 FE40 FM40 FM40 FS56 FS56
Ambient Oven Ambient Oven Oven Ambient Oven Ambient Oven Ambient Oven Ambient Oven Ambient Oven Ambient Oven
Dmr+ avg. porosity 66.5 132 18.3 5.97 4.49
D B ~ 56.1 41.4 24.1 11.6 11.6 22.1 19.7 122
l
20.1 8.1
2.72 1 19.9 0.6 13 4.47
0.5 18 0.371 0.979 0.75 1.26 0.347 0.131
3.19 1 23.3 0.745 5.44
(Not available) i
3.78 2.7 1 7.15 5.47 9.2 2.53 0.956
12.6 11.0 10.9 28.9 23 -3 81.6 29.8
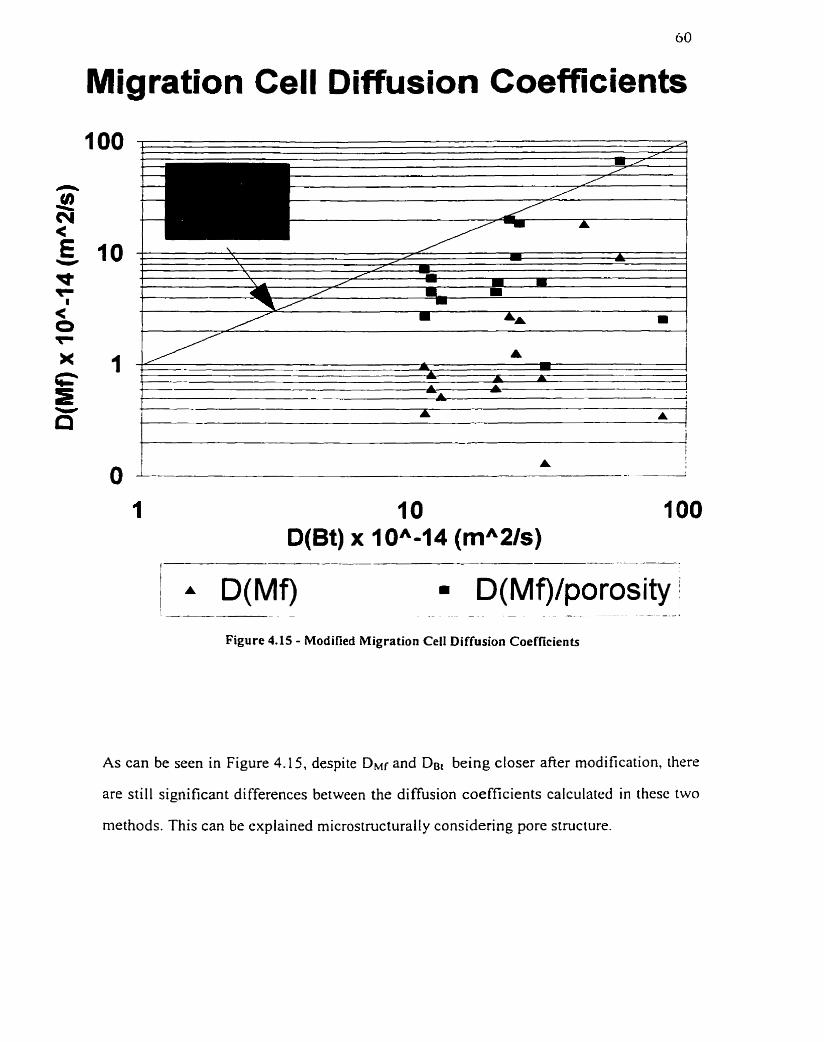
Migration Cell Diffusion Coefficients
- - - - . -- - - 4
Figure 4.15 - Modified Migration CeIl Diffusion Coefficients
As can be seen in Figure 4.15, despite DMf and De, being closer afier modification, there
are still significant differences between the diffusion coefficients calculated in thesc two
methods. This can be explained microstructurally considering pore structure.
Breakthrough time. used to calculate Del is the point at which the fint chloride ions have
migrated across the entire sample and into the anodic charnber solution. Breakthrough has
occured at t h i s point. but the ions may only be traversing across the sample in one or two
extremely tornious routes through the pore structure. The rate at which they continue to
diffuse across the sample constitutes the flux of ions, which is used to calculate the steady
state diffusion coefficient, Dur If early ion breakthrough has occurred but only through
one or two routes, the flux may be very low. This would lead to a high De, and a low DMf.
Conversely, the opposite is possible. If breakthrough takes an extremely long time, but
occurs simultaneously through many routes, low De, and high D M ~ coefficients would
result.
In the 56% replacement sarnples, regardless of how it was defined, breakthrough occured
very early, leading to relatively high values for De,. The flux was very low in these
samples however, constituting very low values for Dur Breakthrough of ions may have
occured in these sarnples through only a one or two routes, and despite high De, values.
these concretes may provide a considerable service lifetime.
4.4.2. Effect of Ash Type and Replacement Level
The effect of ash type and replacement level was more profound in the migration ceil test.
Regardless of the type of difhsion coefficient calculation, at both 25 and 40%
replacement levels, the low Ca0 content, Fort Martin Allegheny fly ash concretes
performed poorly. relative to both the Sundance and Edgewater fly ash concretes. Figures
4.16 and 4.17 respectively, show the arnbient and oven cured sarnple breakthrough time
diffùsion coefficients. at 25 and 40% fly ash replacement, with al1 three fly a h types.
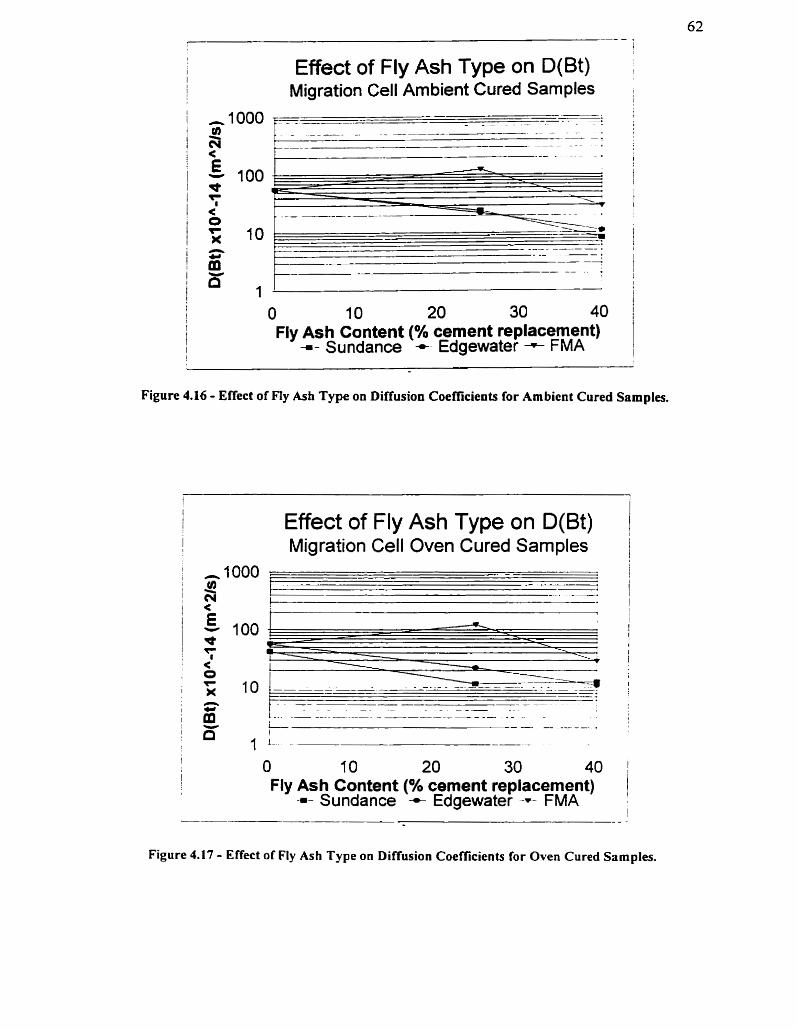
Effect of Fly Ash Type on D(Bt) Migration Cell Ambient Cured Samples
O 10 20 30 40 Fly Ash Content (% cernent replacement) -- Sundance + Edgewater - FMA
Figure 4.16 - Effect of FIy Ash Type on Diffusion Coefficients for Ambient Cured Samples.
Effect of Fly Ash Type on D(Bt) Migration Cell Oven Cured Samples
Fly Ash Content (% cernent replacement) -=- Sundance + Edgewater --- FMA
--
Figure 4.17 - Effect of Fly Ash Type on Diffusion Coefficients for Oven Cured Sarnples.
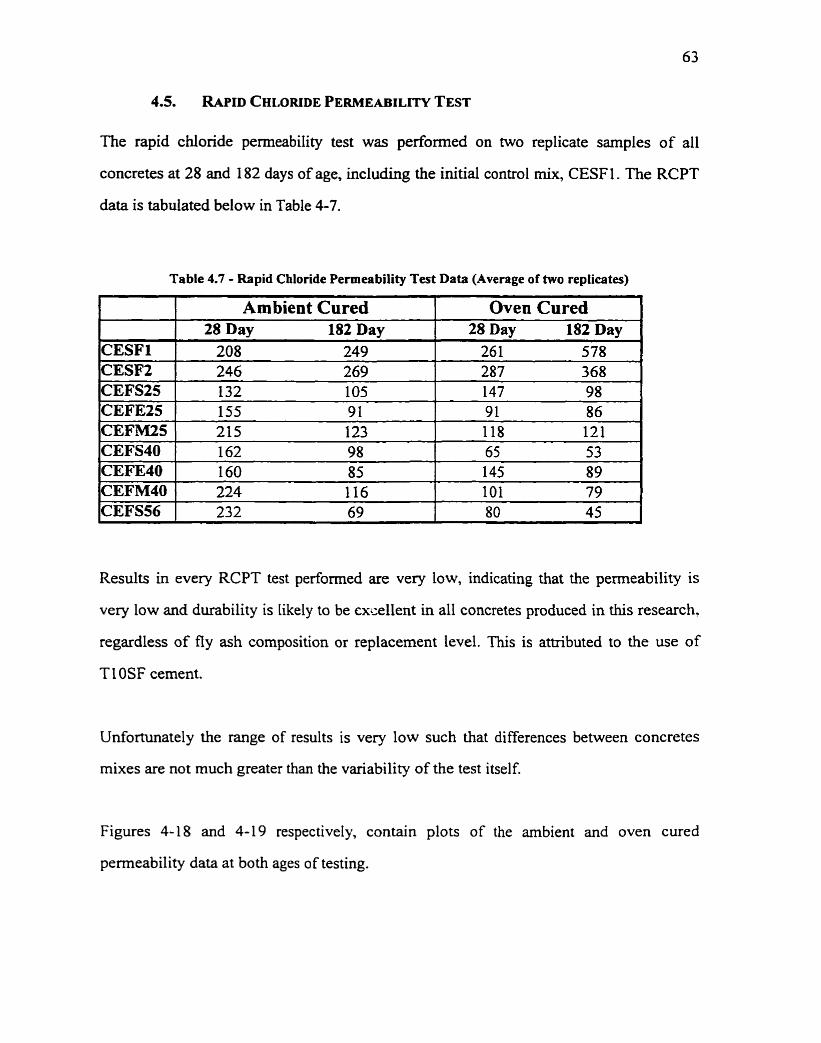
The rapid chloride permeability test was performed on two replicate sarnples of al1
concretes at 28 and 182 days of age, includuig the initial control mix, CESFI. The RCPT
data is tabdated below in Table 4-7.
Table 4.7 - Rapid Chloride Permeability Test Data (Average of two repiicates)
1 1 Ambient Cured 1 Oven Cured 1 28 Day 182 Day 28 Day 182 Day
C E S F l 208 249 26 1 578 CESF2 246 269 287 368 CEFS25 132 105 147 98
Results in every RCPT test performed are very low, indicating that the permeability is
very low and durability is likely to be excellent in al1 concretes produced in this research,
regardless of fly ash composition or replacement level. This is attributed to the use of
TI OSF cernent.
Unfortunately the range of results is very low such that differences between concretes
mixes are not much greater than the variability of the test itself.
Figures 4-18 and 4-19 respectively, contain plots of the ambient and oven cured
permeability data at both ages of testing.
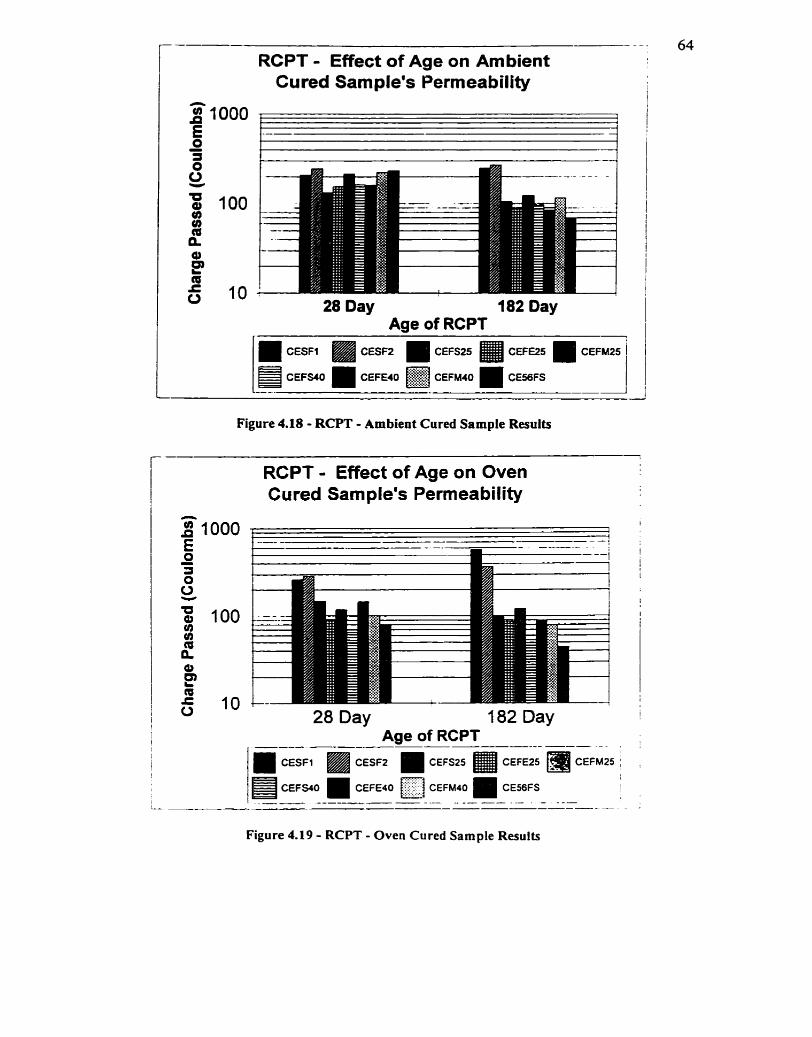
- - -
RCPT - Effect of Age on Ambient Cured Sample's Permeability
28 Day 182 Day Age of RCPT
Figure 4.18 - RCPT - Ambient Cured Sample Results
-
RCPT - Effect of Age on Oven Cured Samplems Perrneability
28 Day 182 Day Age of RCPT
CESFI CESFI CEFS25 CEFE25 CEFM25 I
CEFS40 CEFE4O CESBFS ,
Figure 4.19 - RCPT - Oven Cured Sample Resuits
Figures 4.20,2 1,22 and 23 show the effect of fly ash content on ambient and oven cured
samples, tested at 28 days and at 182 days, respectively. It is apparent in every case that
increasing fly ash content reduces the rapid chioride permeability, except in the 28 day,
ambient cured samples, where the test results are similar for ail concretes. At this early
age, the beneficial effects of fly ash have yet to be realized.
l
RCPT - 28 Day Ambient Cured Samples 1 I !
O O 10 20 30 40 50 60 1 Fly Ash Content (% cernent replacement) j
+ Sundance -- Edgewater - FMA
Figure 4.20 - RCPT - Effect of Fly Ash Content, Ambient Curing, 28 Day Tests
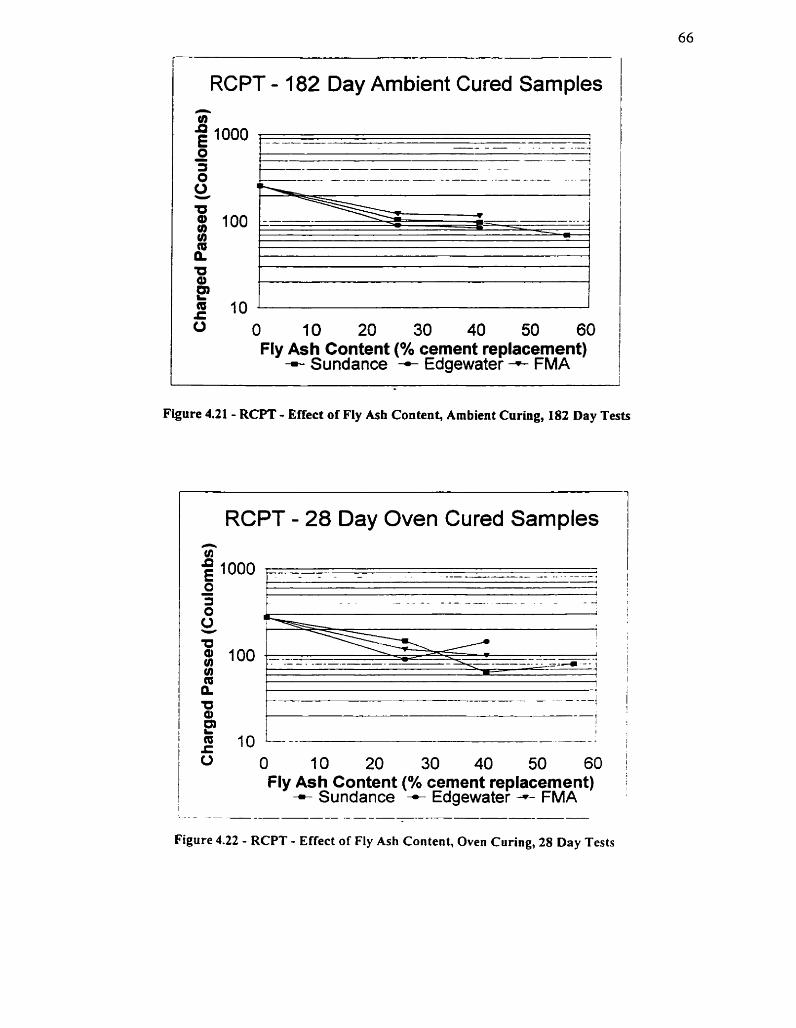
RCPT - 182 Day Ambient Cured Samples
Fly Ash Content (% cernent replacement) + Sundance -+ Edgewater + FMA
Figure 4.21 - RCPT - Effect of Fly Ash Content, Ambient Cunng, 182 Day Tests
RCPT - 28 Day Oven Cured Samples 1 I
F ly Ash Content (% cernent replacement) i + Sundance - Edgewater -- FMA
Figure 4.22 - RCPT - Effect of Fly Ash Content, Oven Curing, 28 Day Tests
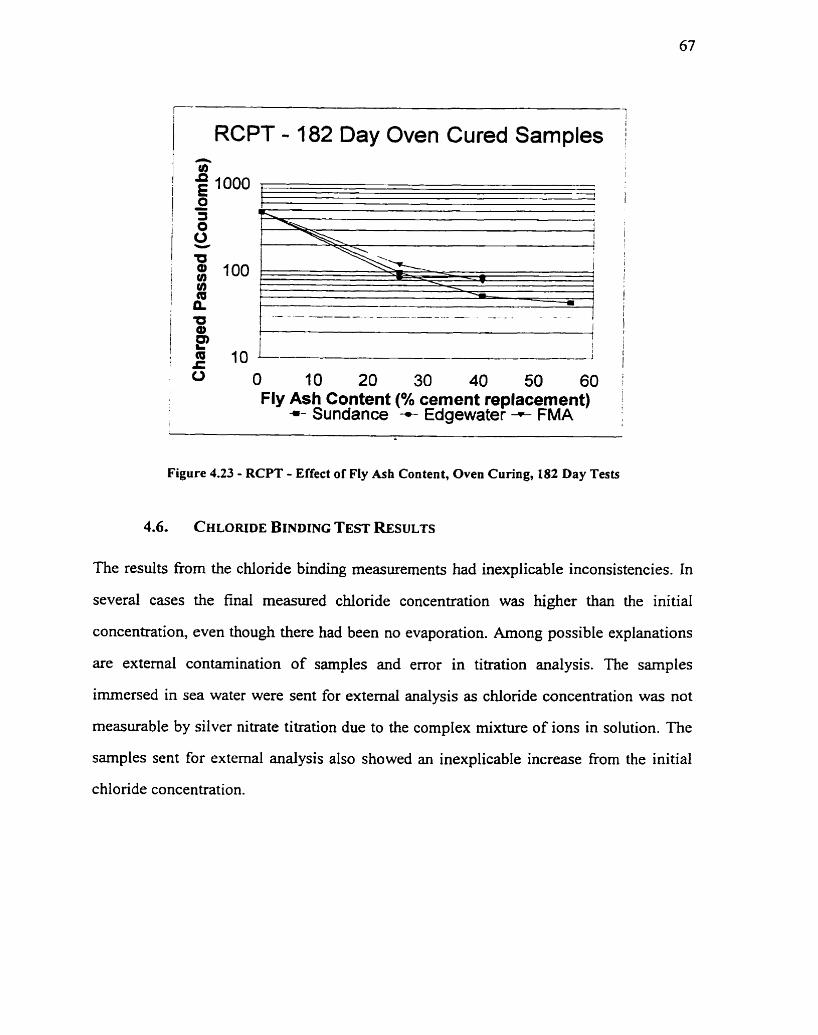
,
RCPT - 182 Day Oven Cured Samples i
O 10 20 30 40 50 60 i FlyAshContent(%cernentreplacement)
*- Sundance + Edgewater - FMA
Figure 4.23 - RCPT - Effect of Fly Ash Content, Oven Curing, 182 Day Tests
The results fiom the chlonde binding measurements had inexplicable inconsistencies. In
several cases the final measured chloride concentration was higher than the initial
concentration, even though there had been no evaporation. Among possible explanations
are extemal contamination of sarnples and error in titration analysis. The samples
irnrnersed in sea water were sent for extemal analysis as chlonde concentration was not
measurable by silver nitrate titration due to the cornplex mixture of ions in solution. The
sarnples sent for extemal analysis also showed an inexplicable increase fiom the initial
chloride concentration.
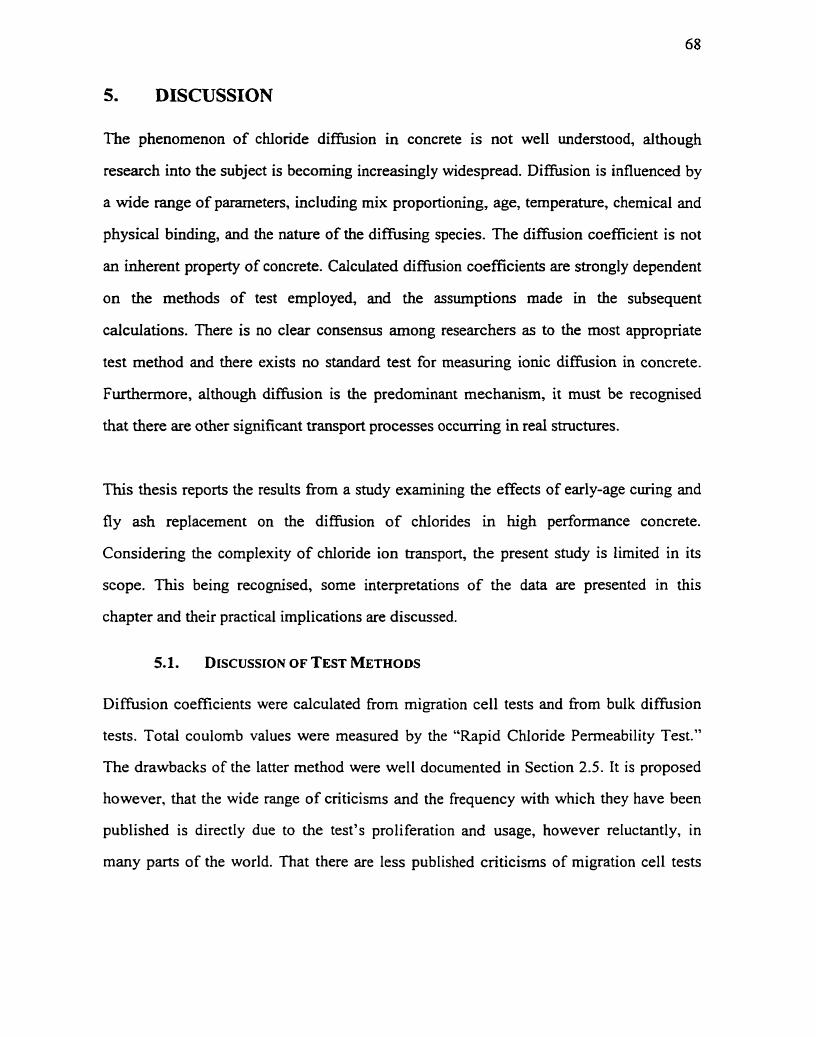
DISCUSSION
The phenomenon of chloride diffusion in concrete is not well understood, although
research into the subject is becoming increasingly widespread. Diffusion is influenced by
a wide range of pararneters, including mix proportioning, age, temperature, chernical and
physical binding, and the nature of the diffusing species. The diffusion coefficient is not
an inherent property of concrete. Calculated diffusion coefficients are strongly dependent
on the methods of test employed, and the assumptions made in the subsequent
calculations. There is no clear consensus among researchers as to the most appropriate
test method and there exists no standard test for measuring ionic diaision in concrete.
Furthermore, although diffusion is the predominant mechanism, it m u t be recognised
that there are other significant transport processes occurring in red structures.
This thesis reports the results from a study exarnining the effects of early-age curing and
fly ash replacement on the diffusion of chiondes in high performance concrete.
Considering the complexity of chioride ion transport, the present study is limited in its
scope. This being recognised, some interpretations of the data are presented in this
chapter and their practical implications are discussed.
Difision coefficients were calculated from migration ce11 tests and &om bulk diffision
tests. Total coulomb values were measured by the "Rapid Chloride Permeability Test."
The drawbacks of the latter method were well documented in Section 2.5. It is proposed
however, that the wide range of criticisms and the frequency with which they have been
published is directly due to the test's proliferation and usage, however reluctantly, in
many parts of the world. That there are less published cnticisms of migration ce11 tests
and bulk dimision tests may be related to the fact that they are less cornrnon, and not
because they are due any less cnticism.
5.1.1. Correlation between RCPT Data and Dm, Values
The appropriateness of comparing RCPT data to chioride difision data was questioned
in Section 2.5, as was the reproducibility of the RCPT. Regardless, correlation between
DMf values and RCPT data was measured fiom the results in this research project, and
compared to test data collected in the same methods by McGrath [1996], and Thomas and
Jones [I 9961. Figures 5.1 and 5.2 plot the correlation as log vs. log and normal axes plots
respectively. Figure 5.2 includes the equation of the best fit line, and its coefficient of
variation.
D(Mf) Values vs. RCPT Results
1 O0 1
1 O0 1 O00 1 O000 RCPT (Coulombs)
1 McGnth [1996] A Thomas and Jones [ l Q O q - Thls Project
'--- --
Figure 5.1 - DM, vs. RCPT Results
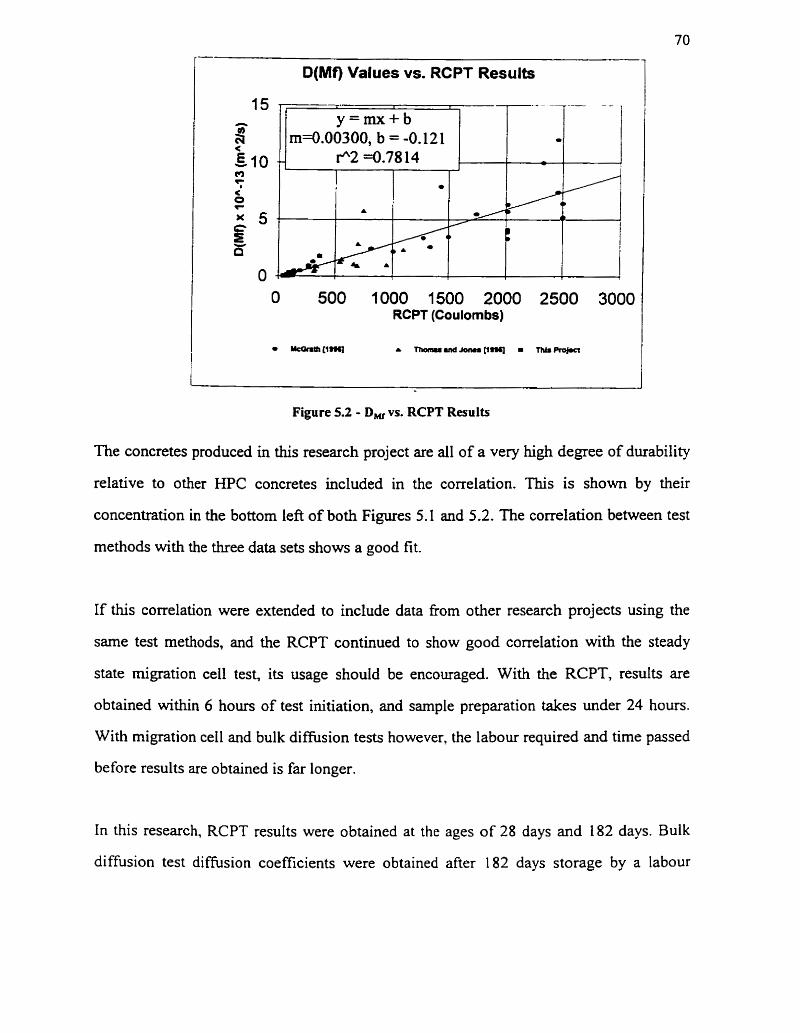
D(Mf) Values vs. RCPT Results
O 500 1000 1500 2000 2500 3000 RCPT (Coulombs)
Figure 5.2 - D, vs. RCPT Resu lts
The concretes produced in this research project are al1 of a very hi& degree of durability
relative to other HPC concretes included in the correlation. This is shown by their
concentration in the bottom left of both Figures 5.1 and 5.2. The correlation between test
methods with the duee data sets shows a good fit.
If this correlation were extended to include data fiom other research projects using the
same test methods, and the RCPT continued to show good correlation with the steady
state migration ceil test, its usage should be encouraged. With the RCPT, results are
obtained within 6 hours of test initiation, and sample preparation takes under 24 hours.
With migration ceil and bulk diffusion tests however, the labour required and time passed
before results are obtained is far longer.
In this research, RCPT results were obtained at the ages of 28 days and 182 days. B u k
diffusion test diffusion coefficients were obtained afier 182 days storage by a labour
intensive profile grinding process (described in Section 3.5.3). Migration ce11 d i f i i o n
coefficients were obtained f i e r many months, and in several cases, almost 2 years of
weekly chloride concentration monitoring.
The three test methods employed have similar preparation requirements. Solutions have
to be prepared, epoxy coatings have to be applied, and vacuum-saturation is necessary
before tests are started. AAer iiitiation however, the RCPT provides the total coulomb
value afler 6 hours (and instantaneous values during the test upon demand). The time and
labour required monitoring, analysing and calculation diffusion coeficients in the other
two test methods, over many months are obviously strong arguments for development of
the correlation between these test methods, and for wider relative usage of the RCPT.
Another aspect worth consideration is that the RCPT is an instantaneous test. The
coulomb value is given for the specific age at which the test is performed. Long term
testing measures diffision coefficients over an extended time period, and the result is a
value which is assumed to be the average value over the entire testing tirne. Especially in
fly ash and slag rnodified concretes where diffusion coefficients have been s h o w to
decrease markedly with time, this is a downfall of extended testing periods. The fact that
the RCPT does not provide a diffision coefficient is not much of a detriment to its use
when the diffision coef'fîcients provided in labour intensive bulk diffusion and migration
ce11 test methods have been shown to Vary considerably.
The data produced from the various test methods on the eight concrete mixes c m be used
to compare the relative influences of early-age curing temperature, and fly ash types and
replacement levels on durability. Tables 5.1, 5.2 and 5.3 contain rankings of the 8 mixes
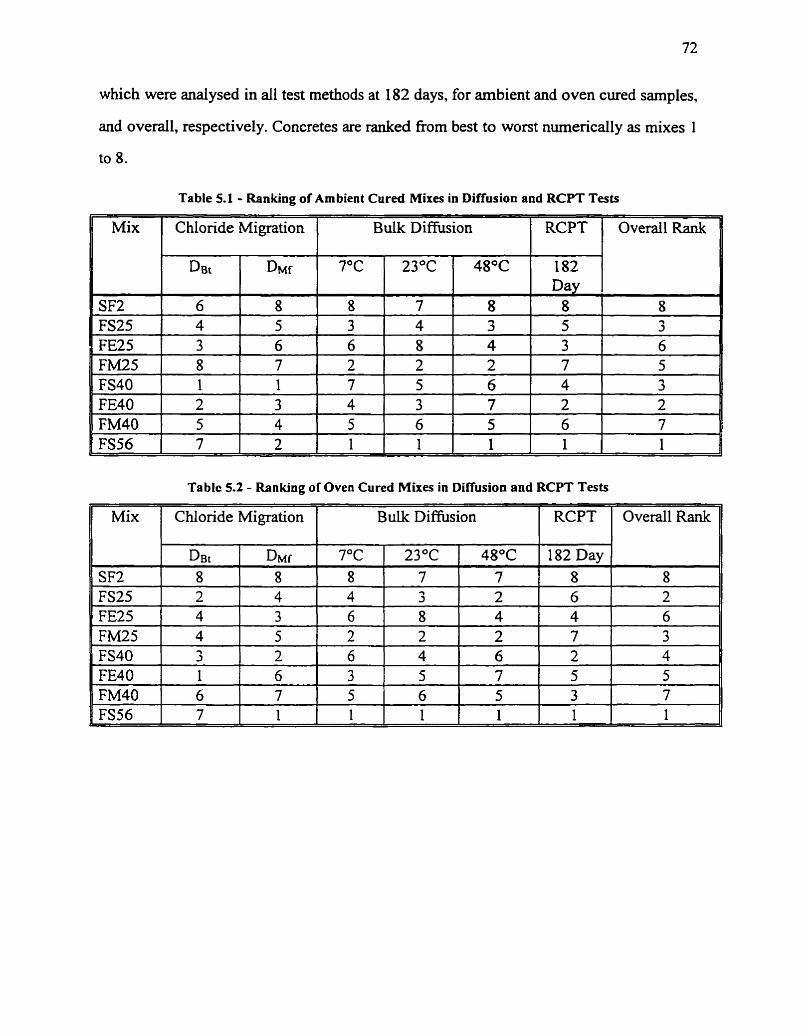
which were analysed in al1 test methods at 182 days, for arnbient and oven cured sarnples,
and overall, respectively. Concretes are ranked fkom best to worst numerically as mixes 1
to 8.
Table 5.1 - Ranking of Ambient Cured Mixes in Diffusion and RCPT Tests
Mix / Chloride Migration l Bulk D i h i o n
Table 5.2 - Ranking of Oven Cured Mixes in Diffusion and RCPT Tests
SF2 FS25
11 Mix / Chionde Migration I Buik Diffusion
D B ~
6 4
SF2 FS25 FE25 FM25 FS40 FE40 FM40 FS56
D M ~
8 5
7°C
8 3
FE25 FM25 FS40 FE40 FM40 FS56
3 8 1 2 5 7
D B ~ 8 2 4 4 3
23°C
7 4
6 7 1 3 4 2
48°C 182 Day
8 8 8 3 5 3
8 2 5 3 6 1
6 2 7 4 5 1
D M ~ 8 4 3 5 2
4 3 6 2 7 5 6 4 3 7 2 2 5 6 7 I 1 1
7°C
8 4 6 2 6
1 6 1 3 5 1
6 7
23OC 7 3 8 2 4
7 1
48°C 182 Day 7 8 8 2 6 2 4 4 6 2 7 3 6 2 4
5 6 1
7 5 5 5 3 7 1 1 1 1
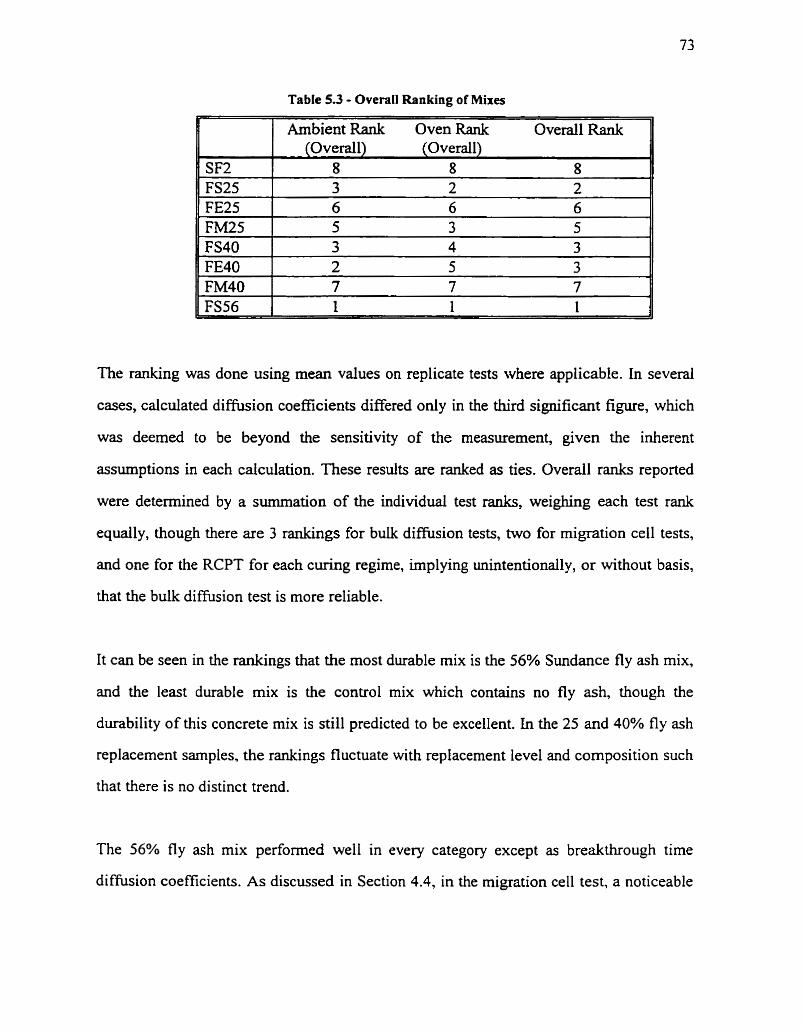
The ranking was done using mean values on replicate tests where applicable. In severai
cases, calculated diffusion coefficients differed only in the third significant figure, which
was deemed to be beyond the sensitivity of the rneasurement, given the inherent
assumptions in each calculation. These results are ranked as ties. Overall ranks reported
were determined by a summation of the individuai test ranks, weighing each test rank
equally, though there are 3 rankings for buk difision tests, two for migration ce11 tests,
and one for the RCPT for each curing regime, implying unintentionally, or without basis,
that the bulk diffusion test is more reliable.
Table 5.3 - Overall Ranking of Mixes
It can be seen in the rankings that the most durable mix is the 56% Sundance fly ash mix,
and the least durable rnix is the control mix which contains no fly ash, though the
durability of this concrete mix is still predicted to be excellent. In the 25 and 40% fly ash
replacement samples, the rankings fluctuate with replacement level and composition such
that there is no distinct trend.
SF2 FS2S FE25 FM25 FS40 FE40 FM40 FS56
The 56% fly ash mix performed well in every category except as breakthrough time
difhsion coefficients. As discussed in Section 4.4, in the migration ce11 test, a noticeable
Ambient Rank Oven Rank Overall Rank (Overall) (Overall) ,
8 8 8 3 2 2 6 6 6 5 3 5 3 4 3 2 5 3 7 7 7 , 1 1 1 1
increase in the downstream chioride concentration appeared relatively quickly in these
samples. Breakthrough occurred earlier in these samples than in any others. but the flux
was very low, so this early breakthrough is not considered to be tembly critical, or of
serious consequence to the potential durability of these concretes.
Why chlondes were detected downstream soon after the potential gradient was applied in
the 56% Sundance samples is not undeetood. If the anodic chamber had been
contaminated, and contained chlondes at the start of the test, they would be of a finite
arnount, and presumably wodd not have shown the orderly, measured increase in
concentration with time. Contaminated or background chlondes inside the concrete
samples are another possible source, but background levels in the sarne cylinders from the
same mixes were measured in the bulk diffusion test, and found to be negligible
(>0.0 125% by weight of dry concrete). The obvious (and intentional) source of chlondes
in this test is the upstream charnber. If the pore structure was continuous such that
chlorides were conducted across the entire sample imrnediately upon application of the
20V potential, this would explain the increase. This is however considered highly
improbable in 50mm thick samples of concrete that have been shown to be highly
impermeable. And if this were the source, a much higher flux should have resulted, and
rnuch higher steady state migration ce11 difision coefficients. The accuracy and
reliability of the silver billet electrode, and of the entire method of chloride analysis is not
doubted, though analysis was only performed on one machine. Confirmation of titrator
reliability would be useful, and could be done by cornparisons with another machine, or
by measurement of chIoride concentrations in another test method. Although binding
capacities have been s h o w to be high in fly ash modified concretes, a low chloride
binding capacity of the Sundance fly ash could account for earlier breakthrough times.
This does not explain the imrnediate detection of downstream chlorides however. Perhaps
the explanation lies in the epoxy-concrete bond which may have been poor for these
sarnples, allowing for a small movement of chlorides dong this interface. Alternatively,
there may be a skin effect which is more pronounced at higher fly ash replacement levels.
The elevated curing regime aimed to establish the influence of the autogeneous
temperature rise experienced in large volume pours, not to simulate a steam-curing
regirne. The chosen curing regime was thought to be typical of large volume concrete
pour environrnents. The specific rate of temperature increase and the length of exposure
to elevated temperatures will v q depending on the specifics of the project. and the effect
on durability and strength properties will obviously be affected depending on the specific
curing regime.
The curing regime employed in this project had a noticeable effect on the early-age
strengths in al1 mixes, but this effect decreased with time. At 182 days. linle difference
remained between oven and ambient cured cylinder strengths. This was dernonstrated in
Figures 4.1, 4.2 and 4.3 respectively. Even the lowest early-age strength mix, the 56%
Sundance ambient cured mix demonstrated reasonable strength at 1 day however.
The curing regime did not seem to have a significant or consistent effect on the difhsion
coefficients of the mixes studied in this research project. As mentioned in Section 4.3, it
was assumed that the sarnples were maturing, thereby negating the effects of the early-
age curing temperature. It is assurned that diffusion coefficients will decrease over time in
the fly ash modified concretes regardless of the early age curing regime. The high early-
age curing temperature accelerates the pozzolanic reactions, such that the reduction in
difision coefficients with time will be less in the oven cured concretes.
5.4.1. Composition
It has been well established that a low calcium oxide content in fly ash improves the
resistance to alkali aggregate reaction of iiy ash rnodified concretes [Thomas, 19941. No
conclusive assertions have been made about the efYect of calcium oxide content on
chloride diffusion related tests. It has been suggested in literature that higher Ca0
contents in fly ash repl~cement both improve and woeen the RCPT results. With the
same set of data, nom RCPT tests on two Class F ashes and one Class C, Malek, Roy and
Fang [1985] found that the Class C had lower RCPT values, and Roy, Malek and Licastro
[1987] found that CIass F ash had lower RCPT results.
Ellis et al, [1991] with two type F ashes and one type C By ash found that a higher Ca0
level in fly ash reduces RCPT results, or lowers permeability. The RCPT results in this
research project also gerierally show that higher the Ca0 contents, or ASTM Class C
ashes, provide Iower RCPT values. In diffusion measurements however, the best ash
seems to be the intermediate Ca0 level Sundance Ash. There are Iikely other factors
besides Ca0 level that affect performance of fly ash in diffusion testing. Reactivity or
pozzolanity, particle size distribution, and the quantity of reactive alumina, rather than
total alumina content, which may potentially be available for chloride binding will al1
affect the the effectiveness of the ash in improving durability.
5.4.2. Level of Replacement
Generally the beneficial effects of fly ash are more profound in long term analysis. In the
182 day RCPT results, the 56% Sundance mix shows the best results, regardless of the
early-age curing regime. This is s h o w in Figures 4.2 1 and 4.23.

There are many advantages of fly ash replacement of cernent in concrete. Economically
fly ash is cheaper than cernent. Environmentaily, By ash is an industrial waste product, so
its reuse reduces waste disposal or storage concems. Cernent manufacture is an
environmentall y harmful process, requiring considerab le energy, while creating large
volumes of greenhouse gases in its creation. Reducing the cernent requirements has
obvious environmental advantages.
Use of ash in construction projects also has advantages. Fly ash modified concretes are
easier to place, pump, finish and compact. Chernical resistance to alkali-aggregate
reaction is not guaranteed by the inclusion of silica fume in concrete, but is assured with
fly ash.
The early-age strength may be a concem with hi& volume fly ashes, but has been s h o w
to be sufficient for many construction purposes. The long term strength is excellent
however, and the durability was shown to be much improved by high volume fly ash
replacement in this research.
Fly ash has been referred to as a cheap filler in concrete. While it has recognised
economic advantages, its demonstrated benefits to improving durability show that it is
far more than a cheap filler. How it continues to hydrate and react over time in such an
impermeable environment, with a low initial water content is not understood. Regardless,
the merits of fly ash have been proven.
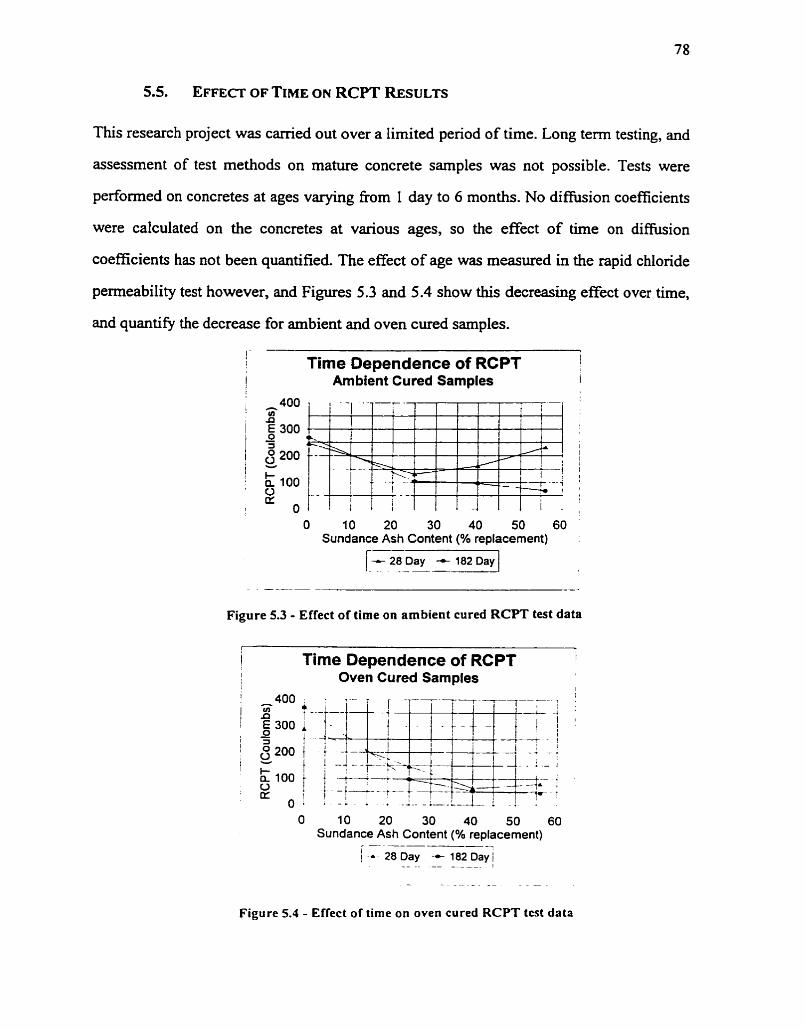
5.5. EFFEC~ OF TIME ON RCPT RESULTS
This research project was camied out over a lirnited period of time. Long term testing, and
assessrnent of test rnethods on mature concrete samples was not possible. Tests were
performed on concretes at ages varying from 1 day to 6 months. No diffusion coefficients
were calculated on the concretes at various ages, so the effect of t h e on difision
coefficients has not been quantified. The effect of age was measured in the rapid chloride
permeability test however, and Figures 5.3 and 5.4 show this decreasing effect over time,
and quanti& the decrease for ambient and oven cured samples.
Time Oependence of RCPT Arnbient Cured Samples
O 10 20 30 40 50 60 Sundance Ash Content (% replacement)
/72-/
Figure 5.3 - Effect of t h e on ambient cured RCPT test data
i Time Dependence of RCPT 1 I , Oven Cured Samples
O 10 20 30 40 50 60 Sundance Ash Content (% replacement)
.- ------ 1 -&- 28 Day -+ 182 Day /
Figure 5.4 - Effect o f time on oven cured RCPT test data
It is quite apparent in Figure 5.3 that the ambient cured sarnples with fly ash replacement
of the TlOSF cernent are becoming less permeable over tirne. It is not unreasonable to
assume that the diffusion coefficients would also decrease over time, as the slow,
complex reactions of the fly ash are taking place. This has been previously established
[Thomas and Mattfiews, 19961.
The ambient cured control concretes produced without fly ash replacement do not
expenence the same decrease in permeability over time, and in fact these values increased
with time, possibly due to self-dessication in the sarnples. This has been found to be a
problem in silica Fume modified mortars WcGrath and Hooton, 199 11. The oven cured
samples with fly ash did not experience the sarne decrease in RCPT results over time and
it is expected that the ponolanic reactions of the fly ash were accelerated greatly by the
elevated curing regime, and even at the early age, a high degree of hydration had already
occurred. Al1 of the measured RCPT values in this research project are low however, and
it could be argued that differences are not significant considenng the inherent variability
in the test wooton, 19881.
The Canadian Standard for Design of Concrete Structures, CSA 23.3-94, Section
A1 5.1.7, recommends the minimum cover depth for concrete exposed to marine or de-
icing salts as 60mm, but tolerates a 20mm fluctuation in cover depth. The fixed-link
Northumberland Straits Crossing, or "Codederation Bridge" to Prince Edward Island was
designed with the following specifications and considerations:
Cernent content: 450 kg/& Silica Fume content: 7.5-8.5% Depth of cover in splash/tidai zone: 1 OOmm Minimum anticipated cover depth: 8Ornm Maximum anticipated curing temperature: 60°C Mean ocean temperature: 7.3"C Water cernent ratio: 0.34
Using a chioride modelling software package, "ChlorFLow," developed by Evan Bentz
and Dr. Michael Thomas [Private Communication] at the University of Toronto.
originating as a research project [Bentz et al, 19961, some conservative service life
predictions were made with the diffusion coefficients calculated in this research program.
Sorption profiles (taken as the 28 day chloride penetration depths) and surface chlonde
concentrations (taken as the chlonde concentrations at depths of 3 Smm at 28 days, 1, 2
and 4 years) for the model were taken fiom fly ash modified marine exposed concretes
[Thomas, 199 1 1. Maximum surface chloride concentrations were taken from a practical
bridge deck modelling application fiorn Berke and Hicks [1994]. Having no reliable data
on binding capacities for T 1 OSF cernent with fly ash replacement, the benefits of chloride
binding were not considered in the model.
Using the above specifications and referenced data, the time for chlorides to reach the
steel at the threshold chloride level were determined. For the control concrete, CESF2,
and the 56% Sundance fly ash replacement concrete, CEFS56, using the 23°C oven cured
bulk diffusion coefficients determined in this research project, the time at which
corrosion would be initiated was predicted to be 50 years in the control concrete, and 150
years in the CEFS56 concrete.
Despite the fact that these predictions ignored chlonde binding which is assumed to be
higher in fiy ash modified concretes, [Arya et al, 19901 it was stiil predicted that it takes 3
times longer for corrosion to begin in the high volume fly ash concretes, pnmariiy due to
the lower diffusion coefficients. It must be remembered that iong term extrapolation of
short term test data should be viewed with caution due to the lack of maturity at the time
of testing, and that other mechanisms of concrete deterioration are being ignored. Other
detenoration mechanisms may be irrelevant if chlonde induced corrosion is the sole
cause of failure, but it is far more likely that an interaction of related events wili
contribute to failure.
In many estimations however, early age data are used for fly ash modified concretes, and
these often err on the conservative side. D i h i o n coefficients for these concretes are
known to decrease over time [Thomas. 19911. This decrease can be quantified in the
following equation:
where m is the exponential constant which descnbes the decrease in a diffision
coefficient with time. If there is no decrease with time, m = O. The degree to which the
arnbient cured RCPT data decreased with time is shown in Figure 5.5.
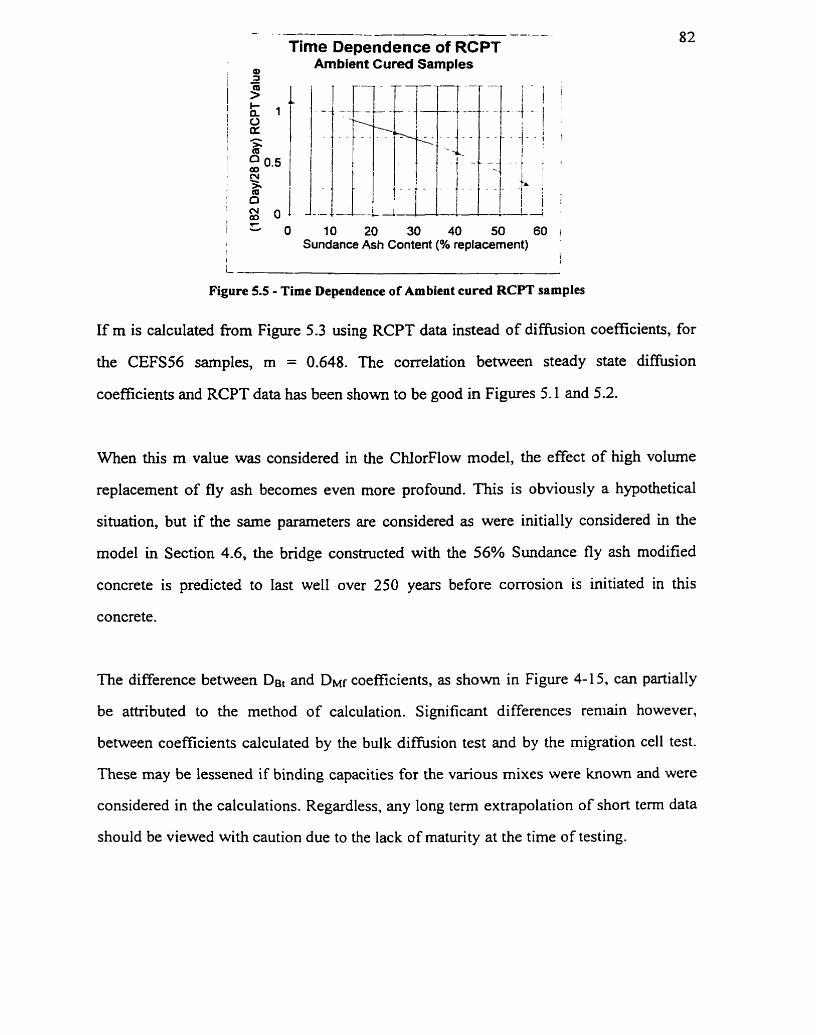
Time Dependence of RCPT Ambient Cured Samples
F Y O 10 20 30 40 50 60 i Sundance Ash Content (% replacement)
i
L
Figure 5.5 - Time Dependence of Ambient cured RCPT samples
If' m is caiculated fiom Figure 5.3 using RCPT data instead of diffusion coefficients, for
the CEFS56 samples, m = 0.648. The correlation between steady state diffusion
coefficients and RCPT data has been shown to be good in Figures 5.1 and 5.2.
When this m value was considered in the ChlorFlow rnodel, the effect of high volume
replacement of fly ash becornes even more profound. This is obviously a hypothetical
situation, but if the same parameters are considered as were initially considered in the
model in Section 4.6, the bridge consüucted with the 56% Sundance fly ash modified
concrete is predicted to last well over 250 years before corrosion is initiated in this
concrete.
The difference between De, and DMf coefficients, as shown in Figure 4-1 5, cm partially
be attributed to the method of calculation. Significant differences reniain however,
between coeficients calculated by the bulk difision test and by the migration ceil test.
These may be lessened if binding capacities for the various mixes were known and were
considered in the calculations. Regardless, any long term extrapolation of short term data
should be viewed with caution due to the lack of maturity at the time of testing.
CONCLUSIONS AND RECOMMENDATIONS
1. Although it has been widely criticised, the rapid chlonde permeability test
demonstrated good correlation with migration ce11 steady-state diffusion coefficients
calculated in this research project.
2. Udike the rapid chloride permeability test, measurement of dimision coefficients is a
lengthy, labour intensive process.
3. Partial replacement of TlOSF in high performance concrete with three fly ashes of
varying composition and replacement level improved chlonde penetration resistance
and produced strong concretes.
4. The Iowest diffusion coefficients and RCPT results were provided by concretes
produced vith the highest fly ash replacement level, 56% TIOSF cernent replacement
uith a moderate calcium content ash. Early-age compressive strengths were sufficient
to warrant consideration of similar mix designs in construction projects.
It is well established that fly ash modified concretes take a long time to mature. More
reliability and reproducibility would no doubt result if durability measurements were
perforrned on mature concretes. Many unused concrete samples of both curing regimes
and paste sarnples of the same wlcm prepared for the chloride binding work remain From

this research project, so it is hoped that these will be utilised in future research projects,
when they are more mature.
Meanwhile, prepared replicate samples from this research fiom the bulk diffusion test
remain in solution at 7°C and 23OC, and it is hoped that bulk d i f i i o n coefficients will be
measured again at a later age. This test was performed initially at 182 days, so replication
at twice the age, at three years would provide a interesting basis for cornparison. This
would provide information on the effect of time on difision coefficients, and would give
an indication of the maturity of the concretes reported in this research.
If compressive strength, RCPT. and bulk diffusion coefficients are again measured in
these concretes at later ages, the effect of fly ash replacement level and composition c m
be quantified on more mature concretes.
Similar research projects ongoing at the University of Toronto and elsewhere could be
incorporated into the RCPT vs. DM, correlation to confhn or refute the evidence of a
good correlation shown here.
Andrade, C., 1993, "Calculation of Chloride Dif'fùsion Coefficients in Concrete ftom Ionic Migration Measurements," Cernent and Concrete Research, Vol. 23, No. 3, pp. 724-742 ..................................... 25
Andrade, C., and Sanjuh, M., 1994, "Experimental Procedure for the Calculation of Chloride Diffision Coefficients in Concrete from Migration Tests," Advances in Cernent Research, Vol. 6, No. 23, pp. 127-134. ..................................................................................................................................... 25
Arsenault, J., Bigas, J.-P., and Ollivier, J.-P., 1995, "Determination of Chloride Diffusion Coefficient Using Two Different Steady State Metho&: Influence of Concentration Gradient," Chloride
...................... Penetration into Concrete. International RILEM Workrhop, St. Remy-Les Chevremes. .26
Arya, C., and Xu, Y., 1995, "Effect of cernent type on chloride binding and corrosion of steel in concrete," Cemenr crnd Concrefe Research, Vol. 25, No. 4, pp. 893-902. ........................................ 1 7
Arya, C., Buenfeld, N.R. and Newman, J.B., 1987, "Assessrnent of Simple Methods of Detennining the Free Chloride Ion Content of Cernent Paste," Cernent and Concrete Research, Vol. 17, No. 6, pp. 907-918. ................................................................................................................................................... 5
Arya, C., Buenfeld, N.R., and Newman, J.B., 1990, "Factors Influencing Chloride-Binding in ...................................... Concrete," Cemenr and Concrete Research, Vol. 20, No. 2, pp. 29 1-300. 15, 16
Bamforth, P.B., 1984 "Heat of Hydration of PFA Concrete and its Effect on Strength Development," Ashtech '84: Ash Technology and Marketing, pp. 287-294 .............................................................. . . 1 3
Bmt, Z.P., 1979% "Physical model for steel corrosion in concrete sea structures - theory," ASCE Journal ofthe Stmcturm Division, Vol. 105, No. 6, pp. 1 137- 1 153 ........................ .... .................. 27
Bazant, Z.P., 1979b, "Physical model for steel corrosion in concrete sea stmctures - application," ASCE Journal ofrhe Structures DÏvision, Vol. 105, No. 6, pp. 1 155-1 166. .......................................... 27
10) Beaton, J.L. and Siratfull, R.F., 1963, "Environmental influence of corrosion of reinforcing steel in concrete substnictures," Highway Research Board, Record No. 14, pp. 60-78. .................................. 27
11) Beaudoin, J.J., Ramachandran, V.S. and FeIdman, R.F., 1990, "Interaction of chloride and CSH," .............................................................. Cernent and Concrete Research, Vol, 20, No. 6, pp. 875-883. 1 5
12) Bentz, E.C., Evans, C.M. and Thomas, M.D.A., 1996, "Chloride Diffision Modelling for Marine Exposed Concretes," Corrosion of Reinforcemenr in Consrrucrion, Ed. C. L. Page, Society for
................................................................................................................... Chernical Industry, London. 80
13) Berke, N.S. and Hicks, M.C., 1994, "Predicting Chloride Profiles in Concrete," Corrosion, Vol. 50, NO. 3, pp. 234-239 .................. .., ......... .. ................................................................................................. 80
14) Bogue, R.H., 1955, "Chemistty of Portland Cernent," New York, Reinhold. ...................... ... ......... -30
15) Browne, RD., 1980, "Mechanisrns of corrosion of steel in concrete in relation to design, inspection and repair of offshore and coastal structures," In Performance of Concrete in a Marine Environment, Ed V. M. Malhotra. AC1 SP-65, Arnerican Concrete Institute, Detroit, pp. 169-204. ......................... -27
16) Byfors, K., Hansson, C.M., and Trittart, J., 1986, "Pore solution expression as a rnethod to detemine the influence of mineral additives on chloride binding," Cernent and Concrete Research, Vol. 16, No. 5, pp. 760-770. ....................................................................................................................................... 16
17) Cao, Y. and Detwiler, RI., 1995, "Backscatter Electron Imaging of Cernent Pastes Cured at Elevated Temperatures," Cernent and Concrete Research, Vol. 25, No. 3, pp. 627-638. ..................................... 15
18) Chatîeji, S., 1995, "On the Non-applicability of Unmodified Fick's Laws to Ion Transport Through Cernent Based Materials, " Chloride Penetrarion into Concrete, International RIL EM Workhop, Sr. Remy-Les Chevreuse. ............................................................................................................................. 1 8
19) Clear, K.C., 1976, "Time to Corrosion of Reinforcing Steel in Concrete Siabs, Volume 3: Performance After 830 Daily SaIt Applications," FHWA-RD-76-70, Federal Highway Administration, Washington D.C. ........................................................................................................................................................ 27
20) Collepardi, M., Marcialis, A. and Turriziani, R, "Kinetics of Penetration of Chloride Ions into the Concrete," Il Cemento, No. 4, pp. 157- 164. ........................................................................................... 25
2 1) Concrete Canada, 1994. High Performance Concrete: Concrete Canada's report on Improving Canada's Infrastnrcture and International Competitiveness .................................................................................... -4
22) Crank, J., 1956 "The Mathematics of Diffusion," Oxford University Press. ......................................... 19
23) Davis, R.E., and Troxell, G.E., 193 1, "Temperatures deveioped in mass concrete and tfreir effect upon compressive strength,"ASTM Proceedings, Vol. 3 1, pp. 576-594. .......................................................... 8
24) Debviler, R.J. and Fapohunda, C.A., 1993, "A Cornparison of Two Methods for Measuring the Chloride Ion Permeability of Concrete," Cernent, Concrete and Aggregates, CCAGDP,Vol. 15, No. 1, pp. 70-73. ........................................................................................................................................ 14, 26
25) Detwiler, R.J., Fapohunda, C.A. and Natale, J., 1994 "Use of Supp1ement;iry Cementing Materials to Increase the Resistance to Chloride Penetration of Concretes Cured at Elevated Temperatures," ACI Materials Journal, Vol. 91, No. 1, pp. 6346. ....................................................................-....---.-....-... 9, 15
26) Detwiler, R.J., Kjellson, K.O. and G j m , O.E., 1991, "Resistance to Chtoride intrusion of Concrete Cured at Di fferent Temperatures, " ACI Materials Journal, Vol. 88, No. 1, pp. 19-24. .................. 10, 14
27) Dhir, R.K., Jones, M.R., and Elghaly, A.E., 1993, "PFA Concrete: Exposwe Temperature Effects on Chloride Diffusion, Cernent and Concrefe Research, V . 23, No. 5, pp. 1 105- 1 1 14. ........................... 52
28) Dodson, C.J. and Rajagopalan, K.S., 1979, "Field Tests Verify Temperature Effects on Concrete Strength," Concrete /nternational, Vol. 1, No. 12, pp. 26-30. ................................................................. 8
29) Dunker. K.F. and Rabbat, B.G., 1993, "Why America's Bridges are Crumbling," Scientific American. Vol. 266, No. 3. pp. 66-72 ........................................................................................................................ 4
30) El-Belbol. S.M. and Buenfeld, N.R., 1989, "Accelerated Chloride Ion Diffusion Test," Mat. Res. Soc. Svmp. Proc., Vol. 137. pp. 203-208. ......................... .... ................................................................... 25
3 1) Ellis, W.E., Riggs, E.H. and Butler, W.B., 1991, "Comparaitive results of utilization of fly ash, silica fume and GGBFS in reducing the chloride penetrability of concrete," Cernent and Concrete Research,
............................................ Vol. 24, NO. 5, pp. 443-459 ....................................................................... 76
32) Fapohunda, C.A.. 1992, "Resistance to Chlonde Ininsion of Blended Cernent Concretes Cured at ........................... Elevated Temperatures," MASc. Thesis, University of Toronto, Dept. of Civil Eng. 13
33) Gifford, P.M., Langan, B. W., and Ward, M. A., 1993, "Use of Fly Ash in Heat-Cured Concrete and the Effect of P o s t - C u ~ g Storage Regirnes on Strength, Modutus of Elasticity, and Freezing-Thawing Durability ," Cernent. Concrefe, and Aggregates, Vo 1. 1 5, No. 1, pp. 1 4-23. ........................................ 1 2
34) G j m , O.E. and Martinsen, J., 1993, "Effect of Elevated Curing Temperature on High-Strength Lightweight Concrete," Proceedings of Utiliiation of High Strength Concrete, Vo 1. 2, Lillehammer, Nonvay, pp. 706-7 12. ............................................................................................................................... 9
35) G j m , O.E. and Vennesland, O., 1979, "Diffusion of Chloride Ions fiom Seawater into Concrete," Cernent and Concrete Research, Vol. 9, No. 2.pp. 229-23 8 .................................................................. 20
36) Goto, S. and Roy, D.M., 1981, "DifTusion of Ions Through Hardened Cernent Pastes," Cernent and Concrete Research, Vol. 1 1, No. 5, pp. 75 1-757. ...................... .... ................................................. 25
37) Halarnickova, P., Detwiler, R.J., Bentz, D.P. and Garboczi, E.J., 1995, "Water PemeabiIity and Chloride Ion Difision in PortIand Cernent Mortars: Relationship to Sand Content and Critical Pore Diameter," Cernent and Concrete Research, Vol. 25, No. 4, pp. 790-802. ............................................ 23
38) Hanson, J.A., 1963, "Optimum S tem Curing Procedure in Precasting Plants," AC1 Journal, Proceedings Vol. 60, No. 5, pp. 75-99 ..................................................................................................... 8
............ 39) Hausmann, D.A., 1967, "Steel Corrosion in Concrete," Materials Protecrion, Nov., pp. 19-23. 5
40) Higginson, E.C., 196 1, "Effect of S tem Curing on the Important Properties of Concrete," ACI Journal, Proceedings Vol. 58, No. 3, pp. 28 1-298. ....................... ,... ............................................... 8
4 i j Hooton, R.D., 1988, "Problems Inherent in Perrneability Measurement," Advances in Cement .................. Manufacture and Use, E. Ed Gartner, Engineering Foundation, New York, pp. 143-1 54. 25
42) Jeffens, S.A. and Mangabhai, R.J., 1989, "Divided Flow Permemeter," Mar. Res. Soc. Synip. Proc., Vol 137, pp. 209-214 ........................................................................................................................... 33
......... 43) Jost, W., 1952, "Diffusion in Solids, Liquids, Gases," Academic Press Inc., New York, pp. 139 50
44) Kayyali, O.A., and Haque, M.N., 1988, "Effect of Carbonation on the ChIoride Concentration in Pore Solution of Mortars with and without Fly Ash," Cemenr and Concrere Research, Vol. 18, No. 4,636-
45) Kayyali, O.A., and Qasrawi, M.S., 1992, "Chloride Binding Capacity in Cernent-Fly-Asti Pastes," Journal of Marerials in Civil Engineering, Vol. 4, No. 1, pp. 16-26. ................................................... 16
46) Kjellsen, K.O., Detwiler, R.J. and Gjarv, O.E., 1991, "Development of Microstructure in Plain Cernent Pastes Hydrated at Different Temperatures," Cernent and Concrete Research, Vol. 2 1, NO. 1, pp. 179-
47) Kjellsen, K.O., Detwiler, R.J., and G j w , O.E., 1990% "Pore Structure of Plain Cernent Pastes ..... Hydrated at Different Temperatures," Cernent and Concrete Raearch, Vol. 20, No. 6, pp. 927-933 9
48) Kjellsen, K.O., Detwiler, R.I., and G j m , O.E., 1990b, "Backscattered Electron Imaging of Cement Pastes Hydrated at Different Temperature," Cernent and Concrete Research, Vo 1. 20, No. 2 1, pp. 308-
49) Klieger, P., 1958, "Effect of Mixing and Curing Temperature on Concrete Strength," J. Amer. Concr. Inst., Vol. 54, pp. 1063-108 1 ................................................................................................................ 8,9
50) Kondo, R., Goto, S., Daimon, M. and Hosoka, G., 1973 "Effect of heat curing on cernent hydration, "Review of the 27th Generai Meeting, Cernent Association of Japan, pp. 4 143. .................................. 10
5 1) Lambert, P., Page, C.L. and Short, N.R., 1985, "Pore solution chemistry of the hydrates system of concrete and the corrosion rate of steel reinforcement," Cernent and Concrete Research, Vol. 15, pp.
52) Langley, W.S., Carette, G.G. and Malhotra, V.M., 1992, "Strength Development and Temperature Rise in Large Concrete Blocks Containing High Volumes of Low-Calcium (ASTM Class F) Fly Ash,"ACI Materials Journal, Vot. 89, No. 4, pp. 362-368 ..................................................................... 33
53) Malek, R.I.A., Roy, D.M. and Fang, Y., 1985, "Pore Structure, Permeability and Chloride Diffision in Fly Ash-and Slag-Containing Pastes and Mortars," Mat. Ra. Soc. Syrnp. froc., 137, pp. 403-4 10.15, 76
54) Mangat, P.S., and MolIoy, B.T., 1991, "Influence of PFA, Slag and Microsilica on Chloride Induced Corrosion of Reinforcement in Concrete, " Cernent and Concrete Research, Vol. 2 1, No. 5, pp. 8 19-
55) Marsh, B.K., Day, R.L., and Bonner, D.G., 1985, "Pore Structure Characteristics Affecting the Permeability of Cement Paste Containing FIy Ash," Cernent and Concrete Research, Vol. 15, No. 6, pp. 1027-1038. ...................................................................... ,. 13 ............................................................
56) McGrath, P.F. and Hooton, R.D., 1991, "Self Dessication of Portland Cement and Silica Fume Mod i fied Mortars," Ceramic Transactions: Advances in Cementitiou Materiais, Ed. S. Mindess, The American Ceramic Society, pp. 489-500. .............................................................................................. 79
57) McGrath, P.F. and Hooton, RD., 1996, "Influence of VoItage on Chloride Diffusion Coefficients Determined by the Chloride Migration Test," Cernent and Concrete Research, Vol. 26, No. 8, pp. 1239-1244. ............................................................................................................................................. 25
58) McGrath, P.F., 1996, "Development of Test Methods for Predicting Chloride Penetration into High Perfomance Concrete," PhD. Thesis, University of Toronto, Dept. of Civil Eng. .........................p assim
59) Mehta, P.K., t977, "Effect of cernent composition on corrosion of steel in concrete," ASTM STP 629, Philadelphia, pp. 12-1 9 ...................................................................................................................... 15
60) Midgley, H.H. and Illston, J.M., 1984, "The penetration of chlorides into hardened cernent pastes," Cement and Concreîe Research, Vol. 14, No. 4, pp. 546-558. ..................................................... 5 16
6 1 ) Nevi Ile, A. M ., 198 1 , Properties of Concrere, 3rd Edition. John Wiley & Sons, New York, pp. 3 1 9-3 3 3.1 0
62) Page, C.L., and Vennesiand, O., 1983, "Pore Solution Composition and Chloride Binding Capacity of Silica-Fume Cernent Pastes," Materiak and Simcmres, Vol. 16, NO. 9 1, pp. 19-25. ................ 15, 16, 24
63) Page, CL., Short, N.R., and El Tarras, A., 1981, "Diffusion of Chloride Ions in Hardened Cernent ...................................... Paste," Cernent and Concrere Research, Vol. 1 1 , No. 5, pp. 395-406. -1 3, 1 5, 50
64) Patel, H.H., Bland, C.H. and Poole, A.B., 1995, "The Microstructure of Concrete Cured at Elevated Ternperatures," Cernent and Concrete Research, Vol. 25, No. 3, pp. 485, 490. .................................... IO
65) Perenchio, W.F., Rajamane, N.P., Detwiler, R-J., Kjellsen, K.O. and G j m , O.E., 199 1, Discussion of "Resistance to Chloride Intrusion of Concrete Cured at Different Ternperatures," ACI Materials Journal, Vol. 88, No. 6, pp. 676-679. .................................................................................................... 15
66) Radjy, F. and Richards, C.W., 1973 "Effect of Curing and Heat Treatment History on the Dynamic Mechanical Response and the Pore Sûucture of Hardened Cernent Paste," Cernent and Concrete Research, Vol. 3, No. 1, pp. 7-2 1. .................... .... 9 ..............................................................................
67) Ramachandran, V.S., 1971, "Possible states of chloride in the hydration of tricalcium-silicate in the ......................... presence of calcium chloride," Materials and Structures, Vol. 4, No. 19, pp. 3- 12 15, 16
68) Rasheduaafar, Hussain, S.F. and Al-Saadowi, S.S., 1992, "Effect of ûicalciurn aluminate content of cernent on chloride binding and corrosion of reinforcing steel in concrete," ACI Materials Journal, Vol. 89, NO. 1, pp. 3-12 ...................................................................................................................... 1 5
69) Rosenberg, A., Hansson, C.M. and Andrade, C., 1989, "Mechanisms of Corrosion of Steel in Concrete," Materials Science of Concrete I, Ed. J. Skalny, American Ceramic Society, pp. 285-3 13. .17
70) Roy, D., Malek, R. and Licastro, P., 1987, "Chloride Perrneability of Fly Ash Cernent Pastes and Mortars," Concrete Durability, K&BM International Conference, ACI, Ed. J.M. Scanlon, Ottawa, AC1 SP 100, pp. 1459-1475. .......................................................................................................................... 76
71) Roy, D.M., and Parker, K.M., 1983, "Microstructures and Properties of Granulated Slag-Portland Cernent Blends at Normal and Elevated Temperatures," Fly Ash, Silica Fume, Slag and Other Minera1 By-Products in Concrete. V. M. Malhotra, e d , SP-79, American Concrete Institute, Detroit, pp. 397- 414 ...................... .. .............................................................................................................................. 13
72) Roy, D.M., Malek, R.I.A., Rattanussorn, M. and Grutzeck, M.W., 1986, "Trapping of Chloride Ions in Cernent Paste Containing Fly Ash," Materials Research Sociey Symposium Proceedings, 65, pp. 2 19-
73) Saul, A.G.A., 195 1, "Principles Underlying the Stearn Curing of Concrete at Atmospheric Pressure," Magazine of Concrete Research (London), Vol. 2., No. 6, pp. 127-140 .................................................. 8
74) Seltevold, E.J., 1974, "Mercury Porosirnetry of Hardened Cernent Cured or Stored at 97°C" Cement and Concrere Research, Vol. 4, No. 3, pp. 399404. ......................... ... ............................................. 9
75) Sergi, G.. Yu, S.W. and Page, C.L., 1992, "Diffusion of chloride and hydroxyl ions in cementitious materials exposed to a saline environment,"Mugmine oJConcrete Research, Vol. 44, No. 158, pp. 63-
76) Shideler, J.J. and Chamberlin, W.H., 1949, "Early Strength of Concrete as Affected by Steam Curing Temperatures," ACI Journal. Proceedings Vol. 46, No. 6 , pp. 273-283 ....................... -..... .... ....- .... 8
77) Shuman, R., Rogers, V.C. and Shaw, R.A., 1989, "The Barrier Code for predicting long-tem performance," Waste Management 89, University of Arizona .............................................................. -27
78) Skainy, J. and Odler, I., "Pore structure of calcium silicate hydrates, "Cernent and Concrete Research, 1972, Vol 2, pp. 3 87-400 ........................................................................................................................ 10
................... 79) Stix, G., 1993, "Concrete Solutions," Scientific American, Vol. 268, No 4, pp. 103- 1 12. -4
80) Tang, L. and Nilsson, L-O., 1992 "Rapid Detemination of the Chloide Diffbsivity in Concrete by Applying an Elecîrical Field," AC1 Materials Journal, Vol. 89, No. 1, pp. 49-53 ........................... 22, 25
8 1) Tang, L., and Nilsson, L.-O., 1993, "Chloride Bhding Capacity and Bindirig Isotherms of OPC Pastes and Mortars," Cernent and Concrete Research, Vol. 23, No. 2, pp. 247-253. ................................. 15, 16
82) Thomas, M.D.A. and Jones, M.R., 1996, "A Critical Review of Service Life Modelling of Concretes ....... Exposed to Chlorides," Radical Concrete Technology, Ed. RK Dhir and P.C. Hewlett, London. 69
83) Thomas, M.D.A., "Private Communication,'' 1997. ............................................................................... 3 3
84) Thomas, M.D.A., 199 1, "Marine performance of pfa concrete,"Magazine of Concrete Research, Vol 43, NO. 156, pp. 171-185 ........................................................................................................................ 20
85) Thomas, M.D.A., 1994, "Fly Ash and Alkali-Aggregate Reaction in Concrete," Building Research Establishment, Garston, U.K, ................................................................................................................. 76
86) Thomas, M.D.A., 1996, "Chloride Thresholds in Marine Concrete," Cernent and Concrete Research, Vol. 26, NO. 4, pp. 513-519 .............................................................................................................. 17, 18
87) Thomas, M.D.A., Pantazopoulou, S.J. and Martin Pérez, B., 1995, "Service Life Modelling of Reinforced Concrete Structures Exposed to Chlorides, A Literature Review," Department of Civil Engineering, University of Toronto, July, 1995. .................................................................................... 27
88) Tuutti, K., 1982, "Corrosion of Steel in Concrete," Swedish Cernent and Concrete Research Instirute, Stockholm ............................................................................................................................................... 27
89) Verbeck, G.J. and Helmuth, R.H., 1968, "Structures and Physicaf Properties of Cernent Paste. " ......... Proceedings of the Fifth International Symposium on the Chemistry of Cernent. Tokyo, pp. 1 -32. 9
90) Villadsen, J., 1989, "Hærdeternperaturens Indflydelse p51 Hærdnet Cementpastas Porestmktur," ......................... Diplorna Thesis, Technical University of Denmark, D e p m e n t of Civil Engineering 13
91) Whiting, D., 198 1, "Rapid measurement of chloride permeability of concrete,"Public Roads, Vol. 45, NO. 3, pp. 101-1 12 ................................................................................................................................ 23
92) Worthington, J.C., Bonner, DG. and Nowell, D.V., 1988, "Influence of Cernent Chemistry on Chloride Attack of Concrete," Materials Science and Technology, Vol. 4, pp. 305-3 13 ....................... 16
93) Zhang, M.-H. and Gjsrv, O.E., 1991, "Permeability of High-Strength Lightweight Concrete," ACI Materials Journal, Vol. 88, No. 5. pp. 463-469 ..................................................................................... 24

Appendix A Bulk Diffusion Test Data
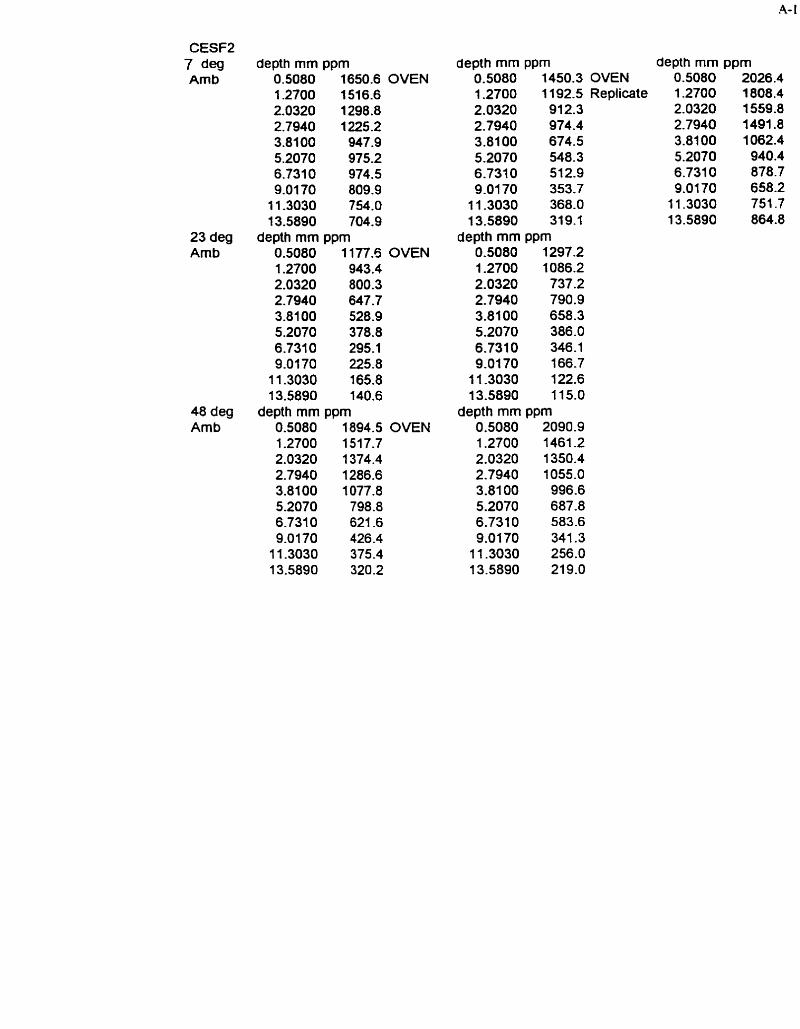
CESF2 7 deg depth mm ppm Amb 0.5080 1650.6 OVEN
1.2700 1 51 6.6 2.0320 1 298.8 2.7940 1 225.2 3.8100 947.9 5.2070 975.2 6.7310 974.5 9.0170 809.9
11 -3030 754.0 13.5890 704.9
23 deg depth mm ppm Amb 0.5080 1177.5 OVEN
1.2700 943.4 2.0320 800.3 2.7940 647.7 3.8100 528.9 5.2070 378.8 6.7310 295.1 9.0170 225.8
1 1.3030 165.8 13.5890 140.6
48 deg depth mm ppm Amb 0.5080 1894.5 OVEN
1.2700 151 7.7 2.0320 1 374.4 2.7940 1286.6 3.81 00 1077.8 5.2070 798.8 6.7310 621 -6 9.0170 426.4
11 -3030 375.4 1 3.5890 320.2
depth mm ppm 0.5080 1450.3 OVEN 1 -2700 1 192.5 Replicate 2.0320 912.3 2.7940 974.4 3.8100 674.5 5,2070 548.3 6.7310 512.9 9.0170 353.7
11 -3030 368.0 13.5890 31 9.1
depth mm ppm 0.5080 1297.2 1 -27 00 1086.2 2.0320 737.2 2.7940 790.9 3.8100 658.3 5.2070 386.0 6.7310 346.1 9.0170 166.7
1 1 -3030 122.6 13.5890 11 5.0
depth mm ppm 0.5080 2090.9 1 -2700 1461 -2 2.0320 1350.4 2.7940 1 055.0 3.8100 996.6 5.2070 687.8 6.731 0 583.6 9.0170 341.3
1 1.3030 256.0 13.5890 219.0
depth mm ppm 0.5080 2026.4 1 -2700 1 808.4 2.0320 1 559.8 2.7940 1491.8 3.81 00 1062.4 5.2070 940.4 6.731 0 878.7 9.0170 658.2
1 1.3030 751 -7 13.5890 864.8
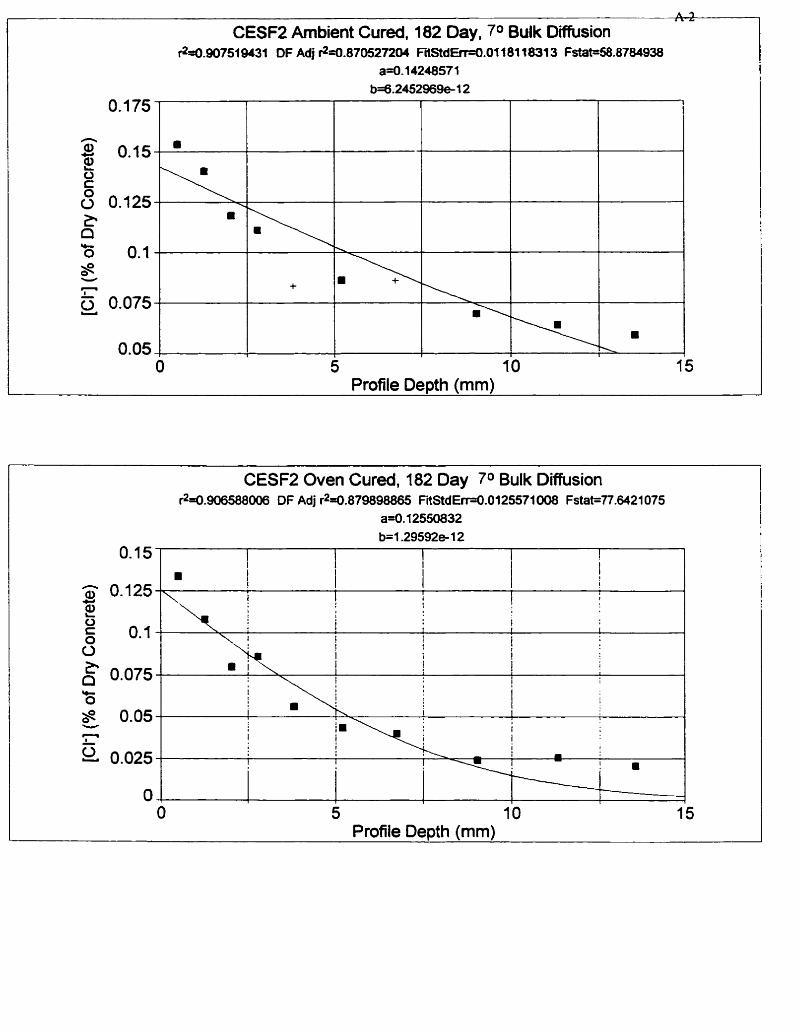
- - - CESF2 Arnbient Cured, 182 Day, 7O Bulk Diffusion
O 5 I O 15 Profile Depth (mm)
$=O.QO~~IWI DF Adj r24.870527204 FitStdErHI.04 1 81 1831 3 Fstat=S8.8784938 a=0.1424857 1
b=6.2452%9e- 1 2
-
-
-
-
-
-
O 5 10 15 7
Profile Depth (mm)
1 0.175
n
0.15 O t
6 0.125
CESF2 Oven Cured, 182 Day 7 O Bulk Diffusion r2=û.906588ûû6 DF Adj r2a.879898865 FitStdErd.0125571008 Fstat=7ï.6421075
a*. 12550832 b=1.29592*12
O. 15 I I
R
lb
3 0.125 C,
L. n b O 0.1 8 - - 6 0.075 -
0.05
rn
+
, , I
! \ !
O L 1
! 1
i I 1 I = 0.1 O 1 l 1
i 1
O
% 0.075 * O
S 0.05 - - - 2 0.025
O ,
! , 1
t "b i ! i l \
1 ! I
!
! ! m
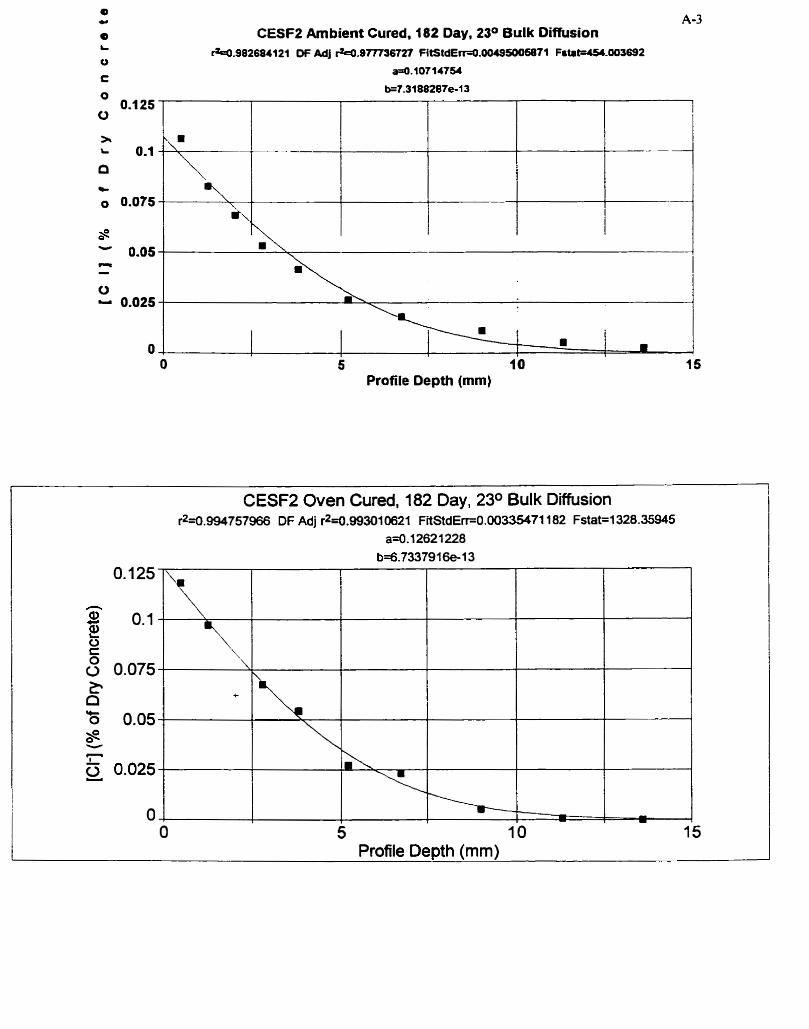
CESFZ Ambient Cured, 182 Day, 23O Bulk Diffusion m.982684121 CF Adj r 4 . 9 7 7 7 S 6 i î 7 ÇitStdE~.ûû435ûûsst1 Fstit-154.003692
a4.10714754
b=7.3188287e-13
5 10 Profile Depth (mm)
CESF2 Oven Cured, 182 Day, 23O Bulk Diffusion r2=û.99475796ô DF Adj r2=O.Q93OlO6Zl FitStdErr=0.00335471182 Fstat=1328.35M5
a=û.I2621228 b=6.7337916e-l3
O 5 10 15 Profile Depth (mm)
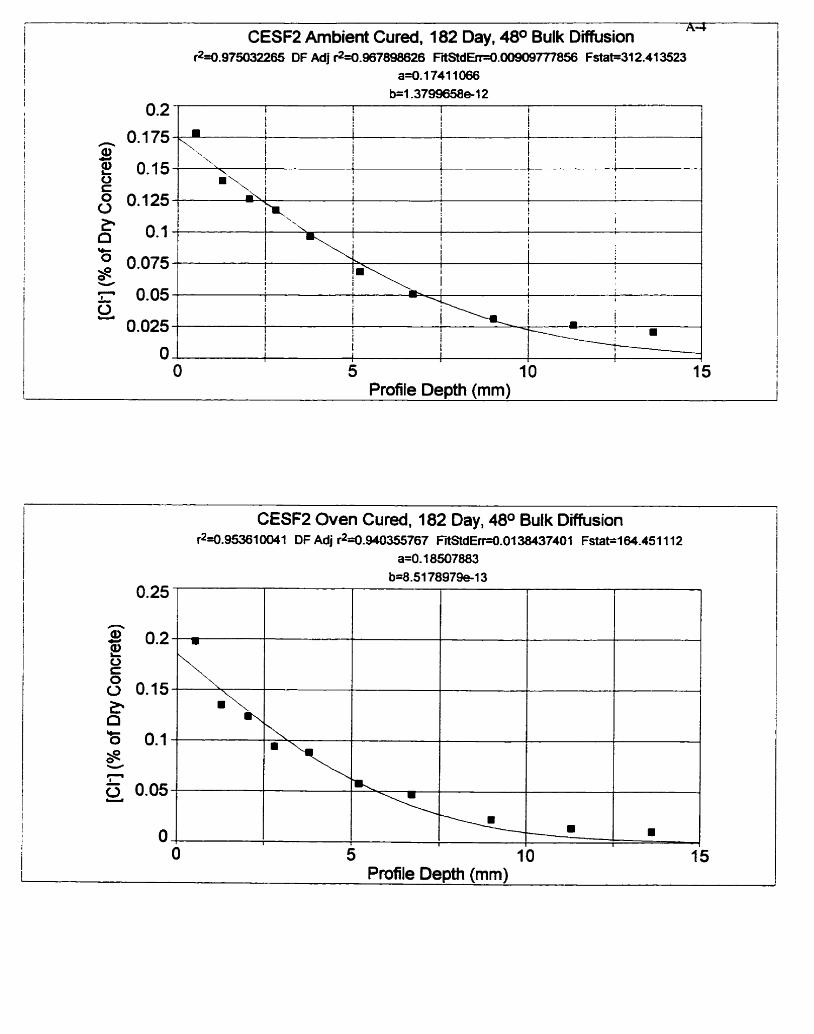
1
1 CESF2 Arnbient Cured, 182 Day, 48O Bulk Diffusion A 4
$=0.975032265 DF Adj $=0.967898626 FïitStdErr=û.Q0909777856 Fstat=312.4 1 3523 a*. 1741 1 O66
b=l.3799658e-l2
CESF2 Oven Cured, 182 Day, 4 8 O Bulk Diffusion r2=û.95361 0041 DF Adj r2=0.940355767 FfiStdErr4.0 138437401 Fstatt164.451112
a=0.18507883
O. 1 75 n Q) Ci
6 0.15-
s 0.125 O
0.1 Q rC
0.075 V -
1 0.05 - 2
0.025
O
Profile Depth (mm)
-\. ! I ! 1 I
i ; I 1 I '\
I 1 i
! \
Y 1 I
\ 1 1 1 1
m i I l
b, I
! I i
I 1
1
I
I I
i ! 1 I
i f
j 1 w i
1 i 1 I I 1
O 5 10 15 Profile Depth (mm)
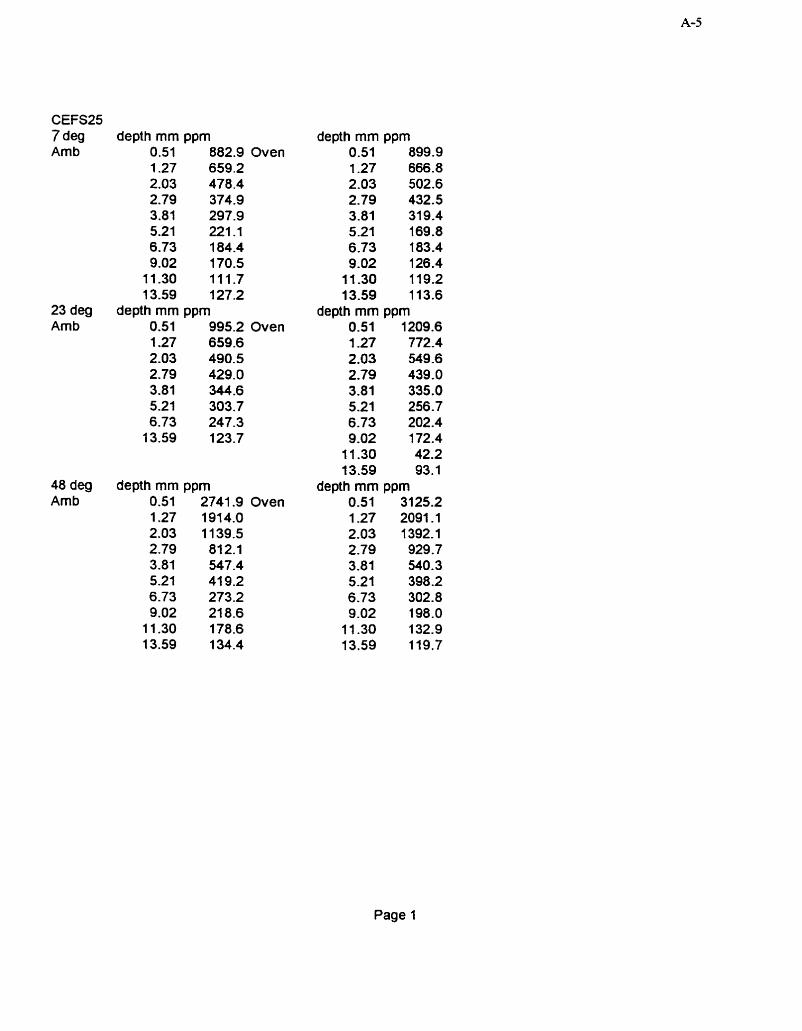
CEFS25 7 deg depth mm pprn Amb 0.51 882.9 Oven
1.27 659.2 2.03 478.4 2.79 374.9 3.81 297.9 5.21 221 -1 6.73 184.4 9.02 170.5
11.30 111.7 13.59 127.2
23 deg depth mm pprn Amb 0.51 995.2 Oven
1 .27 659.6 2.03 490.5 2.79 429.0 3.81 344.6 5.21 303.7 6.73 247.3
13.59 123.7
48 deg depth mm pprn Amb 0.51 2741.9 Oven
1.27 1914.0 2.03 1139.5 2.79 812.1 3.81 547.4 5.21 419.2 6.73 273.2 9.02 218.6
11.30 178.6 13.59 134.4
depth mm pprn 0.51 899.9 1.27 666.8 2.03 502.6 2.79 432.5 3.81 31 9.4 5.21 169.8 6.73 183.4 9-02 126.4
11.30 119.2 13.59 113.6
depth mm pprn 0.51 1209.6 1.27 772.4 2.03 549.6 2-79 439.0 3.81 335.0 5.21 256.7 6.73 202-4 9.02 172.4
11.30 42.2 13.59 93.1
depth mm pprn 0.51 3125.2 1.27 2091.1 2.03 1392.1 2.79 929.7 3.81 540.3 5.21 398.2 6.73 302.8 9.02 198.0
11 -30 132.9 13.59 119.7
Page 1
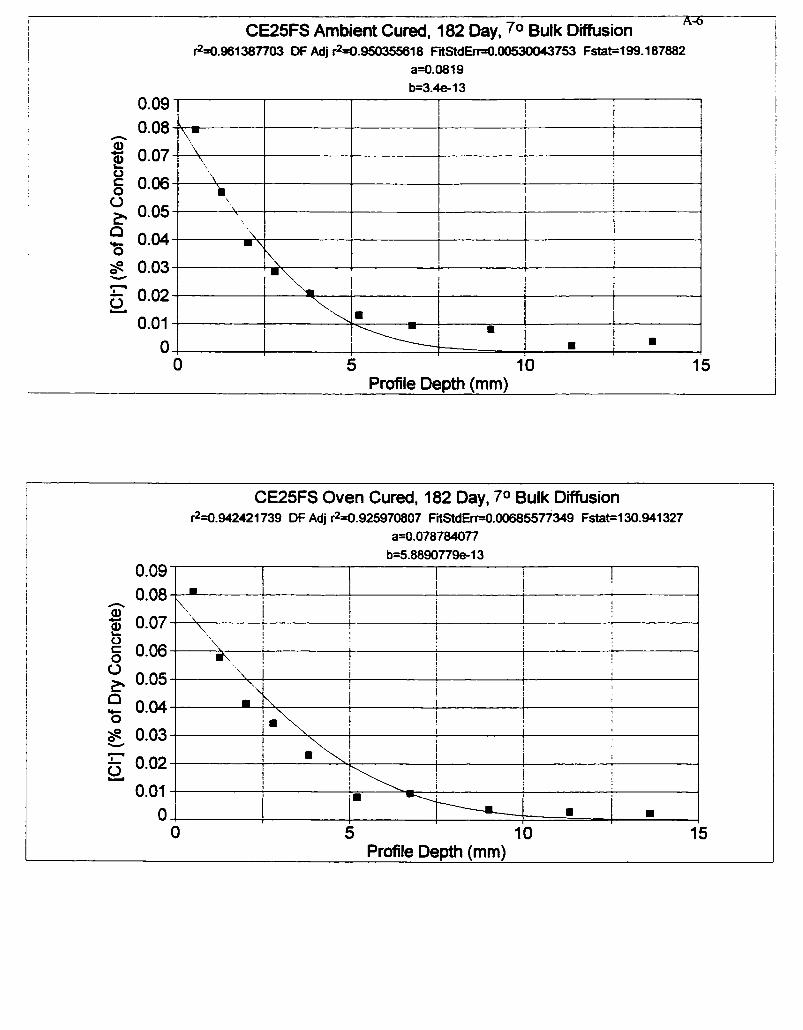
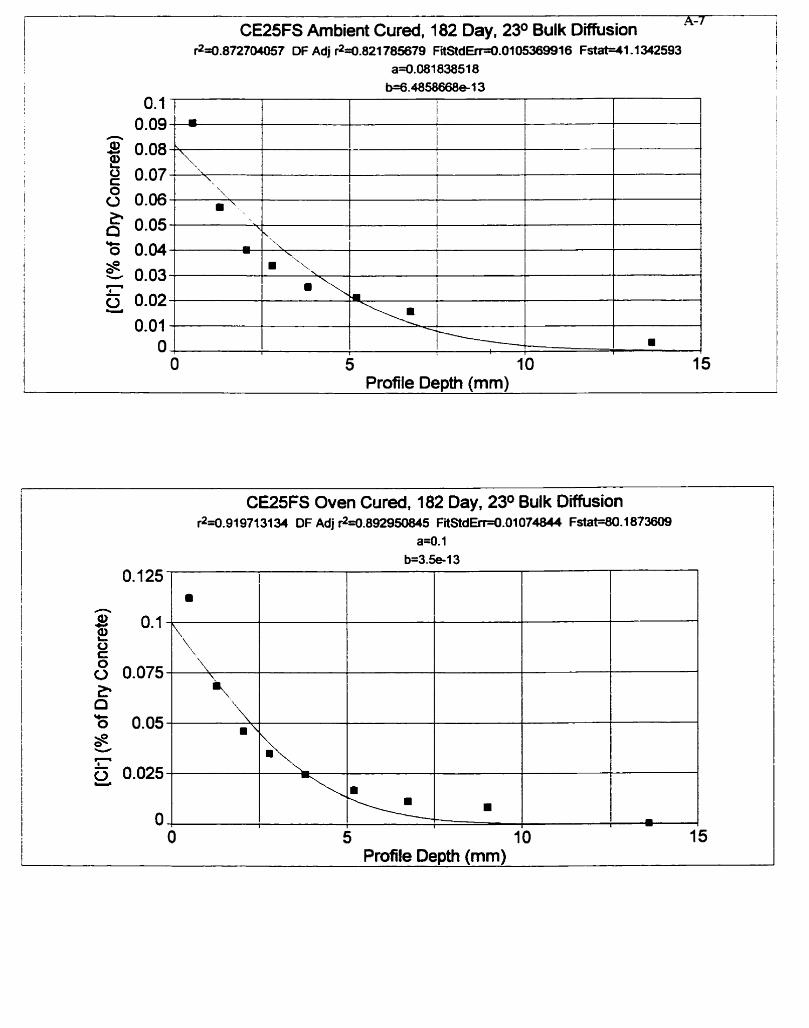
-. . - - - - - .
1 CE25FS Ambient Cured, 182 Day, 23O Bulk Diffusion -4-7
$=û.872704057 DF Adj $=0.821785679 FilStdGHl.OItE3699l6 Fst*-41.1342593 a=O.O81838518
O 0 0.06 1
1 $ 0.05 '5 0.04 i
1 y 0.03 1 -
6 0.02 - 1
0.01 O
-
O 5 10 15 7
Profile Depth (mm)
CE25FS Oven Cured, 182 Day, 230 Bulk Diffusion r2=û.91 971 31 34 DF Adj r24.892950845 FiStdErr=0.01074844 Fstat==.l873609
a=O.1 b=3Se-l3
O 5 10 15 Profile Depth (mm)
'\.
m l , \ \
I
..
I I
O. 125
e! O . l \ O t s 0.075 E. O - O 0.05 s w - 6 0.025 -
O ,
\ \
m .'.\
1
l
7
m
\ \
\
Y,
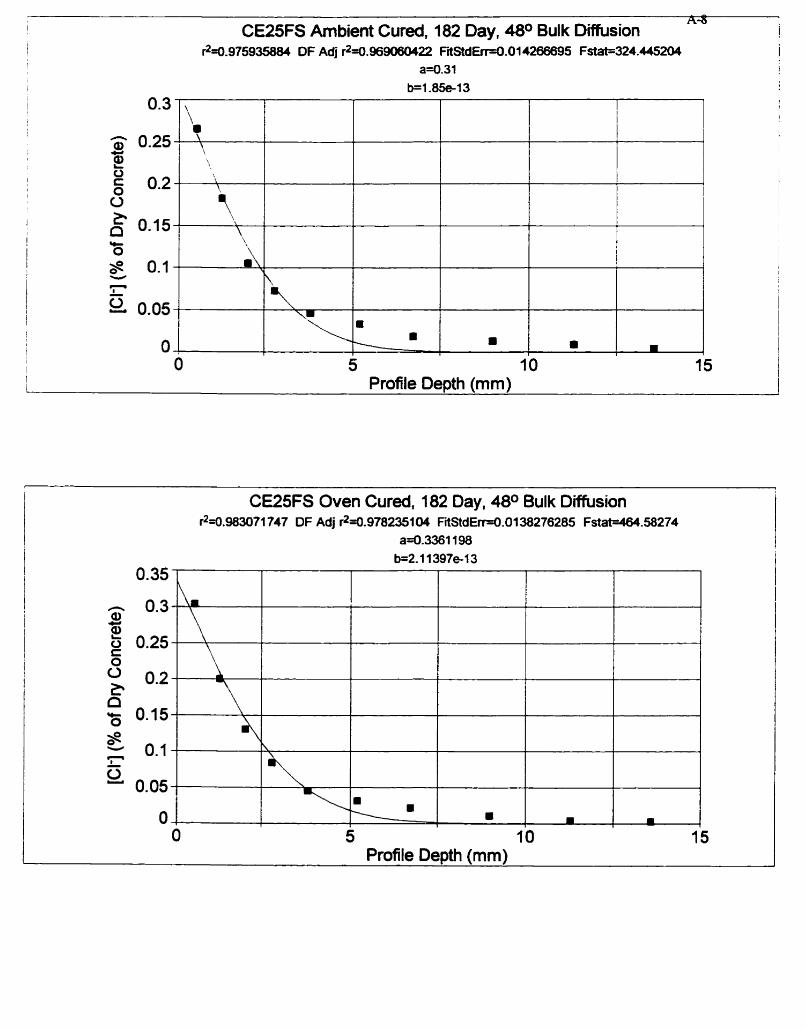
1 1
i O 5 10 15 1 Profile Depth (mm)
1 I
I CE25FS Ambient Cured, 182 Day, 4 8 O Bulk Diffusion A*
l 1 r2-0.975935884 OF Adj r2=0.969080422 FtStdEn=û.O 1 4266695 Fstat=324.445204 1 ag.31
I 1
I b=1.85e-13 1
Profile Depth (mm)
1 I
1 I
L
I I 1
I
l
1 1 i
I 0.3 ,
CE25FS Oven Cured, 182 Day, 4 8 O Bulk Diffusion r2=û.9830t 1 747 DF Adj r2=û.978235104 FtStdEd.0138276285 Fstat4.58274
a=O.336 1 1 98 b=2.11397e-13
1
T
m I
\
m
I
t
0.25 , ', - 8
I
1 = 0.2 I O
O I 0.15 n ! - I O I 0.1
w - !
2 0.05 j O 1
m
\
\ 1
\
\\
\-
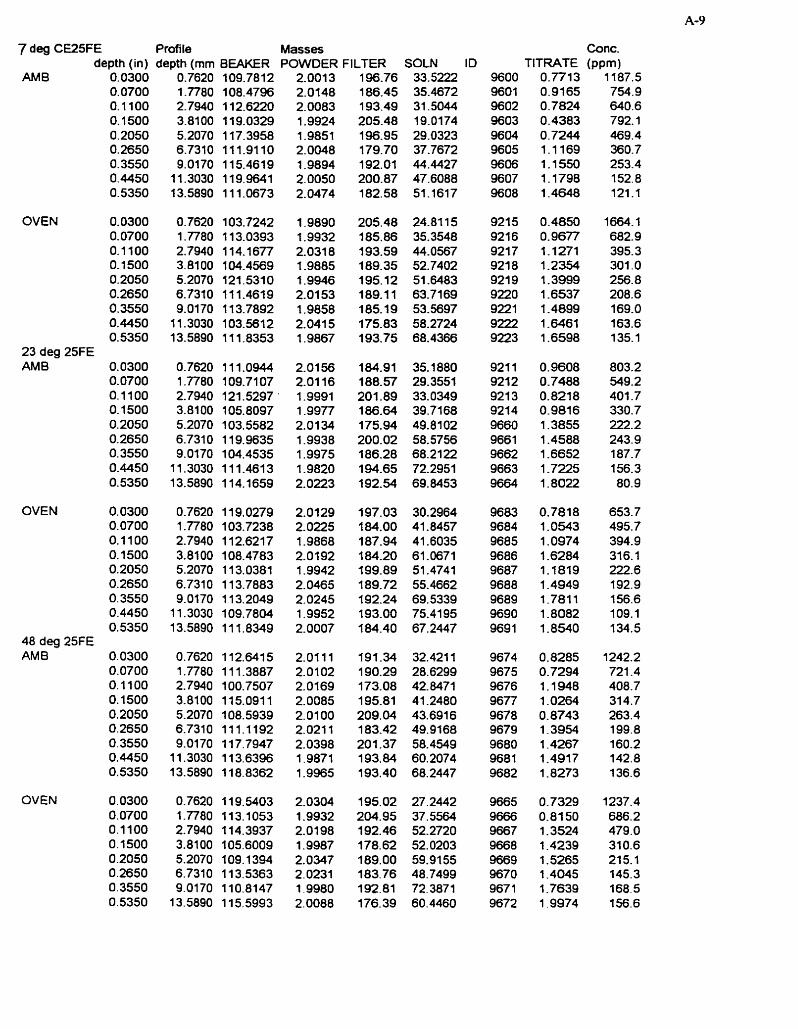
7 deg CE25FE Profi le Masses Conc. depth (in) depth (mm BEAKER POWDER FILTER SOLN ID TITRATE (ppm)
AM6
OVEN
23 deg 25FE AM6
OVEN
48 deg 25FE AMB
OVEN
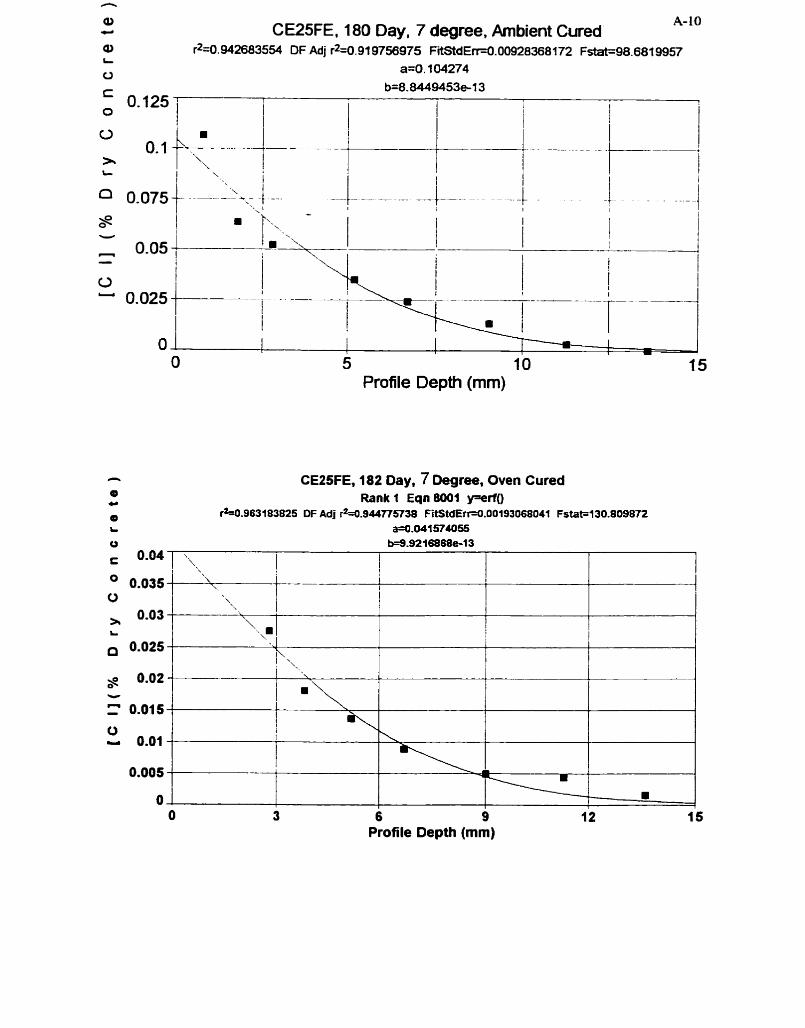
A-10 CE25FE. 180 Day. 7 degree. Ambient Cured
rz=0.942683554 DF Adj r*=0.919756975 FitStdEni0.00928368172 Fs&t=98.68I99!3
a=0.104274 b=8,8449453e-13
Profile De~th (mm)
A CE25FE. 182 Day, 7 Degree, Oven Cured Rank 1 Eqn 8001
rtcd.963183825 DF Adj r2=û.944ï7!5738 FitStdErr=0.00193068041 Fstabl30.809872 a=û.O41574O55
O 3 6 9 12 Profile Depth (mm)
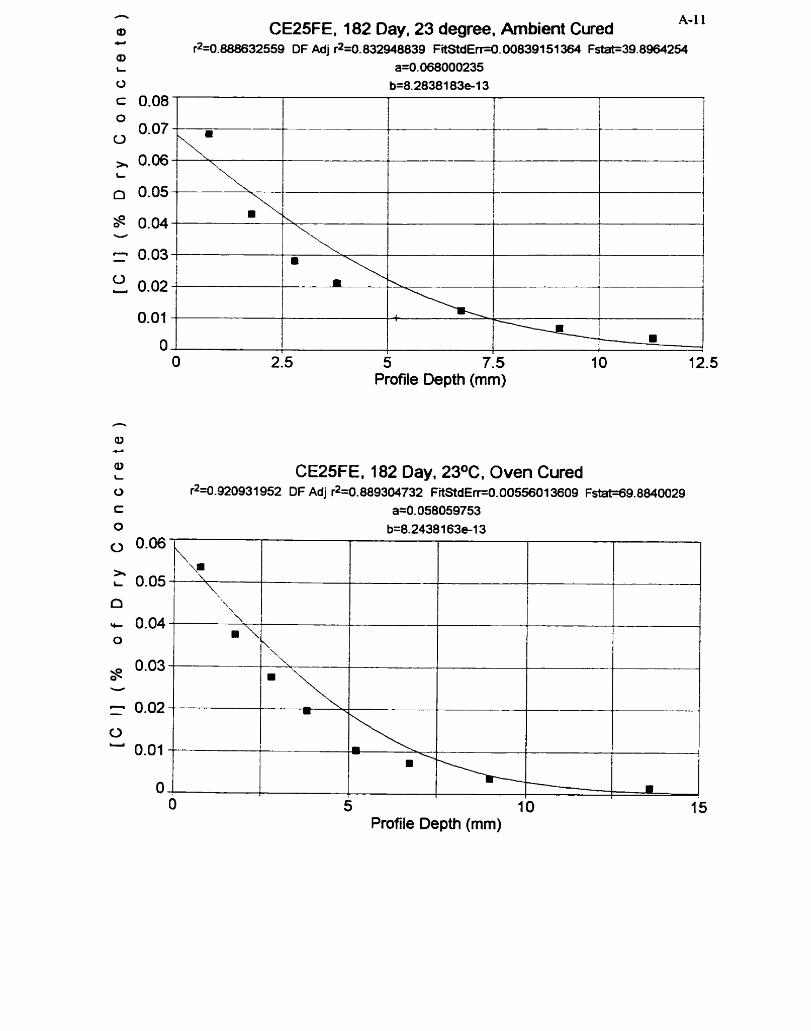
O 215 5 7.5 Profile Depth (mm)
n
CE25FE. 182 Day. 23 degree. Arnbient Cured A-1 1
Q) CI
al r2=0.888632559 DF Adj r*=0.832948839 FiidEr-0.00839151364 FsM~39.8964254
L a=0.068000235 0 b=8.2838183e-13
Q) L CE25FE. 182 Day. 23OC. Oven Cured O r2=0.920931 952 DF Adj r2=0.889304732 FitStdErr=0.00556013609 Fstat=69.8840029 c a=0.058059753 O b=8.2438163e-13
S= 0.08 O
7
L
1 w - - 0.03 1
\. i
2 0.02 1 0.01
O
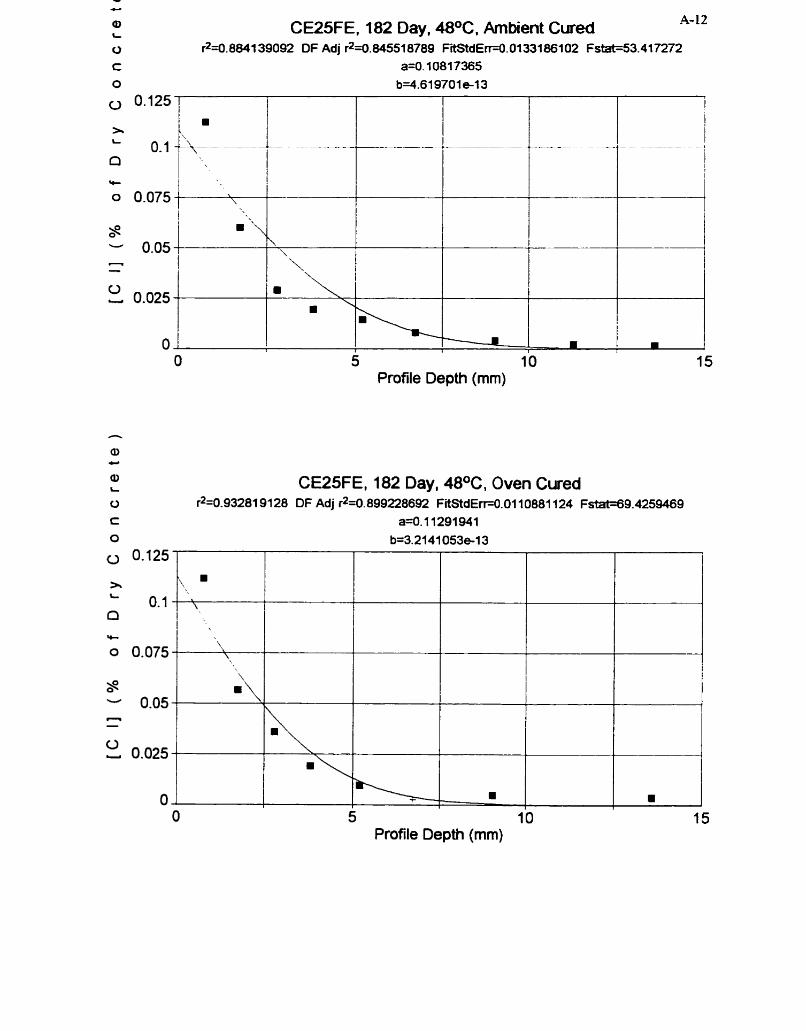
Q> CE25FE. 182 Day, 4€I0C1 Ambient Cured A-12 L
O r2=0.884139092 DF Adj r2=0.845518789 FitStdErr=0.0133186102 F-53-417272
5 10 Profile Depth (mm)
h
a C,
a L CE25FE, 182 Day, 48*C1 Oven Cured O r2=0.932819128 DF Adj t2=0.899228692 FitStdErr-O.01 10881 124 F m 9 . 4 2 5 9 4 6 9 c a=0.11291941 O b=3.2141053e-13
5 10 Profile Depth (mm)
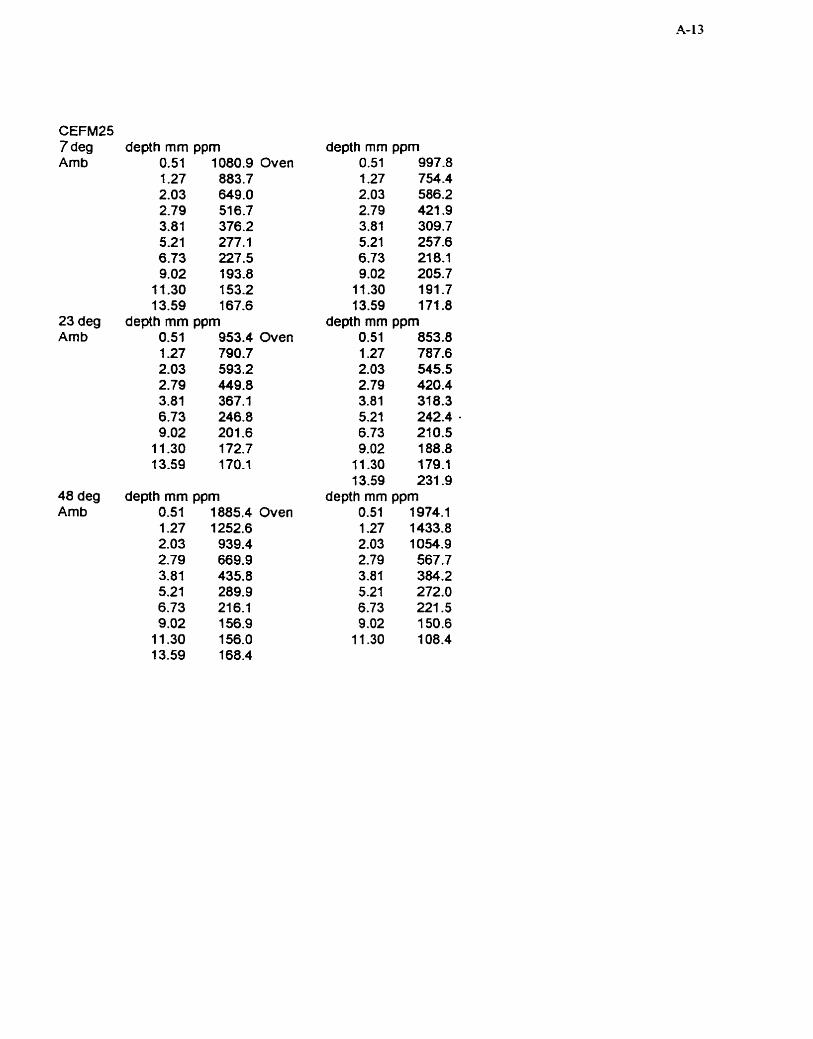
CEFM25 7 deg depth mm pprn Amb 0.51 1080.9 Oven
1.27 883.7 2.03 649.0 2.79 516.7 3.81 376.2 5.21 277.1 6.73 227.5 9.02 193.8
11 -30 153.2 13.59 167.6
23 deg depth mm pprn Amb 0.51 953.4 Oven
1.27 790.7 2.03 593.2 2.79 449.8 3.81 367.1 6.73 246.8 9.02 201.6
11.30 172.7 13-59 170.1
48 deg depth mm pprn Amb 0.51 1885.4 Oven
1.27 1252.6 2.03 939.4 2.79 669.9 3.81 435.8 5.21 289.9 6.73 216.1 9.02 156.9
1 1.30 156.0 13.59 168.4
depth mm pprn 0.51 997.8 1.27 754.4 2.03 586.2 2.79 421 -9 3.81 309.7 5.21 257.6 6.73 218.1 9.02 205.7
11.30 191.7 13.59 171 -8
depth mm pprn 0.51 853.8 1.27 787.6 2.03 545.5 2.79 420.4 3.81 31 8.3 5.21 242.4 - 6.73 210.5 9.02 188.8
11.30 179.1 13.59 231 -9
depth mm pprn 0.51 1974.1 1.27 1433.8 2.03 1054.9 2.79 567.7 3.81 384.2 5.21 272.0 6.73 221.5 9.02 150.6
11.30 108.4
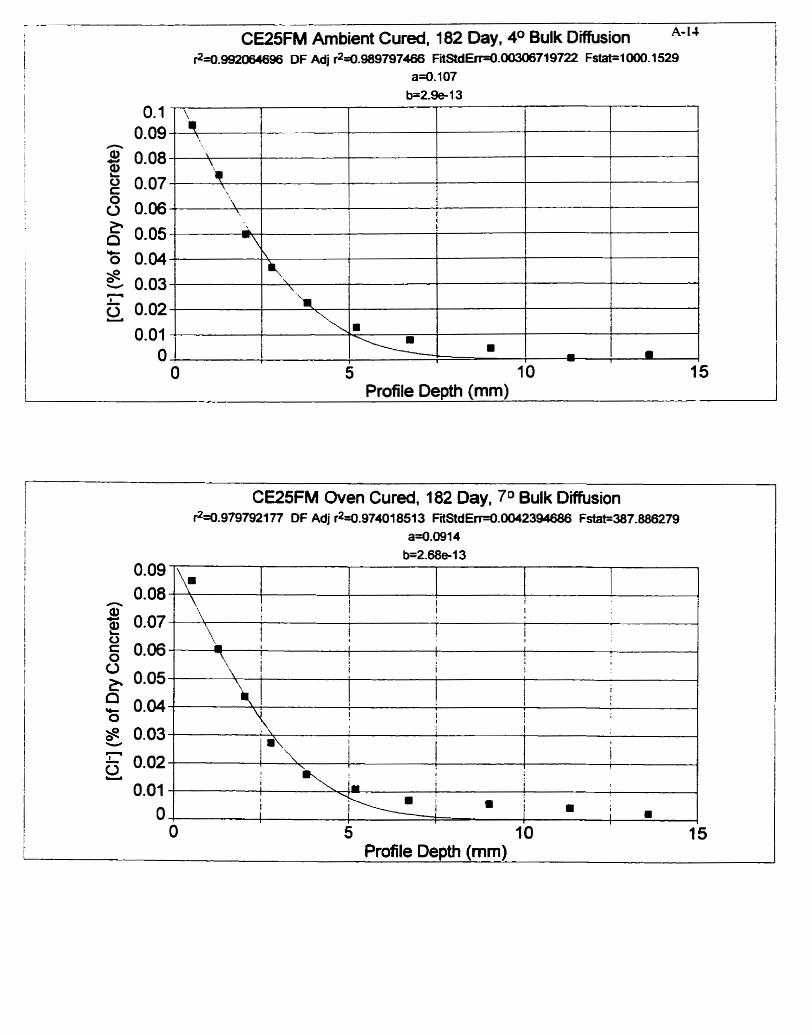
t CE25FM Arnbient Cured, 182 Day, 4 O Bulk Diffusion A-14 t l r2=0.992064696 DF Adj rz=û.989797466 FiiStd~.00306719722 Fstat=lûûû. 1529 1 a=0.1 07 1
1 b=2.9e-13 r 0.1 \ - 0.09 .- ',, 1 3 0.08 t
\
l 2 \
0.07 \
t ',
8 0.06 1
\
i5 0.05 \
Q 6
\
t 'ô 0.04
1 y 0.03 1
\ \
g 0.02 t
- 0.01
O . H I m
O -
5 10 15 Profile Depth (mm)
CE25FM Oven Cured, 182 Day, 7 O Bulk Diffusion $4.9797921 77 DF Adj r*=û.9740 1 851 3 Fi iStd~.00423946û$ Fstat=387.886279
a4.0914 b=2.68e-13
1
1 I !
1 I
T
I I I i I
l I
4 r I
I 1 1 :
Profile Depth (mm)
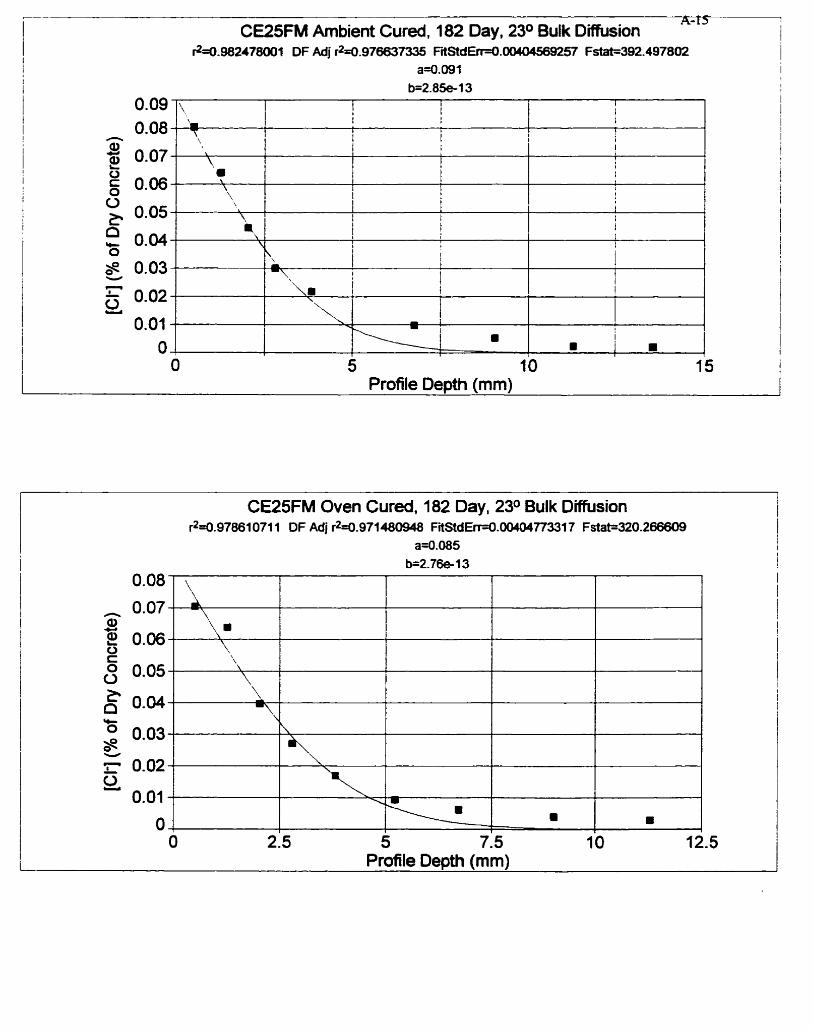
7
CE25FM Ambient Cured. 182 Day, 2 3 O Bulk Diffusion A - I ~
i 6=0.982478001 OF Adj r24.97û637335 F1Std€rr=O.(Wû45ô9257 Fslat=392.497802
a4.091
CE25FM Oven Cured. 182 Day, 23O Bulk Diffusion r2=4J.97861071 1 DF Adj r2=û.971480948 FitStdErr-0.00404ï73317 Fstat=320.266609
a=û.085
b=2.8Sel3
O 2.5 5 7.5 10 12-5 Profile Depth (mm)
1 I i I
i I r I l r 1 I 1 1 I
I l
I 1
0.09 0.08
r
0.07 5 6 0.06 0, 0.05
0 0.04 O
S 0.03 - - 0.02 2. 0.01
\, -+ ', \
\ \ \
'\
1 i
\
I i I I 1
I i
I I 1
I L
1 i 1 t
j L I t I 1 I i
\ i j I
, \. 1
O
l I
1 '
O 5 10 1 5 Profile Depth (mm)
8 - I
8 ! I v
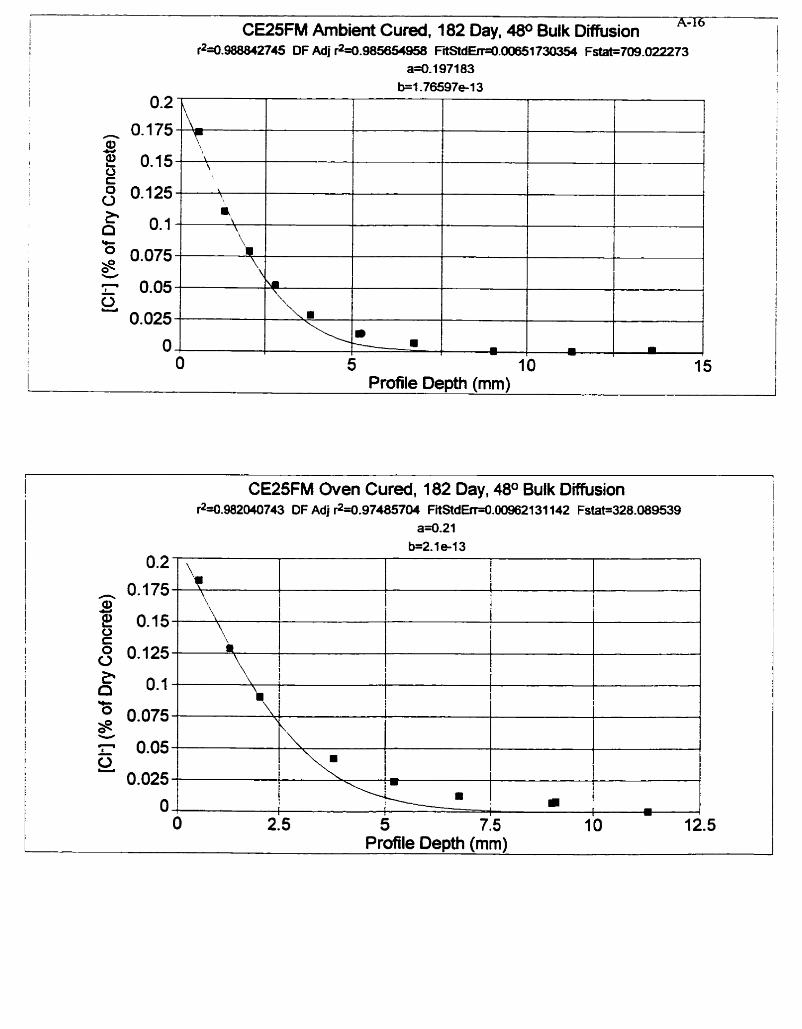
CE25FM Arnbient Cured, 182 Day, 4 8 O Bulk Diffusion A-16
r2=û.988842745 DF Adj r2t0.-958 FitStdEn=û.00651730354 Çstatr709.022273 am. 1 971 83
b=f.76597e- 1 3
- O 0.075
i Y i - 0.05 i S. 1 l 0.025 1 l
CE25FM Oven Cured, 182 Day, 4 8 O Bulk Diffusion r2=û.982û4û743 OF Adj r2=0.97485704 FitStd€rr=û.00962131142 Fstat=328.089539
a4.21 b=2.1 e-13
0.2 7
O. 175
O. 15
0.125
o. 1
0.075
0.05
0.025
O ,
\ L \ \ i
1 O ,
O I 1 I
m
2.5 5 7.5 10 12.5 1
Profile Depth (mm)
\ \ i 1 1
I i !
I
\ I 1 1 I I
!
\,
I
+
! a 1 t 1
O 1
m I
m i
5 -
10 i
15 Profile Depth (mm)
\ a
1 I
I
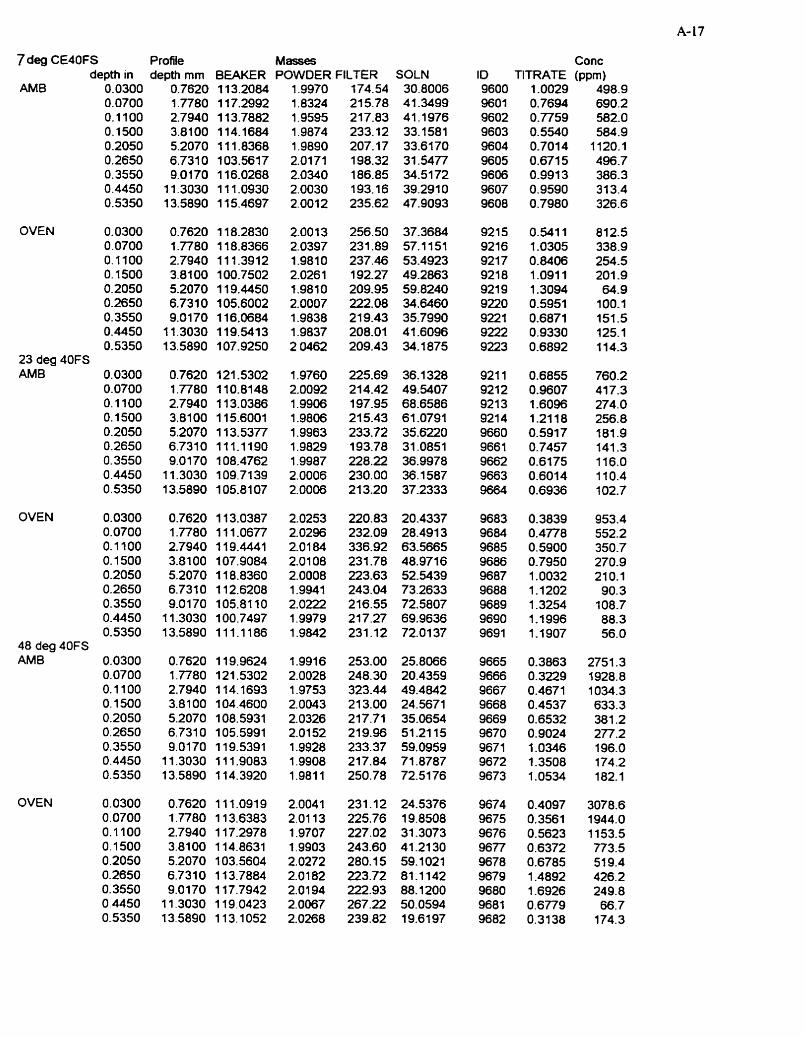
7deg CE40FS Profile Masses depth in depth mm BEAKER POWOER FILTER SOLN
AM6
OVEN
23 deg 40FS AMB
OVEN
48 deg 40FS AM6
OVEN
Conc 10 TITRATE (ppm)
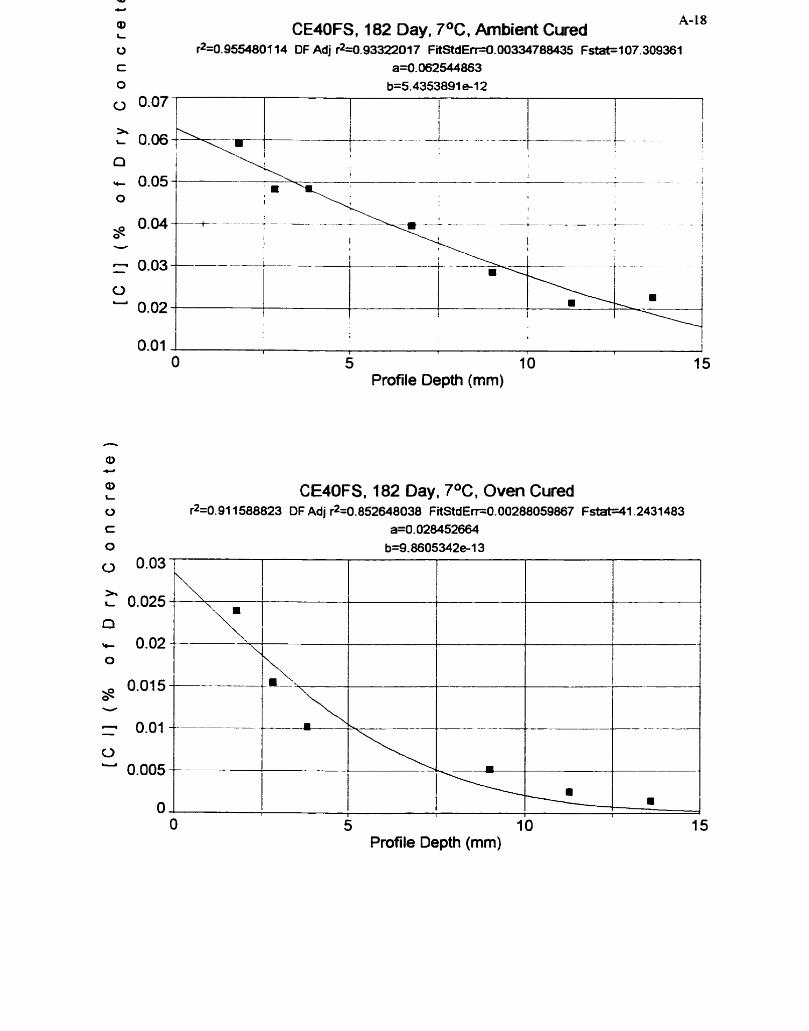
Q) CE40FS, 182 Day. 7OC. Arnbient Cured A- 18 L
O r2=0.9554801 14 DF Adj r2=0.9332201 7 FitStdErr=û. 00334788435 F m 1 07.309361 c a=û.062544863 O b=5.4353891 e-12
0.07 I 0.06 \
0.05 ,
0.04 - -
0.02 - I
0.01 1 1 I
O 5 10 15 Profile Depth (mm)
h
a c.
Q) L CE40FS. 182 Day, 7OC, Oven Cured O r2=0.91 1588823 DF Adj r2=0.852648038 FitStdEr~0.00288059867 Fstat41.2431483
5 10 Profile Depth (mm)
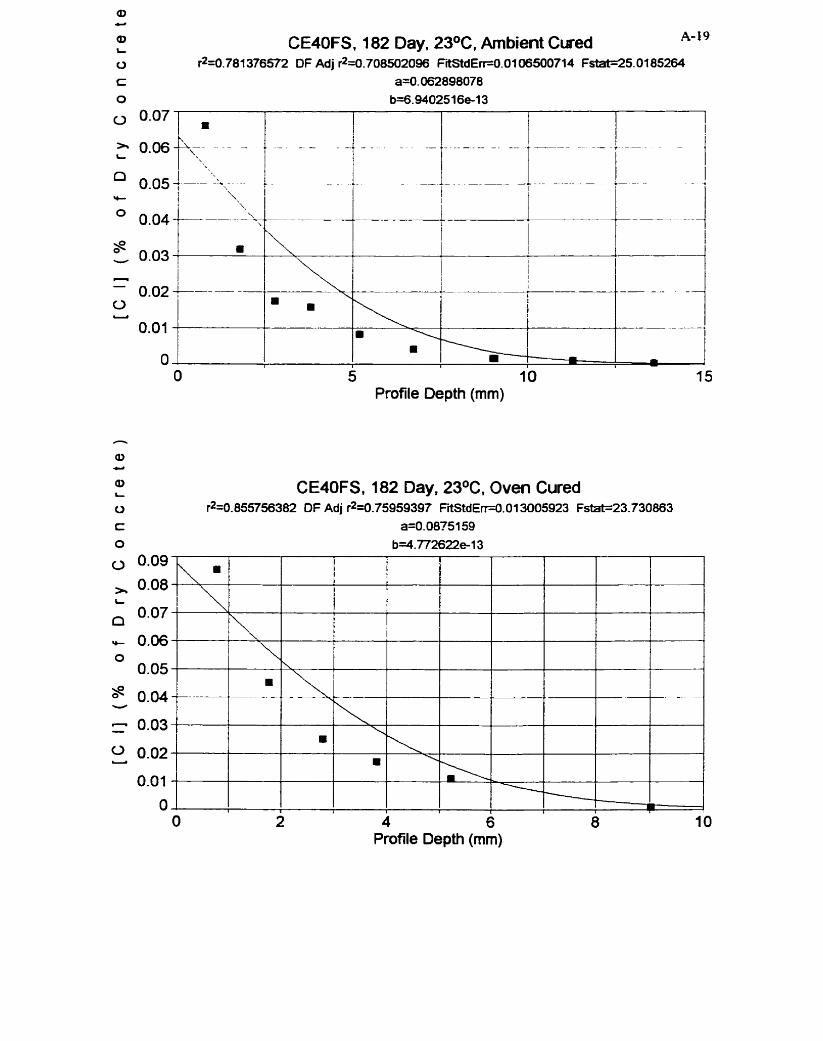
- - al c.
Q) CE40FS. 1 82 Day. 23OC. Ambient Cured .4- 1 9 L
O r2=0.781 376572 OF Adj r2=0.708502096 F'idErr=O.Ol W00714 Fstat=25.0185264
al L
CE40FS, 182 Day. 23OC. Oven Cured O r2=0. 85V56382 OF Adj r2=0.7595939f FiStdErr=O. 0 1 3005923 Fstat=23.730863 c a=0.0875159 O b=4.772622e-13
R
- - - - - - PX\\, . . - . -. - . -.,. - - . . . . -- ,,-. .- -. -- -.
1 ! . - -- . . - . . ! - . - + - . . . - - -- - ,
i \, I
'. \.
\
w
l-- - - -- - - , ,
1 1
O 2 4 6 8 10 Profile Depth (mm)
,. - --
- - . -.- - - -
œ I
O 5 10 Profile Depth (mm)
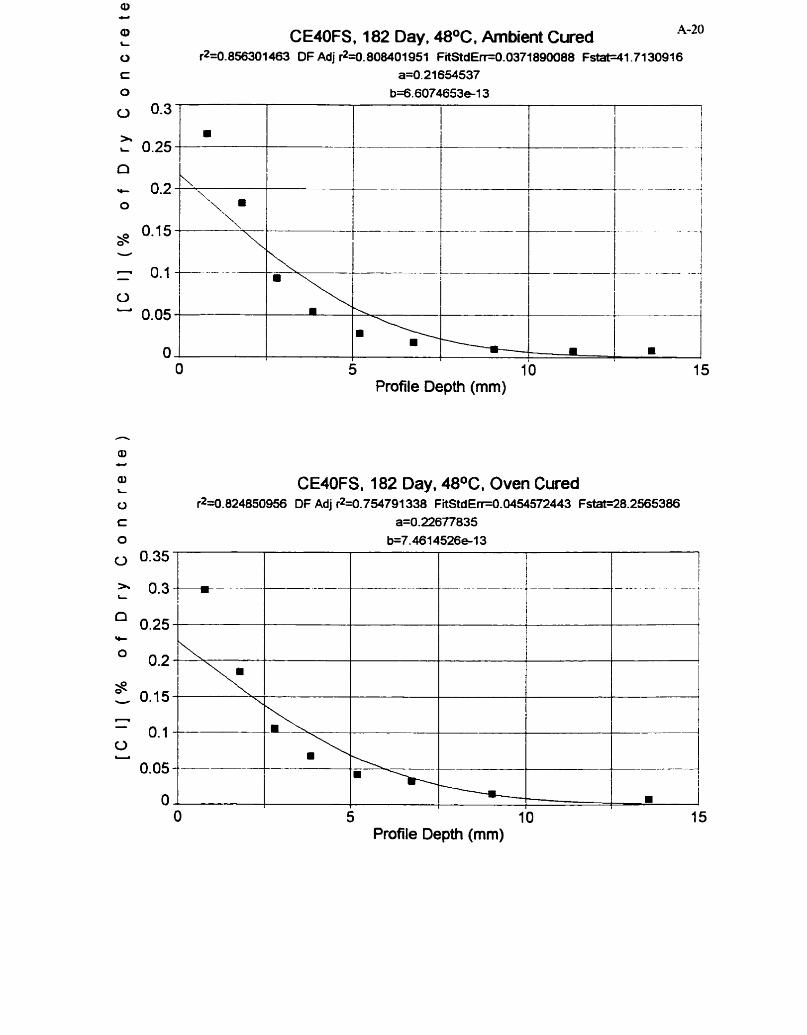
a3 Ci
Q) CE40FS. 182 Day. 48OC, Ambient Cured A-20 L
O r2=0.856301463 DFAdj r2=0.808401951 FiStdEr~0.0371890088 Fstat=-41.7130976 c a=0.21654537 O b=6.6074653*13
Profile Depth (mm)
al L CMOFS, 182 Day, 48OC. Oven Cured O r2=0.824850956 DF Adj r2=0.754791338 FitStd Err-0.0454fl2443 FstaM8.2565386 c a=0.22677835 O b=7.4614526e-13
5 10 Profile Depth (mm)
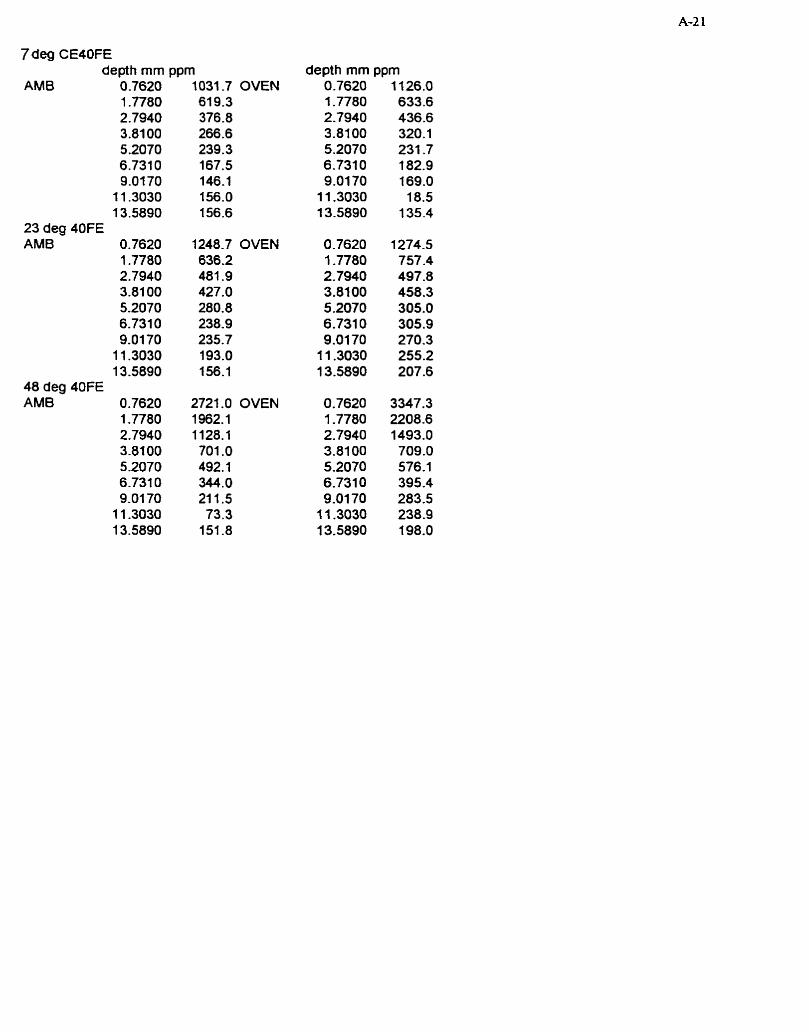
7deg CEJOFE depth mm ppm
AM6 0.7620 1 -7780 2.7940 3.81 O0 5.2070 6,731 0 9-01 70
1 1.3030 13.5890
23 deg 40FE AMB 0.7620
1.7780 2.7940 3.81 O0 5.2070 6.731 0 9-01 70
11 -3030 1 3.5890
48 deg 40FE AMB 0 -7620
1 -7780 2.7940 3-81 O0 5 .ZO7O 6.731 O 9.01 70
1 1 -3030 1 3.5890
1031 -7 OVEN 61 9.3 376.8 266.6 239.3 167.5 146.1 156.0 156.6
1248.7 OVEN 636.2 481.9 427.0 280.8 238.9 235.7 193.0 156.1
2721.0 OVEN 1962.1 1128.1 701 .O 492.1 344. O 211.5 73.3
151.8
depth mm ppm
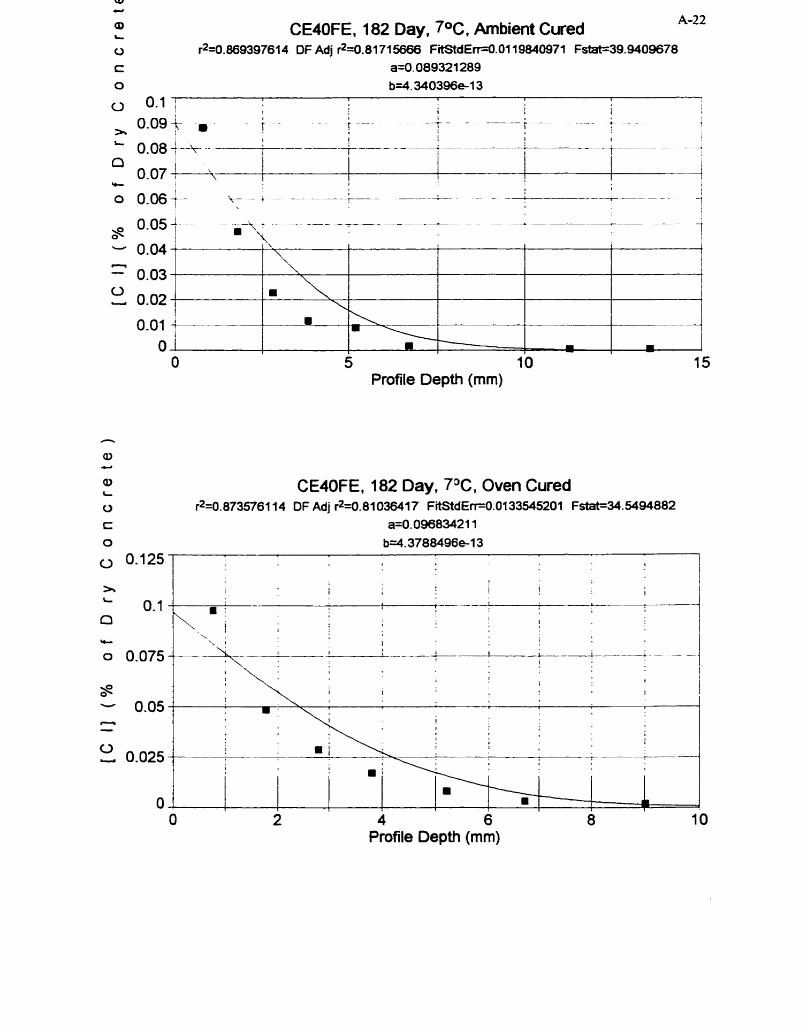
CMOFE. 182 Day. TOC, Ambient Cured A-22
CE40FE. 182 Day, 7%. Oven Cured
0 r2=0.869397614 DF Adj r2=0.81715666 FitStdEn=O.O119840971 FstaG39.9409678
c a=0.089321289 O b=4.340396e-13
0 0 . 1 1 1 i 0 l
1 I 1
0.09 k -- t t- - -
- -- + -- - r % I
!
' 0.08 1 -+ - ! l I ----- - 1
C) r*=0.873576114 DF Adj r2=0.81 03641 7 FitStdErr=0.0133545201 Fs&t=34.5494882
0.07&-+ I
h
0.1 a rC
0 0.075 .
s V
Y- l -4
I
+ - y - - -- ' t u 0 0.06 f - - -A-- -. -1
L , - -- - - - --- l 0.05 - s - 0.04 .
. \ ! \. J - -1
1 ,
1 I i ! + i i - 4
m i , 9
1
t i \ . i . 1 l 1 '. -\--.----'
I 1
! I ; ;;_-i I
I I
I
- - 0.03
2 0.02
0-01 O
0.05 1
m
a 4
- -
I
O
1
- I
?, 0.025 ' -- ---- -<
5 10 15 Profile Depth (mm)
O 1 i 1 1 1
O -
2 4 6 8 10 Profile Depth (mm)
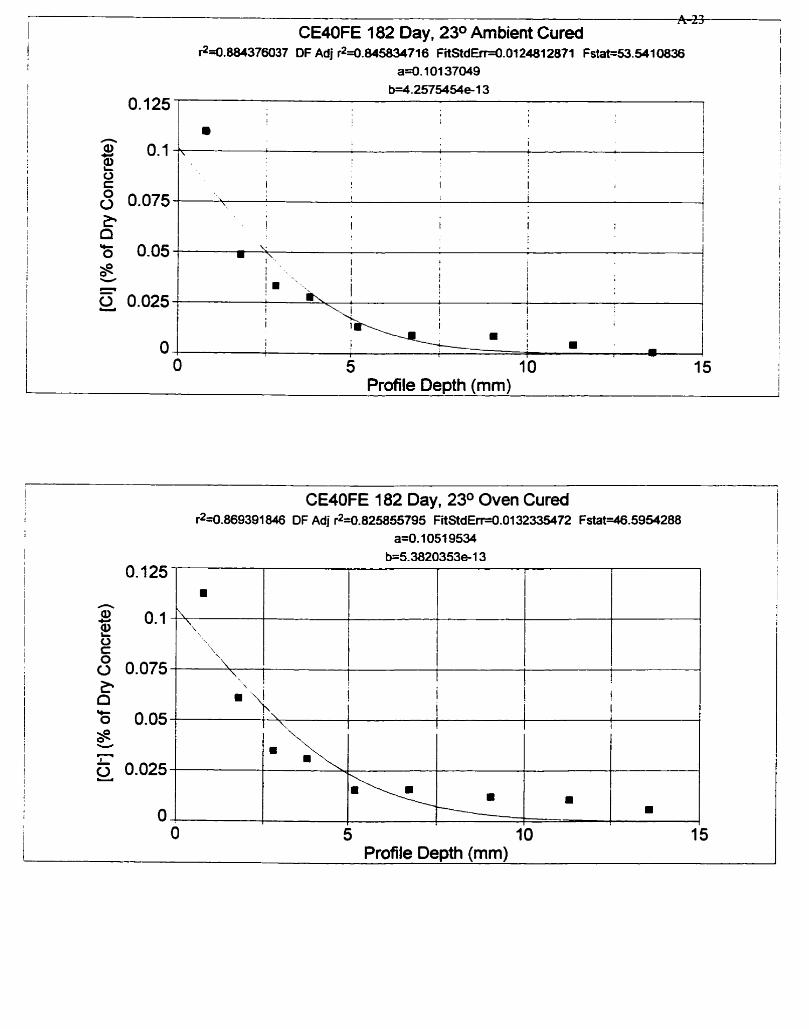
1 CE40FE 182 Day, 23O Ambient Cured I i
CMOFE 182 Day, 23O Oven Cured r2=~.869391 846 DF Adj $=O. 825855795 FiiStdErr=0.0132335472 Fstat=46.5954288
a=0.10519534
r2=û.884376037 DF Adj r2=0.845834716 F itStdfEfHI.O1248128?l Fstat=53.541 O836 a*. 101 37049
b=4.2575454e- 1 3 1
Profile Depth (mm)
0.125
0.1 O E
8 0.075 2 Q * O 0.05 s -
0.025
O .
1 1
l i 1 !
., I
1 ! 1 i
I
, i ' a , I t l '
1 I
1 1
l ! I t I i
I t
rn 1 \ I ',. 1 i
i I I
! i i 1
m ; I
I I 1 l a I m 1 0
>
5 -
10 l
15 1 I
Profile Depth (mm) i
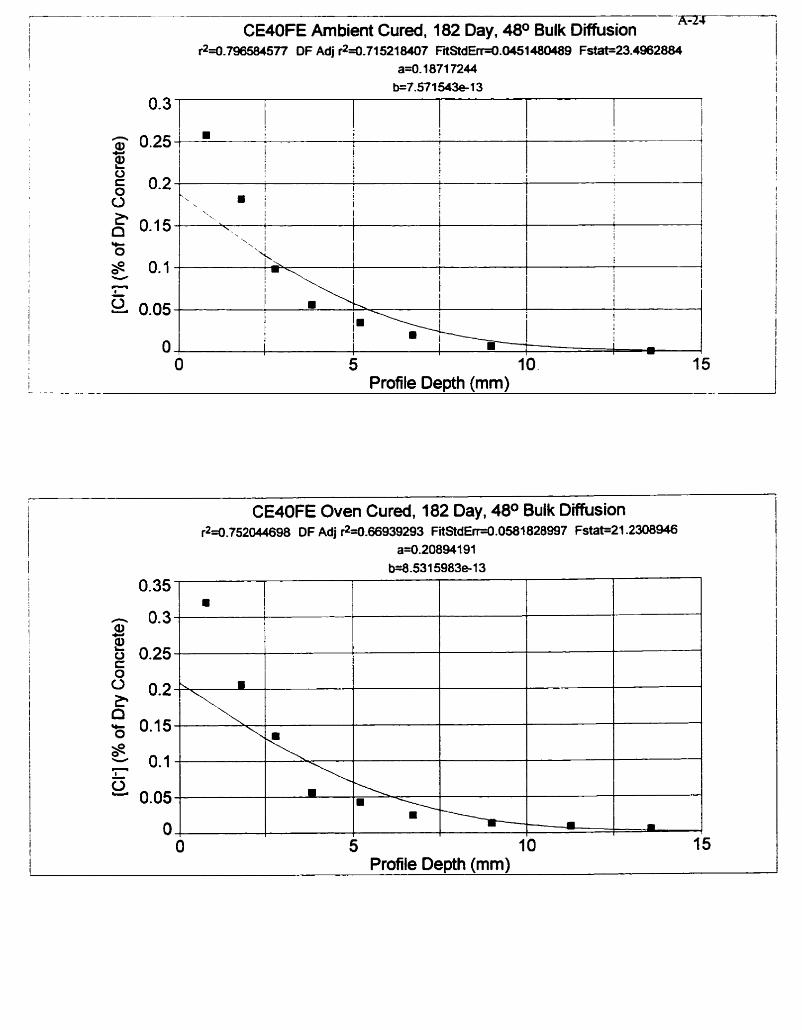
CE40FE Oven Cured, 182 Day, 4 8 O Buik Diffusion r2=û .752044698 DF Adj r2=û.66939293 FitStdErt=û .OS81 828997 Fstat=21.2308946
1 A-24 i CMOFE Arnbient Cured, 182 Day, 4 8 O Bulk Diffusion i r2=û.796584577 DF Adj r2=0.715218407 FflStdErr-0.045 1 480489 FstaG23.4962884 ! a=0.18717244 1 l b=7.571543e-13 i
5 10 Profile De~th (mm1
1 o. 3
Q 0.25 Ci
O 0.2 O
O I 0.15 I *
O j ! $ 0.1
w 1 - ! - l 9 0.05
1 I O 1
0 -
5 w
10. 15 I Profile Depth (mm)
1
i 1 l l
l ,
1 l
I 1
1 i
I l i 1
i 1 i ! I 1 !
I 4
1 \
I I a i \ 1 ! j
T
1 1 l 1
i I I I 1
lm 1 l 1 i ! I I 1
4
I T
i
I T
i !
i i 1 , I
I
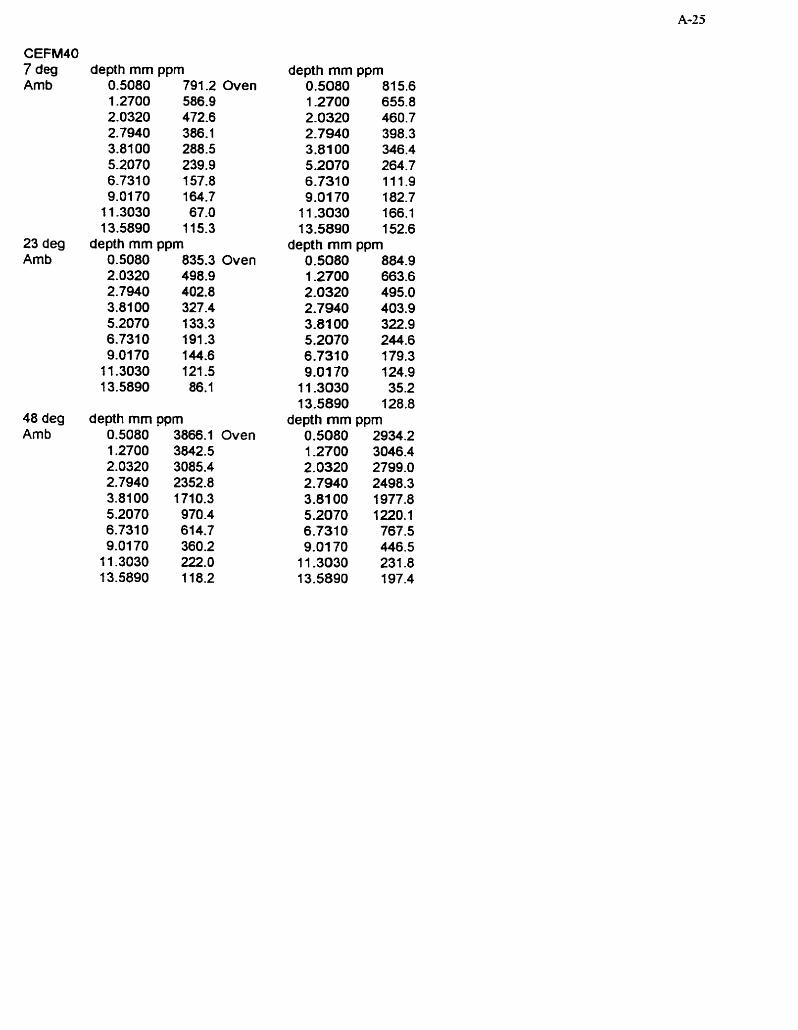
7 deg Arnb
23 deg Arnb
48 deg Amb
depth mm ppm 0.5080 791.2 Oven 1.2700 586.9 2.0320 472.6 2.7940 386.1 3.8100 288.5 5.2070 239.9 6.7310 157.8 9.0170 164.7
1 1.3030 67.0 13.5890 1 15.3
depth mm pprn 0.5080 835.3 Oven 2.0320 498.9 2.7940 402.8 3.8100 327.4 5.2070 133.3 6.7310 191 -3 9.0170 144.6
11.3030 121.5 1 3.5890 86.1
depth mm Dpm 0.5080 3866.1 Oven 1.2700 3842.5 2.0320 3085.4 2.7940 2352.8 3.81 O0 1710.3 5.2070 970.4 6.7310 614.7 9.0170 360.2
1 1.3030 222.0 13.5890 1 18.2
depth mm ppm 0.5080 815.6 1.2700 655.8 2.0320 460.7 2.7940 398.3 3.8100 346.4 5.2070 264.7 6.7310 111.9 9.0170 182.7
1 1 -3030 166.1 1 3.5890 152.6
depth mm ppm 0.5080 884.9 1.2700 663.6 2.0320 495.0 2.7940 403.9 3.8100 322.9 5.2070 244.6 6.7310 179.3 9.0170 124.9
11 -3030 35.2 13.5890 128.8
depth mm ppm 0.5080 2934.2 1 -2700 3046.4 2.0320 2799.0 2.7940 2498.3 3-81 00 1977.8 5.2070 1220.1 6.7310 767.5 9.0170 446.5
11 -3030 231 -8 1 3.5890 197.4
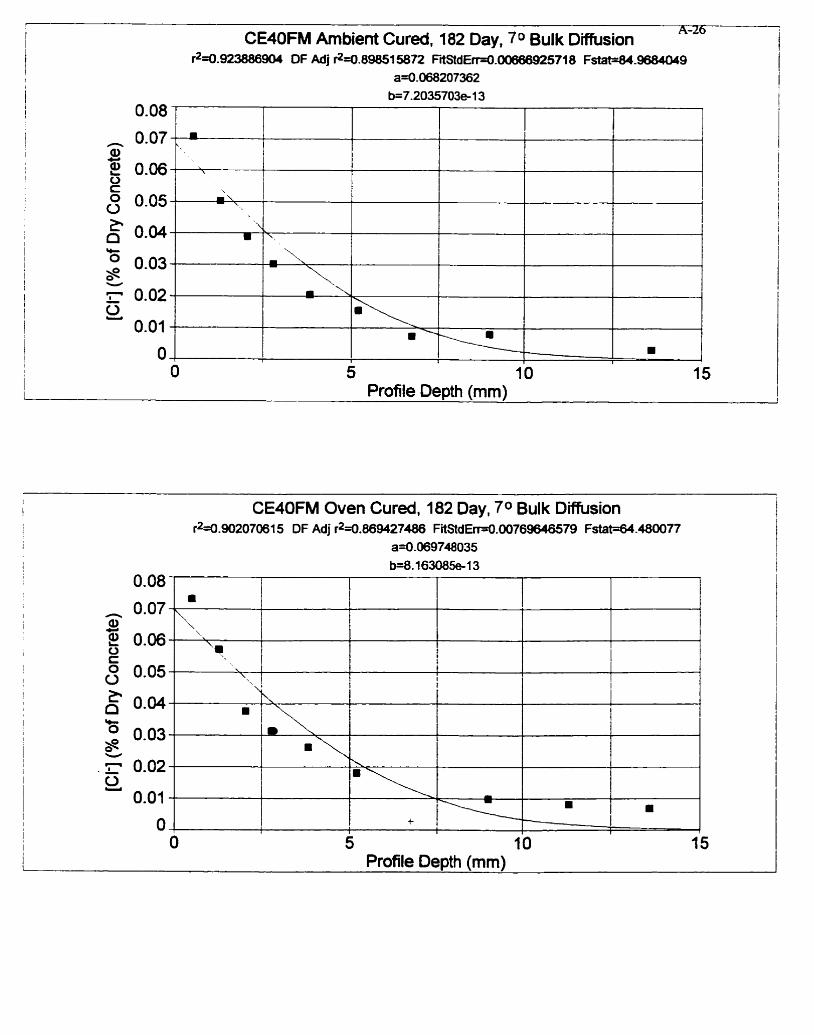
CE4OFM Arnbient Cured. 182 Day, 7 O Bulk Diffusion A-Lb
r2=û.923886904 OF Adj r2=û.898515872 FilStdErr=û.00666925718 Fm--84.9684049 i
a4.068207362 1
O 5 10 15 Profile Depth (mm)
CE40FM Oven Cured, 182 Day, 70 Bulk Diffusion 1 i r2=û.90207û61 5 DF Adj r24.869427486 FilStdEn=û.00769646579 FstaM.480077
1 b=8.163085e- 1 3 0.08
1 n 0.07 I al CI
E 0.06 1 O
C
! 6 0.05
1 1 , n " 0.04
ic I 2 0.03 1 V 1 . 7 00.2
i E 0.01
O
rn -\ \
\.
l?,
\ \ '
1 1 ,
1 O I 1 r
', l 1
rn
l l = I
f
5 I O 15 Profile Depth (mm)
I
1
rn m I
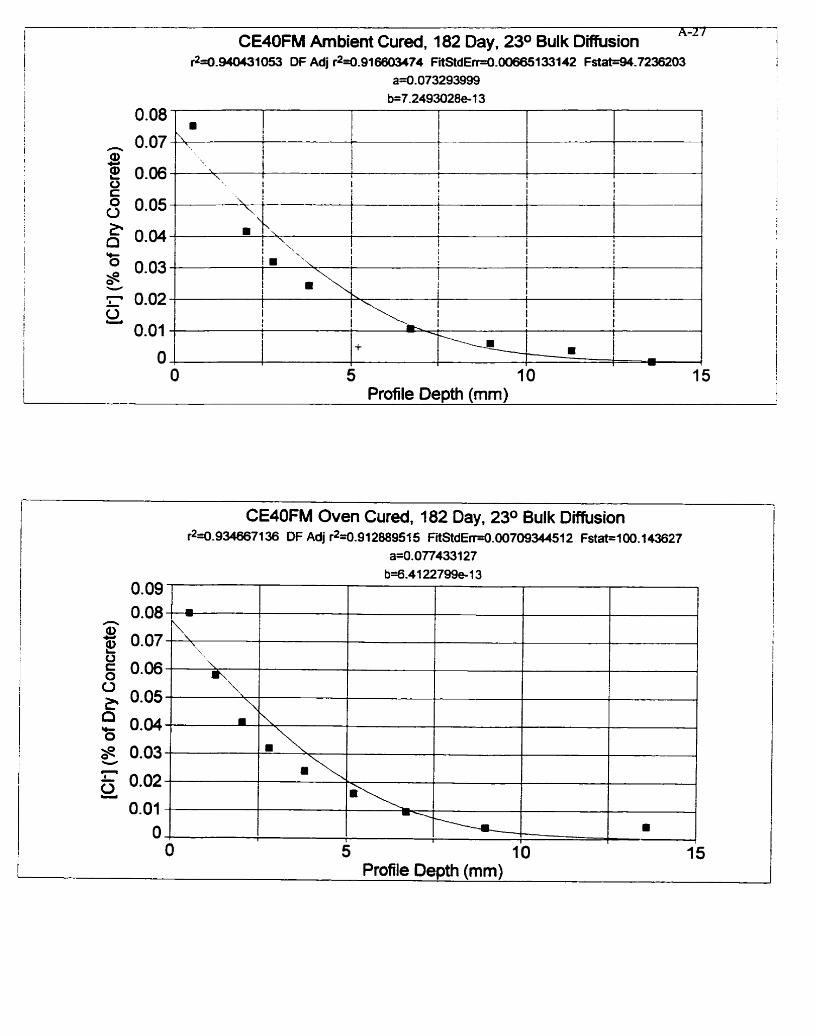
CMOFM Ambient Cured, 182 Day, 23O Bulk Diffusion A-2 I-
rZs0.94043 1053 DF Adj r2=0.9166CW74 FtStdErr4.00665133142 Fstat=94.7236203 a=0.073293999
k7.2493028e-13
I I O 5 I O 15 I
Profile Depth (mm) 1
CE40FM Oven Cured, 182 Day, 23O Bulk Diffusion l r2=0.9%6671 36 DF Adj r2=û.91 288951 5 f itStdE1~=0.00709344512 Fstat=lOû. 143627
a=O.On433127 b=6.4122799e-l3
0.09
n 0.08 -4
# 0.07 \\,
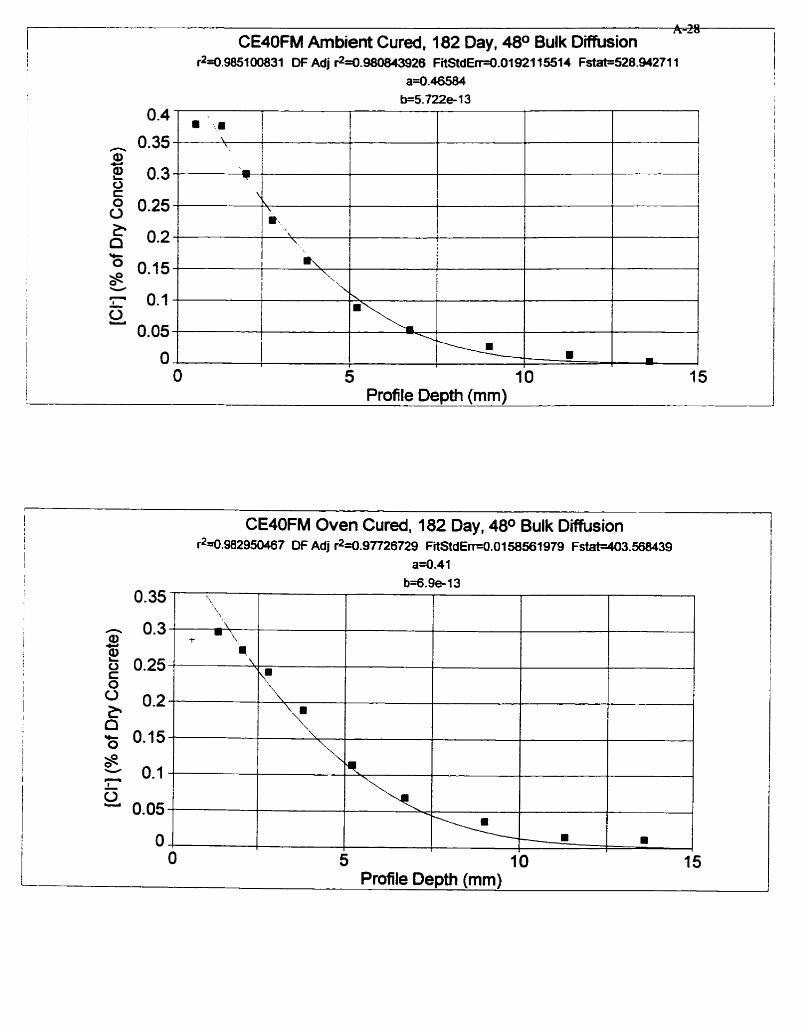
n-GU
! CMOFM Arnbient Cured, 182 Day, 4 8 O Bulk Diffusion 1 r2=0.9851 00831 DF Adj r2=0.980843926 FitStdEH.Oi921i5514 F stat=528.942711
a=0.46584 b=S.iZZe-l3
I
l O 5 10 15 1 Profile Depth (mm)
CMOFM Oven Cured, 182 Day, 480 Bulk Diffusion r2.0.982950467 DF Adj r*=û.97726729 FilStdErr.0.0158581979 Fsta-403-568439
a=0.41
Profile Depth (mm)
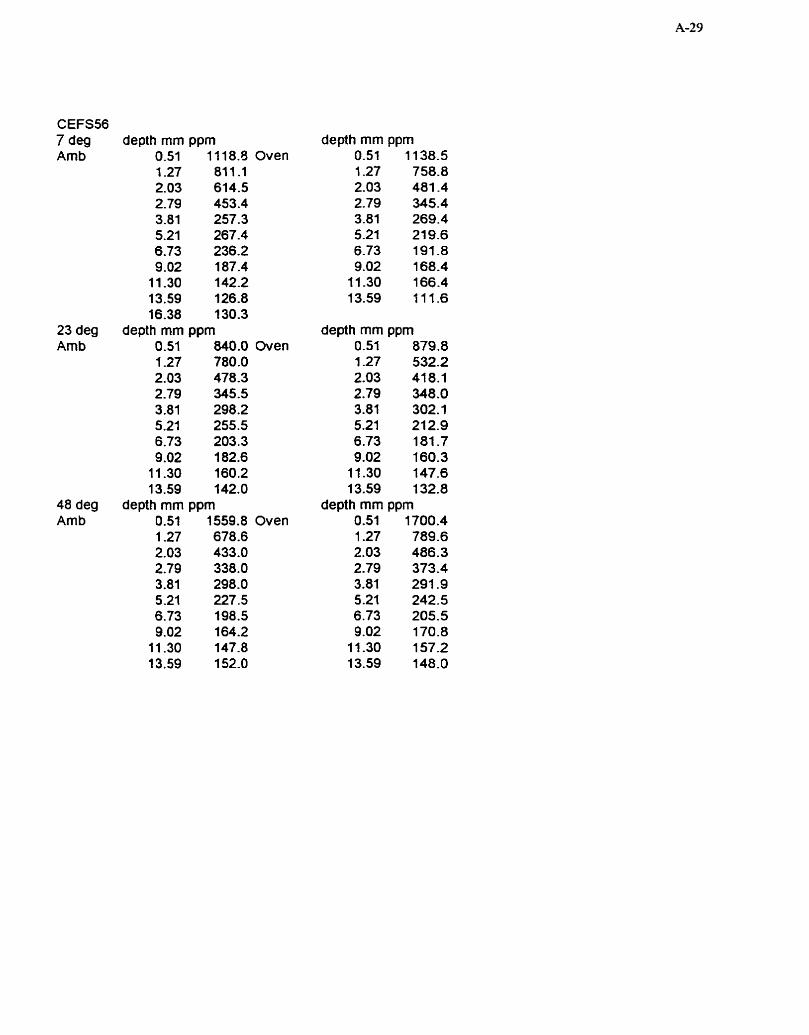
CEFS56 7 deg depth mm pprn Amb 0.51 11 18.5 Oven
1.27 811.1 2.03 614.5 2.79 453.4 3.81 257.3 5.21 267.4 6.73 236.2 9.02 187.4
11 -30 142.2 13.59 126.8 16.38 130.3
23 deg depth mm pprn Amb 0.51 840.0 Oven
1.27 780.0 2.03 478.3 2.79 345.5 3.81 298.2 5.21 255.5 6.73 203.3 9.02 182.6
11.30 160.2 13.59 142.0
48 deg depth mm pprn Amb 0.51 1559.8 Oven
1.27 678.6 2.03 433.0 2.79 338.0 3.81 298.0 5 -21 227.5 6.73 198.5 9.02 164.2
11 -30 147.8 13.59 152.0
depth mm pprn 0.51 1138.5 1.27 758.8 2.03 481 -4 2.79 345.4 3.81 269.4 5.21 219.6 6.73 191 -8 9.02 168.4
11.30 166.4 13.59 111.6
depth mm pprn 0.51 879.8 1.27 532.2 2.03 418.1 2.79 348.0 3.81 302.1 5.21 212.9 6.73 181 -7 9.02 160.3
11.30 147.6 13.59 132.8
depth mm pprn 0.51 1700.4 1 .Si 789.6 2.03 486.3 2.79 373.4 3.81 291.9 5.21 242.5 6.73 205.5 9.02 170.8
11 -30 157.2 13.59 148.0
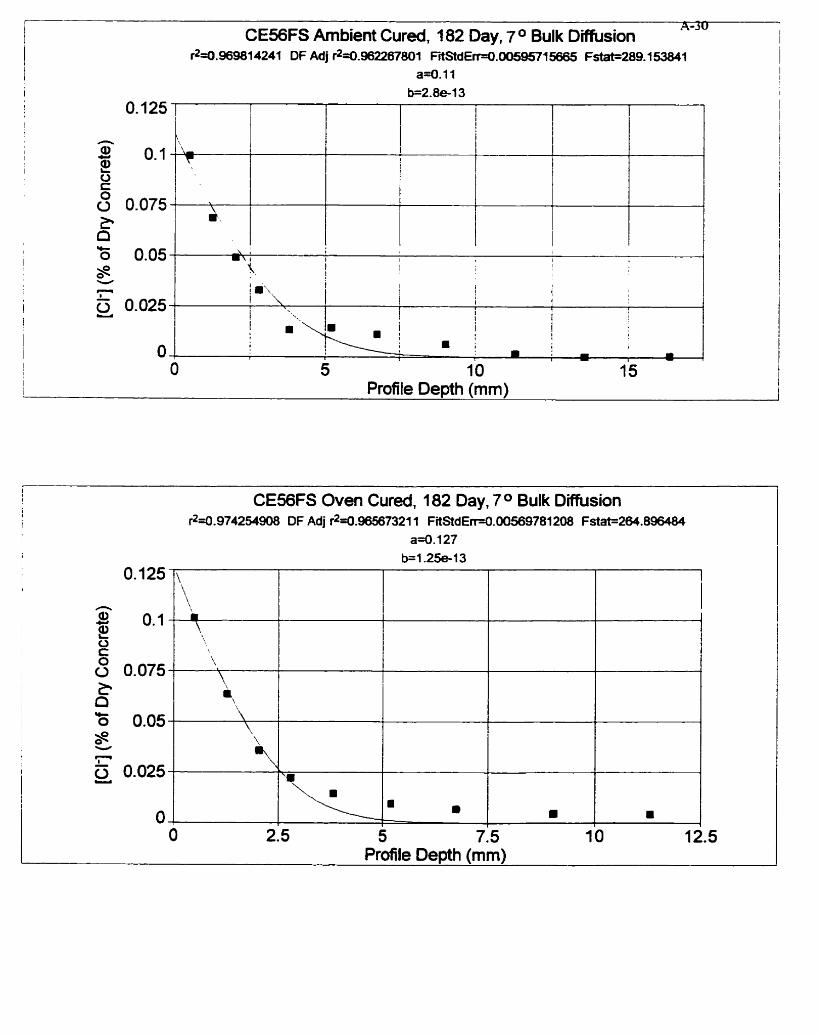
CE56FS Arnbient Cured, 182 Oay, 7 O Bulk Diffusion A-30
1 $4 -96981 4241 DF Adj r2=û.962267801 F~StdEniO.ûûS9571 Fstat=289.153841 1
I I Profile Depth (mm)
CE56FS Oven Cured, 182 Day, 7 Bulk Diffusion r2=0,974254908 DF Adj r2=û.965673211 FiiStdEm=û.00569781 208 Fstat=264.8W
a=0.127
5 a iC O 0.05 s - - 0 0.025 I
O .
.\;
\ \
Y,
O
\
1 i
2.5 5 7.5 10 12.5 Profile Depth (mm)
I m
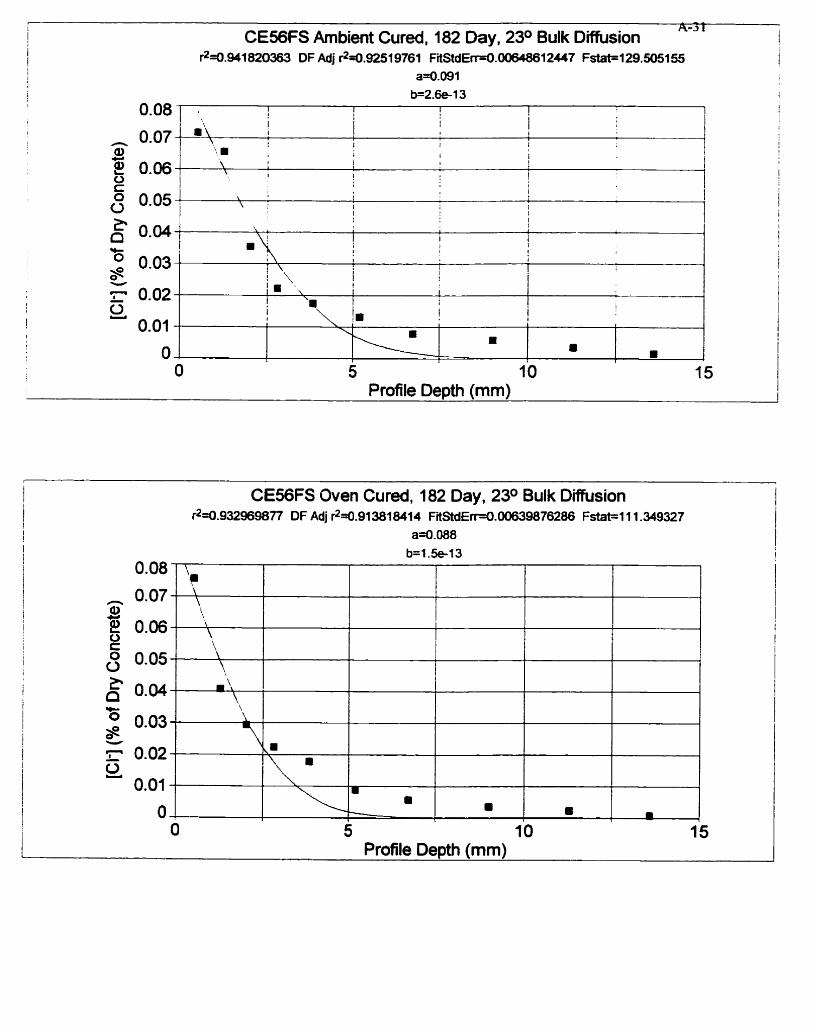
O 5 I O 15 I I
l Profile Depth (mm) I 1
r
i CE56FS Ambient Cured, 182 ûay, 23O Bulk Diffusion A-3 1
1 i l $=0.941820363 DFAdj $=û.92519761 FitStdE~O.WW8012447 Fat--129.505155 1 1 a4.091 I
1
b=2.6e-13 1
CE56FS Oven Cured, 182 Day, 23O Bulk Diffusion +=û.932969ôn DF Adj +û.913818414 FitStdErr-0.00639876286 Fstat=111.349327
a4.088
0.08 I
t 0.07 n Q) CI
E 0.06 O
+ O 5 10 15
Profile Depth (mm)
0.05 i \ 1 1 I 1 O I 1
1 1 1 I ! 1 I I
I i - '? 0
I I
i f '.
\ f L I 1 1 ! I
i
1 I
!
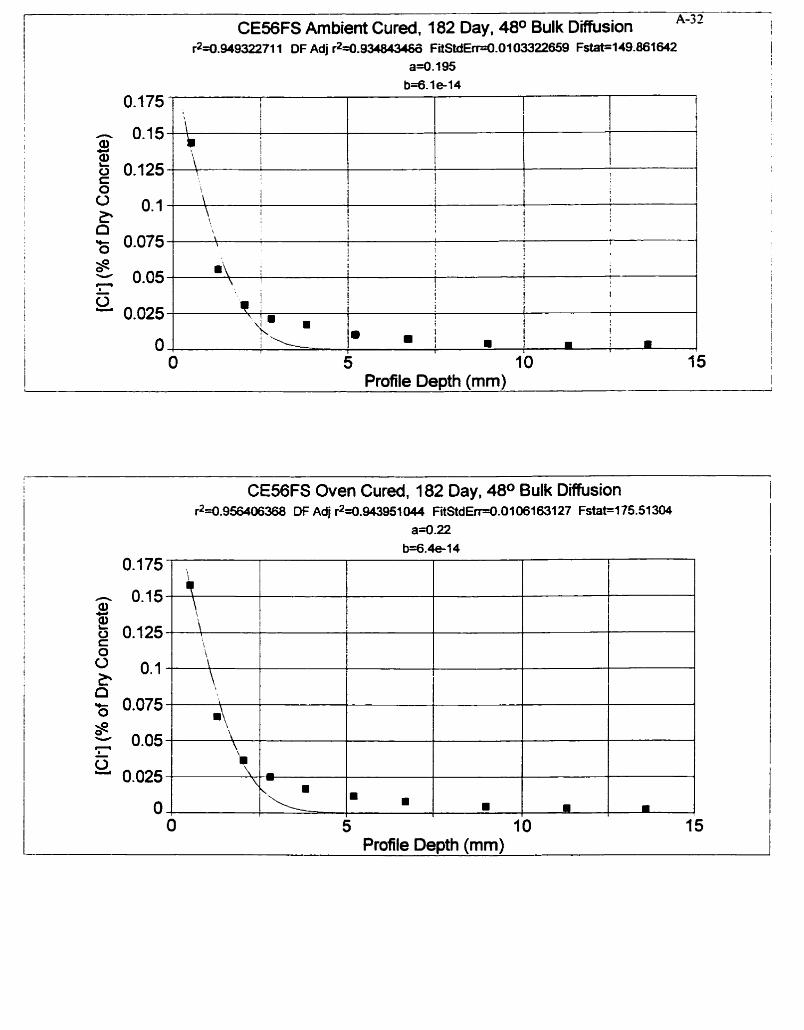
I CE56FS Ambient Cured, 182 Day, 4 8 O Bulk Diffusion A-3 2 i
r2=0.949322711 DF Adj r2=0,9348434ôÔ FitStdEd.0103322659 F m 1 49.861 642 a=û.195
b = 6 l e-14
CE56FS Oven Cured, 182 Day, 4 8 O Bulk Diffusion 1 r2=0.95W16368 DF Adj r2=0.943951044 FitStdErHl.01 O616MZi Fstat=l75.51304
a=0.22 b=6.4e-14
0 1
! 1 O. 175 ! \
I - 0.15 aa i ! Y
i I l 0.125 - '\, C 1
O 5 10 15 1 Profile Depth (mm)
1
I , 1 1 1
j O
1 * 0.1 l
', \ I I
1 1 ! l 2
1
1 j, i I , n - 0.075 O
l 1
, S - 0.05 - I - 1 t 0.025 1 1 1
1 O , ! 15 O 5 10 t
Profile Depth (mm) I
I
i
1 ! I 1
i , 1 i i I
I i
! j .\ I I 1 1 I r l
1 i
, . i ! 1 I 1 ,',F 1 i
1 'y . ! i l i
f I 1 I
t m i I m 1 1 I !

Appendix B Migration Ce11 Data
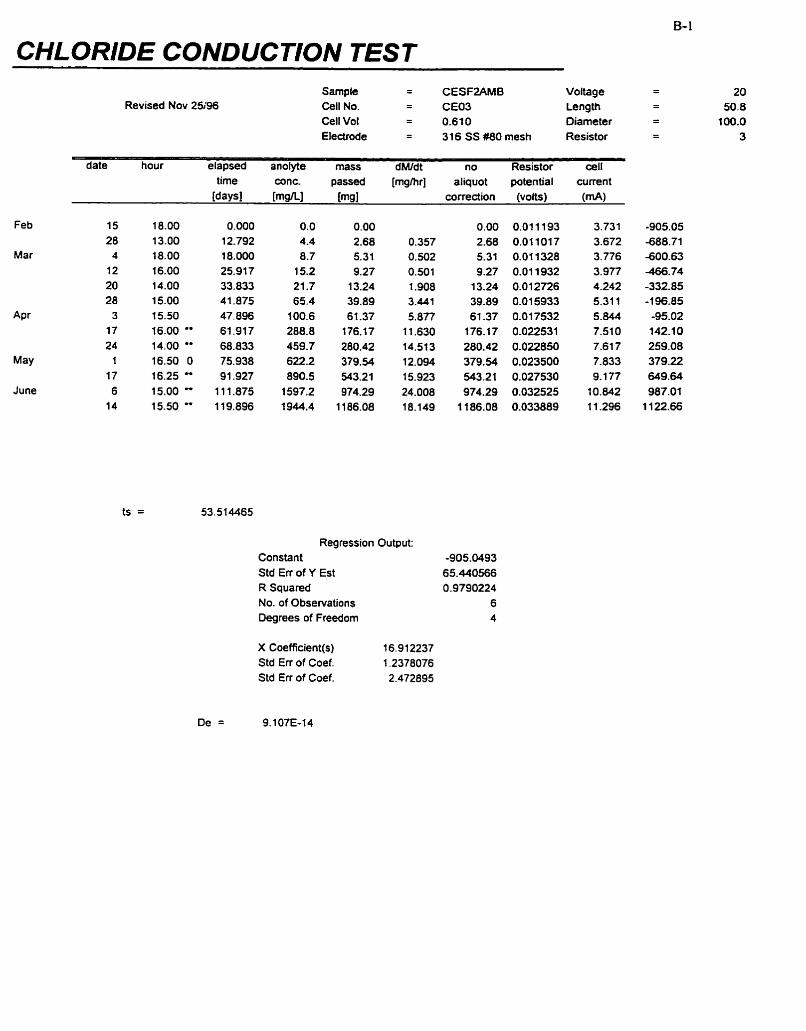
CHLORIDE CONDUCTION TEST
Feb
Mar
APr
May
June
Revised Nov 25'96 Sarnple = CESF2AMB Voltage Cell No. = CE03 Length Cell Vol = 0.610 Diameter Eledrode = 316 SS #80 mesh Resistor
> - - -
date hour elapsed anoiyte mass dM1dt no Resistor ceII time wnc. passed [mghr] aliquot potential current
[da~sl [m@I [mg] correction (volts) (MA)
Regression Output: Constant -905.0493 Std Err of Y Est 65.440566 R Squared O .9790224 No. of Observations 6 Degrees of Freedom 4
X Coefficient(s) 16.91 2237 Std Err of Coef. 1.2378076 Std Err of Coef. 2.472895
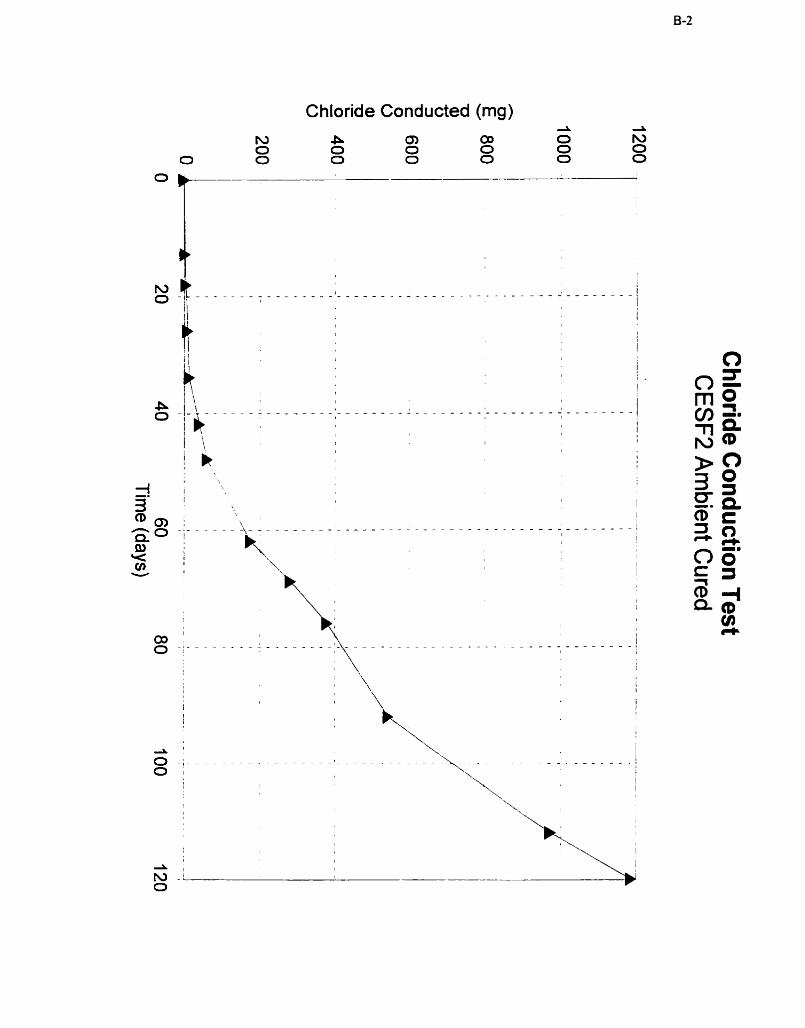
Chloride Conducted (mg)
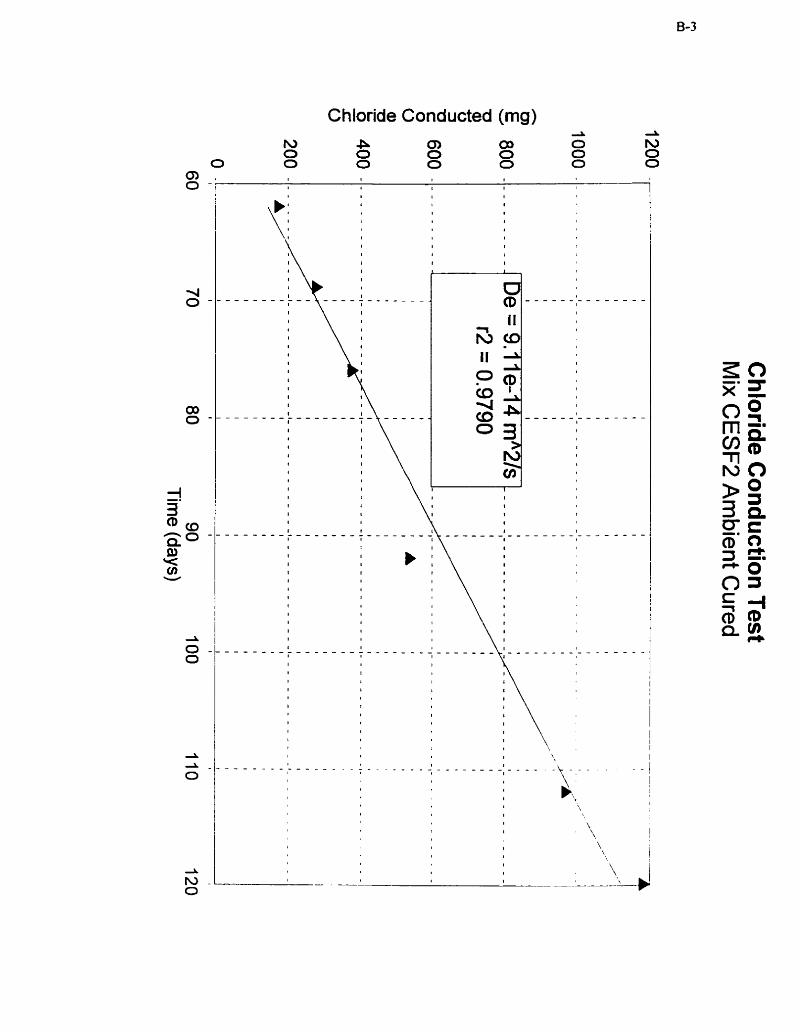
Chloride Conducted (mg)
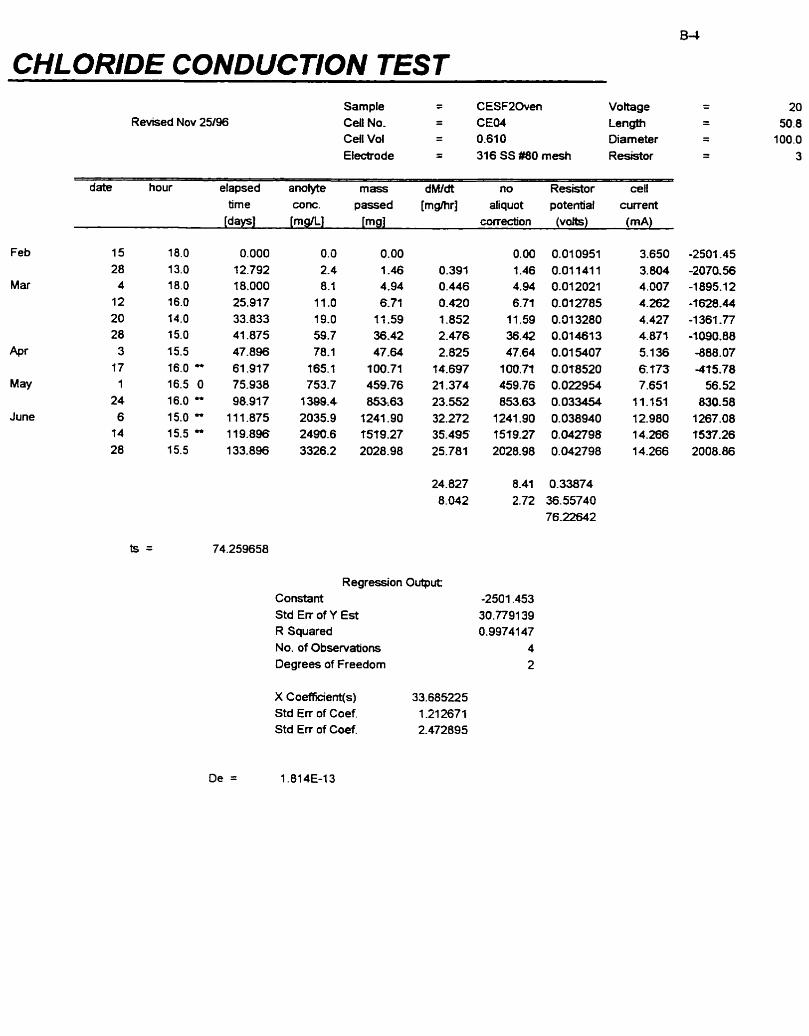
CHLORIDE CONDUCTION TEST
Feb
Mar
A P ~
May
June
Revised Nov 25196 Sample - - CESF20ven Voitage - - Ceil No. - - CE04 Length - - Cell Vol d - 0.61 0 Diameter - - Electrode - - 316 SS #80 mesh Resistor - -
date hour elapsed anoîyte m a s dMldt no Resistor cell time cortc. passed [mg/hr] atiquot potential current
[daysJ [mgJL] [mg] conection ( v a ) (m A)
Constant Std E r of Y Est R Squared No. of Observations Degrees of Freedom
X Coefficient(s) Std Err of Coef. Std En of Coef.
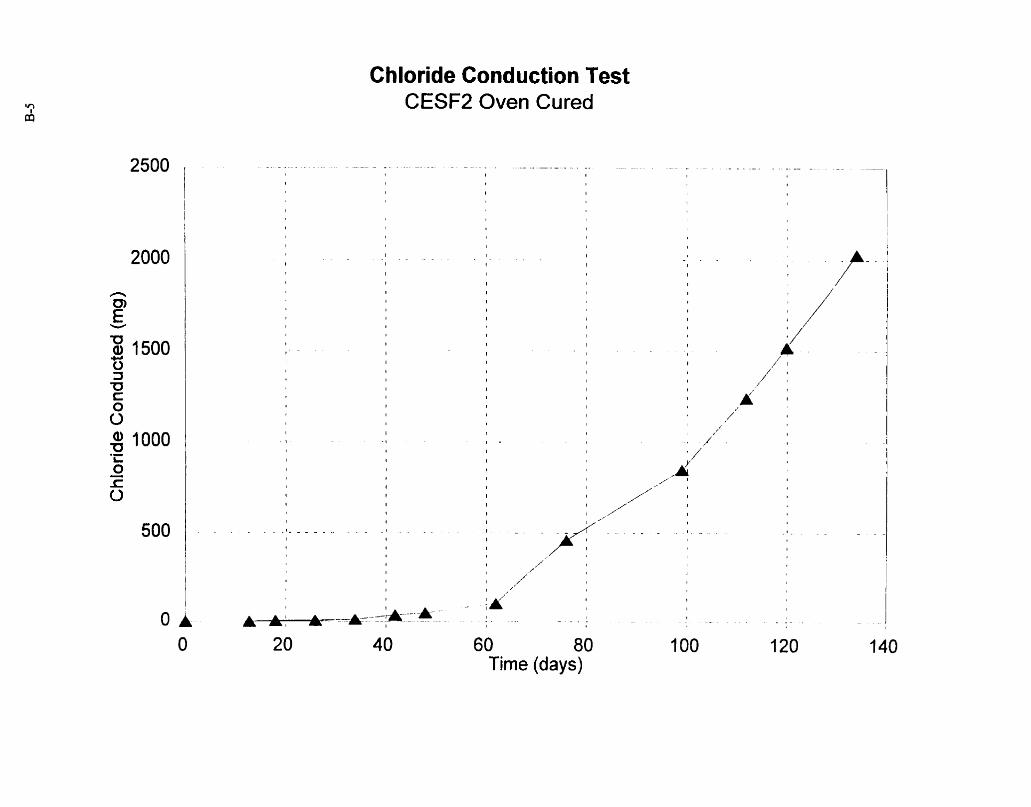
Chloride Conduction Test CESF2 Oven Cured
1 - . . .
1
60 80 Time (days)
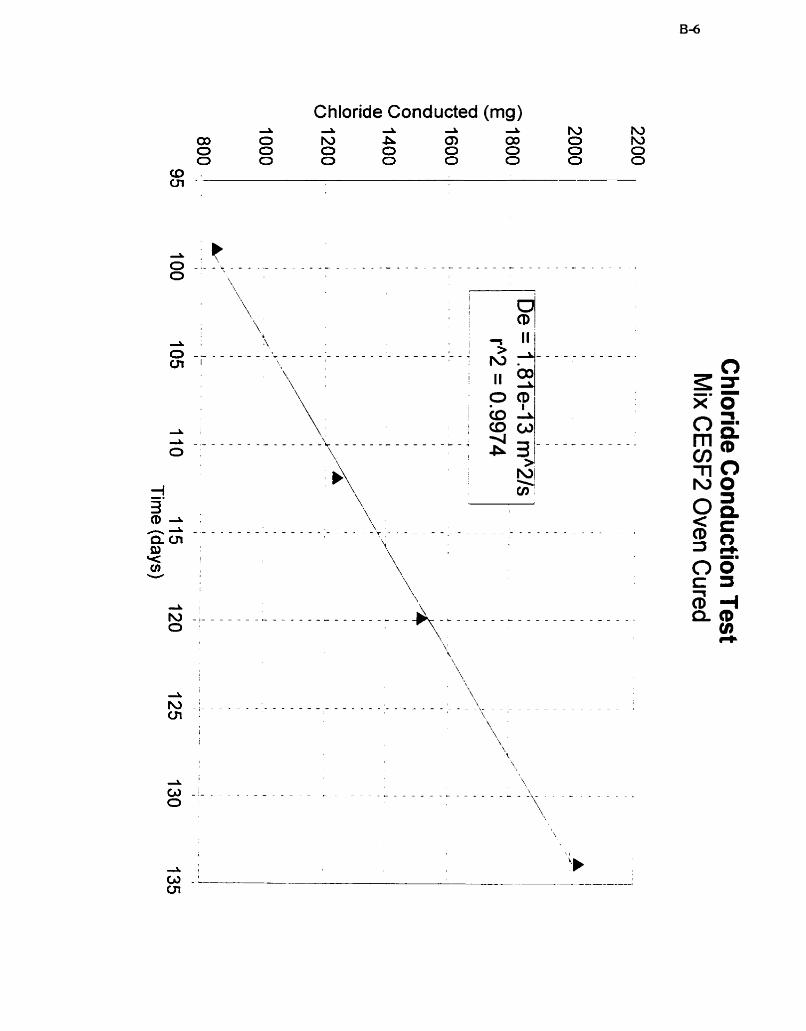
Chloride Conducted (mg)
O (DI
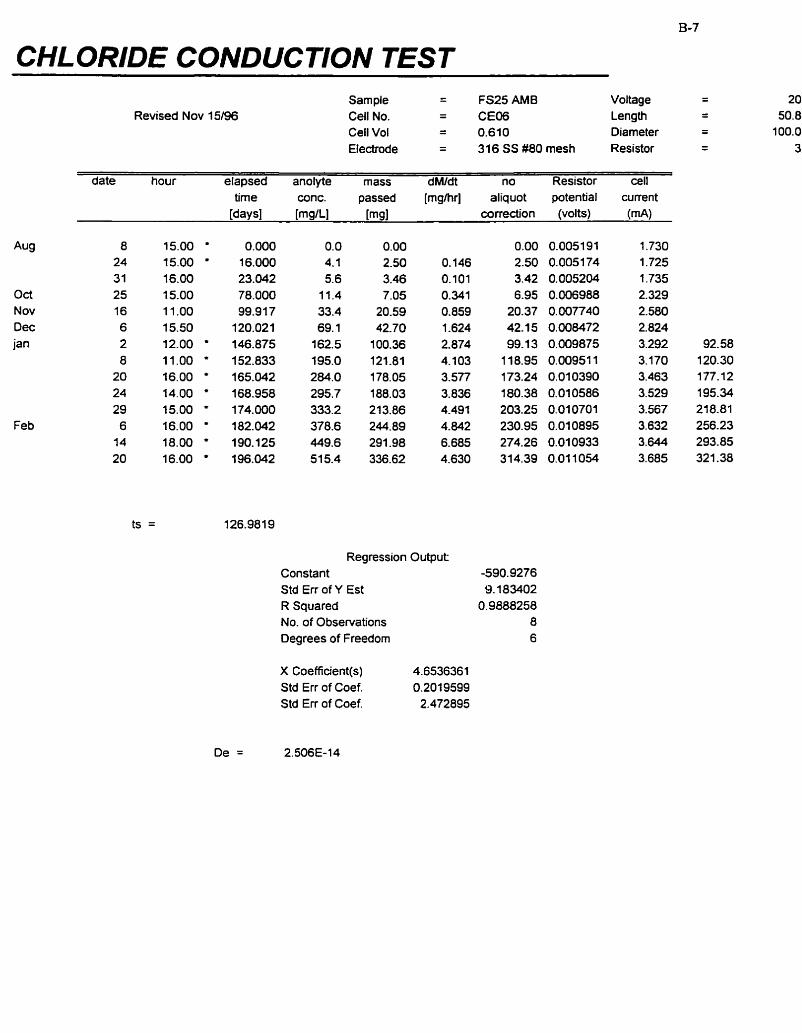
CHLORIDE CONDUCTlON TEST
Oct Nov Dec jan
Feb
Revised Nov 15196 Sample = FS25 AM6 Voltage Cell No. = CE06 Length Cell Vol = 0.610 Diameter Electrode = 316 SS #80 mesh Resistor
date hour elapsed anolyte mass dMIdt no Resistor cell time conc. passed [rnghr] aliquot potential current
[da~s l m I L 1 [mg] correction (volts) ( m 4
Regression Output: Constant -590.9276 Std En of Y Est 9.183402 R Squared 0.9888258 No. of Observations 8 Degrees of F reedorn 6
X Coeffiuent(s) 4.6536361 Std Err of Coef. 0.201 9599 Std Err of Coef. 2.472895
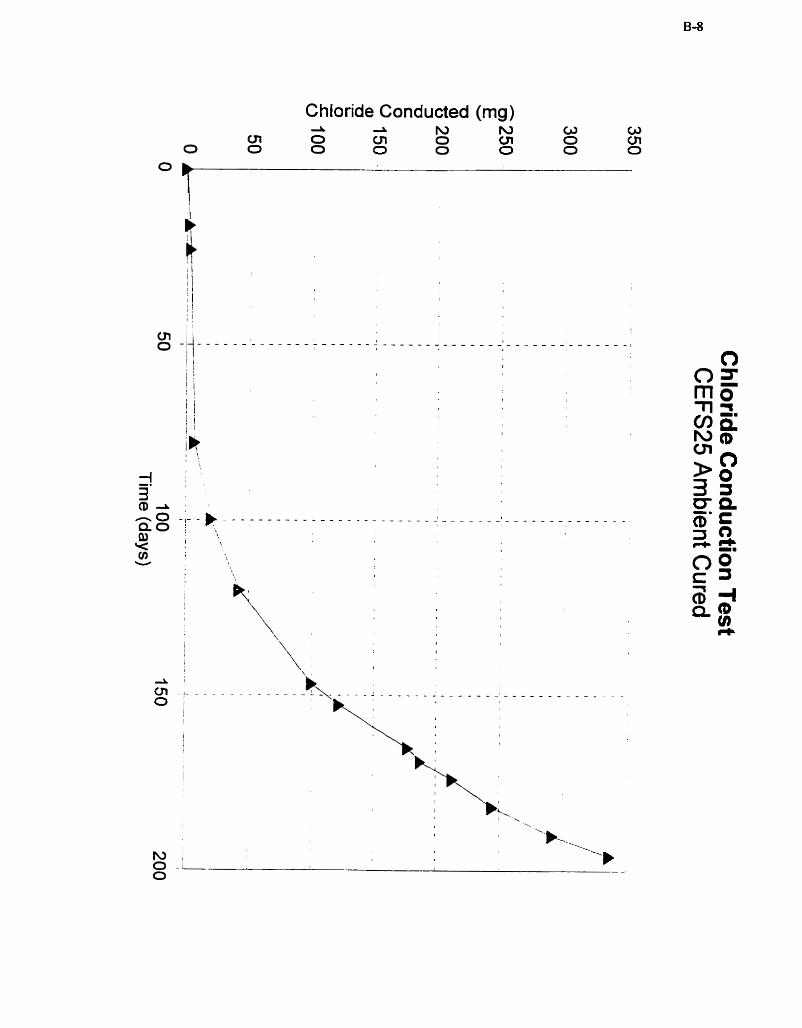
Chloride Conducted (mg)
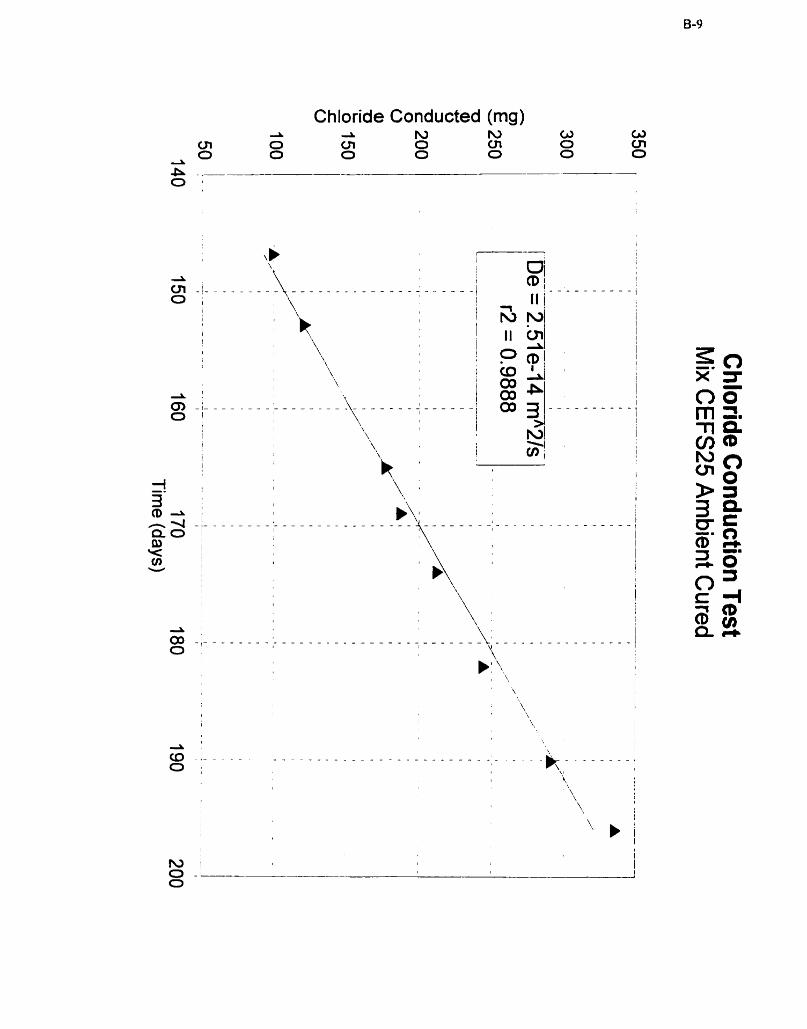
Chloride Conducted (mg)
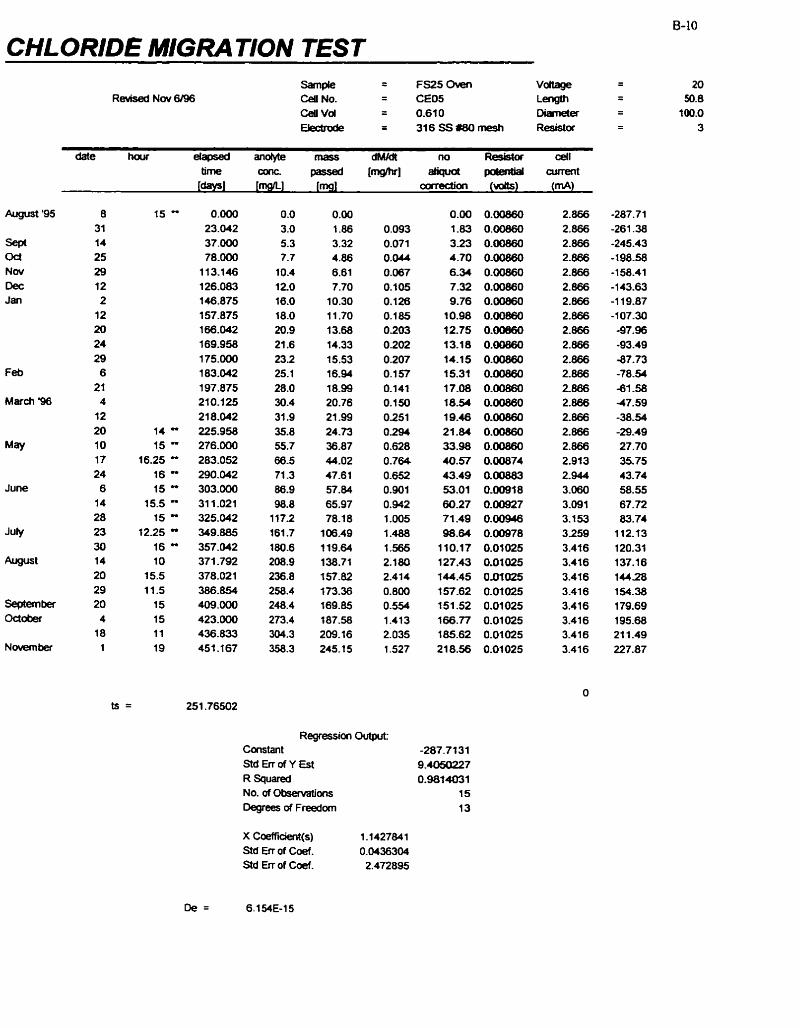
CHLORIDE MIGRATION TEST
Regressiori Output: Canstant -287.71 31 Std G r of Y Est 9.405(1227 R Squared 0,9814031 No. of Observations 15 Oegrees of Freedom 13
X Coeffiàent(s) 1.1427841 Std Err of Coef. 0.0436304 Std Err of Coef. 2.472895
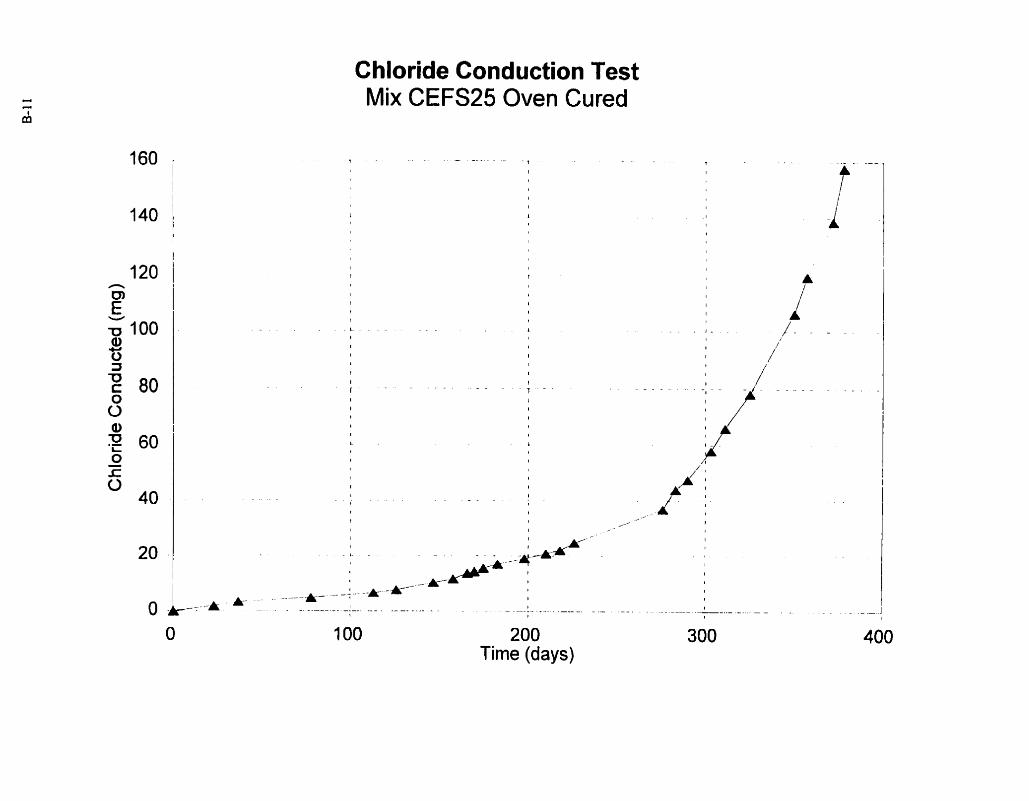
Chloride Conduction Test Mix CEFS25 Oven Cured
200 Time (days)
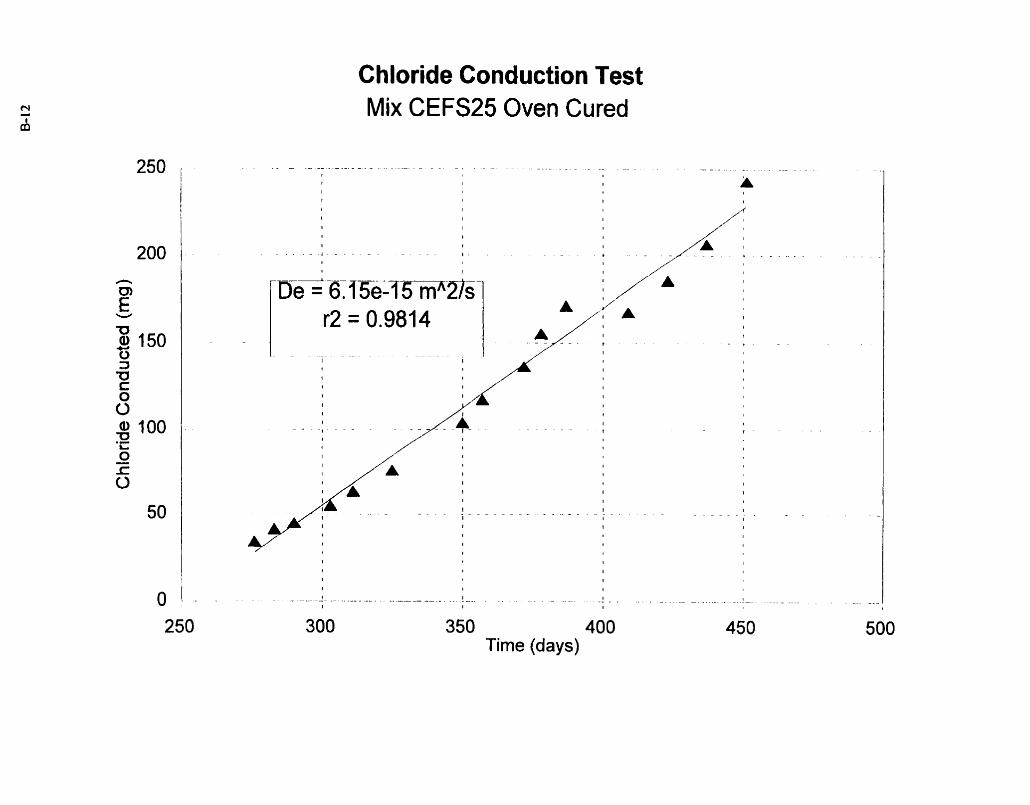
Chloride Conduction Test Mix CEFS25 Oven Cured
350 400 Time (days)
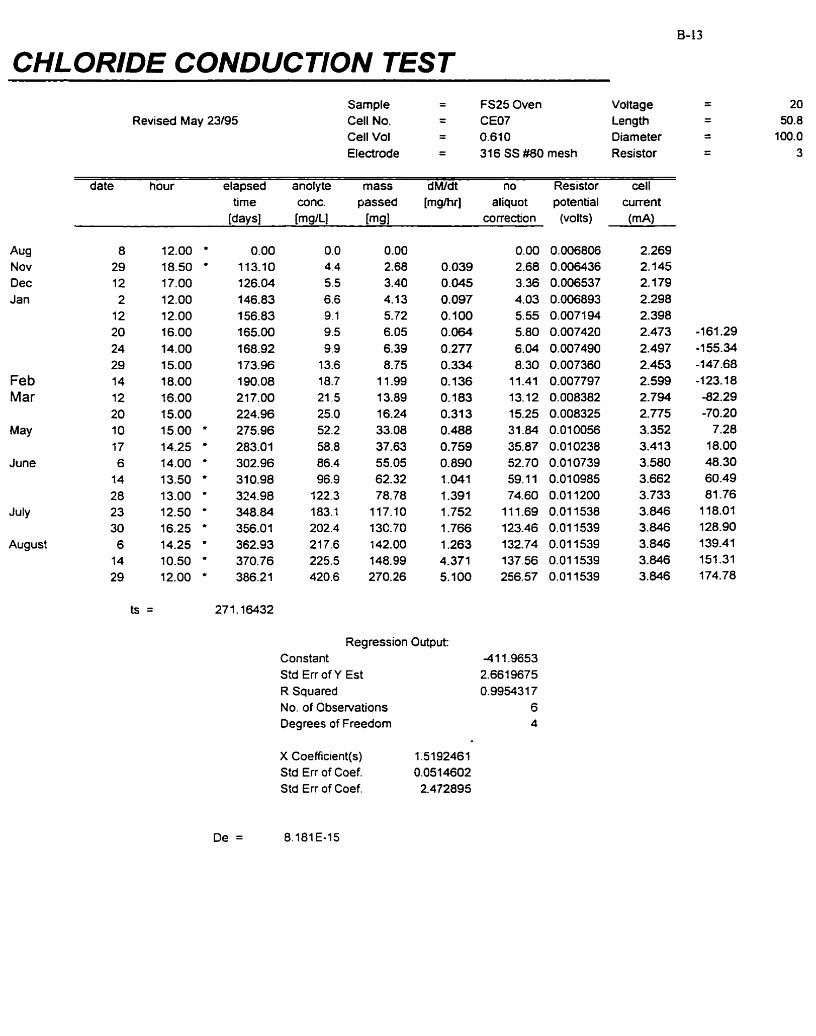
CHLORIDE CONDUCTION TEST
Aug Nov Dec Jan
Revised May 23/95 Sample - - FS25 Oven Voltage - - Cell No. - - CE07 Length - - Cell Vol - - 0.610 Diameter - - Electrode - - 316 SS #80 mesh Resistor - -
date hour elapsed anolyte mass dM/dt no Resistor ceIl time mnc. passed [mghr] aliquot potential curent
[daysl ImgfL] [mg] correction (volts) (mA)
8 29 12 2 12 20 24 29
Feb 14 Mar 12
20
May 10 17
June 6 14 28
July 23 30
August 6 14 29
Regression Output: Constant -4 1 1.9653 Std Err of Y Est 2.6619675 R Squared 0.995431 7 No. of Observations 6 Degrees of Freedom 4
X Coefficient(s) 1.5192461 Std Err of Coef. 0.0514602 Std Err of Coef. 2.472895
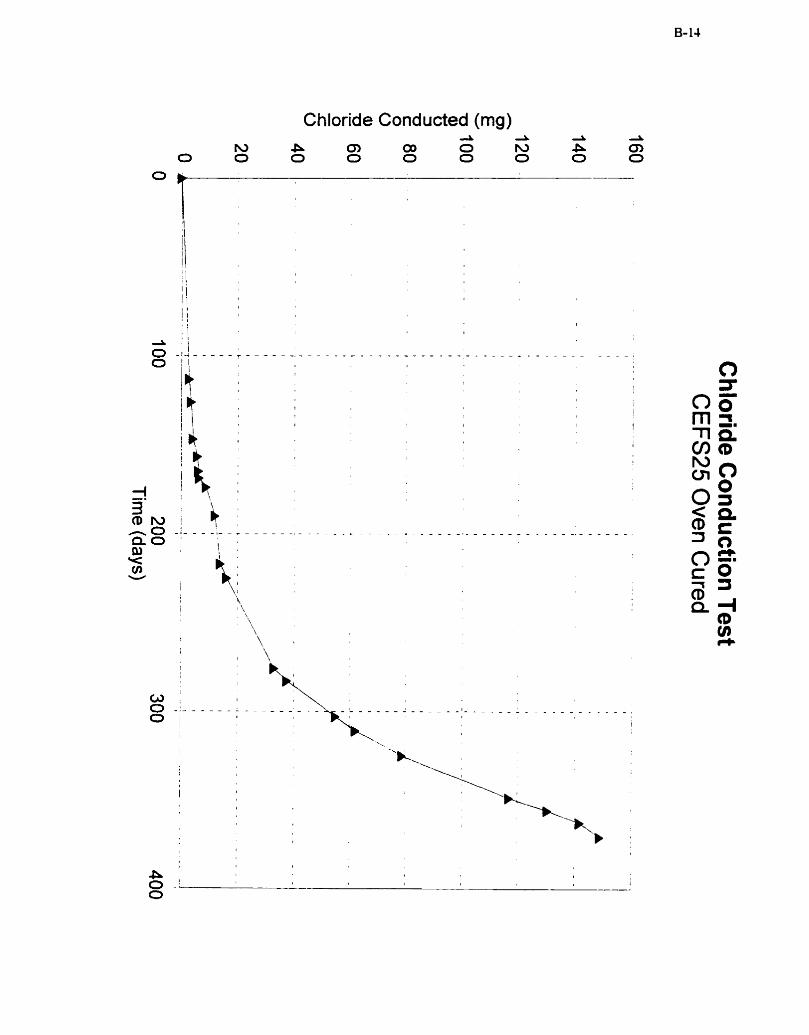
Chloride Conducted (mg)
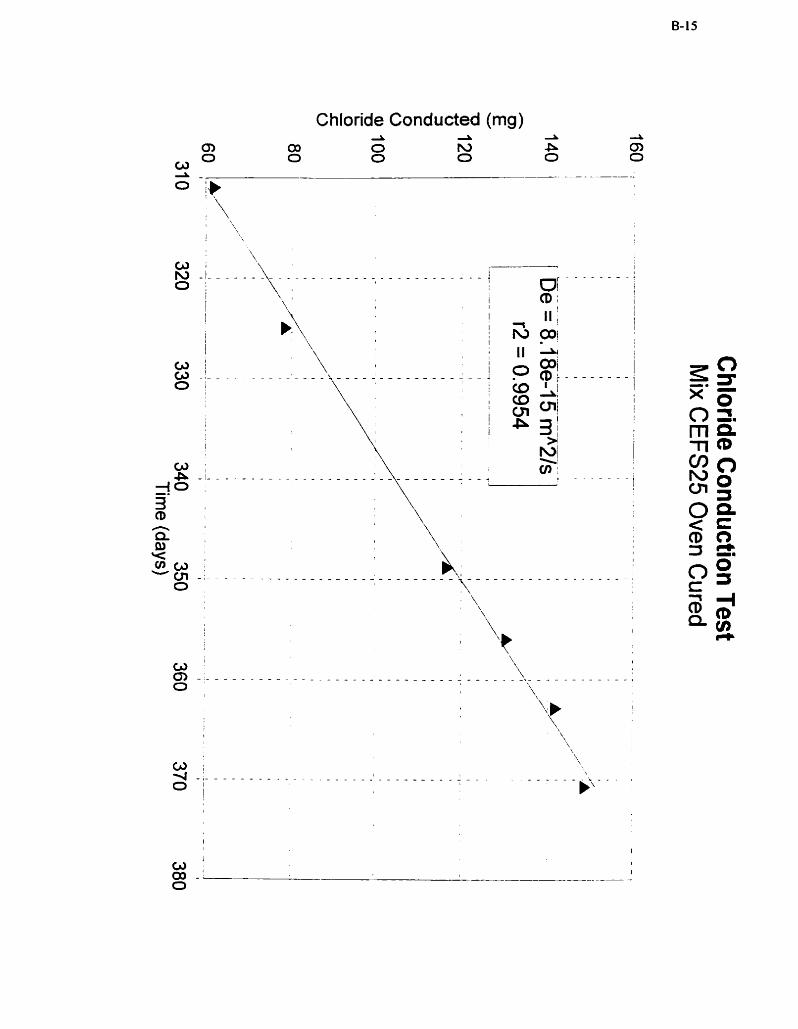
Chloride Conducted (mg)
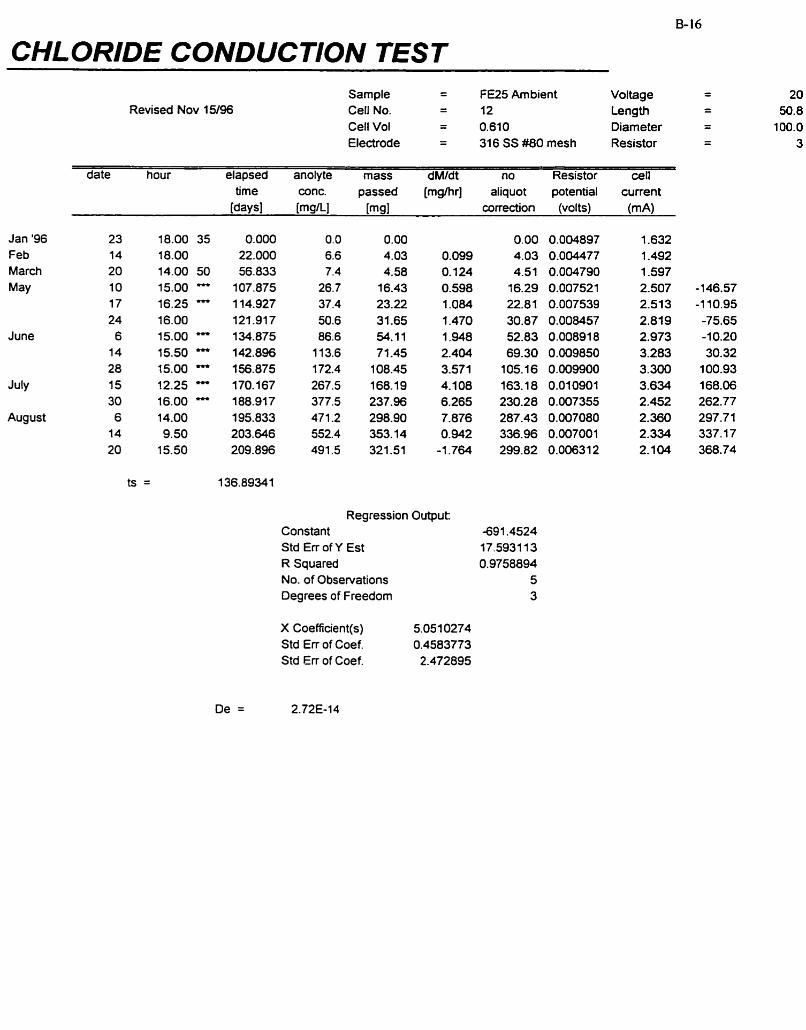
CHLORIDE CONDUCTION TEST
Jan '96 Feb March
May
June
July
August
Revised Nov 15/96 Sample - - F €25 Ambient Voltage Cell No. d - 12 Length
Cell Vol - - 0.61 O Diameter
Electrode - - 31 6 SS #80 mesh Resistor
i
date hour elapsed anolyte mass dM1dt no Resistor cell time conc. passed [mglhr] aliquot potential current
kW SI [mg/Ll [mg] correction (volts) (m A)
Regression Output Constant -69 1.4524 Std Err of Y Est 17.593113 R Squared 0.9758894 No. of Observations 5 Degrees of Freedom 3
X CoeKcient(s) 5.051 0274 Std Err of Coef. 0.4583773 Std Err of Coef. 2.472895
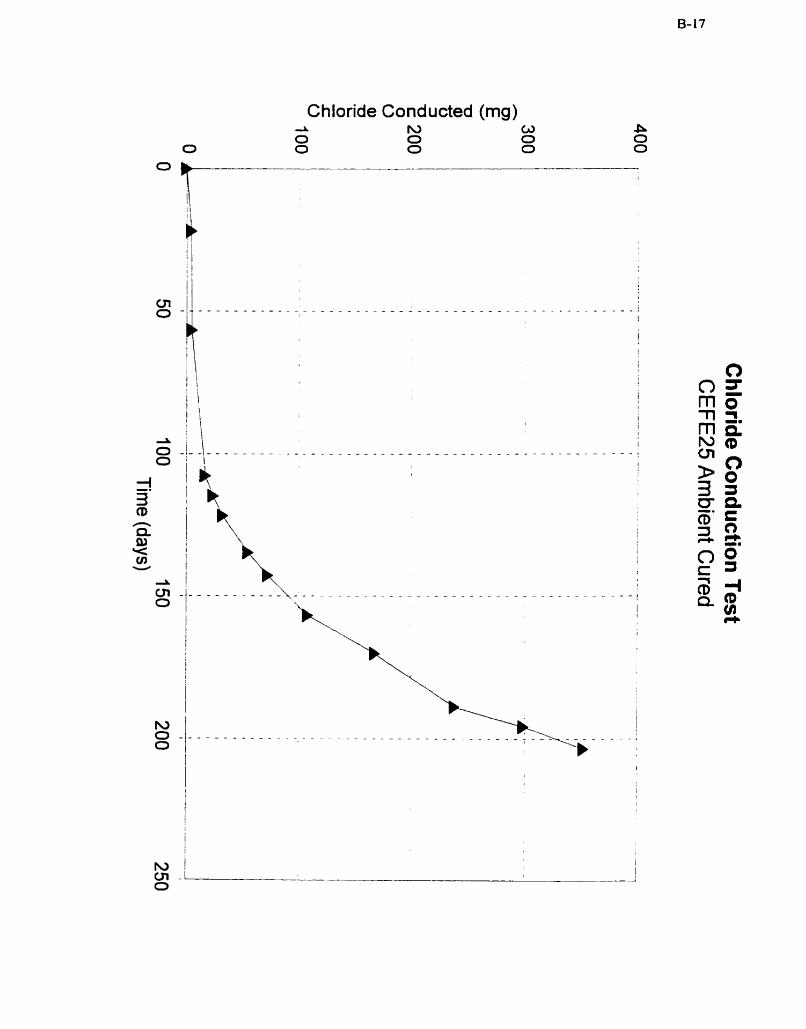
Chloride Conducted (mg)
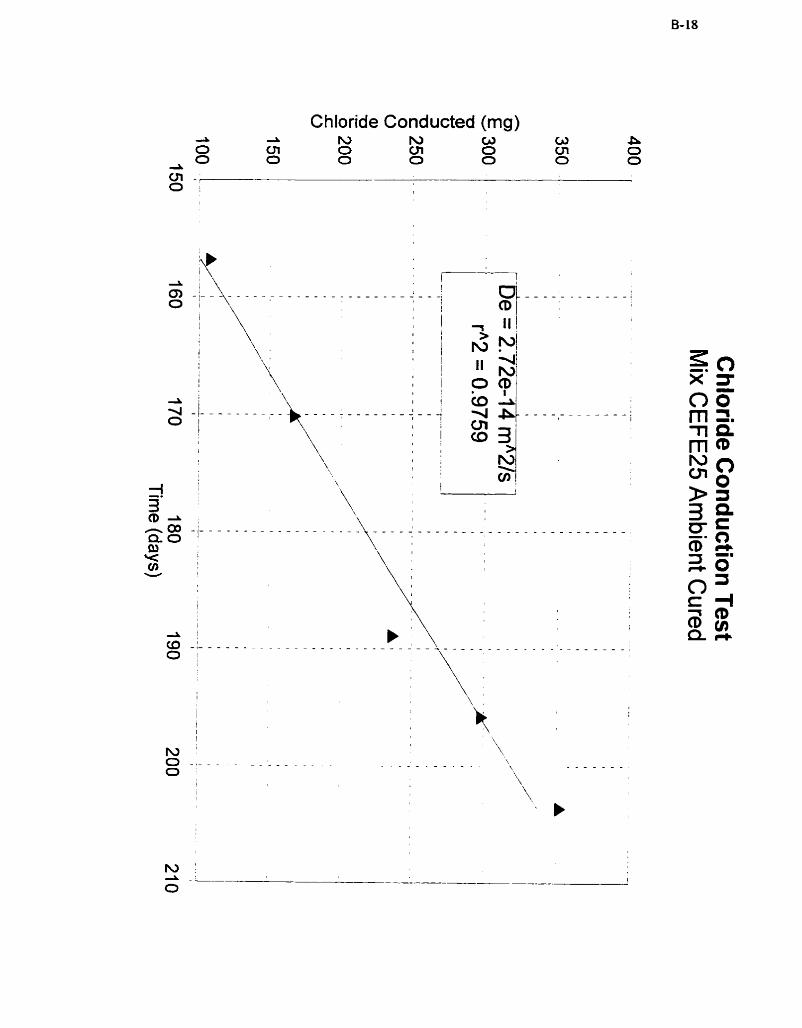
Chloride Conducted (mg)
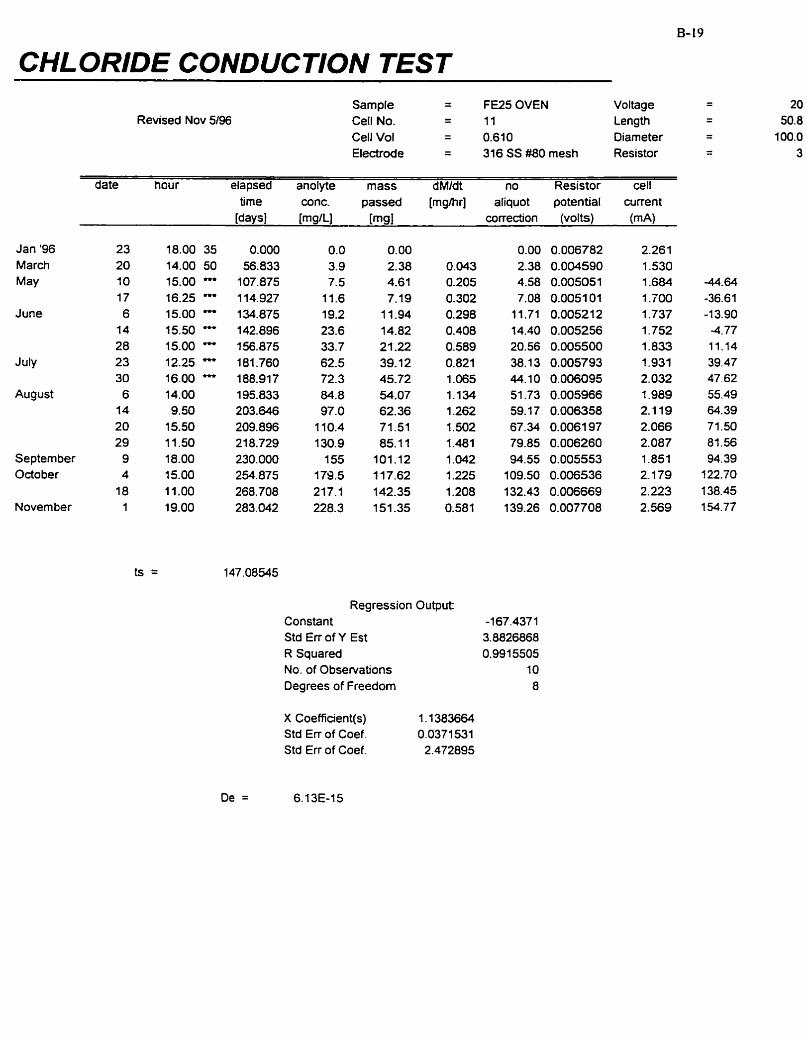
CHLORIDE CONDUCTION TEST
Jan '96 March
May
June
July
August
Septem ber October
Novem ber
Revised Nov 5196 Sample - - FE25 OVEN Voltage CeIl No. - - 11 Length
Cell Vol = 0.610 Diameter Electrade = 316 SS #80 mesh Resistor
date hour elapsed anolyte mass dM1dt no Resistor cell time conc. passed [mghr] aliquot potential current
~ Y S I [ W L I [mg] correction (volts) (m A)
Regression Output: Constant -1 67.437 1 Std Err of Y Est 3.8826868 R Squared 0.9915505 No. of Observations 10 Degrees of Freedom 8
X Coefficient(s) 1.1383664 Std Err of Coef. 0.0371531 Std Err of Coef. 2.472895
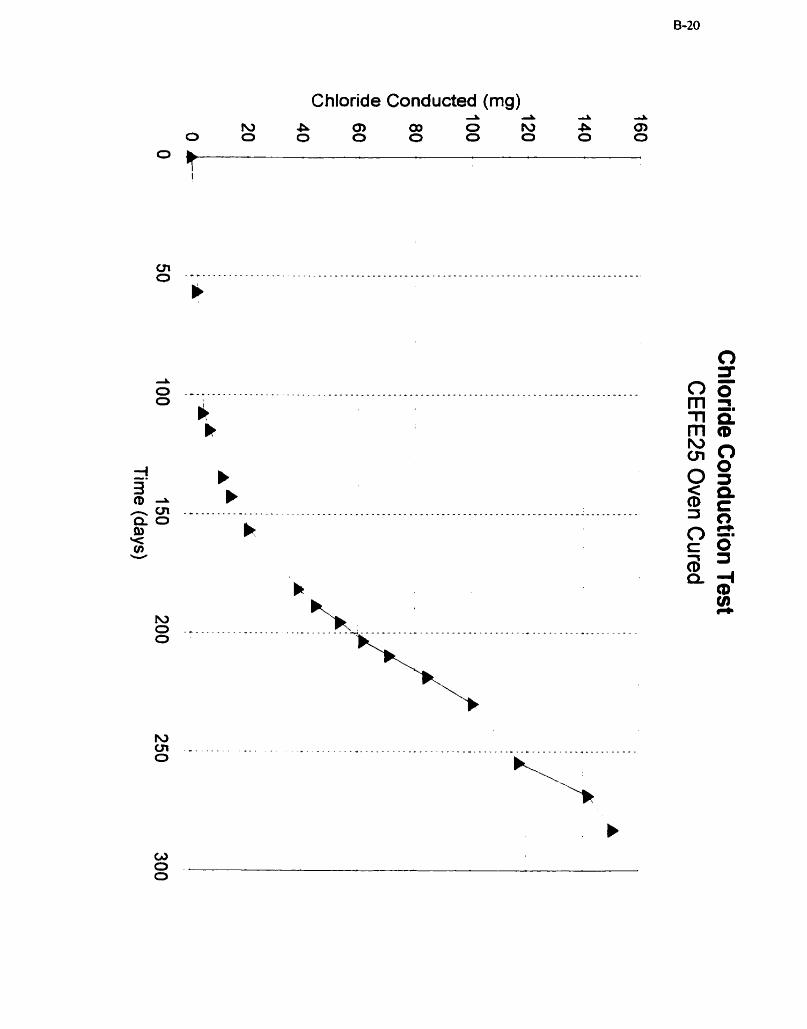
Chloride Conducted (mg)
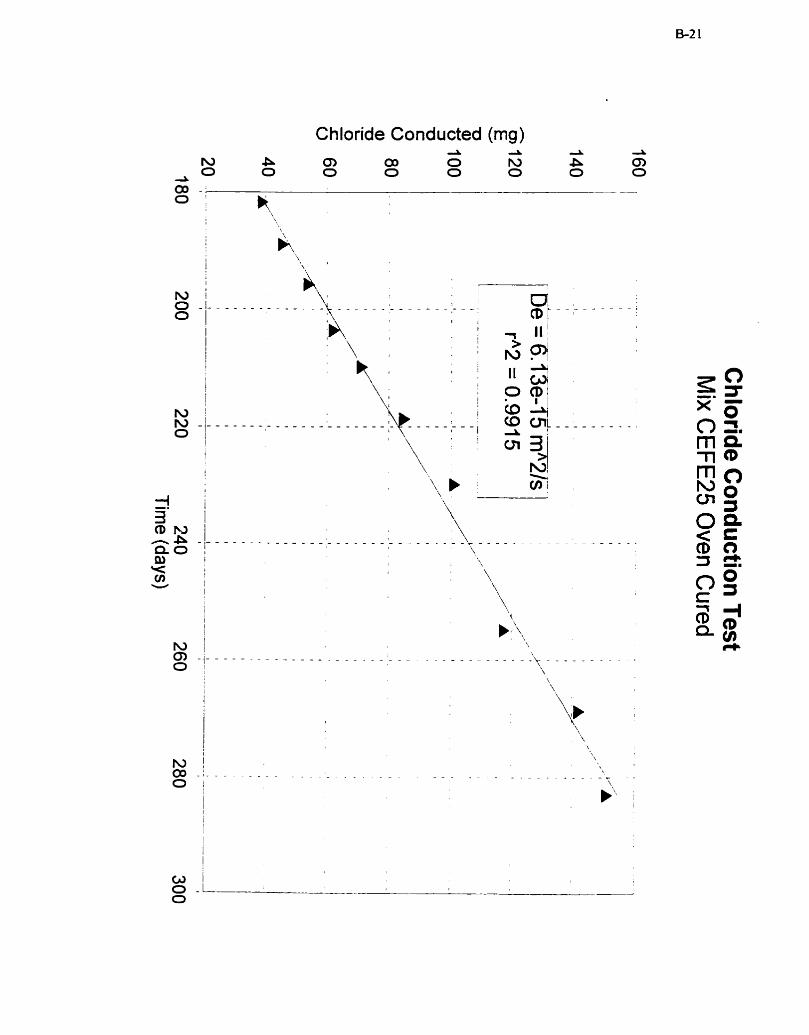
Chloride Conducted (mg)
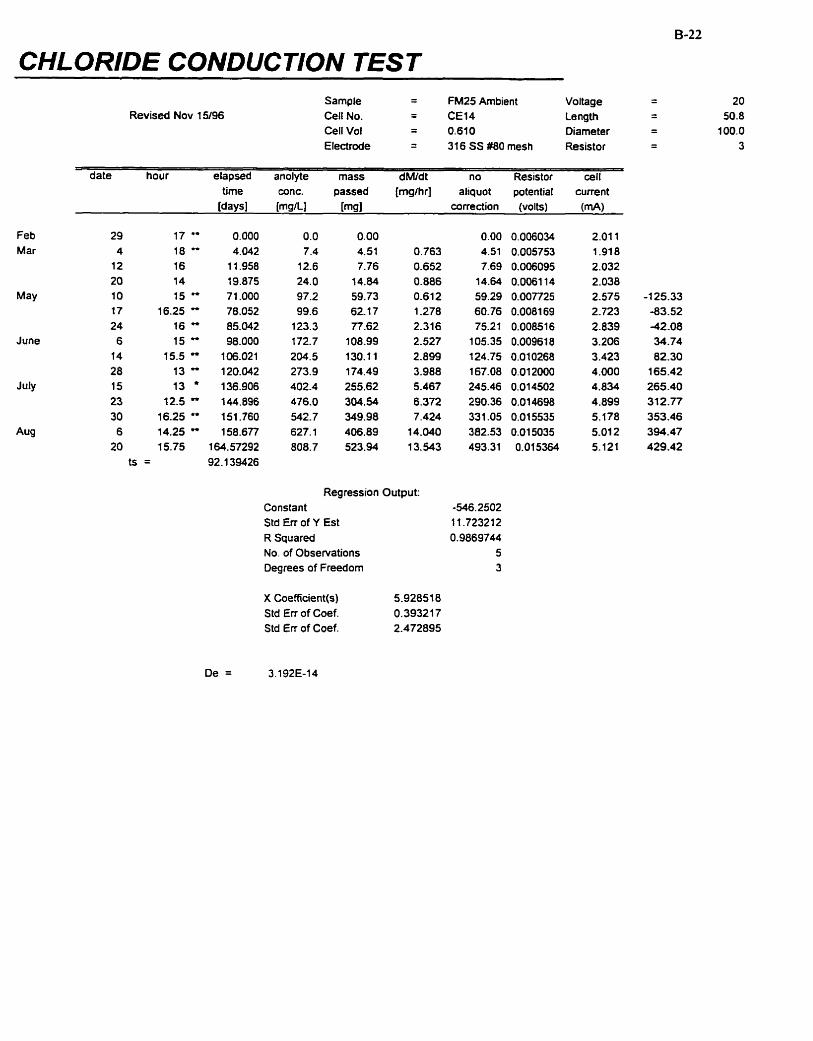
CHLORIDE CONDUCTION TEST
Revised Nov 15/96 Sample = FM25 Ambient Voltage Celf No. = CE14 Length Cell Vol = 0.610 Diarneter Electrode = 316SS#80rnesh Resistor
d I
date hour elapsed anolyte mass dM/d t no Resistor ce11 tirne wnc. passed [mglhr] aliquot potential current
[daysl [WU [mg] correction (volts) (mA)
Feb 29 17 O* 0.000 Mar 4 18 " 4.042
12 16 1 1.958 20 14 19.875
May 1 O 1 5 " 71.000 17 16.25 - 78.052 24 16 " 85.042
June 6 15 " 98.000 14 15.5 " 106.021 28 13 " 120.042
Jub 15 13 ' 136.906 23 12.5 " 144.896 30 16.25 " 151.760
Aug 6 14.25 " 158.677 20 15.75 164.57292
ts = 92.1 39426
Regression Output: Constant -546.2502 Std Err of Y Est 1 1.723212 R Squared 0.9869744 No. of Observations 5 Degrees of Freedom 3
X Coefficient(s) 5.928518 Std Err of Coef. 0.393217 Std Err of Coef. 2.472895
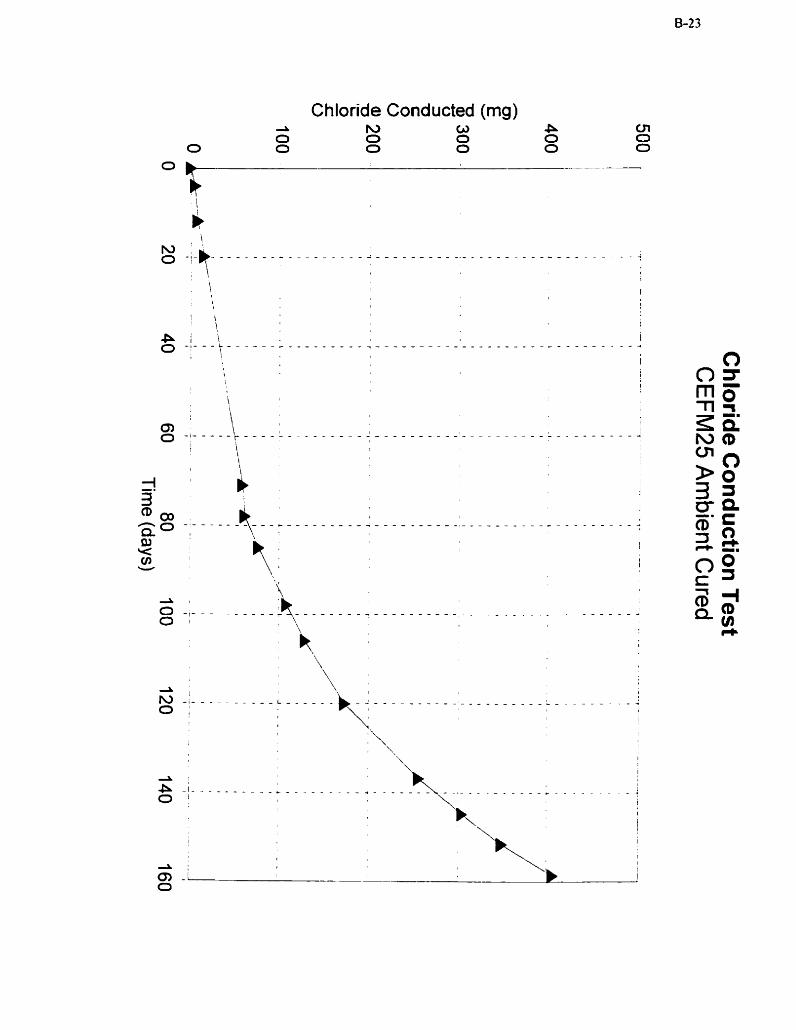
Chloride Conducted (mg)
m o T l -
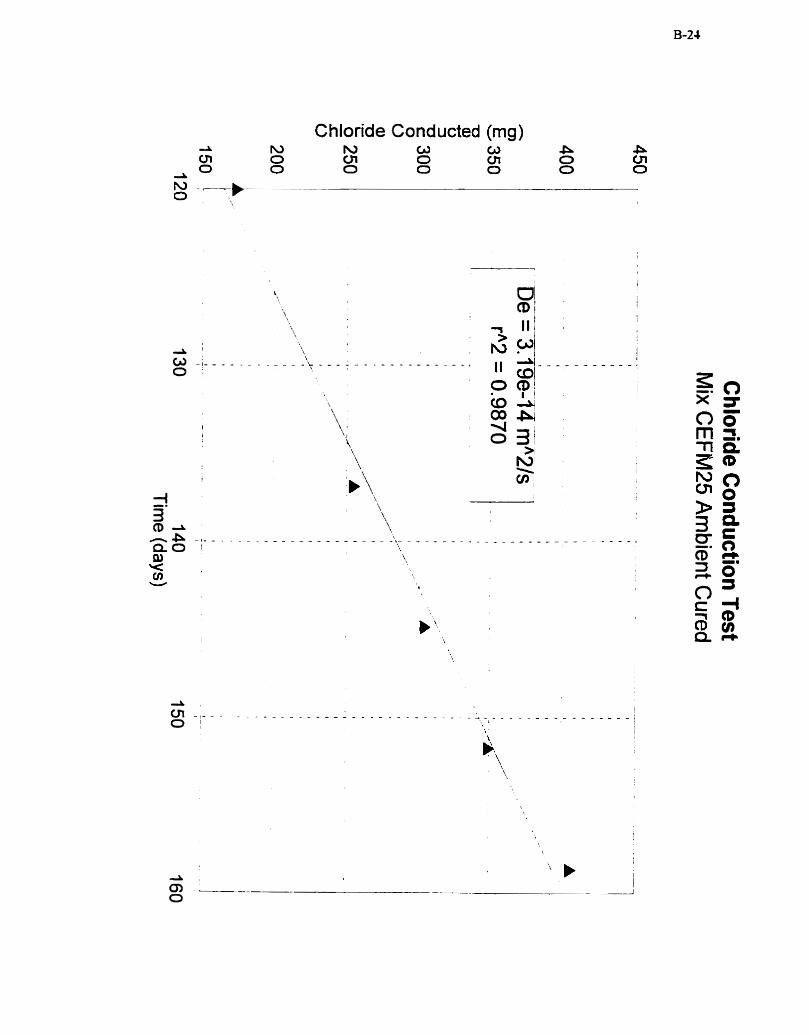
Chloride Conducted (mg)
t III .
: & O /
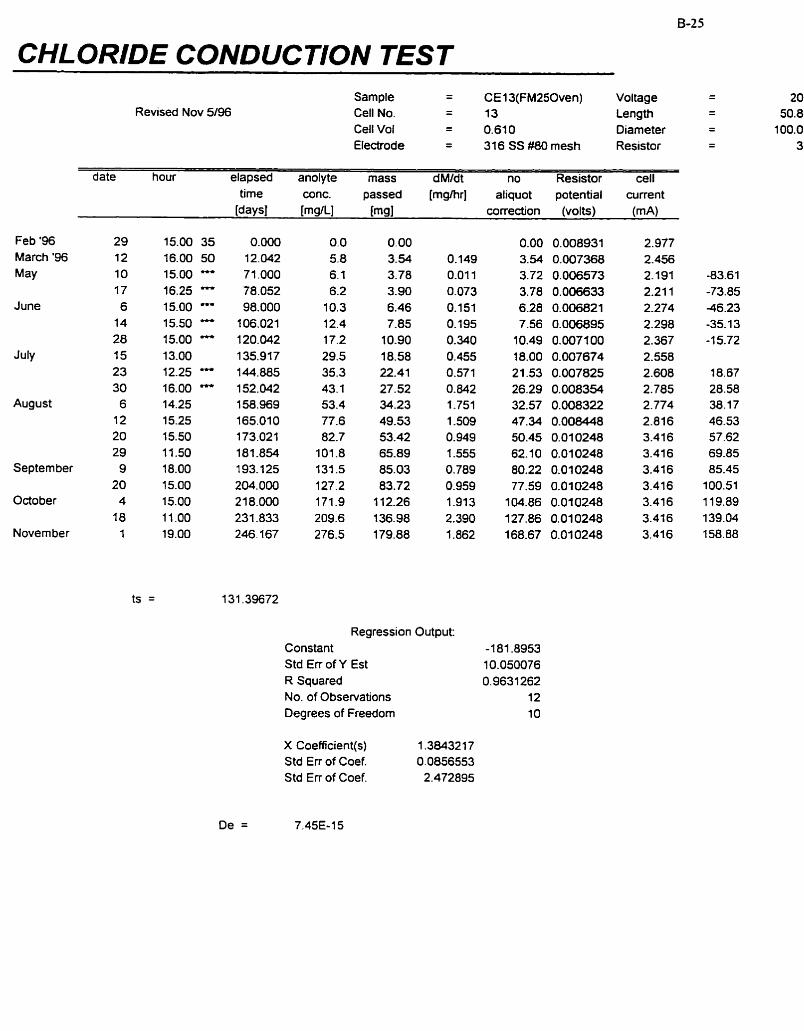
CHLORIDE CONDUCTION TEST
Feb '96 March '96
May
June
July
August
Septem ber
October
Novem ber
Revised Nov 5/96 Sample = CE1 3(FM250ven) Voltage Cell No. - - 13 Length
Cell Vol = 0.610 Diameter Electrode = 316 SS #80 mesh Resistor
date hour elapsed anolyte mass dM/dt no Resistor cell time conc. passed [mgihr] aliquot potential current
WYSI [mg/Ll ml correction (volts) (m A)
Regression Output: Constant Std E n of Y Est R Squared No. of Observations Oegrees of Freedom
X Coefficient(s) 1 -38432 1 7 Std Err of Coef. 0.0856553 Std Err of Coef. 2.472895
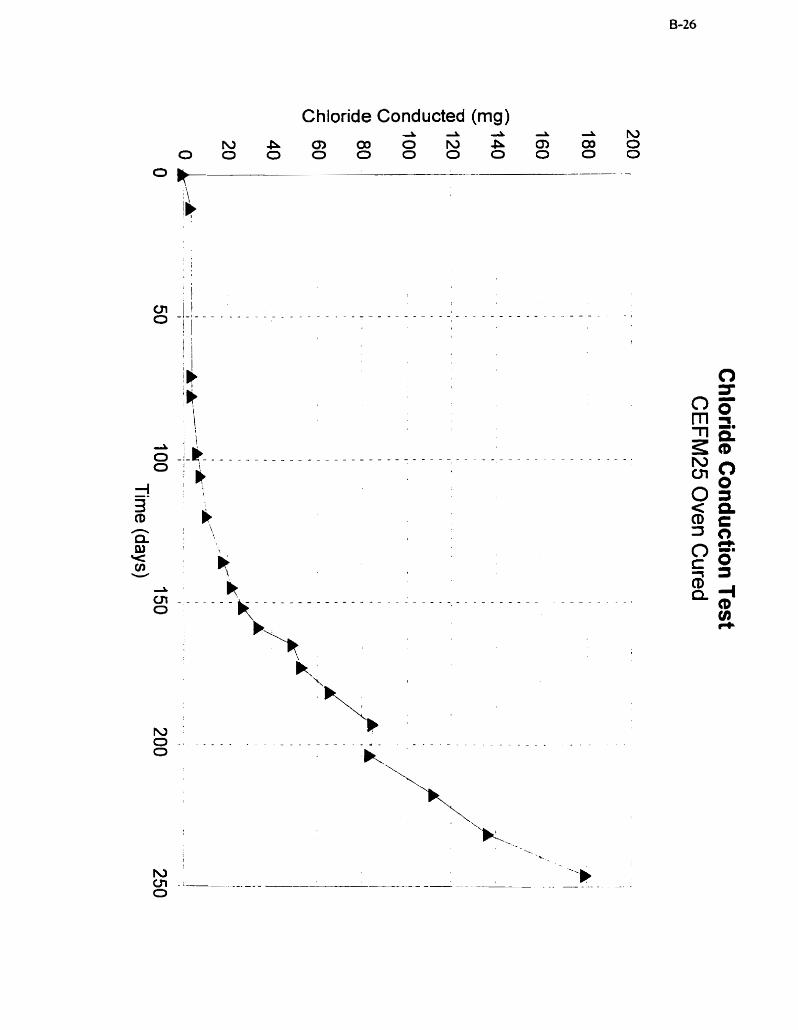
Chloride Conducted (mg)
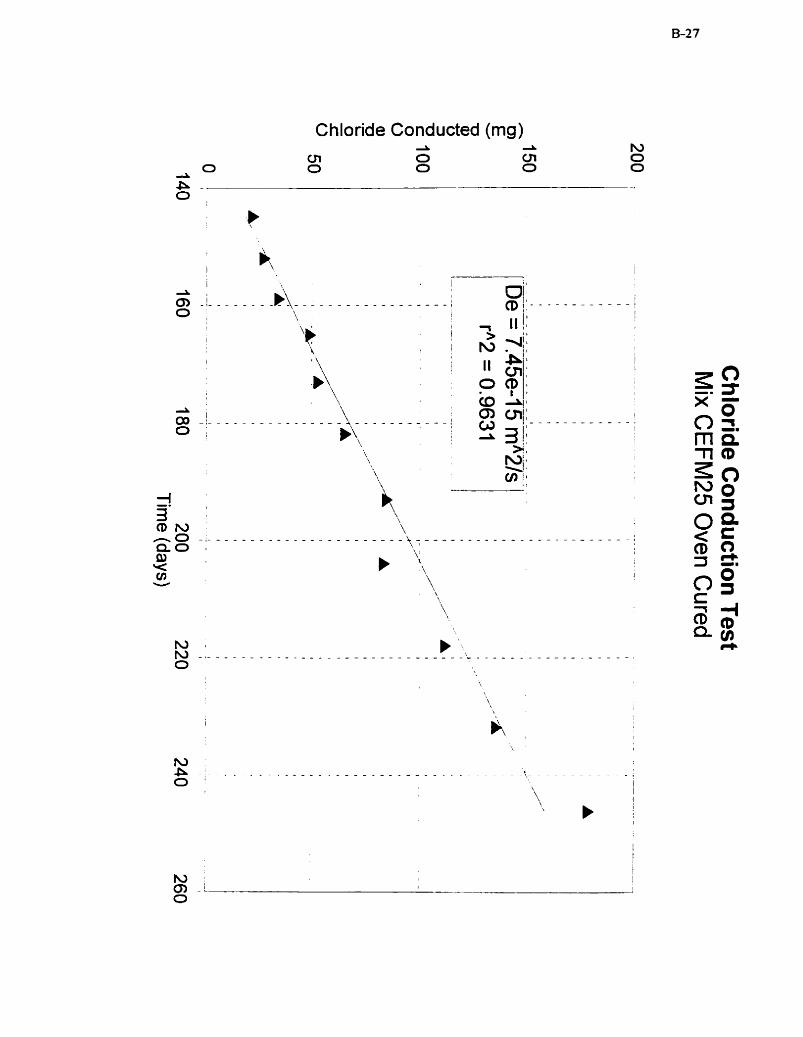
Chloride Conducted (mg)
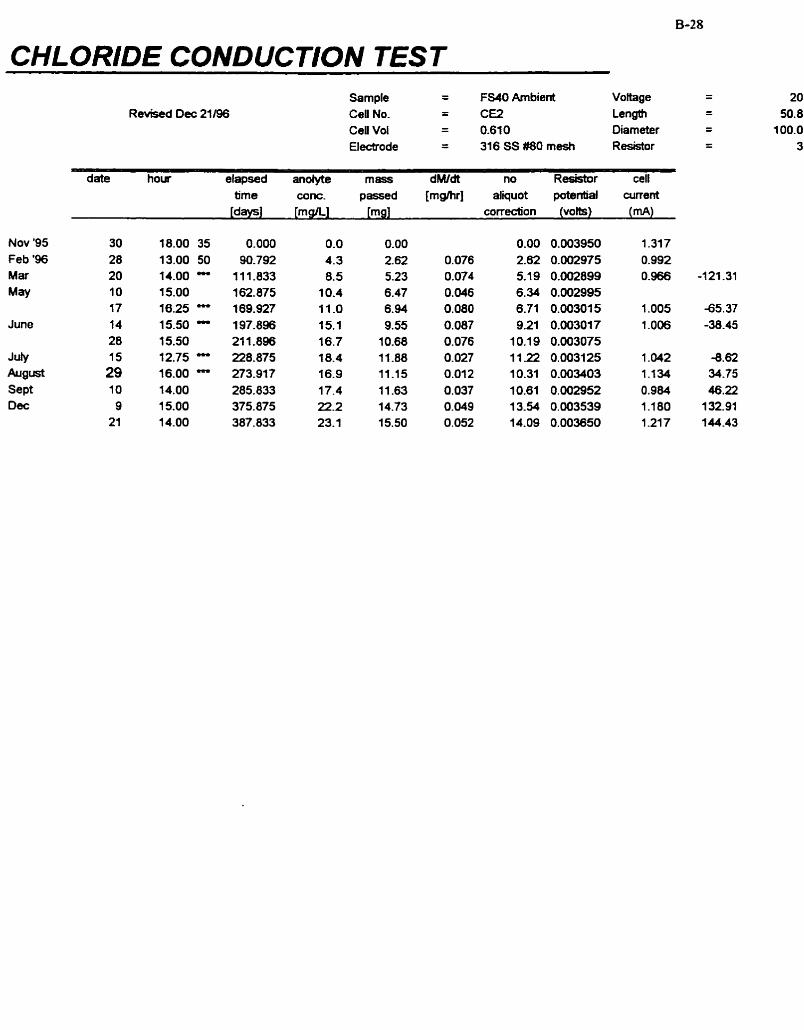
CHLORIDE CONDUCTION TEST
Nov '95 Feb '96 Mar
MW
June
Juty
Sept Dec
Revised Dec 21 196 Sample = FS40 Ambient Vottage - - CeU No. = CE2 Lengai - - Ce1 Val = 0.610 Diameter - - Uecbade = 316SS#ûUmesh Resistor - -
date hour elapsed anoîyte m a s dM/& no Resistor cet1 tirne conc. passed [mg/hr] aliquot potential current
[days] [mg&] [mg] canedion (volts) ( mA)
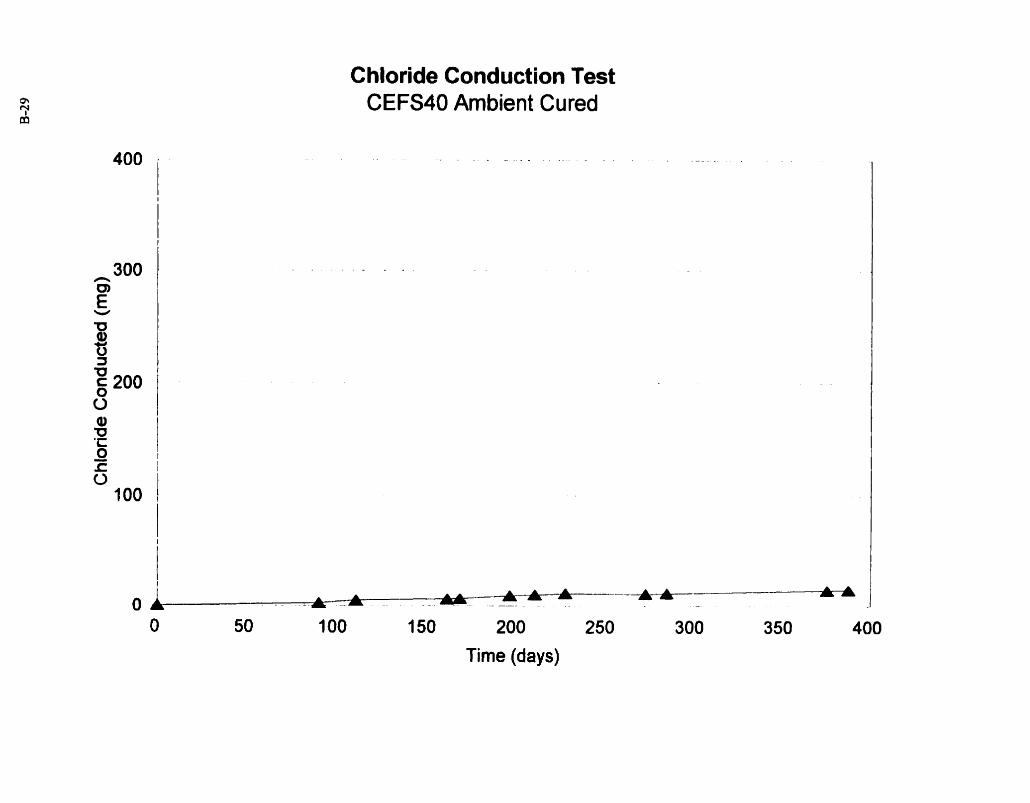
Chloride Conduction Test CEFS40 Ambient Cured
150 200
Tirne (days)
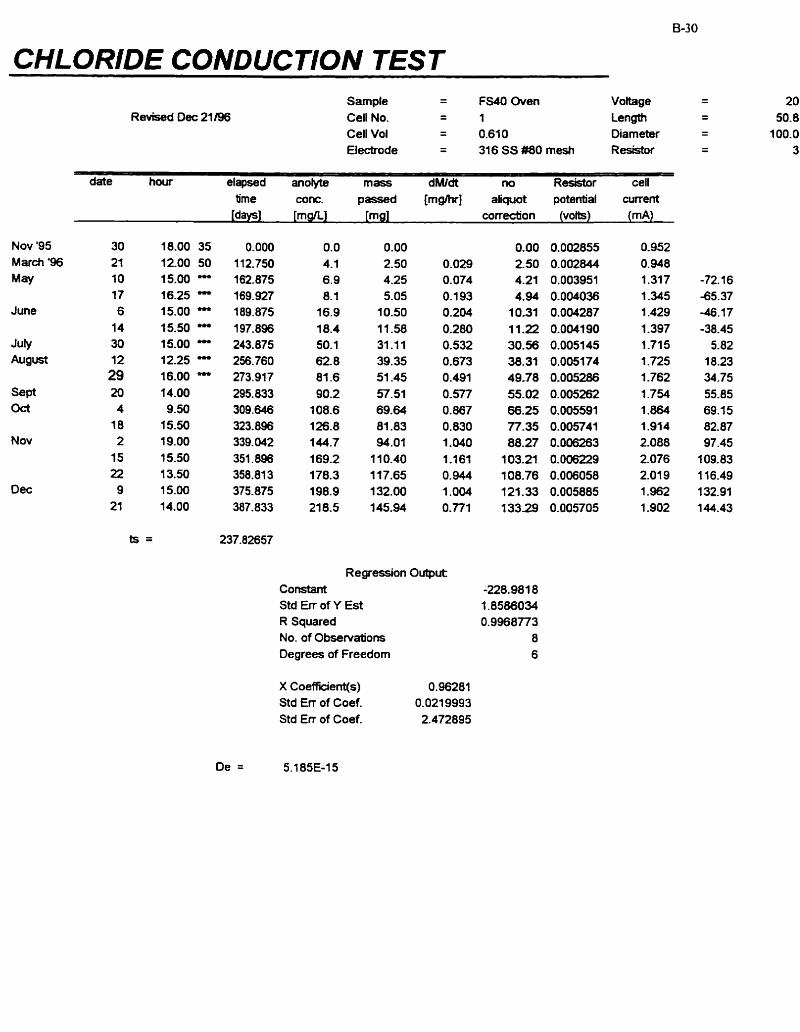
CHLORIDE CONDUCTION TEST Sample = FS40 Oven Voltage Ceîl No. - - 1 Length Cell Vol = 0.610 Diamebr Electrode - - 316 SS #8O mesh Reçistor
date hour elapsed anolyte rnass dWdt no Resistor cell Grne corn. passed (mghr] aliquot patentid cunent
[dayç] [mg/L] [mg] correction (voits) (mA)
Regression Ou!put: Cor#tant -228.981 8 Std Em of Y Est 1.8586034 R Squared 0.9968773 No. of Observations 8 Degrees of Freedom 6
X CoefWent(s) 0.96281 Std En of Coef. 0.021 9993 Std Err of Coef. 2.472895
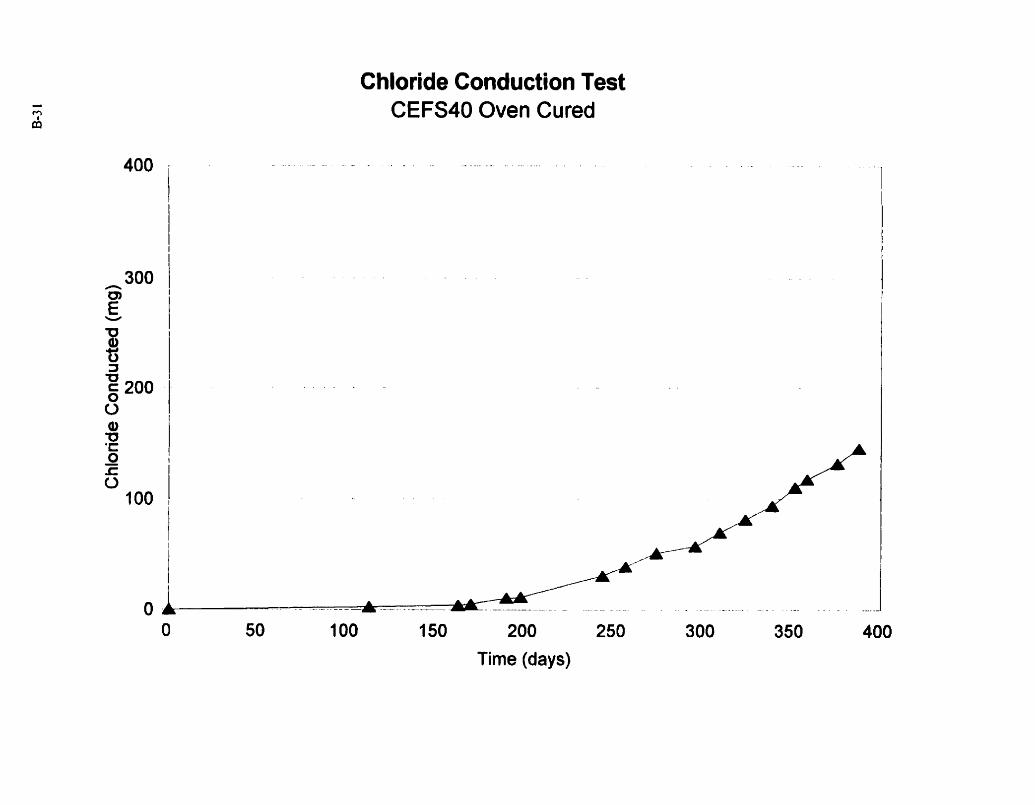
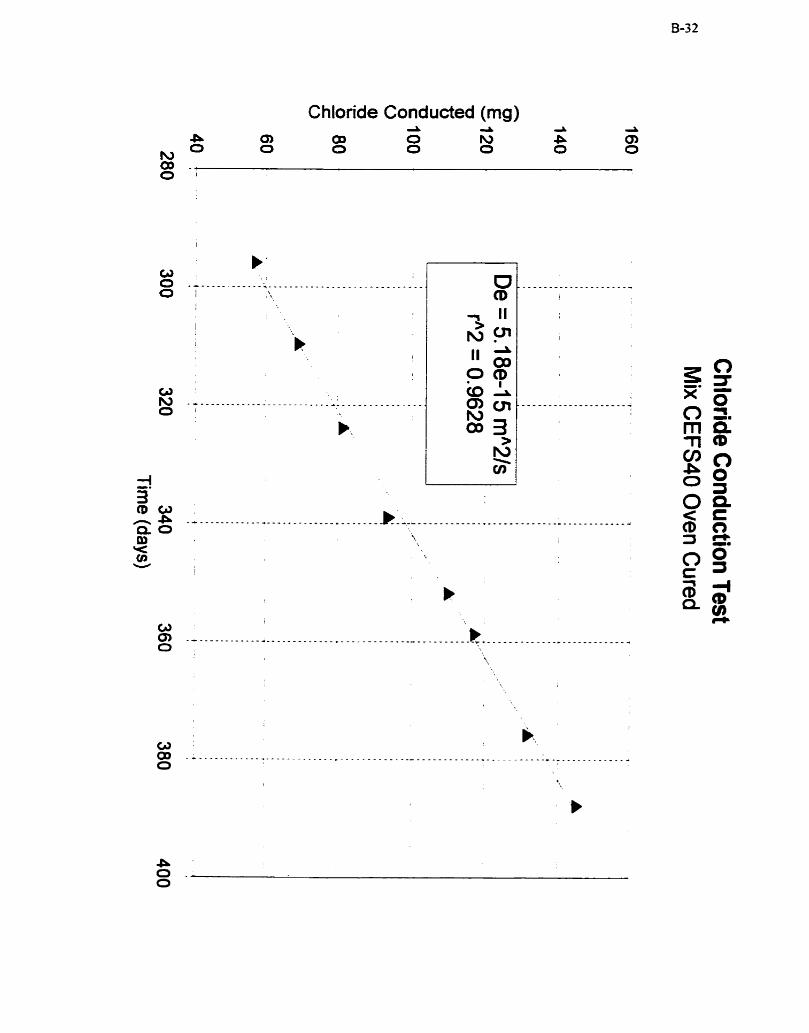
Chloride Conducted (mg)
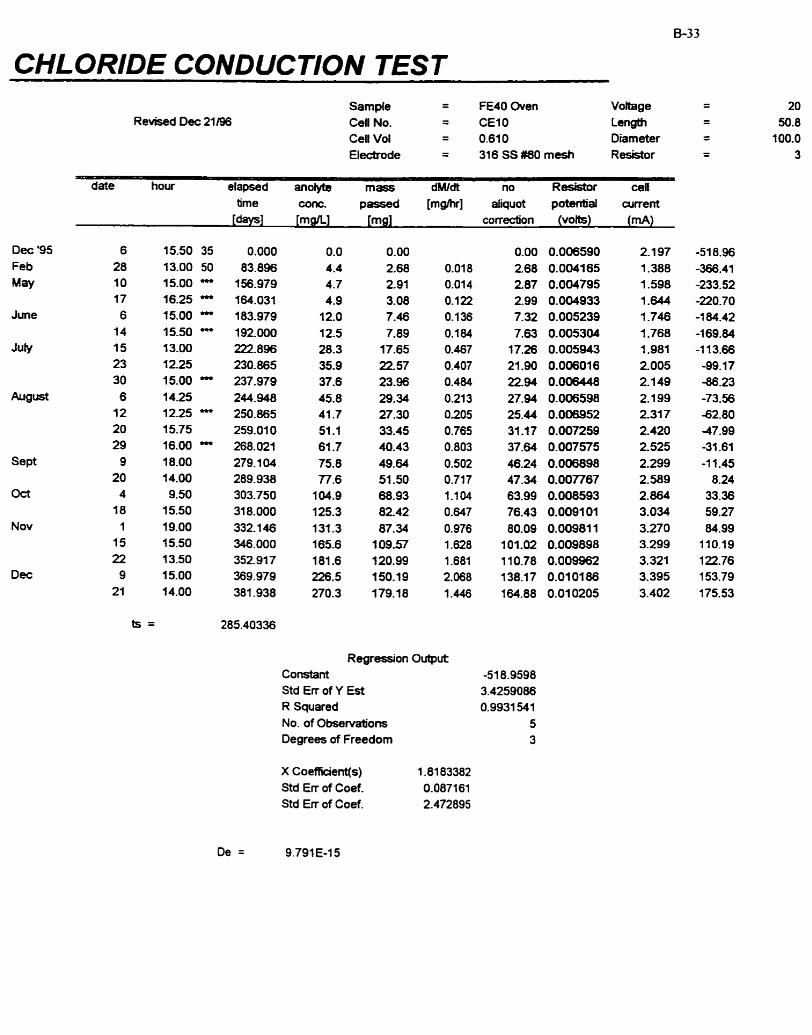
CHLORIDE CONDUCTION TEST
Des '95 Feb
M W
June
JuiV
wl-
sept
Oct
Nov
Dec
Revised Dec 21/96 Sampie = FE40 Oven Voîtage - - Cell No. = CE10 Lengîh - - Cell Vol = 0.610 Diameter - - Electrode = 316 SSWO mesh Resistor - -
date a elapsed anolyte mass dWdt no Resistor cell time conc. passed [rnghr] afiquot p*ntial cuvent
[days] [m g/L] [mg] correction (vok) ( rn A)
Regr-on Output Constant -51 8.9598 Std Err of Y Est 3.4259086 R Squared 0.9931 541 No. of Observations 5 Degrees of Freedom 3
X Coefkienqs) 1.81 83382 Std Err of Coef. 0.087 161 Std Err of Coef. 2.472895
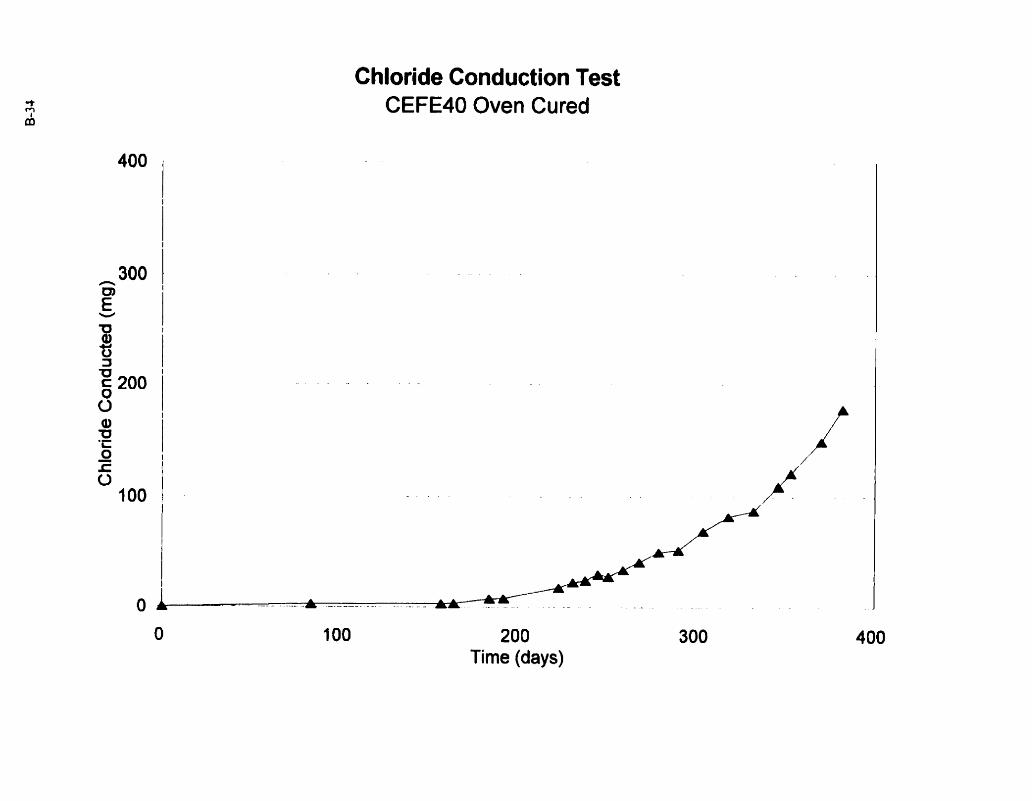
Chloride Conduction Test CEFE40 Oven Cured
200 Time (days)
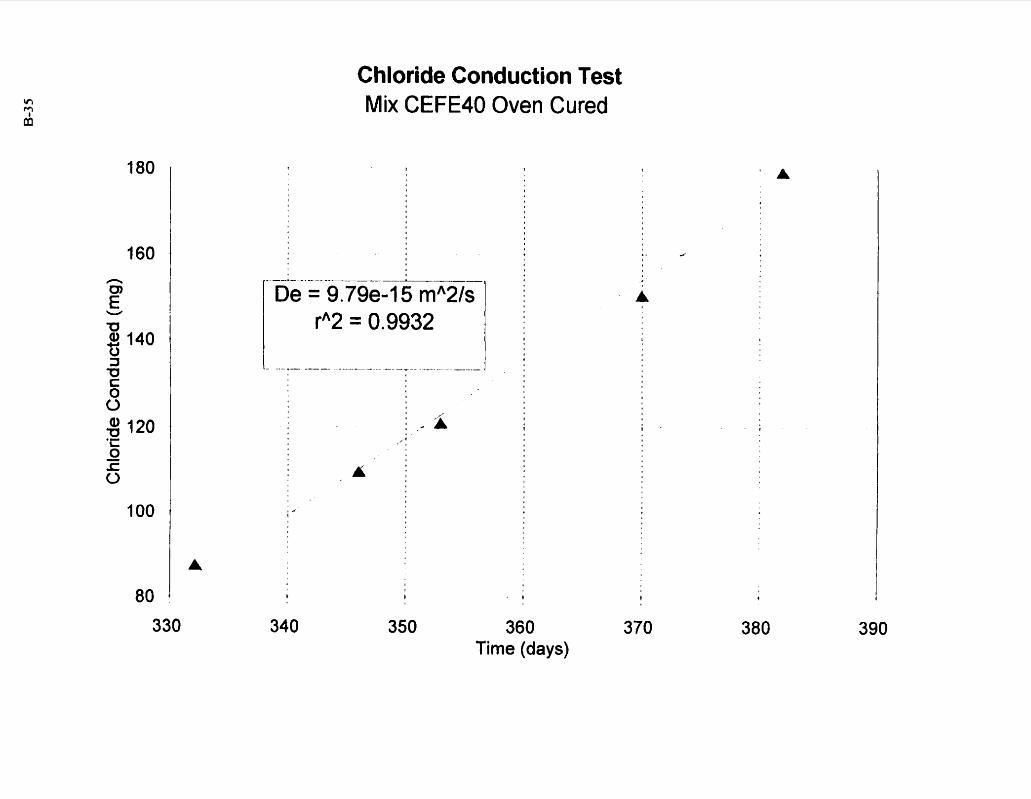
Chloride Conduction Test Mix CEFE40 Oven Cured
360 Time (days)
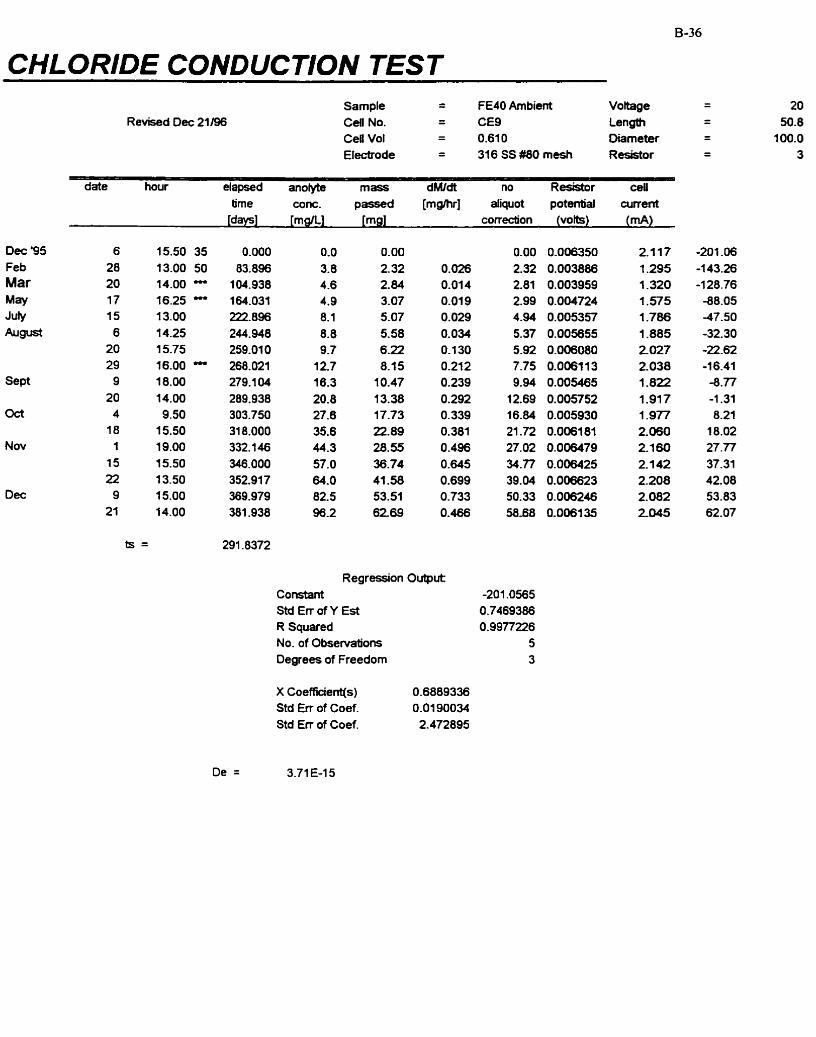
CHLORIDE CONDUCTlON TEST
Dec '95 Feb Mar M W Ju?,
Sept
Oct
Nov
Dec
Revised D e 21196 Sample - - FE40 Arnbient Voitage - - C d No. - - CE9 length - - Ceil Vol - - 0.61 0 Oiameter - - Electrode - - 316 SS #80 mesh Resistor - -
date hour elapsed anotyte mass dMl& no Resfftor cell tjme conc. passed [mghr] aliquot potential current
[days] [mgii] [mg] correction (vok) (mA)
Regression Output Constant -201 .O565 Std E r of Y Est 0.7469386 R Squared 0.9977226 No. of Obsewations 5 Degrees of Freedom 3
X Coefficient@) Std En of Coef. Std Err of Coef.
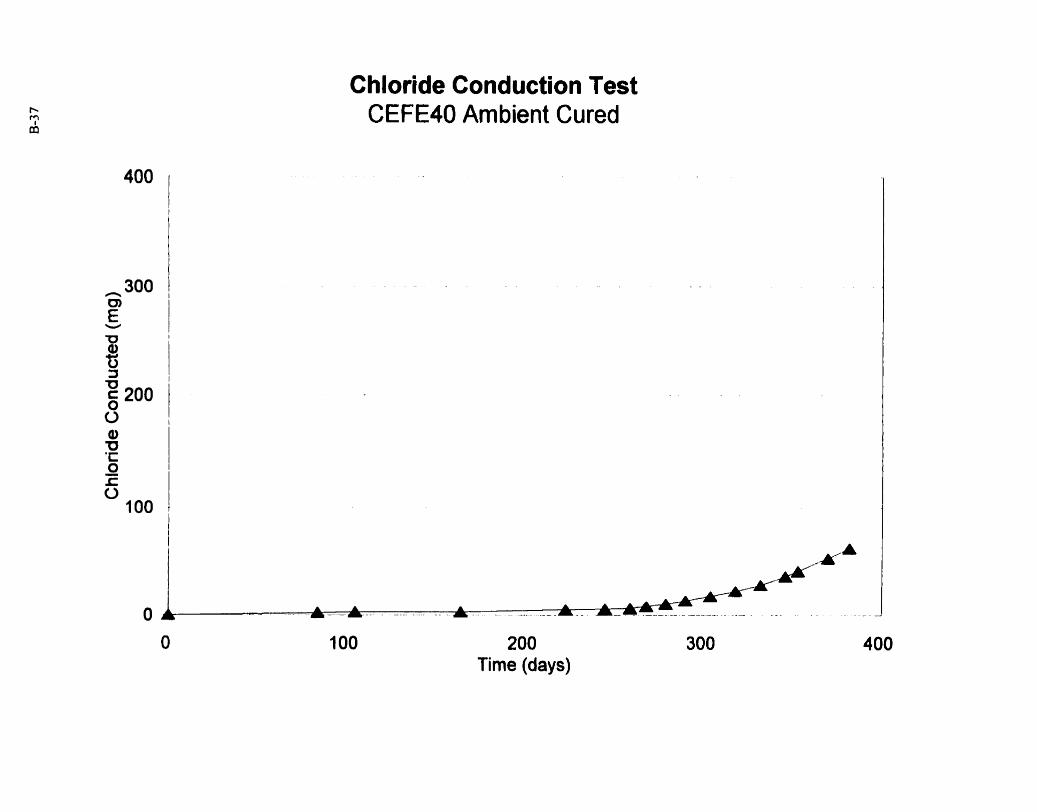
Chloride Conduction Test CEFE40 Ambient Cured
200 Time (days)

Chloride Conduction Test Mix CEFE40 Ambient Cured
Time (days)
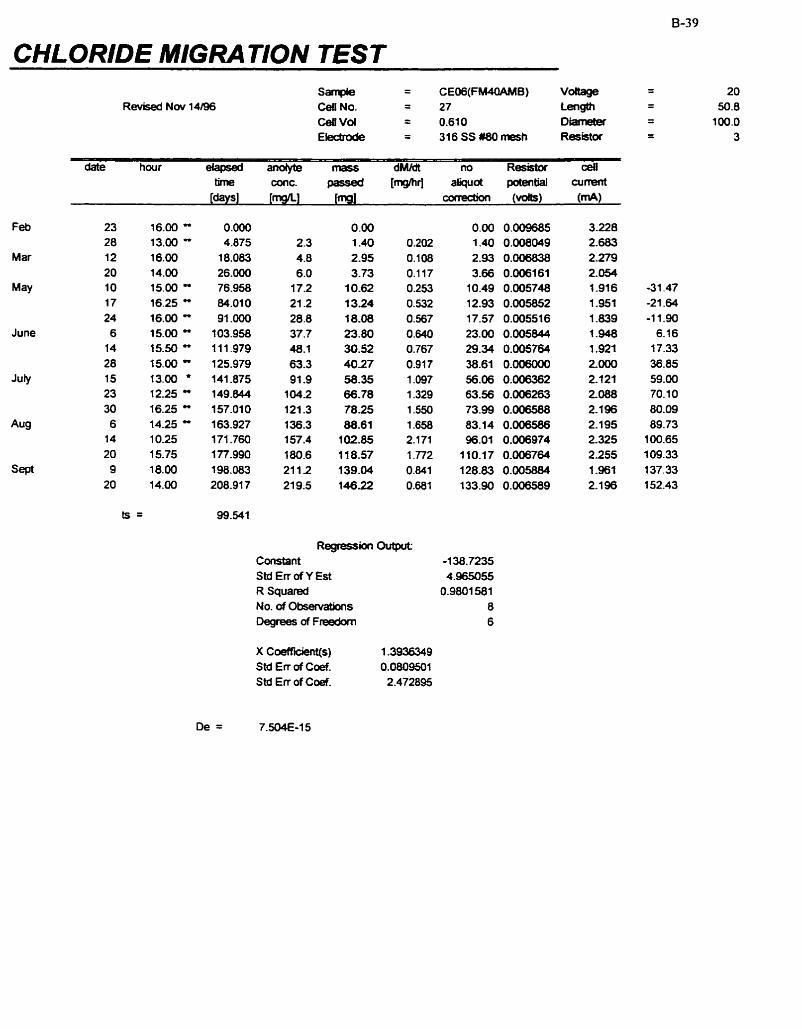
CHLORIDE MIGRA TION TEST S m = CEO6(FM4ûAMB) Vdtage
- - 20
C8ll No. = 27 Leri@ - 50.8 - Ce(l Vd = 0.610 Damter - 100.0 - Elecbode = 316SSüûûmesh Resistor - - 3
Feb 23 28
Mar 12 20
May 1 O 17 24
June 6 14 28
Juiy 15 23 30
Aug 6 14 20
sept 9 20
Regression Output: Constant -1 38.7235 Std Err of Y Est 4.965055 R Squared 0.9801 581 No. of Obsenratians 8 Degrees of Freedun 6
X Coefiicient(s) 1.3936349 SM Err of Coef. 0.0809501 Std EK of C m . 2.472895
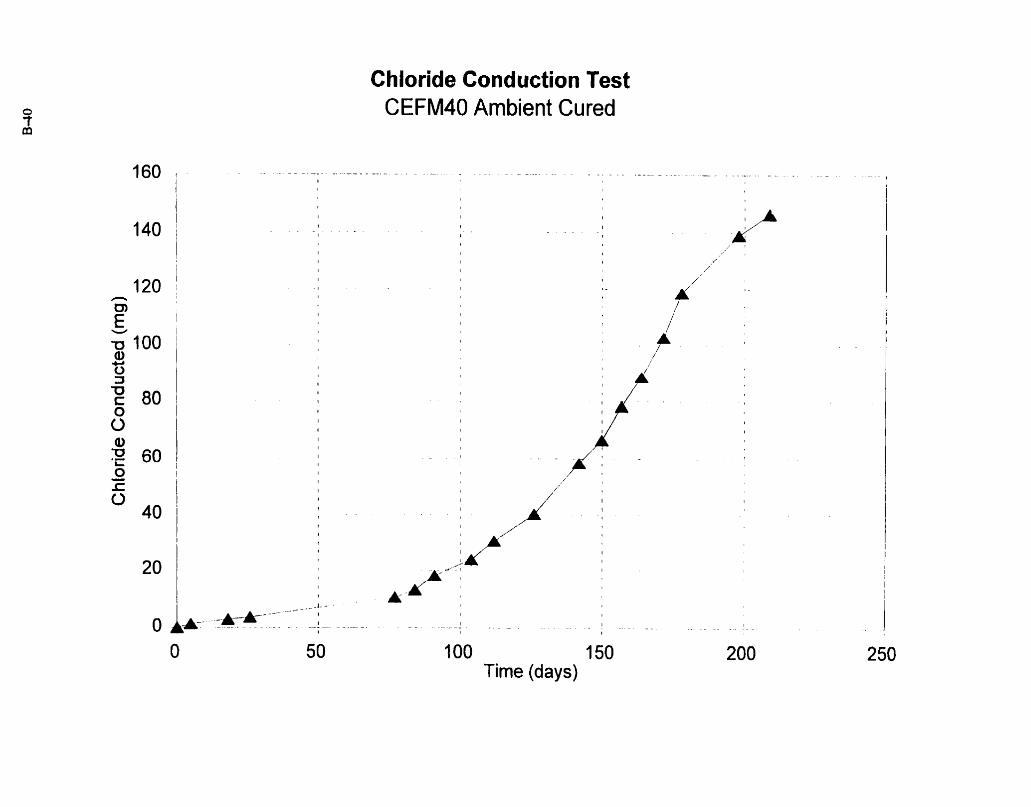
Chloride Conduction Test CEFM40 Ambient Cured
1 O0 150 Time (days)
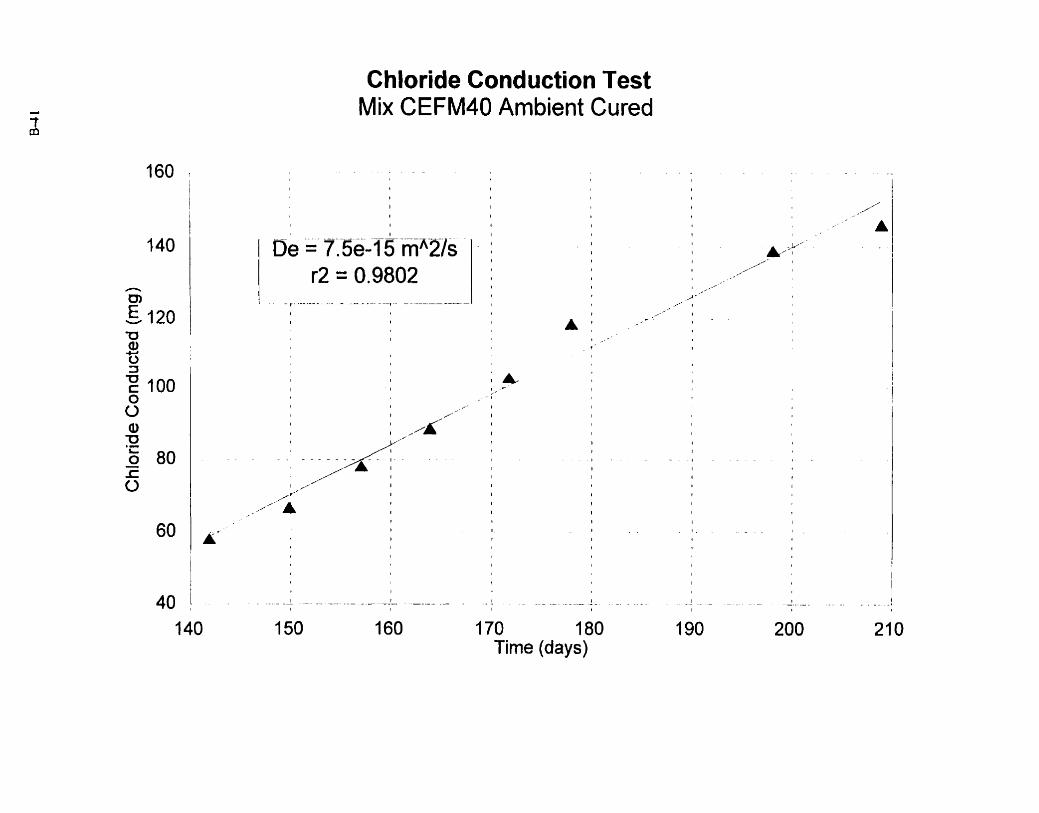
Chloride Conduction Test Mix CEFM40 Ambient Cured
Time (days)
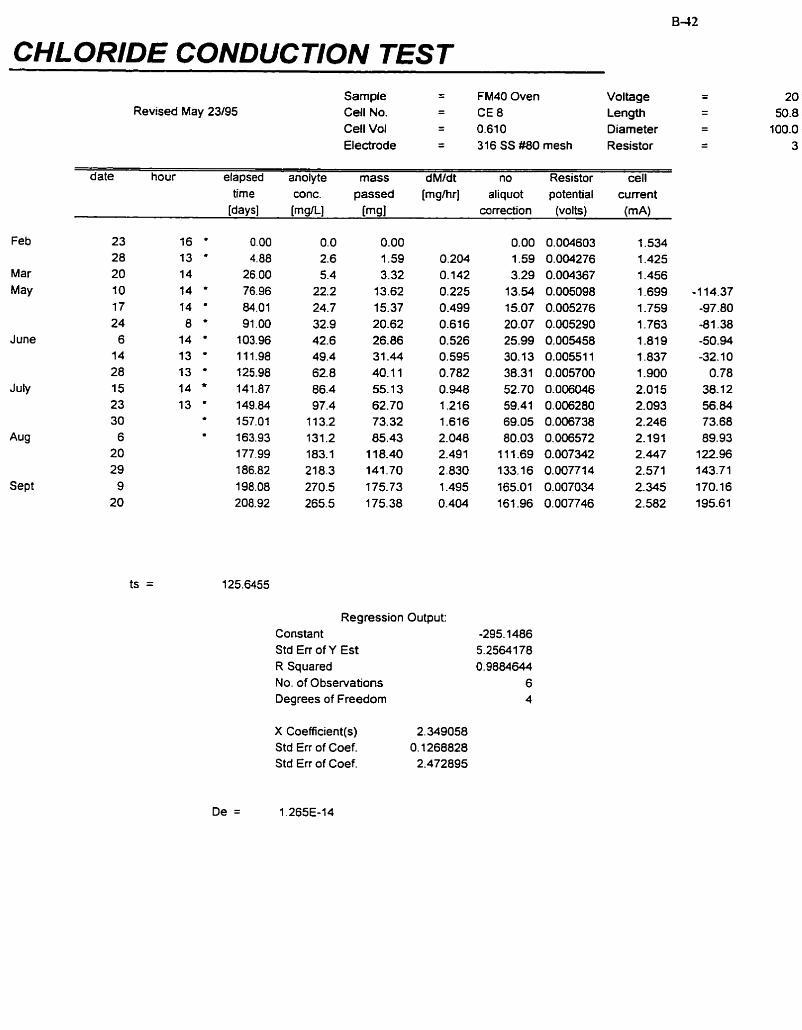
CHLORIDE CONDUCTION TEST
Revised May 23/95 Sarnple - - FM40 Oven Voltage - - Cell No. = C E 8 Length - - Cell Vol = 0.610 Diameter - - Electrode - - 316 SS #80 mesh Resistor - -
date hour elapsed anolyte mass dM/dt no Resistor ceIl tirne wnc. passed [mglhr] aliquot potential current
[da~sl mg/Ll [mg] correction (volts) (mA)
Feb 23 28
Mar 20
May 10 17 24
J une 6 14 28
July 15 23 30
Aug 6 20 29
Sept 9 20
Regression Output: Constant -295.1486 Std En of Y Est 5.25641 78 R Squared 0.9884644 No. of Observations 6 Degrees of Freedom 4
X Coefficient(s) 2.349058 Std Err of Coef. 0.1268828 Std Err of Coef. 2.472895
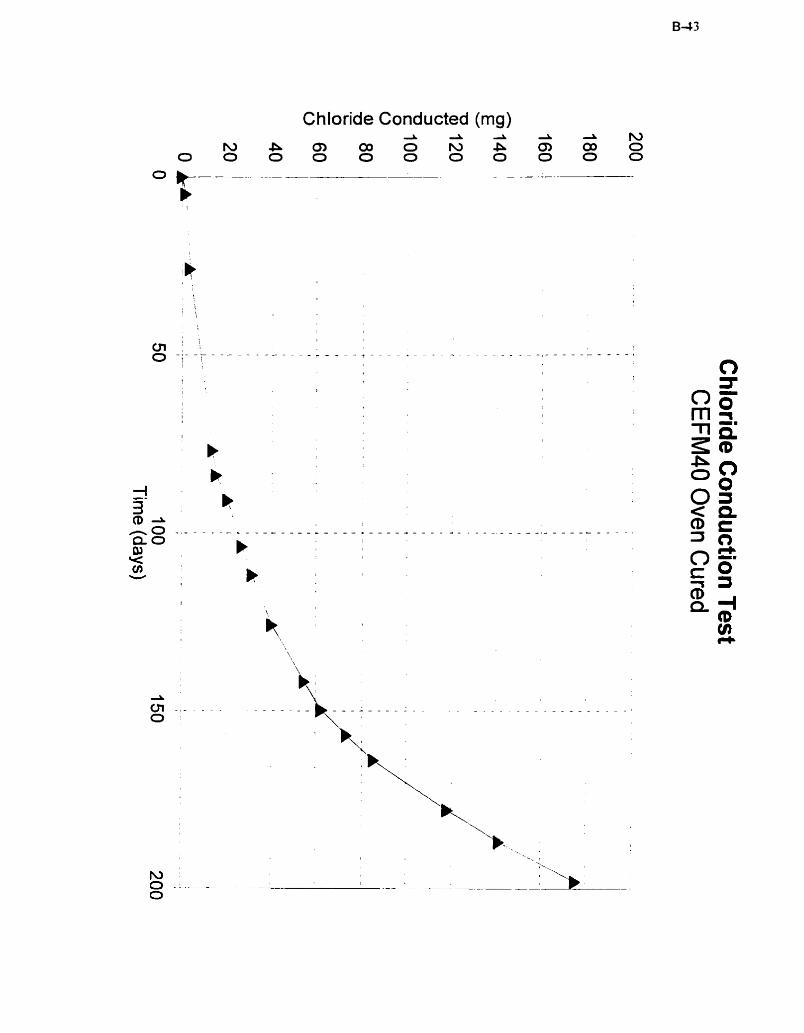
Chloride Conducted (mg)
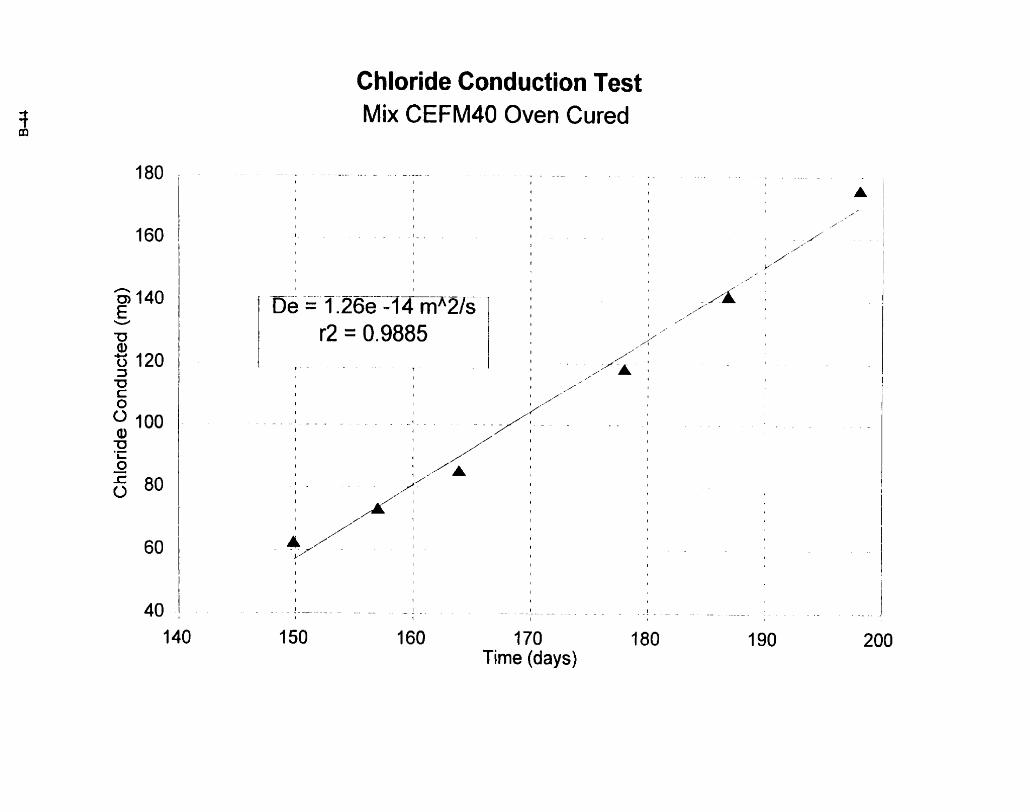
Chloride Conduction Test Mix CEFM40 Oven Cured
170 Time (days)
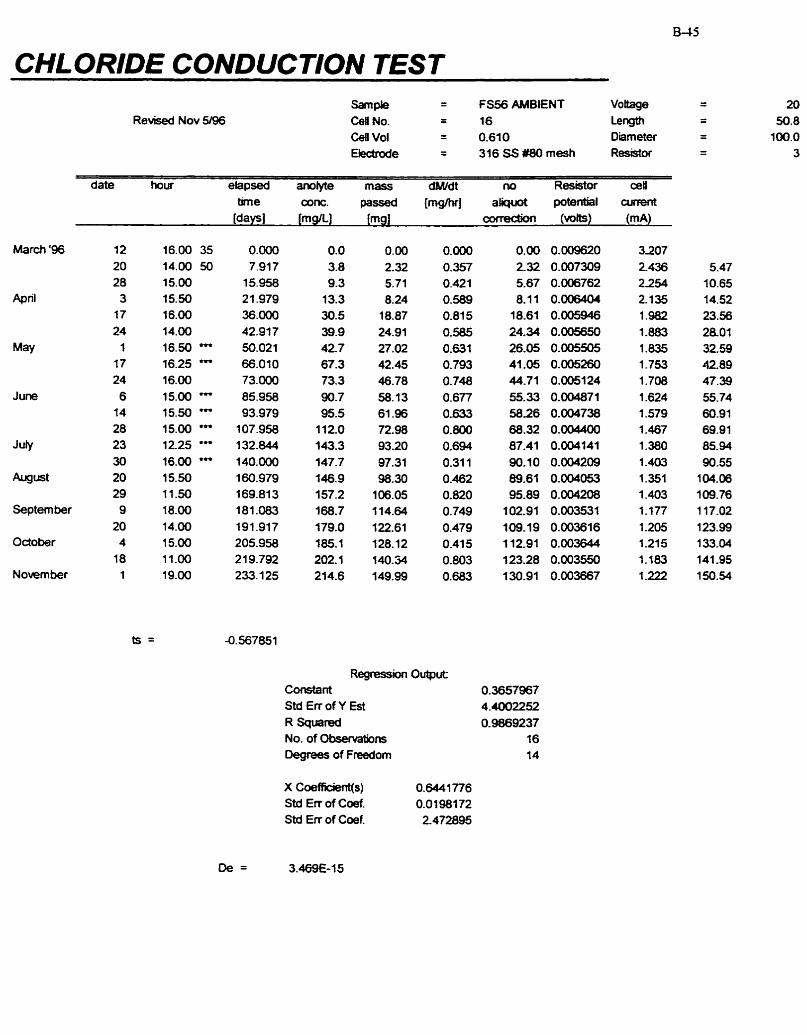
CHLORIDE CONDUCTION TEST
Mârch '96
April
May
June
Jub
Augrnt
Septem ber
Odober
N ovem ber
Revised Nov 5196 -me = FS56 AMBlENT VoWW Ceil No. - - 16 LeW*
Cen Vol = 0.610 Diameter Elecbode = 316SSWOmesh Resistot
Regression Output Constant 0.3657967 Std Err of Y Est 4.4002252 R Squared 0.9869237 No. of Observations 16 Degrees of Freedom 14
X Coefficient(s) 0.W1776 Std En of Cod. 0.01 981 72 SM Err of Coef. 2.472895
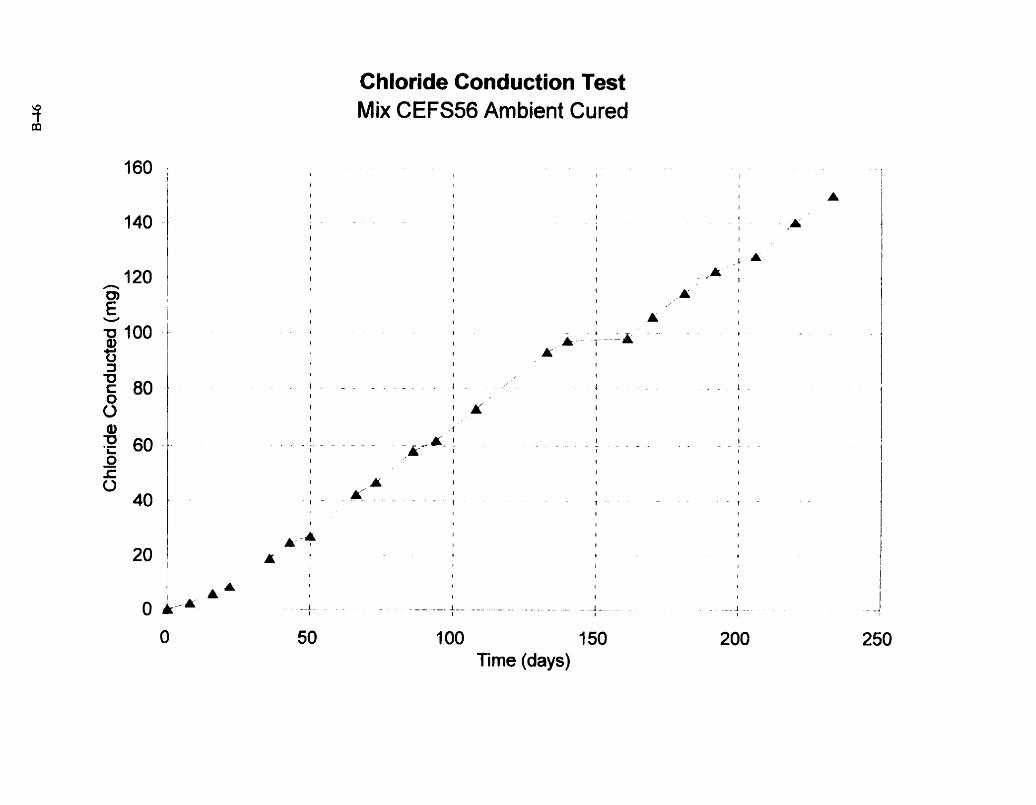
Chloride Conduction Test Mix CEFS56 Ambient Cured
150 Time (davs)
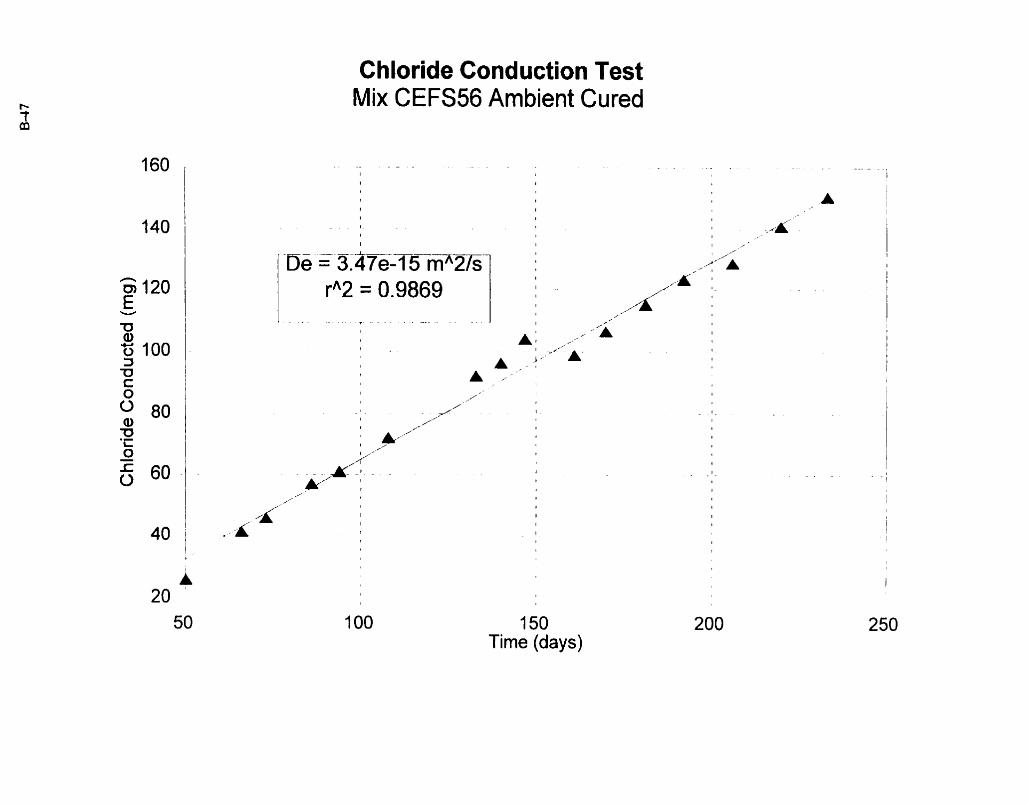
Chloride Conduction Test Mix CEFS56 Ambient Cured
150 Time (days)

CHLORIDE CONDUCTION TEST
Mar '96
Aqr May
August
Sept
Oct
Nov
Dec
Revised Dec 21/96 Sample - - FS56 Oven Voitage - - Cell No. - - CE1 5 Length - - Cell Vol - - 0.610 Diameter - - El& ode - - 316 SS #80 me& Resistor - -
daf* - -
hour elapsed anotyte m a s dM/& no Resisîor cell time COIIC. passed [mghr] aliquot potemal current
[days] [mgîi] [mg1 correction (volts) ( mA)
Regression Output Constant -9.41 8166 Std En of Y Est 0.3235479 R Squared 0.999072 No. of O b s e ~ o n s 11 Degrees of Freedom 9
X Coefient(s) 0.2432973 Std En of Coef. 0.002471 7 Std En of Coef. 2.472895
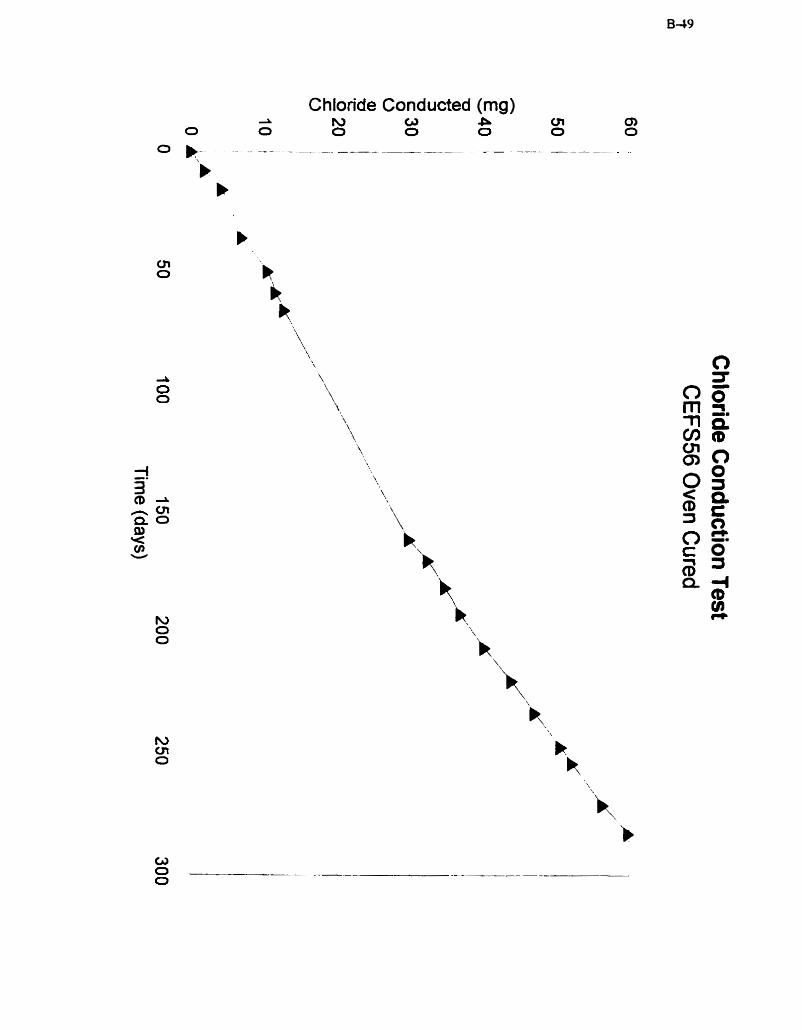
Conducted (mg)
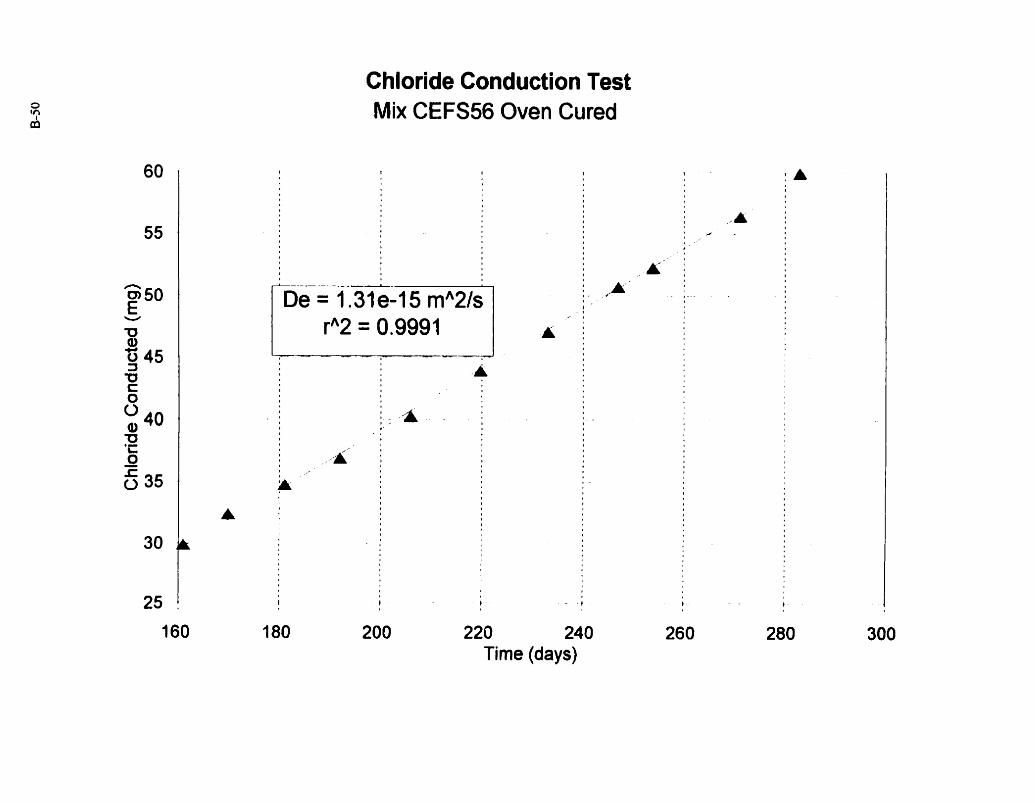
Chloride Conduction Test Mix CEFS56 Oven Cured
Time (davs)
I M A W LVALUATION TEST TARGET (QA-3)
APPLIED - 1 I W G E . lnc 1653 East Main Street - -. , Rochester. NY 14609 USA -- --= Phone: 71 6148243300 -- -- - - Fa: 71 61288-5989
O 1993. Wied Image. lnc.. Ali flqhts R w r v e d