Embed Size (px)
Citation preview

Effects of training on portion size estimation.
Item Type text; Dissertation-Reproduction (electronic)
Authors Weber, Judith Lynne.
Publisher The University of Arizona.
Rights Copyright © is held by the author. Digital access to this materialis made possible by the University Libraries, University of Arizona.Further transmission, reproduction or presentation (such aspublic display or performance) of protected items is prohibitedexcept with permission of the author.
Download date 21/08/2018 12:52:56
Link to Item http://hdl.handle.net/10150/186506
INFORMATION TO USERS
This manuscript has been reproduced from the microfilm master. UMI
films the text directly from the original or copy submitted. Thus, some
thesis and dissertation copies are in typewriter face, while others may
be from any type of computer printer.
The quality of this reproduction is dependent upon the quality of the copy submitted. Broken or indistinct print, colored or poor quality illustrations and photographs, print bleed through, substandard margins,
and improper alignment can adversely affect reproduction.
In the unlikely event that the author did not send UMI a complete
manuscript and there are missing pages, these will be noted. Also, if unauthorized copyright material had to be removed, a note will indicate
the deJetion.
Oversize materials (e.g., maps, drawings, charts) are reproduced by
sectioning the original, beginning at the upper left-hand corner and
continuing from left to right in equal sections with small overlaps. Each
original is also photographed in one exposure and is included in
reduced form at the back of the book.
Photographs included in the original manuscript have been reproduced xerographically in this copy. Higher quality 6" x 9" black and white
photographic prints are available for any photographs or illustrations
appearing in this copy for an additional charge. Contact UMI directly
to order.
U·M·I University Microfilms International
A Bell & Howell Information Company 300 North Zeeb Road. Ann Arbor. MI 48106-1346 USA
313/761-4700 800/521-0600


Order Number 9421734
Effects of training on portion size estimation
Weber, Judith Lynne, Ph.D.
The University of Arizona, 1993
Copyright ®1993 by Weber, Judith Lynne. All rights reserved.
V·M·I 300 N. Zccb Rd. Ann Arbor. MI 48106


EFFECTS OF TRAINING ON PORTION SIZE ESTIMATION
by
Judith Lynne Weber
Copyright ID Judith Lynne Weber 1993
A Dissertation Submitted to the Faculty of the
COMMITTEE ON NUTRITIONAL SCIENCES
In Partial Fulfillment of the Requirements For the Degree of
DOCTOR OF PHILOSOPHY
In the Graduate College
THE UNIVERSITY OF ARIZONA
1993
THE UNIVERSITY OF ARIZONA GRADUATE COLLEGE
As members of the Final Examination Committee, we certify that we have
2
read the dissertation prepared by Judith Lynne Weber ----------~---------------------------
entitled Effects of Training on Portion Size Estimation --------------------------------------------------------------
and recommend that it be accepted as fulfilling the dissertation
requirement for the Degree of Doctor of Philosophy
Date
Date
Date
/t1/o/rJ Date'
Final approval and acceptance of this dissertation is contingent upon the candidate's submission of the final copy of the dissertation to the Graduate College.
I hereby certify that I have read this dissertation prepared under my direction and recommend that it be accepted as fulfilling the dissertation requirement.
//-:71-9.3 Date
3
STATEMENT BY AUTHOR
This dissertation has been submitted in partial fulfillment of requirements for an advanced degree at The University of Arizona and is deposited in the University Library to be made available to borrowers under rules of the Library.
Brief quotations from this dissertation are allowable without special permission, provided that accurate acknowledgment of source is made. Requests for permission for extended quotation from or reproduction of this manuscript in whole or in part may be granted by the copyright holder.
Signed: ~0 x: WJ-.J
ACKNOWLEDGEMENTS
I would like to acknowledge the following people for whose support I am grateful:
Dr. Ann Tinsley, for serving as my advisor, instructor, employer, mentor, and friend for the past six years.
Dr. Linda Houtkooper, for providing guidance in, and serving as a role model for, the research process, and for her friendship.
Dr. Tim Lohman, for coming to the rescue by joining my committee late in the process, and for his expert advice, especially regarding statistical procedures.
Dr. Sarah Dinham and Dr. Darryl Sabers, for their guidance in research design and statistical procedures.
Leah Brown, for her expert work on the graphics for this document, and for her cheerfulness in the face of my hysteria!
Dr. Pat Jones and Kathy Greaves, for their invaluable assistance with the SPSS programming.
Daisy Gualberto, Beth Stewart, Laura Aldag, Kathy Greaves, and Lynne Smiley (in order of their appearances in my graduate schoollife!), for their encouragement and camaraderie on a day to day basis through the ups and downs of graduate school.
4

DEDICATION
With love and gratitude for their patience, love, and support throughout my graduate
program, I dedicate this manuscript to my husband, Gary Thompson, and to my
children, Kiva Reinbold and Connor Thompson.
5
I would also like to dedicate this work to the memory of my dad, Donald Vincent
Weber, for his supreme optimism, and for believing and teaching his children that the
sky is the limit. It's not the Olympics, Dad, but it sure feels like it!

6
TABLE OF CONTENTS
LiST OF ILLUSTRATIONS ................................ 9
LIST OF TABLES ......................•......•......... 10
ABSTR.ACT ............... It •••••••••••••••••••••••••• 12
CHAPTER 1: INTRODUCTION ............................. 14
Explanation of the Problem and its Context .................... 14
Methods for Collecting Self-Reported Dietary Intake Data ........ 14
Definition and Role of Portion Size Estimation in the Reporting of Dietary Intake Data ..,......................... 16
Significance . . . . . . . . . . . . . . . . . . . . . . . . . . . . . . . . . . . . . . . . 18
Specific Aims . . . . . . . . . . . . . . . . . . . . . . . . . . . . . . . . . . . . . . . 19
Limitations . . . . . . . . . . . . . . . . . . . . . . . . ... . lit • • • • • • • • • • • • .22
Definitions ........................................ 23
Explanation of the Dissertation Format ....................... 24
CHAPTER 2: LITERATURE REVIEW ........................ 25
Sources of Error in Dietary Intake Assessment Methods . . . . . . . . . . . . . 25
Portion Size Estimation Studies ..........;................. 29
Influence of the Previous Studies on the Design of the Studies Presented in this Document ....................... 39
Statistical Methods . . . . . . . . . . . . . . . . . . . . . . . . . . . . . . . . . . . .43
7
TABLE OF CONTENTS - Continued
CHA~ 3: PllnT STUDY ............................... 46
Subjects .......................................... 46
Methods .......................................... 46
Portion Size Estimation Training . . . . . . . . . . . . . . . . . . . . . . . . 46
Pre- and Posttests . . . . . . . . . . . . . . . . . . . . . . . . . . . . . . . . . 51
Experimental Design and Statistical Procedures ................. . 55
Results and Discussion ................................ . 56
CHAP'I'ER 4: MAIN' STUDY ............................... 62
Subjects ..........................................62
Methods .......................................... 62
Experimental Design ............................... 62
Portion Size Estimation Training . . . . . . . . . . . . . . . . . . . . . . . . 63
Pre- and Posttests . . . . . . . . . . . . . . . . . . . . . . . . . . . . . . . . . 64
Statistical Procedures .................................. 66
Results and Discussion ................................. 67
CHAPI'ER 5: COMPARISON STUDY ......................... 82
Purposes of the Second Posttest . . . . . . . . . . . . . . . . . . . . . . . . . . . . 82
Methods ...................... .. 83
Posttests . . . . . . . . . . . . . . . . . . . . . . . . . . . . . . . . . . . . . . . 83
Experimental Design and Statistical Procedures . . . . . . . . . . . . . . . 86
Results and Discussion ................................ . 88

8
TABLE OF CONTENTS - Continued
CHAPTER 6: DISCUSSION O}"' mE THREE STUDIFS ............ 103
CHAPTER 7: SUMMARY AND CONCLUSIONS ................. 109
Summary ......................................... 109
Conclusions ..................................... .. 115
Implications for Future Research .......................... 119
APPENDIX A: STATION #1: MEASUREMENT ACTIVITY FOR PORTION SIZE ESTIMATION TRAINING ........... 121
APPENDIX B: STATION #2: FOOD MODELS ACTIVITY FOR PORTION SIZE ESTIMATION TRAINING ........... 122
APPENDIX C: STATION #3: DIMENSIONS ACTIVITY FOR PORTION SIZE ESTIMATION TRAINING ........... 123
APPENDIX D: PORTION SIZE ESTIMATION PRETEST (pILOT STUDY) ............................ 124
APPENDIX E: PORTION SIZE ESTIMATION POSTIEST 1 (pILOT STUDY) ............................ 125
APPENDIX F: PORTION SIZE ESTIMATION POSTIEST 2 (pILOT STUDY) ............................ 126
APPENDIX G: PORTION SIZE ESTIMATION TEST (MAIN STUDY) ............................ 127
APPENDIX H: HUMAN SUBJECTS COMMITTEE APPROVAL LETTER . 128
APPENDIX I: HUMAN SUBJECTS CONSENT FORM ............. 129
REFERENCES ........................................ 132
9
LIST OF ILLUSTRATIONS
Figure 1: The Solomon Four-Group Design . . . . . . . . . . . . . . . . . . . . . . . . 63
Figure 2: Interaction of Training with Testing for D-Solid, Inches .......... 81
Figure 3: Modified Solomon Four-Group Design ................•... 87
Figure 4: Hypotheses Tested by Each of the Three Studies ............. 116

10
LIST OF TABLES
Table 1: Food Models Used for Portion Size Estimation Training .......... 50
Table 2: First and Second Posttests on Portion Size Estimation Used for the Pilot Study ........................... 54
Table 3: Mean Percent Error + SDs for Each Food or Food Variable Calculated Using Over- and Underestimation Errors ("D" Means) and the Absolute Value Errors ("Ab" Means) for Posttest 1 and Posttest 2 . . . . . . . . . . . . . . . . . . . . . . . . . 58
Table 4: Results of Paired t-tests Comparing the Mean Percent Estimation Error on the First and Second Posttests Using the D-Values .............................. 60
Table 5: Results of Paired t-tests Comparing the Mean Percent Estimation Error on the First and Second Posttests Using the Ab-Values ............................. 60
Table 6: Pre- and Posttest on Portion Size Estimation . . . . . . . . . . . . . . . . . 65
Table 7: Mean Percent Error + SDs for Each Food or Food Variable Calculated Using Over- and Underestimation Errors ("D" Means) and the Absolute Value Errors ("Ab" Means) for the First Posttest for Group 1 . . . . . . . . . . . . . . . . . . . . . . 69
Table 8: Mean Percent Error + SDs for Each Food or Food Variable Calculated Using Over- and Underestimation Errors ("D" Means) and the Absolute Value Errors (nAb" Means) for the Pretest and Both Posttests for Group 2 . . . . . . . . . . . . . . 70
Table 9: Mean Percent Error + SDs for F..ach Food or Food Variable Calculated Using Over- and Underestimation Errors ("D" Means) and the Absolute Value Errors ("Ab" Means) for the First Posttest for Group 3 . . . . . . . . . . . . . . . . . . . . . . 71
Table 10: Mean Percent Error + SDs for Each Food or Food Variable Calculated Using Over- and Underestimation Errors ("D" Means) and the Absolute Value Errors (" Ab" Means) for the Pre.test and Both Posttests for Group 4 . . . . . . . . . . . . . . 72

11
LIST OF TABLES - Continued
Table 11: Pre- and Posttest D-Mean Percent Errors + SDs by Group and Food/Measurement Type . . . • . . . . . . • . • . • . • . • • • ••. 73
Table 12: Pre- and Posttest Ab-Mean Percent En'ors + SDs by Group and Food/Measurement Type . . . . . . . . . . . . . . . . . . . . . . . . . . . 74
Table 13: Results of ANOVAs for the Main Effect of Training (D-Means), by Food/Measurement Type ................. 77
Table 14: Results of ANOVAs for the Main Effect of Training (Ab-Means), by Food/Measurement Type ................ 78
Table 15: Comparison of Food Items, Food Types, and Quantities Used for the First and Second Posttests for the Main Study vs. the Pilot Study . . . . . . . . . . . . . . . . . . . . . . . 84
Table 16: Results of Paired t-tests for Groups 2, 4, and 5 Comparing Means of the First and Second Posttests .......... 89
Table 17: Results of Mixed Model ANOV As For Group and Test (Occasion) as Main Effects and Group by Test Interaction (D-Means) ...... , ...................... 94
Table 18: Results of Mixed Model ANOVAs For Group and Test (Occasion) as Main Effects and Group by Test Interaction (Ab-Means) ............................ 97
Table 19: Results of Mixed Model ANOVAs for the Main Effects and Interactions Involving Foodform . . . . . . . . . . . . . . . . . . . 100

12
ABSTRACT
The effectiveness of training individuals in portion size estimation skills in
order to increase their accuracy of food quantity estimation was investigated. The
retention of gain in estimation accuracy over six months and the effects of the
completion of diet records on the retention of estimation accuracy were also
investigated. A multi-technique training program combining the measurement and
estimation of real foods and food models by standard household measurements and
dimensions was used. Three foodforms were represented: solids, liquids, and
amorphous foods. Two subject samples, composed of Caucasian females, 28-42 years
old, were recruited. One sample (n=25) was pretested on portion size estimation
accuracy, trained, and posttested. They subsequently completed four randomly
assigned, nonconsecutive days of diet records and were posttested again six months
after their first posttest. The other sample (n=66) was randomly assigned to one of
four groups using the Solomon four-group design: 1) control, pre- and posttested, 2)
control, posttested only, 3) trained, pre- and posttested, and 4) trained, posttested
only. One control group (Group 2, n=14) and one trained group (Group 4, n=14)
were administered a second posttest six months after their first posttest for
comparison with the other subject sample. Groups 2 and 4 did not complete diet
records during the six month period between posttests.
Using 14 separate 2x2 ANOVAs, results showed that training significantly
increased portion size estimation accuracy calculated by difference ("D" method,
p=.OO7) and by absolute value ("Ab" method,p=.OO3). This training effect for the
13
total test was attributed specifically to the increase in estimation accuracy for solids
estimated in cups ("D" method, p=.OOO; "Ab" method, p=.OO8) and for amorphous
foods ("D" method, p=.OOO; "Ab" method, p=.OOO).
Comparisons between first and second posttest scores for Groups 2, 4, and the
group that completed diet records were analyzed using paired t-tests and mixed model
ANOVAs. Post hoc tests included Tukey's HSD test and orthogonal contrasts
(p,S..05). Both trained groups retained their gain in estimation accuracy over six
months for all but one variable, and the completion of diet records improved
estimation of solid foods by dimensions.
CHAYI'ER 1
Introduction
Explanation of the Problem and its Context
14
The accuracy of self-reported dietary intake data is crucial for the assessment
of nutritional status, the estimation of nutritional requirements, the planning of public
nutrition education programs, the treatment of diet-related diseases, and for
epidemiologic research. Shortcomings in dietary intake methodology can result in
inaccurate dietary data, and thus, misleading conclusions regarding the impact of diet
on health. To quantitatively document habitual, self-selected dietary intake in a free
living environment, a self-reported dietarj intake method must be used.
Methods for Collecting Self-Reponed Dietary Intake Data
There are five self-reported dietary intake methods: the diet history, the food
frequency questionnaire, the 24-hour recall, the estimated diet record, and the
weighed diet record. The diet history is a retrospective method, designed to assess
food intake in the past, usually the distant past (months to years). A diet history is
obtained through a detailed personal interview with a subject and focuses on dietary
intake patterns and behaviors. It usually includes a food frequency or 24-hour recall
component to provide quantitative information about the diet, and the use of food
models, or other techniques, to aid in the estimation of portion si7..es (1-8). The diet
history also depends greatly on the reliability of the subject's memory (9).
The food frequency questionnaire is a list of foods that encompasses the
overall diet, or it can be aimed at specific foods or nutrients of interest for a

15
particular study (6). The questionnaire can be either self-administered or interviewer-
administered (2,6,10-12). Subjects report how frequently (more than once a day,
daily, weekly, monthly, etc.) they consume each food on the list during a specified
period of time (week, month, year, etc.) (13,14). It is semiquantitative because
amounts of foods consumed are usually reported in terms of small, medium or large
servings, which are subjective (subject-determined) or arbitrary (investigator
determined) in nature. More quantitative versions mak~ use of food models or
pictures to prompt subjects' recall of specific food amounts consumed. The
combination of missing foods (due to the limitation of the number of foods on the list)
and semiquantitative methods limits the accuracy of the estimated energy intake (2).
Its primary use is for the rating, or assignment, of individuals into categories (usually
tertiles, quartiles or quintiles) of consumption of foods or nutrients of interest (2).
Groups or individuals at the extreme ends of intakes can be identified (3,12).
To obtain more quantitative dietary intake data, a 24-hour recall, or weighed
or estimated diet record, must be used. For the 24-hour recall method, the subject is
asked to recall all foods consumed, and their respective quantities, during the past 24-
hour period. The recall can be self-administered (15,16), but is usually interviewer
administered (9). Interviewer-administered recalls can be conducted in person or over
the telephone (16). In-person interviews generally utilize food models or pictures to
assist the subjects in estimating the quantities of foods consumed (3,6,9,14). The two
major drawbacks of the 24-hour recall are its dependence on the ability of the subject
to remember all foods consumed, and in the correct amounts, and the questionable

16
accuracy ofa single day's intake as a measure ofbabitual intake (9,17-21,23,24).
The weigbed diet record procedure requires that all foods be weigbed prior to
consumption, and leftovers reweigbed after consumption. The difference, which is
the amount actually consumed, is then recorded in a booklet. Weighed diet records
are usually completed for a period of 4-7 days (3,22). Foods eaten in restaurants
must be reported, and duplicate portions purchased and weighed (3,7,25) or the
subject must estimate food portion sizes consumed. Due to the stringency of the
method, subjects are likely to make changes in their food consumption habits in order
to facilitate the weighing/recording process (e.g. by eliminating combination dishes)
(9,14,26).
For the estimated diet record, the subjects are asked to measure or estimate the
quantities of the foods they consume, and to record those foods and quantities in a
booklet (9,14). Quantities are recorded in standard bousehold measures (e.g. cups,
tablespoons, teaspoons, etc.). As with the weighed diet record, estimated diet records
are usually recorded for 4-7 days (3,14,22). While this method requires a high level
of subject compliance, estimating food quantities is less burdensome than the actual
weighing of foods (14). An advantage of both the weighed and estimated diet records
is that they do not rely on the memory of the subject.
Definition and Role of Ponion Size Estimation in the Self-Reporting of Dietary Intake
Data
Portion size estimation refers to the precise measurement or determination of
the quantity of a food in a standard unit of measurement. The units of measurement

17
usually used are "standard household measurements", which include cups,
tablespoons, teaspoons, ounces, and fluid ounces. In the three st1ldies reported in this
document, food quantities are also reported in dimensions (inches), which include
length, width and height, or diamet~r.
Portion size estimation is required for the implementation of all five of the
self-reported dietary intake methods currently in use. For the diet history, 24-hour
recall and food frequency techniques, portion size estimation is usually accomplished
through the use of food models or 1- or 2-dimensional pictures during an individual
interview with the investigator/dietitian. In these interviews, the subject is asked to
provide retrospective estimates of food portions consumed either 24 hours previously
or up to several years previously. Thus, two potential problems emerge. First, there
is the problem of an individual's a~iIity to remember what foods were consumed, and
second, there is the problem of an individual's ability to provide precise information
regarding the quantity of each food consumed. It is assumed that these tasks are less
difficult to perform, and are therefore more precise, for foods consumed in the very
recent past (24-hours). For retrospective reporting of usual intake in the more remote
past, an estimate of habitual food quantities, rather than precise measurements or
determinations, is sought. Regardless of the desired precision, the ability to make
accurate estimates directly reflects the quality of the dietary data collected.
The weighed diet record method requires the precise weighing (using a dietary
scale) of all foods consumed. These weights are usually reported in grams.
Unfortunately, using even the strictest protocols, there are occasions when some

estimations of food portions must be made (e.g. when eating in restaurants or other
locations away from home).
Portion size estimation plays its most integral role flS a component of the
estimated diet record method. This method is intended to provide quantitatively
accurate dietary intake data like the weighed diet record, but without the burden of
weighing each individual food. If subjects can be trained to measure or estimate
portion sizes of foods accurately, the estimated diet record is potentially the most
accurate, self-reported dietary intake method available.
Significance
Many investigators (27-30) recommend the training of individuals in portion
size estimation skills in order to increase the accuracy of self-reported dietary intake
data. Smiciklas-Wright et al. (31) suggest that inaccurate estimation of portion sizes
is probably the largest source of error in diet records. In three studies of college
students enrolled in an introductory nutrition course, Bolland et al. (30,32,33)
concluded that short, lO-minute training sessions can enhance ability to accurately
estimate quantities of some foods (p < .05), and that this ability lasts for 1-4 weeks
(33). However, no standardized, validated training program has yet been developed.
18
The three studies described in chapters 3, 4 and 5 of this document were
designed to develop a tested, standardized porticn size estimation training program for
use with all five self-reported dietary intake methods currently in use. To accomplish
this goal, the following objectives were addressed: 1) to test the ability of individuals
to accurately estimate portion sizes of foods using a more rigorous experimental

19
design (the Solomon four-group design) than the design used for the Bolland et aI.
(30,32,33) studies (the post-test only control-group design), 2) to test how much gain
in accuracy is retained over time, and 3) to determine whether retention of gain in
accuracy of estimation is enhanced by application of ability (completion of 4 days of
estimated diet records in free-living conditions). Based on these results, the portion
size estimation training program will be revised accordingly for the next phase of
development: validation by an independent technique.
A future study has been proposed to validate dietary intake self-reported by the
estimated diet record, used in conjunction with the portion size estimation training
program, by comparison with energy expenditure using the doubly labeled water
method, which is an independent, criterion technique. Ultimately, the use of a self
reported dietary method which has a standardized, validated portion size estimation
training component will result in significantly more accurate dietary intake data. This
method can then be applied to numerous applications in nutrition and epidemiologic
research, and in the clinical nutrition setting.
Specific Aims
This was a three-part investigation, using two distinct groups of subjects. The
first study was methodological, in which the portion size estimation training protocol
was developed and pilot tested. The 57 subjects used for this study were recruited
for a larger study investigating the effects of weight resistance exercise on bone
mineral content. The protocol for that study required each subject to record her
dietary intake for four randomly assigned days during a one-month period at 5, 12

20
and 18 months of the study. The dietary recording method used was an estimated diet
record. In order to increase the potential accuracy of this self-reported dietary data,
the portion size estimation training program was developed. Using the one-group
pretest-posttest design, the following two hypotheses were investigated:
a. Subjects trained in the portion size estimation program will increase
their accuracy of estimation of portion sizes of foods.
b. Some gain in estimation accuracy, as a result of the portion size
estimation training program, will be retained after six months with the
intervening completion of four days of estimated diet records
(application of portion size estimation ability under free-living
conditions).
Chapter 3: Pilot Study, addresses these hypotheses.
Following the completion of the first study, the test forms and test-taking
instmctions were revised (see Chapter 3, Experimental Design and Statistical
Procedures), and a more powerful research design was chosen to test the hypotheses,
for the second study (see Chapter 4: Main Study). For the main study, 66 subjects
were recruited and randomly assigned to one of four groups based on the Solomon
four-group experimental design: 1) control, posttest only, 2) control, pre- and
posttest, 3) trained, posttest only, and 4) trained, pre- a..d posttest. For this study,
the following four hypotheses were investigated:
a. Subjects trained in the portion size estimation program will increase
their accuracy of estimation of portion sizes of foods.

b. Accuracy of estimation will vary by foodform (liquid vs. solid vs.
amorphous foods).
c. No reactive effect of testing will be found (Group 2 will not estimate
portion sizes more accurately than Group 1, and Group 4 will not
estimate portion sizes more accurately than Group 3).
d. No interaction of testing with training will be found (the difference in
accuracy between Groups 2 and 4 will not be different than the
difference in accuracy between Groups 1 and 3).
These hypotheses are discussed in Chapter 4: Main Study.
The third study compares results from the pilot study and the main study.
Three hypotheses were investigated:
a. Subjects trained in the portion size estimation program (all subjects in
the pilot study, and using Group 4 from the main study) will retain
some of their gain in accuracy six months after training.
21
b. The retention of the gain in estimation accuracy, as a result of the
portion size estimation training program, will be greater for those
subjects who also completed four days of diet records (pilot study) than
for those subjects who were trained but did not complete diet records
(Group 4, main study).
c. Accuracy of estimation will vary by foodform (liquid vs. solid vs.
amorphous foods).
In order to test these hypotheses, a second posttest was administered to the subjects in

22
each of these groups six months after their initial posttest. A series of mixed design
ANOVAs were performed to statistically evaluate these data. Chapter 5: Comparison
Study addresses these hypotheses.
Limitations
These studies were restricted to premenopausal, Caucasian women between the
ages of 28 and 42, and therefore the results may not be generalizable to other
populations.
The methodology used for the pilot study and the main study differed in some
aspects. First, more foods were used for the pre- and posttests for the pilot study (16
foods on the pretest; 19 foods on the posUest) than were used for the main study (10
foods for both pre- and posttest). Therefore, only the data from the ten foods used in
the pilot study, which could be matched by food type to the ten foods used in the
main study, were analyzed for comparison in the third study.
Second, the foods used for the pre- and posttests for the pilot study were not
exactly the same. Rather, different foods were chosen for the two posttests and
matched by food type to the prettest foods. For the main study, the exact same foods
were used for the pretest and both posttests.
Test scores for the pilot study group were calculated for only 25 of the 57 total
subjects who completed that study. As explained in Chapter 3, pages 55-56, many
tests were uncode-able due to the reporting of food portions in inappropriate units of
measurement. Therefore, the sample used for the pilot study may be biased towards
those subjects who were the "better" estimation reporters.

DerInitions
Absolute Value - The calculation of test scores without regard to the direction of
estimation error. Positive (overestimation) and negative (underestimation)
signs are ignored, such that the total estimation error for each variable is
summed.
Amorphous Food - Foods which are more resistant to flow than liquids, and less
resistant to flow than solid foods. These foods are commonly referred to as
"gloppy" foods. Examples of amorphous foods include applesauce, cottage
cheese and refried beans.
23
Difference Value - The calculation of test scores which incorporates the direction of
estimation error. Positive and negative signs are included, such that some of
the total estimation error is canceled out. This calculation method provides
information regarding the direction of error, rather than the total magnitude of
the error.
Dimensions - Dimensions refer to the estimation of food quantities in inches, using
either length, width and height, or diameter.
Portion Size Estimation - Portion size estimation refers to the precise measurement or
determination of the quantity of a food in a standard unit of measurement,
usually "standard household measurements".
Standard Household Measurements - Standard household measurements include cups,
tablespoons, teaspoons, ounces, and fluid ounces.

24
Explanation of the Dissertation Format
Because this document is composed of three distinct studies, the format is
somewhat altered from the traditional dissertation format. Chapter~ 3, 4, and 5 each
describe the subjects and methods for one of the studies, and a short discussion and
the results for that study. Chapter 6 provides the interpretations and discussion of all
three studies. Chapter 7 provides a comprehensive summary and conclusions for all
three studies, and some implications for future research.
CHAPfER2
Literature Review
Sources of Error in Dietary Intake Assessment Methods
25
Shortcomings in dietary intake assessment methods can result in inaccurate
dietary data, and thus, misleading conclusions regarding the impact of diet on health.
The selection of an appropriate dietary assessment method for the objective of the
study is the first requirement for reducing error in dietary methodology. Once an
appropriate method has been selected, minimizing sources of error and variability due
to the administration of the method remain. These include both measurement errors
and uncertainty in the estimated usual intake due to true dietary variability over time
(34,35).
There are two types of measurement error: random error and systematic error
or bias. Both types of error can be minimized through the use of careful quality
control procedures, however the random errors cannot be entirely eliminated (34).
Uncertainty in the accuracy of dietary intake using a self-reported dietary
assessment method (see Methods for Collecting Self-Reported Dietary Intake Data, p.
15) can result not only from measurement error, but from true dietary variability that
can occur over time. This variability is due to both inter-subject (between subject)
variation and intra-subject (within subject) variation. Variability of daily energy
intakes accounts for over two-thirds of the total variability usually observed in mean
estimates of energy intakes of groups (36,38). Unlike measurement errors, no
attempt should be made to minimize inter- and intra-subject variation because they

26
represent the true usual intake (34). Instead, the two sources of variability should be
separated and estimated statistically so that the magnitude of the effect of each source
of variation can be taken into account during the interpretation of the data (38-41).
Intra-subject variation cannot be distinguished statistically from random measurement
errors. Therefore, measured intra-subject variation represents the sum of true
variation in intake over time for the same individual, plus the remaining sources of
random measurement error. If, however, some of the confounding effects of
measurement error on intra-subject variability can be reduced, true intra-subject
variation can be better evaluated.
Measurement errors may occur at any stage in the process of quantifying,
reporting, collecting, coding, analyzing, and interpreting dietary intake data. These
errors can originate with either the subjects or the investigators. The impact of the
specific measurement error depends on the objectives of the study. Sources of
measurement error in dietary intake assessment methods include: 1) respondent
biases, 2) interviewer biases, 3) respondent memory lapses, 4) respondent reporting
errors other than inaccurate estimations of portion sizes, 5) flat-slope syndrome, 6)
coding and computation errors, 7) errors in the compilation of nutrient composition
data, and 8) inaccurate estimations of portion sizes of foods (3,34).
Examples of respondent biases can include an individual's over-reporting of
perceived "healthy" foods such as fruits and vegetables and under-reporting of
perceived "bad" foods such as cookies, candy, and alcohol (42,43). This type of mis
reporting can often arise from intentional or unintentional non-verbal cues from the

27
interviewer regarding desired responses" Interviewer bias can include errors caused
by ambiguous questions, incorrect recording of responses, intentional or unintentional
omissions, biases associated with interview setting, and the degree of rapport between
interviewer and the respondent (44,45). In order to minimize respondent and
interviewer biases, the interviewer should be trained to anticipate and recognize
potential sources of distortion and bias generated by the respondent (34). Since
respondent mis-reporting can also arise from such problems as "lmowing" they are
involved in a food/nutrition study, interviewers should be trained in interviewing
techniques and strategies.
Unreliability of respondent memory is a critical source of systematic error in
recall methods such as the diet history, the 24-hour recall, and the food frequency
questionnaire. Respondent reporting errors other than inaccurate estimations of
portions sizes include inaccurate reporting of frequency of consumption of foods,
errors in food descriptions, and omissions or additions of foods. Omissions or
additions of foods may be intentional or unintentional. Errors due to memory lapses
can be reduced by the use of "probing" questions, skilled interviewing, and/or visual
aids such as food models or food pictures.
The flat-slope syndrome is the phenomenon of the overreporting of low
dietary intakes and the underreporting of high dietary intakes. Many investigators
have reported its existence, and several have recommended accounting for it
particularly in the analysis of 24-hour recall data (34,46,47).
Coding and computation errors can occur during the conversion of reported

food descriptions and/or quantities to the corresponding computerized nutrient
database codes and quantities. Duplicate coding of a specified proportion of the
records/recalls/questionnaires by an independent coder can be used as a quality
control procedure. Discrepancies greater than 5 % between coders can then be
investigated and corrected (48). Additionally, any nutrient value three standard
deviations above or below the group mean can be rechecked for accuracy of data
entry.
28
Errors in the compilation of nutrient composition data can be either random or
systematic, or the result of true variability in the nutrient composition of foods (34).
Random errors may occur as a result of inadequate sampling protocols such that
nutrient values are not representative of the average year-round composition of a food
on a nationwide basis. Systematic errors may occur as a result of inappropriate
analytical methods, inappropriate procedures for calculating the nutrient content of a
food, and inadequate descriptions for individual food items (49,50). Errors resulting
from the true variability in the nutrient composition of foods may be associated with
differences in food production and processing procedures, genetic variation, and the
effects of soil, fertilizer, weather, and pest control (49). The quality of the nutrient
composition data can be checked prior to use by using the diagnostic model of Hoover
and Perl off (34,51). This model evaluates nutrient analysis systems using the United
States Department of Agriculture nutrient data bank as a reference, and identifies
specific reasons for any discrepancies observed. Included in the model are computing
tasks to: 1) revalidate a nutrient database after updating, 2) validate recipe calculation

procedures by calculating the nutrient content of a standard recipe, and 3) validate
program computation using a reference dietary record/recall (34).
29
Finally, measurement error may occur as a result of inaccurate estimations by
individuals of portion sizes of foods. These errors have been reported to be as high
as 260% (29), and therefore, represent a considerable contribution to the total
measurement error of dietary intake methods. Smiciklas-Wright et al. (31) suggest
that inaccurate estimations of portion sizes of foods is probably the largest source of
error in diet records. Others (52,53) suggest that regardless of other factors, if an
individual cannot discern or report food quantities correctly, the diet record has
limited value.
Portion Size Estimation Studies
Many investigators recommend the training of individuals in portion size
estimation slalls in order to increase the accuracy of self-reported dietary intake data
(2,27-30,52,54). While some (55,56) suggest the use of food models to assist
individuals in the estimation of food quantities, Rapp et al. (57) suggest there is a
need to train subjects in portion size estimation using alternatives to food models.
They further suggest that it may be necessary to train individuals in the estimation of
a variety of food items representing different food characteristics (types).
Six studies (27-29,52,58,59) have evaluated the ability of individuals to
accurately estimate portion sizes of foods without prior training. The earliest study
designed to test subjects' ability to accurately estimate food portion sizes was reported
by Lansky and Brownell in 1982 (29). Thirty female applicants to a behavioral

weight reduction program were asked to estimate the quantities of 10 pre-measured,
displayed foods. The percent error of estimation ranged from 6-260%, all
overestimations. The mean error of estimation for all 10 foods was 63.9%. The
authors also tested the effect of container size on percent error of estimation, but
found a significant difference (p< .05) in estimation between large and small
containers for only one food: cottage cheese.
30
Webb and Yuhas (52) investigated the ability of 79 participants of a WIC
program (Special Supplemental Program for Women, Infants, and Children) to
accurately estimate the pre-measured quantities of 10 foods. These foods included
two liquids (orange juice and soup), five solids (green beans, potato chips, bologna,
cornflakes, and cheddar cheese), and three amorphous foods (cottage cheese,
Spaghetti D's, and applesauce). No control group was used. Results were expressed
as the mean percent errors of estimation for each food item. While some individuals
underestimated the quantities of two foods (green beans and bologna), the mean error
for every food item was an overestimation ranging from 16% for green beans to
247% for potato chips. Percent errors of estimation for all but two foods fell in the
range of 16-62 %. The two foods with the least accurate mean estimations were
potato chips and cheddar cheese, overestimated by 247% and 123% respectively. The
subjects were asked Lo estimate these two foods, plus bologna, in ounces, rather than
cups or dimensions (inches), which may be the reason for such a high magnitude of
error.
In a study of 147 university students and staff, Guthrie (28) tested the ability
31
of individuals to estimate the amounts of 11 foods. Several of the foods were
evaluated twiC',e in two different fonns or presentations. Milk was estimated as a
beverage and as an addition to cereal. Butter was estimated as spread on toast and as
a separate condiment. The subjects were invited to estimate the foods presented as
either a breakfast or a lunch. They were asked to serve themselves what they
believed to be a "standard" portion, and then to estimate the amount of that portion
after consuming the meal. The foods included three liquids (orange juice, milk on
cereal, and milk as a beverage), four solids (cornflakes, sugar on cereal, tossed salad,
and fruit salad), and four amorphous foods (butter, butter on toast, tuna salad, and
salad dressing). Mean errors of estimation for each food were not reported; instead,
the data were reported as percent of respondents over- or underestimating each food
at various ranges of error. The main findings were that for 8 of the 11 foods, 25-
73 % of respondents overestimated by at least 25 %, and that for 7 of the 11 foods, 34-
67 % of respondents overestimated by > 51 %.
Blake et al. (27) found no definitive differences in the ability of overweight
and normal weight individuals to accurately estimate portion sizes of foods in a two
part study. Ninety-four women, including 46 overweight (23 of whom were 2..20%
of ideal weight) and 48 normal weight women, estimated portion sizes by phone
during a 24-hour recall for 10 foods they selected and consumed the previous day.
They also estimated portion sizes for 10 pre-measured, displayed foods while viewing
those foods. The only significant difference (p..$...01) in estimation accuracy for the
displayed foods was for milk, with the overweight subjects estimating more accurately
32
than the normal weight subjects. For the foods consumed by the subjects, only soup
was estimated significantly (p~.01) differently between the two groups; the
overweight subjects were more accurate. For all subjects though, the percent error of
estimation ranged from 21-80% (disregarding direction of error) for 10 of the 20 food
items. Over- or underestimates of 10-18% were found for 6 of the 20 foods. As in
the study by Rapp et al. (57), discussed below, subjects who had received some form
of individual dietary counseling (58 % of subjects in this study) did not estimate food
portion sizes more accurately than other subjects in the same study who received no
prior dietary instruction. The dietary instruction in both the Blake et al. and Rapp et
al. studies was designed to facilitate weight loss and was not specifically designed to
train the individuals in portion size estimation skills.
Using a slightly different approach, Moore-Armitage et al. (59) investigated
the relationship of previous nutrition knowledge (as determined by scores on a
validate.d nutrition knowledge test) with the ability of subjects to estimate portions of
foods presented in three formats (slides, food models, and real foods) and three
applications (single foods, combination foods, and plated meals). Contrary to what
they expected, the authors found that greater nutrition knowledge did not reflect
greater accuracy of estimation. Further, plated meals, presented as slides or real
food, were the most accurately estimated foods for the total group of subj~ts.
In the most recent study designed to investigate the ability of subjects to
quantify food amounts correctly, Paggiano et al. (58) randomly selected 103 subjects
from a sample of 300 adult volunteers to estimate portion sizes of 17 foods. The

33
subjects self-selected and consumed a portion of each food. The portions chosen by
each subject were weighed by the investigators immediately after selection. The day
after the dinner, each subject was interviewed by a trained dietitian and portion sizes
were reported via the use of a series of seven pictures depicting graduated sizes of
each food. Portion sizes were overestimated by more than 20% for six of the 17
foods, and underestimated by more than 20% for four foods. In addition, the authors
found a tendency towards overestimation by those who consumed smaller portions and
underestimation by those who consumed larger portions (flat-slope syndrome). These
results are at least partially due to error in the method used for reporting portion
sizes. For seven of the foods, the smallest quantities consumed were smaller than, or
of a similar magnitude to, the smallest quantity represented by the pictures.
Consequently, consumers of small quantities of these food items could make no error
other than to overestimate their intake (range of percent error: +6% to +89%).
Similarly, for five of the foods, the largest quantity consumed was equal to, or larger
than, the largest quantity represented by the pictures, so that for these foods,
consumers of large quantities could make no other error than to underestimate their
intakes (range of percent error: -18% to -50%). For the five foods for which all
quantities consumed by the subjects fell within the range of the quantities represented
by the pictures, the mean intakes were reasonably well estimated for all but one food
item (cheese; overestimated by 62%). Percent errors of estimation for these foods
ranged from +3% to -3%.
It is clear from these six studies that regardless of previous dietary instruction

34
or nutrition Imowledge, gender, socio-economic group, or health status, people in
general are not proficient in the accurate quantification of food portions. Even though
liquids seem to be the most accurately estimated foods, Smiciktas-Wright et al. (31)
found only 28-47% of subjects were able to accurately estimate (0% error) one or
more of 12 liquids. Posner et al. (60) compared portion size estimations made using
three-dimensional food models with estimations made using two-dimensional food
pictures for the same foods in 59 subjects. Very high correlations (.89-1.00; Pearson
correlation coefficients) were found between the two methods for all food/nutrient
variables. Even though good agreement was established between the two estimation
methods, it still was not known whether the estimates reflected accurately the actual
amounts of the foods or whether the same error of estimation was made using both
methods. The need for training individuals in portion size estimation skills seems
indicated.
Four studies (30,32,33,57), three of which were conducted by the same team
of investigators (30,32,33), have evaluated the effectiveness of training in portion size
estimation skills to enhance estimation accuracy. Rapp et al. (57) tested the ability of
25 men with Type II diabetes vs. 25 non-diabetic male controls to estimate portion
sizes of four foods: margarine, chicken, rice, and milk. Before the food estimation
test, the diabetic subjects received dietary counseling from a registered dietitian
regarding the use of ADA Exchange lists, an individualized meal plan, a
demonstration of correct portion sizes using food models, and specific instructions to
use measuring devices for portion size accuracy at home. No information was given

35
regarding how much time elapsed between the counseling sessions and the portion
size estimation test. Rather than estimating pre-measured amounts of displayed food
items, as was done in the majority of the studies presented here, the subjects in the
Rapp et al. study were asked to serve themselves a pre-specified portion of each food
from a large serving platter. For all of the foods except chicken, no significant
difference in estimation accuracy was found between the two groups of subjects. The
diabetic group estimated chicken with significantly less error (p= .03) than the control
group. Overall, only milk was estimated by either group with reasonable accuracy
(mean underestimation for all 50 subjects of 2.1 %). Percent error of estimation for
the other three foods for both groups ranged from 26.1 - 59.0% (disregarding
direction of error).
In the series of three studies by Bolland, Yuhas and BoUand (30,32,33),
students in coUege-level introductory nutrition courses were randomly assigned to
trained and untrained (control) groups to test the effectiveness of different portion size
estimation training methods, and the effects of container size, gender, and time post
training on portion size estimation ability. In the first study (32), 42 female students
were randomly assigned to one of three groups: trained using measurement of real
foods, trained using observation of food models, and untrained (control). The group
trained using real foods spent ten minutes measuring and observing the amounts of
four foods: corn, cooked spaghetti, French dressing and water. In addition, the
subjects weighed two sizes of hamburgers on a scale, and measured the dimensions of
two sizes of brownies with a ruler. The group trained using food models spent ten

36
minutes observing eight pre-measured foods: soup, a slice of pizza, spaghetti,
macaroni, corn, brussels sprouts, hamburger, and ham. Additionally, they observed
displayed amounts of four real foods (two sizes of e.ach): water, cocoa, margarine and
brownies. The control group received no instruction. All three groups then estimated
the portion sizes of 17 foods displayed in three meal settings: breakfast, lunch, and
dinner. They were asked to quantify their estimations in tablespoons, cups, fluid
ounces or dimensions (inches). Results indicated no significant difference between the
two types of training using both parametric and non-parametric tests. For each
trained group, when compared with the untrained group, a significant improvement
(p < . OS) was found in estimation ability for two of the 17 food items (applesauce and
coffee) using ANOVA and Scheffe's test. When the two trained groups were
combined and compared with the untrained group, the total trained group estimated
five of the 17 food items more accurately (p < .05). The authors concluded that this
data lends some support to the practice of training individuals in portion size
estimation, using either real food measurements or observation of food models in 10-
minute sessions, to improve portion size estimation accuracy.
In the second study (3~}, 145 male and female students were randomly
assigned to either a trained or untrained group. The trained subjects received the 10-
minute food model training described above. The untrained subjects received no
instruction. Within each group, the subjects were further divided into male and
female groups, then randomly assigned to estimate food portion sizes for food
displayed in either large or small containers. Each display contained six foods: two

37
solids (meat loaf and fish), two liquids (milk and soup), and two amorphous foods
(spaghetti and applesauce). The same foods and portion sizes were used in each
display, but different combinations of large and small container sizes were used. The
data for all foods were analyzed collectively using two four-way ANOV As. Results
indicated no significant difference in estimation ability between men and women, and
no significant effect of container size for either sex or for the entire study population
as a whole. The trained group estimated food portions more accurately (p=.OOOl)
than the untrained group for the six foods combined. Additionally, estimates of solid
foods were significantly (p=.05) more accurate than estimations of liquids, and the
liquids were estimated significantly (p=.05) more accurately than the amorphous
foods regardless of training, gender or container size. The authors concluded that
training enhances the accuracy of individuals' estimates of food quantities, and that
the accuracy of estimates differs for different food types.
In the third study conducted by Yuhas, Bolland, and Bolland (33), the authors
investigated the effect of the amount of time post-training on individuals' ability to
estimate portion sizes of foods accurately. Two hundred eight students were divided
into two groups of 147 trained and 61 untrained subjects. The trained subjects were
further sub-divided into three groups that estimated food quantities either immediately
after training, one week later, or four weeks later. The trained subjects received the
same lO-minute food model training described in the first study. The untrained
subjects received no instruction. The same six foods used for the portion size
estimation test in the second study were used again for this study: two solids (meat

loaf and fish), two liquids (milk and soup), and two amorphous foods (spaghetti and
applesauce). Using a two-way ANOVA, both food item and the training/time
variables were significant (p~.OOOI). For all food items combined, trained subjects
estimated food quantities significantly better (Duncan's multiple comparison test,
p < .05) than untrained subjects, regardless of when the trained subjects were tested.
No significant differences in estimation were found for trained subjects tested
immediately and one week after training, but both of these groups did significantly
better (p < .05) than did the trained subjects who were tested four weeks after
38
training. The training/time factor was significant (p < .05) for four of the six
individual food items: meat loaf, fish, soup, and spaghetti. Estimates made by trained
subjects who were tested immediately after training were always better than those
made by untrained subjects; these differences were significant (p < .05) for the same
four food items mentioned above, plus milk. Estimates made by trained subjects
tested one week after training were also always better than estimates made by
untrained subjects, but the differences were significant (p < .05) for only three foods:
meat loaf, fish, and soup. Estimates made by trained subjects who were tested four
weeks after training were not consistently better or worse than those made by
untrained subjects across the six food items. The authors conclude that these results
support the use of training to improve an individual's ability to estimate food
quantities accurately, and indicate that the impact of training lasts for at least one
week and can last for up to four weeks.
For all three of these studies, the percent error of estimation even after

39
training was considerable. For the last two studies, the percent error was expressed
as the absolute value of the error; pluses (overestimations) and minuses
(underestimations) were ignored. For these studies then, the range of percent error of
estimation across all foods was 18.8-140.8%. For the first study, the percent error of
estimation was expressed as percent over- or underestimation. Most foods were
overestimated. The range of underestimation was -2.56% to -11.11 %. The range of
overestimation was 1.19-76.92%. These errors appear much smaller because the
expression of overestimations of some foods by some subjects were canceled out by
the underestimations of some foods by some subjects. A truer magnitude of total
error (overestimations plus underestimations) is achieved using the method of absolute
value. In order to evaluate the data generated by the three studies presented in this
document, the percent error of estimation was calculated by both methods (refer to
the Results and Discussion sections in Chapters 3 and 4).
Influence of the Previous Studies on the Design of the Studies Presented in this
Document
It is clear that there is a need for additior.al studies to investigate the
effectiveness of different types of training on the improvement of portion size
estimation accuracy. The three studies comprising this document were designed for
that purpose. Several issues which emerged from the studies summarized in this
review required attention prior to the design of the studies in this document. These
issues included the considerations of: 1) gender, 2) container size, 3) food type,
4) single foods vs. meals, 5) food models vs. real foods, 6) length of training, 7) unit

40
of measurement, 8) memory, and 9) experimental design. The study by Yuhas,
Bolland and Bolland (30) showed no effect of gender on portion size estimation
ability, and all of the studies reviewed revealed large inaccuracies in estimation ability
regardless of the gender used in the study. Therefore, the decision was made to study
a homogenous group with respect to gender.
No meaningful effects of container size were found in any study investigating
this variable (29,30,54), so this issue was not investigated in the studies reported in
this document.
Although Thompson et al. (54) did not find significant differences in accuracy
of estimations by either visual characteristics (Le. globular, recognized, particles in
liquid, chunks suspended in liquid, and liquids) or flow characteristics (Le. stiff,
soupy or intermediate) of foods, there is some evidence to support the hypothesis that
food type (liquid vs. solid vs. amorphous) may be important in the estimation of food
portion sizes (30,57). Therefore, the current studies were evaluated by these three
food types.
The question of whether it was "better" to test subjects in the estimation of
single foods or foods presented as part of a meal was not clear in these studies. In no
study, using either single foods or meals, did subjects estimate food quantities very
accurately. In the study by Moore-Armitage et al. (59), foods presented as plated
meals were estimated more accurately than single foods. Blake et al. (27) did not
find any difference in accuracy of estimation for the foods estimated as part of a meal
vs. single foods estimated from a display. In the absence of strong data to suggest the

41
use of meals, single foods were chosen for the porLion size estimation tests for the
current studies because the preparation and set-up of single foods is simpler than for
foods presented as meals.
In the study by Bolland et al. (32) which compared the effectiveness of
training with real foods vs. training with food models vs. no training, they found that
both trained groups performed better than the untrained group, and that there was no
significant difference in performance between the two trained groups. They
subsequently used only the food model training method in their next two studies
(30,33). The length of time subjects spent in the training sessions for all three of the
Bolland studies was only 10 minutes. In order to develop a potentially powerful
training program with the lowest possible errors of estimation, it was decided to
combine the two training methods and increase the training time to one hour for the
current studies.
Both Webb et aI. (52) and Guthrie (28) suggest that many individuals seem to
have greater difficulty with perceiving food quantities in weights than in volume.
Errors of estimation were greater for solid foods estimated in ounces than for solid
foods estimated in cups (52). This issue is investigated in the studies reported in this
document.
Only one study investigated the effect of memory on the retention of gain in
portion size estimation skills due to training (33). There is a very large body of
literature on memory and forgetting, but generally these studies indicate that the
longer the retention interval the less likely information will be remembered, with

42
large amounts of forgetting occurring in relatively short intervals. The passage of
time alone, however, is not the only factor which affects how well something is
remembered. Other factors, such as how well the information was learned in the first
place, and history (what happens to the individual during the retention period), can
also affect the accuracy of retention of knowledge (61,62). Both the retention of the
gain in estimation accuracy over time, and whether the retention of the gain in
estimation accuracy is enhanced by application of knowledge, are tested in the studies
reported in this document.
The question of whether to use a pretest to determine estimation accuracy prior
to training was considered in choosing the experimental design for the main study
reported here. Essentially, the six studies (27-29,52,58,59) which tested estimation
accuracy with no training intervention were pretest-only designs. Conversely, three
of the four training studies (30,32,33) were posttest-only, control-group designs. It
was decided that an assessment of pre-training estimation ability was desirable, but
that the effect of taking a pretest on the results of the posttest must also be accounted
for. Therefore, the Solomon four-group design, which takes into account the effects
of testing and the interaction of testing with treatment (portion size estimation
training) was chosen for the main study described in this document. This
experimental design is described in detail in Chapter 4: Main Study.
Statistical Methods
As described in Chapter 3, the pilot study of the portion size estimation
training program tested and described in this document was performed using subjects
43
recruited for a separate study. Therefore, the choice of the experimental design used
for the pilot study was not flexible: a one-group pretest-posttest design was used.
Following the completion of four nonconsecutive, randomly assigned days of diet
records, a second posttest was adminsitered. Paired t-tests, as described by Shavelson
(63) and others, were used to statistically evaluate those data.
For the main study, a new subject sample was recruited, and the Solomon
four-group design was used to investigate the main effect of the treatment (portion
size estimation training), the main effect of testing, and the interaction effect of
treatment and testing. The purpose of using the Solomon four-group design is to
identify those research situations in which the pretest sensitizes individuals to the
treatment. If an interaction between the pretest and the treatment exists, the results of
a study cannot be generalized to nonparticipants of the experiment unless they also
receive the pretest. Therefore, the sixty-six subjects in this study were randomly
assigned to one of four groups: 1) a control group receiving the posttest only, 2) a
control group receiving both the pre- and posttests, 3) a treatment group receiving the
posttest only, or 4) a treatment group receiving both the pre- and posttcsts. Analysis
of variance procedures (63) were used to statistically analyze those data. Specifically,
fourteen separate 2x2 ANOV As were used to investigate the two main effects and the
interaction effect for the total test and for six food/measurement types (each calculated
two different ways, by difference and by absolute value, as described in Chapter 4).
For the comparison study, the test scores of two groups of subjects from the
main study (Groups 2 and 4), plus all subjects from the pHot study, were compared
44
(Chapter 5: Comparison Study). These subjects were administered a second posttest
six months after their original posttests to address the questions of retention and
application of portion size estimation knowledge. A modified Solomon four-group
design was used, which resulted in the use of a series of mixed model ANOVAs to
statistically evaluate those data. Originally, the analysis of covariance (ANCQV A)
was the statistical procedure chosen to evaluate those data, using the first posUest as
the covariate. It was subsequently determined that ANCOV A was not an appropriate
procedure for analyzing those data because the first posUest did not meet the
requirements necessary for a covariate in this context. According to Hays (64) and
Neter and Wasserman (65), the values of the covariate are assumed to have no
relation to the experimental levels, and the relationship between the X (covariate: first
posttest) and Y (dependent variable: second posttest) variables is assumed to be
constant across all of the experimental levels. Further, the covariate should be
observed before the treatment is administered. The subjects in these studies were
assigned to their experimental groups and administered the treatment (or not, as in the
case of the control groups) before receiving the first post test (the covariate).
Therefore, ANCOV A could not be used. Instead, the mixed model ANOV As were
designed to evaluate the main effects of group, test occasion and foodform, and the
interaction effects of group by test, group by foodform, foodform by test and group
by foodform by test. Significant effects were followed up using the Tukey's HSD test
and orthogonal contrasts. Alpha was set at the .05 level for all comparisons. The
Bonferoni's method was used to determine the p-value for significant contrasts (.05

45
divided by 3 contrasts per analysis equals a p-value of .016). Refer to Chapter 5:
Compar1son Study for a description of these procedures.
CHAPTER 3
Pilot Study
46
A pilot study, using subjects recruited for a separate research project, was
conducted as the development process for the main study reported in this document.
The purpose of the main study was to test the effectiveness of portion size estimation
training on improving subjects' ability to accurately estimate portion sizes of foods.
Subjects
The subjects used for the pilot study were 57 Caucasian (non-Hispanic)
premenopausal women between the ages of 28 and 42 who participated in a separate
study designed to investigate the impact of resistance exercise on bone mineral
content. For that study, the subjects were required to record their dietary intake,
using an estimated diet record, for four randomly assigned days within a four-week
period at three time points: five months, twelve months, and eighteen months. As
part of the dietary protocol, each subject was required to attend a training session
which was designed to provide directions for completion of the diet records, including
training on how to estimate portion sizes of foods.
Methods
Ponion Size Estimation Training
All 57 subjects participated in the portion size estimation training program.
Subjects were trained in groups of 4-16 persons per session; usually 6-8 persons
attended per session. The training sessions were scheduled such that each subject was
trained 1-14 days prior to beginning her first day of recording her dietary intake using

47
an estimated diet record.
The training program consisted of three parts: 1) a measurement activity using
real foods, 2) an estimation activity using food models, and 3) an estimation activity
using dimensions, rather than standard household measures, to quantify amounts of
foods.
For the first part, the subjects sat around a table where individual place
settings were arranged. At each place setting, the following items were provided for
the measurement training activities: a clear glass; a coffee cup; a 5-ounce paper cup;
a clear, 2-cup liquid measuring cup; a set of nested, dry measuring cups; a set of
measuring spoons; a rubber spatula; a large serving spoon; and a paper plate (which
was traded for a clean plate several times during the course of the training session).
Also placed at each place setting, were a pencil and a form for checking off each food
item as it was measured (Station #1: Measurement Activity for Portion Size
Estimation Training, Appendix A). Placed in the middle of the table, and at each
end, were large bowls of popcorn and dry red beans, plastic pitchers of lemonade,
plastic bottles of Italian dressing, and . large jars of mayonnaise and applesauce. The
subjects were asked to measure designated amounts of six foods, in order, as directed:
two liquids (lemonade and italian dressing), two solids (dry beans and popcorn), and
two amorphous foods (applesauce and mayonnaise). For the solid and amorphous
foods, the subjects were asked to measure out the amount of food specified, then
scoop the food onto a plate. They were then asked to view the food and indicate
whether the amount on the plate appeared to be more, less, or about the same as the
48
amount measured. The subjects were then asked to measure out the same amount of
the food again and to deposit this additional amount on top of the food already on the
plate. Each time a food was put on the plate it was viewed mounded first, then
spread out on the plate. The mounding, spreading, and doubling of the amount of
food was done for each food. The plate was cleaned, or new plate was provided,
between food measurements. The subjects were instructed to observe each measured
food amount carefully, in both its mounded and spread state. A discussion was
initiated regarding over- and under-estimation of food quantities for each food.
For one of the liquids, the Italian salad dressing, the subjects were asked to
measure out a specific amount, then pour it into the 5-ounce paper cup for viewing.
The same procedure was then followed as was used for the solid and amorphous
foods. For the other liquid, lemonade, the subjects were asked to pour an amount of
their choice into the clear glass and estimate, in fluid ounces or cups, the volume of
the liquid in the glass. They recorded their estimates on the form, then poured the
lemonade into the glass measuring cup to determine the correct volume. This
procedure was repeated using the coffee cup. A discussion of over- and under
estimation, conducted the same as for the solid and amorphous foods followed this
activity. The subjects were instructed to measure all liquids at eye level, to level-off
the solid measurements, and not to pack the solids.
For the second part of the training program, twelve food models, representing
solid, liquid and amorphous food types, were displayed on a large table. The subjects
stood around the table to view the display. They were given a second form, Station

49
#2: Food Models Activity for Portion Size Estimation Training (Appendix B) on
which to record their responses for this activity. Specifically, the subjects were asked
to estimate the quantity of each food and to record those quantities in standard
household measurements on the form. (standard household measurements refer to
cups, tablespoons, etc.) When estimates were complete, the correct quantities were
displayed on cards, and a discussion of estimation techniques and the subjects' over
and under-estimation trends (or lack of trends) was generated. The food models used
for this part of the training are presented in Table 1.

Table 1: Food Models Used for Portion Size Estimation Training
Food Model Food Type Quantity
Spaghetti Solid 1 cup
Coleslaw Solid 112 cup
French Dressing Amorphous l 1 tablespoon
Macaroni Solid 112 cup
Spinach Solid 112 cup
Beef Stew Solid 1 cup
Kidney Beans Solid Vs cup
Iced Tea (real)2 Liquid 1112 Cups 12 fluid ounces
Pudding Amorphous l 1 cup
Cauliflower Solid 1,4 cup
Tossed Salad Solid 1 cup
Applesauce Amorphous l 112 cup
I These foods, classified as amorphous, appeared as solids in the food models 2 Real iced tea was used rather than a food model
50

51
The third part of the training introduced the use of dimensions as a technique
for quantifying amounts of certain foods (for example, a 10" diameter flour tortilla,
or a 3" x 4" X 2" piece of cornbread). Two real foods were displayed (cornbread and
a piece of ham). The dimensions of these foods varied because the training sessions,
like the tests, were spread over a six-week period, necessitating fresh food samples at
each session. The subjects were asked to estimate the dimensions of each food in
length, width and height, and to estimate the amount of the ham in ounces as well.
They were instructed to record their estimates on the form for Station #3: Dimensions
Activity for Portion Size Estimation Training (Appendix C). A measurement
demonstration, in which the correct dimensions for each food was provided, and a
discussion of dimensions measurement techniques, completed the training activities.
The entire training session took one hour to complete, regardless of the
number of subjects in the group.
Pre- and Posttests
All subjects were pretested immediately preceding the portion size estimation
training session. Immediately following the training session, they were administered
the first posttest. A second posttest was administered six months later. The purposes
of the second posttest were: 1) to determine whether some of the assumed gain in
portion size estimation ability due to training was retained up to six months after the
training, and 2) to determine whether the retention of the gain in estimation accuracy
would be greater for those subjects who also completed four days of diet records (the
25 subjects in this pilot study) than for those subjects who were trained but did not
52
complete diet records (Group 4 from the main study). These questions are addressed
in Chapter 5: Comparison Study. The pre-test for this study consisted of a display of
16 foods. These foods included two liquids (cola and coffee), 12 solids (flake cereal,
nugget cereal, puffed cereal, a hamburger patty, a slice of roast beef, a cube of
cheese, grated cheese, peas, butter, a slice of bread, an apple, and a banana), and two
amorphous foods (refried beans and peanut butter). The subjects were not provided
with specific instructions regarding the units of measurement appropriate for each
food item (the reason for this is discussed in the Experimental Design and Statistical
Procedures section on p. 55). It was hoped that the amounts of the two liquids would
be estimated in either cups or fluid ounces; the cereals, peas and refried beans in
cups; the meats and solid cheese in ounces; the grated cheese, butter, and peanut
butter in tablespoons or teaspoons; the bread in number of slices; and the fruits in
terms of small, medium or large pieces. The test form for the pretest is shown in
Appendix D.
The first and second post-tests (results of the second posttest are djscussed in
greater detail in Chapter 5: Comparison Study) contained the same types of foods, but
not the exact foods as the pretest. For example, mixed vegetables were substituted
for com, and canned pumpkin was substituted for applesauce. Two additional foods
(steak/ham and cheese) were added to the posttests for which the subjects were asked
to estimate quantities in dimensions. Because the number of food items on these tests
differed from the number of food items used in the main study (Chapter 4), only
those foods comparable to the foods used in the main study were analyzed.
53
Therefore, the following ten foods were used in the analyses for this study and for the
comparison study: juice/water, coffee/hot tea, flake cereal, nugget cereal, chicken,
corn/mixed vegetables, applesauce/pumpkin, cream cheese, steak/ham, and cheese.
The food items and food types used for the first and second posttests are shown in
Table 2.

54
Table 2: First and Second Posttests on Portion Size Estimation Used for the Pilot Study
Food Item Food Type Quantity
First Posttest Second Postiest First Posttest Second Postiest
Juice Water Liquid 10 fluid ounces 12 fluid ounces
Coffee Hot Tea Liquid 5 fluid ounces 7 fluid oun,:,es
Flake Cereal Flake Cereal Solid 1 cup % cup
Nugget Cereal Nugget Cereal Solid Ih cup v., cup
Chicken Chicken Solid 3 ounces 30z
Corn Mixed Solid o/a cup Ih cup Vegetables
Applesauce Pumpkin Amorphous o/a cup v., cup
Cream Cheese Cream Cheese Amorphous 1 tablespoon 1 tablespoon
Steak Ham Solid 5 lh"x 21h"x IA" 5 lh"x 3lh"x IA"
Cheese Cheese Solid Ilh"x l"x 1" 2"x 1 "x 1"

All tests were self-administered (see Appendices D, E and F). The subjects
were given as much time as they needed to complete their estimations, although no
one required more than 15 minutes per test. They were instructed not to speak to
each other during the tests, and to direct their questions to the investigator.
Experimental Design and Statistical Procedures
55
All subjects in this study were trained in portion size estimation; therefore, a
one-group, pretest-posttest design was used. Dependent (paired) t-tests were planned
to compare the subjects' accuracy of estimation before and after the training by total
test score and by score for each food type (solid vs. liquid vs. amorphous).
However, it was not possible to perform these analyses because the pretests proved to
be uncode-able. This was due to several errors discovered during the test
development process. First, one of the original goals of testing the effectiveness of
the portion size estimation training was to determine whether individuals know what
unit of measurement to use to report a specific food quantity. For example, it is
appropriate to report dry cereal in cups. As expected, many individuals reported dry
cereal on the pretest in terms of small, meditlm or large servings or bowls. Because
this type of reporting error was expected, part of the training program was aimed at
instructing the participants in what units of measurement were appropriate and
acceptable for each food type. The training did succeed in that no errors of this
nature appeared on any posttest, but since it was impossible to assign a specific
quantitative value to such qualitative descriptions on the pretest, it was impossible to
compare changes in estimation from pretest to posttest. Second, while many

56
individuals used quantitative units of measurement to report their estimations, they
used these units inappropriately. For example, many individuals reported dry cereal
in ounces, believing, incorrectly, that eight weighted ounces always equal one cup
since eight fluid ounces equal one cup. Again, this type of error was expected and
instruction aimed at correcting the error was included in the training session. But
even though in most cases when an individual reported eight ounces of dry cereal she
meant one cup of cereal, we could not assume that this was always the case. If
comparisons between the pre- and posttests were made based on reported quantities of
eight ounces on the pretest vs. one ounce on the posttest, when in reality the
individual meant One cup on ooin iesis, a grossly overestimated rate of improvement
in estimation ability would have been found. Because of these flaws in the design of
the tests used for the pilot study, the unit of measurement appropriate for each food
item was specified on all tests conducted for the main study.
Scores for the two posttests were calculated for 25 of the 57 subjects; posttests
for the remaining 32 subjects were also unusable. Only those tests reporting the
liquid estimations in fluid ounces were used (more subjects used fluid ounces than
cups; one unit of measurement had to chosen for the purpose of comparing this pilot
data to the data from the main study). Also, many subjects persisted in reporting
solid foods in ounces (mis-interpreting ounce vs. volume measurements).
Results and Discussion
The mean percent error of estimation for each of the 16 dependent variables
was calculated in two ways. "D-Means" were calculated as the quantity of each food
57
item (or each food variable) estimated by the subject, minus the correct quantity,
divided by the correct quantity, times 100. This was computed by food item/variable
for each subject, all percent estimations were summed, then divided by the total
number of subjects who took the test (n=25). This procedure allowed for positive
and negative values (over- and underestimations) which, when summed, canceled out
some of the error. "Ab-Means" were calculated following the same procedure except
that negative signs were ignored, providing the absolute value percent error (the total
magnitude of error regardless of over- or underestimation).
The mean percent error of estimation for each food item (or food variable, i.e.
steak, length in inches) for the two posttests are presented in Table 3. As shown in
Table 3, the ten foods used for the two posttests translated into 16 dependent
variables. The range of error for the D-Means on the first posttest was -23.8% to
+54.5 %. The range of error for the D-Means on the second posttest was narrower at
-10.8% to +40.7%. Overall, the trend in estimation error was for overestimation,
rather tllan underestimation. Of the five foods which were underestimated on the first
posttest, the magnitude of estimation error for three of them (flake cereal,
applesauce/pumpkin, and cream cheese) remained relatively the same, but the
direction of the error changed to overestimation on the second posttest.
The range of error on the first posttest for the Ab-Means was 3.2% to 71.3%.
The range of error on the second posttest for the Ab-Means was 3.9% to 51.2%.

58
Table 3: Mean Percent Error ± SDs for Each Food or Food Variable Calculated Using Over- and Underestimation Errors ("0" Means) R.'1d the Absolute Value Errors (" Ab" Means) for Posttest 1 and Posttest 2.
Food or Food or Posttest 1 Posttest 2 Food Measurement Variable Type D·Mean Ab·Mean D·Mean Ab·Mean
JuicelWatel', Liquid .4±14.6 10.8±9.S O±18.6 12.0±14.0 fluid ounces
Coffeerrea, fluid Liquid 20.8±26.8 27.2±19.9 14.9±34.9 2S.1±28.1 ounces
Flake Cereal, Solid -7.7±27.2 17.7±21.7 14.6±32.0 28.2±20.4 cups
Nugget Cereal, Solid 19.9±42.0 30.6±34.6 4O.7±S9.6 S1.2±SO.S cups
Chicken, ounces Solid'" 7.3±3S.4 3.2±1.1 30.7±47.1 3.9± 1.4
CornlMixed Solid -14.7±19.3 22.1±9.5 -4.9±18.9 1O.O±16.7 Vegetables, cups
Applesauce/ Amorphous -23.8±11.8 24.9±9.2 29.0,±28.9 32.8±24.2 Pumpkin, cups
Cream Cheese, Amorphous -13.1±49.8 37.1±35.0 17.0±49.9 31.0±42.3 tablespoons
Steak, length in Dimensions 1.8±13.9 12.0±6.8 -3.6±20.2 17.5±10.1 inches
Steak, width in Dimensions 4.0±20.0 16.8±11.1 -10.8±17.8 16.9±11.8 inches
Steak, height in Dimensions 38.6±50.1 42.7±46.5 20.6±47.1 30.9±40.8 inches
Steak, total in Dimensions 54.5±77.4 71.3±61.6 4.5±51.9 39.3±33.3 cubic inches
Cheese, length in Dimensions 3.3±28.9 18.0±22.5 4.5±18.7 8.5±17.2 inches
Cheese, width in Dimensions 13.0±36.9 21.0±32.8 S.5±25.0 9.5±23.7 inches
Cheese, height in Dimensions ·IO.O± 19.1 10.0±19.1 O±16.1 6.0±14.9 inches
Cheese, total in Dimensions 32.2±99.4 60.1±84.8 17.5±65.5 28.0±61.6 cubic inches
'" Not included in analysis by food type.

59
The total test scores (D-Total and Ab-Total), and scores for four
food/measurement types, were calculated two ways. D-Total was calculated by
subtracting the correct quantity for each food item from the quantity reported by each
subject. This value was divided by the correct quantity, then multiplied by 100 to
obtain the total error of estimation reflected as a percentage of 100% (correct
quantity). D-Total, therefore, reflects both over- and underestimations (+ and -
scores). Ab-Total was calculated following the same procedure, but positive and
negative signs were ignored, thus providing the absolute value of the percent error of
estimation. "D-Liquid and Ab-Liquid, fluid ounces" were calculated by adding the
scores for juice/water and coffee/hot tea (for the group) estimated in fluid ounces and
dividing that sum by 2. Calculations for the other food/measurement types followed
the same procedure: s,umming the scores, then dividing by the number of scores for
each foodimeasurement type. The estimations for flake cereal, nugget cereal and
com/mixed vegetables were used to calculate tiD-Solid and Ab-Solid, cups"; the
length, width, height, and total cubic inch estimations for steak/ham and cheese were
used to calculate tiD-Solid and Ab-Solid, inches"; and the estimations for
applesauce/pumpkin and cream cheese were used to calculate "D-Amorphous and Ab
Amorphous, cups or tablespoons". The estimation of chicken in weighted ounces was
not used for the analyses by food type.

60
Table 4: Results of Paired t-tests Comparing the Mean Percent Estimation Error on the First and Second Posttests Using the D-Values
Mean ± SD Test Variable p-value
First Posttest Second PosHest (%) (%)
D-Totall 7.9±16.1 11.3±13.8 .365
D-Liquid, fluid ounces 10.6±16.9 7.4±22.6 .589
D-Solid, cups -o.8±21.9 16.8±31.8 .004'"
D-Amorphous, cups or tablespoons -18.5±25.9 23.0±26.7 .000'"
D-Dimensions, inches 17.2±29.6 4.8±18.4 .035'"
'" Significant p-value at level specified I D-Total = Quantity of each food item reported by the subject, minus the correct quantity, divided by the correct quantity, times 100. This was added for each item on the test, then divided by the total number of items on the test, for a total test score for each subject and each group.
Table 5: Results of Paired t-tests for 25 Subjects Comparing the Mean Percent Estimation Error on the First and Second Posttests Using the Ab-Values
Mean ± SD Test Variable p-value
First Posttest S~ond Posttest (%) (%)
Ab-Total l 27.6±11.7 23.6±10.5 .140
Ab-Liquid, fluid ounces 16.6±10.8 15.5±17.8 .808
Ab-Solid, cups 17.7±12.5 27.1±23.2 .088
Ab-Amorphous, cups or 26.6±17.0 25.0±24.7 .768 tablespoons
Ab-Dimensions, inches 26.1±21.7 14.8±11.6 .016'"
'" Significant p-value at level specified lAb-Total = Same procedure as for D Total, only all plus and minus (over- and underestimationsigns were ignored, and the absolute value of the quantity reported by the subject was used.

61
Paired t-tests revealed four significant differences in scores from the first
posttest to the second posttest over the six month period between tests (fables 4 and
5). The mean error of estimation for solid foods estimated in cups increased from
-0.8% to 16.8% (p=.004) using the "D" method (D-Solid, cups). The mean
estimation error for amorphous foods using the "D" method changed from a mean
underestimation error of -18.5% to a mean overestimation error of 23.0% (p=.OOO).
For solid foods estimated by dimensions, a decrease in mean estimation error occured
using both the "D" method and the "Ab" method. Using the "D" method, the mean
estimation error decreased from 17.2% to 4.8% (p=.035). Using the "Ab" method,
the mean estimation error decreased from 26.1 % to 14.8% (p=.016).
Only one of the four variables for which a significant difference was found
between tests (D-SoIid, cups) reflected an increase in estimation error over the six
months between tests. Both D-Dimensions and Ab-Dimensions reflected a decrease in
estimation error for the solid foods estimated in inches (length, width, height, and
total cubic inches). Some of this improvement in portion size estimation accuracy
may be attributable to the application of ability through the completion of four days of
estimated diet records. Conversely, the increase in estimation error for solids
estimated in cups may be due to loss of estimation ability over time despite
application of ability. It is impossible to assess whether this loss of estimation ability
returned the subjects to their pre-training ability level, or whether only part of the
assumed gain in estimation ability due to training was lost (refer to the Experimental
Design and Statistical Procedures section, p. 55).

Subjects
CHAPI'ER 4
Main Study
62
Sixty-six Caucasian (non-Hispanic) women between the ages of 28 and 42
years were recruited for the main study. These age, gender and ethnicity inclusion
criteria were chosen in order to make direct comparisons (Chapter 5, Comparison
Study) with subjects recruited for the pilot study (Chapter 3). These 66 subjects were
recruited from the screening questionnaires completed by individuals who were not
accepted for the bone mineral study (pilot study) based on the medical exclusion
criteria for that study. Therefore, all subjects for both studies came from the same
general sample.
Methods
Experimental D,esign
A true experimental design, the Solomon four-group design, was used to
investigate the main effect of the treatment (portion size estimation training), the main
effect of testing, and the interaction effect of treatment and testing. The requirements
for this design are: 1) subjects are randomly assigned to one of four different groups,
2) two of the groups receive the treatment (treatment groups) and two of the groups
do not receive the treatment (control groups), 3) only one of the treatment groups and
one of the control groups are administered the pretest, and 4) all four groups are
administered the posttest (37). A diagram of the Solomon four-group design is
presented in Figure 1.
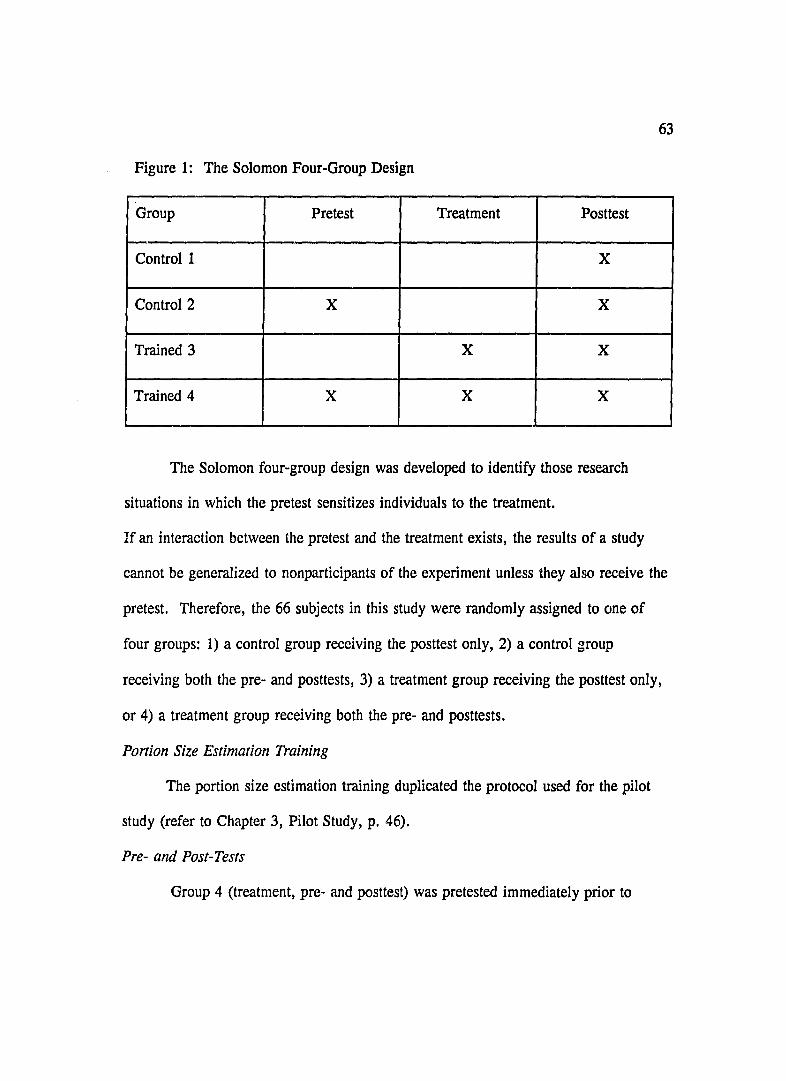
Figure 1: The Solomon Four-Group Design
Group Pretest Treatment Posttest
Control 1 X
Control 2 X X
Trained 3 X X
Trained 4 X X X
The Solomon four-group design was developed to identify those research
situations in which the pretest sensitizes individuals to the treatment.
63
If an interaction between the pretest and the treatment exists, the results of a study
cannot be generalized to nonparticipants of the experiment unless they also receive the
pretest. Therefore, the 66 subjects in this study were randomly assigned to one of
four groups: 1) a control group receiving the posttest only, 2) a control group
receiving both the pre- and posttests, 3) a treatment group receiving the posttest only,
or 4) a treatment group receiving both the pre- and posttests.
Ponion Size Estimation Training
The portion size estimation training duplicated the protocol used for the pilot
study (refer to Chapter 3, Pilot Study, p. 46).
Pre- and Post-Tests
Group 4 (treatment, pre- and posttest) was pretested immediately prior to

64
participating in the training program. Both Groups 3 (treatment, posttest only) and 4
were posttested immediately after the conclusion of their training sessions. Group 2
(control, pre- and posttest) and Group 1 (control, posttest only) were administered the
posttest simultaneously to the post-testing of Groups 3 and 4. The pretest for Group
2 was administered within one week before the posttest. Pre- and posttests were
administered to groups of 4-8 subjects at a time over a six-week period.
The pretest consisted of a display of nine foods: two liquids (milk and tea),
four solids (steak, cake with icing, flake cereal and peas), and thrtxl amorphous foods
(refried beans, cottage cheese and ranch salad dressing). This translated into 18
dependent variables: two liquids, estimated in both cups and fluid ounces (4
variables); two solid foods, flake cereal and peas, estimated in cups (2 variables);
two solids, steak and cake, estimated in dimensions (length, width, and height, and
total cubic inches; 8 variables;) one solid food, steak, estimated in ounces (1
variable); and three amorphous foods, estimated in cups or tablespoons (3 variables).
The posttest was identical to the pretest, with one exception: the dimensions of the
steak and cake were not exactly the same for all test dates. This is because the test
dates were spaced several days apart over a six-week period in order to accommodate
the schedules of the subjects. Therefore, fresh steak had to be purchased, and a new
cake baked, for each test date. The amount of each food used in the pre- and
posttests is presented in Table 6.

65
Table 6: Pre- and Posttest on Portion Size Estimation
Food Item Food Type Quantity
Milk Liquid lliz cups 12 fluid ounces
Hot Tea Liquid ~ cup 6 fluid ounces
Steak Solid Examples: 3" x 3" x I/.z"
3 ounces
Cake with Icing Solid Ex: 3" x 2" x 1"
Flake Cereal Solid 1 liz cup
Refried Beans Amorphous liz cup
Cottage Cheese Amorphous ~ cup
Peas Solid % cup
Ranch Dressing Amorphous 2 tablespoons

66
All tests were self-administered (see Appendix G). The subjects were given
as much time as they needed to complete their estimations, although no one required
more than 10 minutes per test. They were instructed not to speak to each other
during the tests, and to direct their questions to the investigator.
Statistical Procedures
Fourteen separate 2x2 ANOVAs (analysis of variance) were performed to test
for three effects: the main effect of training, the main effect of testing, and the
interaction of training and testing. Two of the ANOVAs tested these effects for the
total test scores (D-Total and Ab-Total, see the Results section below for definitions).
The other twelve ANOV As were designed to test the three effects by food or
measurement type: liquid in fluid ounces (D-Liquid, fluid ounces and Ab-Liquid, fluid
ounces), liquid in cups (D-Liquid, cups and Ab-Liquid, cups), solid food in ounces
(D-Solid, ounces and Ab-Solid, ounces), solid food estimated by dimensions (D-Solid,
inches and Ab-Solid, inches), solid foods estimated in cups (D-Solid, cups and Ab
Solid, cups), and amorphous foods estimated in cups or tablespoons (D-Amorphous,
cups or tablespoons and Ab-Amorphous, cups or tablespoons).
All subjects completed a participant information questionnaire on the day of
their first test (Appendix H). The questionnaire included demographic information
and information regarding the subject's experience with food handling and a brief
survey of food consumption (directed specifically at the types of foods on the pre- and
posttests). All subjects gave written informed consent to participate in the study
(Appendix I). The protocol was exempt from human subjects committee review

67
(Appendix J).
Results and Discussion
The mean total test score for each individual and each group was calculated
two different ways. "D-Total" was calculated by subtracting the correct quantity for
each food item from the quantity reported by each subject; this value was divided by
the correct quantity, then mUltiplied by 100 to obtain the total error of estimation
reflected as a percentage of 100% (correct quantity). D-Total, therefore, reflects both
over- and underestimations (+ and - scores). "Ab-Total" was calculated following
the same procedure, but positive and negative signs were ignored, thus providing the
absolute value of the percent error of estimation. "D-Liquid and Ab-Liquid, fluid
ounces" were calculated by adding the scores for milk and tea estimated in fluid
ounces and dividing that sum by 2. Calculations for the other food/measurement
types followed the same procedure: summing the scores, then dividing by the number
of scores for each food/measurement type. Milk and tea were also used to calculate
"D-Liquid and Ab-Liquid, cups". The estimations for peas and cereal were used to
calculate "D-Solid and Ab-Solid, cups"; the weighted ounce estimations of steak were
used to calculate "D-Solid and Ab-Solid, ounces"; the length, width, height, and total
cubic inch estimations for steak and cake were used to calculate "D-Solid and Ab
Solid, inches"; and the estimations for refried beans, cottage cheese, and Ranch
dressing were used to calculate "D-Amorphous and Ab-Amorphous, cups or
tablespoons". Tables 7-10 show the pre- and posttest means for each of the 18
dependent variables for the four experimental groups. Tables 11 and 12 show the

pre- and posttest means for the total test scores (D-Total and Ab-Total) and for each
food or measurement type.
68

I
Table 7: Mean Percent Error ± SDs for Each Food or Food Variable Calculated Using Over- and Underestimation Errors (WD- Means) and the Absolute Value Errors (WAbW Means) for the First Posttests for Group 1.
Group 1: Control, Posttest Only (n=16)
Postle8t I Food or
Food or Food Variable Measurement D-Mean($) Ah-Mean($) Type
Milk, cups Liquid- 6.3±20.1 14.6±l4.8
Milk, fluid ounces Liquid 2.1±19.1 14.6±14.8
Tea, CUP! Liquid- 13.1±22.4 20.3±IS.8
Tea, fluid ounces Liquid IO.4±2305 18.6±17.1
Cereal, cups Solid -8.0±20.1 14.3±16.0
Peas, cups Solid 37.3±38.8 46.4±26.4
Refried Beans, cups Amorphous 34.3±4S.4 44.8±34.3
Cottage Chee!le, cups Amorphous 52.1±4505 52.1±45.S
Ranch Dreaaing, Amorphoua lOO.O±63.2 lOO.O±63.3 tablespoons
Steak, ounces Solid- 77.6±69.4 83.9±61.0
Steak, length in inches Di~nsions IOo5±l2.0 12.7±905
Steak, width in inchea Dimensions 8.7±lS.9 12.6±12.7
Steak, height in inches Dimensions 37.4±SO.O 43.6±44.2
Steak, total in cubic inches Dimensions 69.8±87.1 7805±78.7
Cake, length in inches Dimensions IS.l±19.8 lS.l±19.8
Cake, width in inches Dimensiona 1l.3±17.8 13.8±lS.9
Cake, height in inches Dimensions -1.9±20.2 13.1±lS.1
Cake, total in cubic inches Dimensions 31.0±67.4 41.7±61.0
- Not included in analysis by food type
i
;
$

Table 8: Mean Percent Error ± SDs for Each Food or Food Variable Calculated Using Over- and Underestimation Errors rDw Means) and the Absolute Value Errors r Ab w Means) for the Pretest and Both Posttests for Group 2.
Group 2: Control, Pre- and Posttests
Pretest (n= 19) Post:est 1 (n=l7) Posttest 2 (n= 14) Food or
Food or Food Variable Measurement D-Mean(%) Ab-Mean(%) D-Mean(%) Ab-M=(%) D-Mean(%) Ah-Mean(%) Type
Milk, cups Liquid· 11.7±21.9 19.9±14.4 6.9±2l.3 16.7±14.4 14.3±20.5 19.0±15.8
Milk, fluid ounces Liquid 17.5±52.6 19.9±14.4 8.3±37.!i 16.7±14.4 15.S±48.7 19.0±15.8
Tea, cups Liquid· 19.3±20.2 22.8±lS.9 13.7±23."T 21.6±16.4 23.3±28.9 28.1±23.9
Tea, fluid ounces Liquid 26.8±49.1 38.2±40.4 23.5±5U 35.3±43.3 23.8±46.6 31.0±41.8
Cereal, cups Solid 4.4±28.8 23.7±16.0 3.3±25.ti 20.3±15.2 5.1±20.7 13.9±l5.8
Peas, cup~ Solid 70.7±59.2 70.7±S9.2 52.9±55.!. 5S.6±48.5 67.7±S7.0 67.7±57.0
Refried Beans, cups Amorphous 70.9±76.0 79.S±66.1 46.0±46.11 54.0±35.6 82.1±50.4 82.1±50.4
Cottage Cheese, cups Amorphous 71.9±56.9 75.4±5I.9 64.7±46A 64.7±46.4 81.7±46.5 81.7±46.5
~nch Dressing, Amorphous 118±90.0 llS.4±90.1 lOS.9±68.2 105.9±68.2 88.1±61.5 90.5±S7.6 tablespoons
Steak, ounces Solid· 87.8±87.5 95.3±78.S 79.4±63.7 81.7±60.4 83.6±90.2 86.2±S7.6
Steak, length in inches Dimensions 2.8±lS.4 13.4±12.5 O.6±lU 6.4±9.2 7.1±24.2 19.0±15.S
Steak, width in inches Dimensions 6.3±15.5 12.4±10.9 6.9±20.I 16.5±l2.9 17.9±25.7 22.6±21.3
Steak, height in inches Dimensions 19.1±28.S 19.1±28.8 1.2±25.2 14.1±20.6 25.0±51.0 32.1±46.4
Steak, telal in cubic inches Dimensions 35.7±68.0 46.7±60.6 32.4±55.9 52.4±36.3 81.4±140.6 lOl.3±126.0
Cake, length in inches Dimensions -3.5±20.6 9.5±8.9 -8.8±16.~; 12.7±13.9 10.1±33.4 26.8±21.2
Cake, width in inches Dimensions -4.5±20.6 12.9±16.4 -2.9±17.2: 13.5±10.6 22.9±30.9 28.6±25.3
Cake, height in inches Dimensions -O.9±23.2 14.9±l7.5 -!2.7±29.1 26.5±16.6 O±35.9 25.7±24.1
Cake, total in cubic inches Dimensions -4.8±40.4 31.1±25.3 -19.8±43.0 42.9±l7.4 58.3 ± 149.5 86.5±l34.0
• Not included in analysis by food type
I
i
~

Table 9: Mean Percent Error ± SDs for Each Food or Food Variable Calculated Using Over- and Underestimation Errors (-D" Means) and the Absolute Value Errors (-Ab- Means) for the First Posttet.1s for Group 3.
Group 3: Trained, Pasttest Only (n= (9)
Posttest 1 Food or
Food or Food Variable Measurement D-Mean (%) Ab-Mean(%) Type
Milk, cups Liquid· 3.8±19.4 13.S±13.9
Milk, fluid ounces Liquid 7.9±2S.5 13.S±13.9
Tea, cups Liquid· 14.1±22.7 19.2±lS.4
Tea. fluid ounces Liquid 16.7±20.S lS.4±19.2
Cereal, cups Solid -12.3±2S.S 2S.1±12.5
Peas,cups Solid 2.1±29.4 22.5±lS.4
Refried Beans, cups Amorphous lS.1±30.3 21.7±27.7
Collage Cheese, cups Amorphous 22.0±35.3 1 34.1±23.1 ) Ranch Dressing, Amorphous 41.4±39.5 i 50.7±25.8 tablespoons
I Steak, ounces Solid· 67.6±45.3 67.6±45.3
Steak, length in inches Dimensions 5.9±l7.9 1 13.7±12.6
Steak, width in inches Dimensions 6.7±12.2 l 11.7±7.3
Steak, height in inches Dimensions 5.4±36.3 24.1±27.0
Steak, total in cubic inches Dimensions 24.0±S2.7 59.2±61.3
Cake, length in inches Dimensions -O.7±19.5 14.0±13.2
Cake, width in inches Dimensions 2.0±lS.3 14.l±1l.3
Cake, height in inches Dimensions l.8±22.S 15.S±16.2
Cake, total in cubic inches Dimensions lO.5±63.7 44.5±45.6 _._-
--.-----~ --
• Not included in analysis by food type
I
i
I
.....:J I--

Table 10: Mean Percent Error ± SDs for Each Food or Food Variable Calculated Using Over- and Underestimation Errors (-D- Means) and the Absolute Value Errors r Ab- Means) for the Pretest and Both Posttests for Group 4.
Group 4: Trained, Pre- and Posttests
Pretest (n= 14) Post!est 1 (n= 14) Posttest 2 (n= 14) Food or
Food or Food Variable Measurement D-Mean (%) Ab-Mean(%) D-Mean(%) Ab-Mean(%) D-Mean(%) Ab-Mean($) Type :
Milk, cups Liquid· 13.l±3S.3 27.4±25.0 : -3.6±16.2 8.3±14.2 lL9±33.6 2L4±28.1
Milk, fluid ounces Liquid 6.4±37.6 27.4±25.0 -3.6±16.2 8.3±14.2 4.l±27.1 21.4±28.1
Tea, cups Liquid· 34.9±43.2 36.6±4L6 2L4±28.1 2L4±28.1 32.l±42.7 34.6±40.5
Tea, fluid ounces Liquid 25.6±49.4 30.8±46.1 22.6±27.4 22.6±27.4 13.1±26.3 34.6±40.5
Cereal, cups Solid L2±SL3 27.4±42.7 -8.3±20.4 IS.5±15.3 -7.1±43.2 31.0±29.9
Peas, cups Solid 44.2±60.S 5Ll±54.3 2.8±34.6 30.5±14.3 25.3±46.4 42.9±29.4
Refried Beans, cups Amorphous 67.9 ± 77.5 67.9±77.5 9.4±3S.2 19.1±30.6 28.4±S9.4 33.3±56.6
Cottage Cheese, cups Amorphous 52.4±58.1 52.4±58.1 12.6±43.6 30.3±32.9 35.7±53.1 40.5±49.2
Ranch Dressing, Amorphous 57.1±64.6 57.1±64.6 33.9±36.l 41. l± 27.0 35.7±36.3 35.7±36.3 tablespoons
Steak, ounces Solid· 76.3±83.3 76.3±83.3 Ii 70.9±49.9 70.9±49.9 47.4±48.4 49.9±45.3
Steak, length in inches Dimensions -L5±16.5 12.6±IO.1 ~ 5.5±14.4 9.8± 1 1.7 17.9±24.0 203±2L9
Steak, width in inches Dimensions -O.5±l5.1 lLl±9.8 [ 7.4±17.i' 13.5±l3.2 15.7±27.3 24.1H19.8
Steak, height in inches Dimensions LI±37.9 20.3±3I.5 17.1±48.1 29.l±4L4 16.0±36.2 16.0±36.2
Steak, total in cubic inches Dimensions -2.5±41.9 32.8±24.5 38.8±98.0 61.4±84.6 73.6±122.0 83.3±l14.8
Cak.:, length in inches Dimensions -2.3±17.8 13.9±W.8 -1.2± 1 1.2 7.7±8.0 0.6±25.4 19.6±15.2
Cake, width in inches Dimensions 4.3±18.2 14.3±lL4 1.4±16.2 12.l±10.3 7.6±33.4 25.7±21.5
Cake, height in inches Dimensions 14.9±3Ll 20.9±27.1 8.3±20.4 15.5±15.3 10.0±45.6 32.9±32.0
Cake, told in cubic inches Dimensions 20.2±S2.0 40.5±37.2 9.8±36.5 27.0±25.6 4L6±1l9.1 87.7±88.1
• Not included in analysis by food type
! I I I
I
-....) t-..)
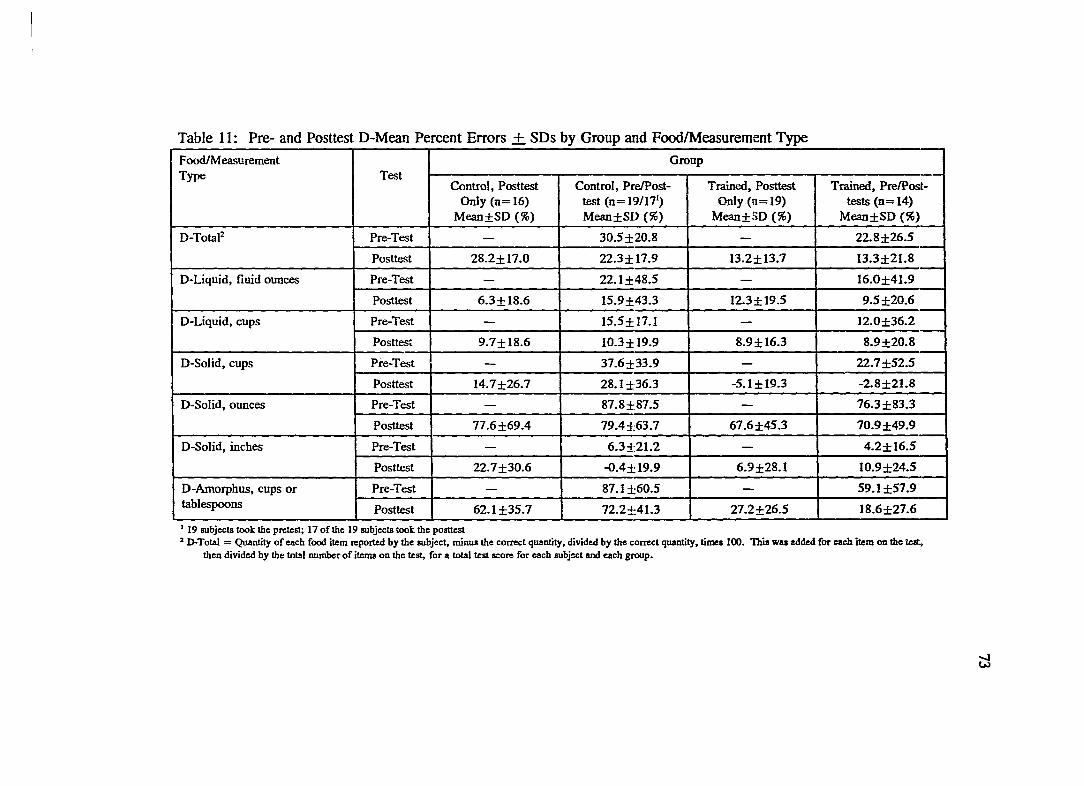
Table 11: Pre- and Posttest D-Mean Percent Errors + SDs by Group and Food/Measurement Type
Food/Measurement Group Type Test
Control, Posttest Control, PreIPost- Trained, Posttest Trained, PrelPost-Only (n=16) test (n= 19/171) Only (1[1=19) tests (n= 14)
Mean±SD (%) Mean±SD (%) Mean±SD (%) Mean±SD (%)
D-Tota12 Pre-Test - 30.S±20.8 - 22.8±26.5
Posttest 28.2±17.0 22.3±17.9 13.2±13.7 13.3±21.8
D-Liquid, fluid ounces Pre-Test - 22. 1 ±48.5 - 16.0±41.9
Posttest 6.3±18.6 lS.9±43.3 12.3±19.5 9.5±20.61 -D-Liquid, cups Pre-Test - IS.S±17.1 -- 12.0±36.2
Posttest 9.7±18.6 10.3±19.9 8.9±16.3 8.9±20.8
D-Solid, cups Pre-Test - 37.6±33.9 - 22.7±S2.5
Posttest 14.7±26.7 28.1±36.3 -5.1±19.3 -2.8±21.8
D-Solid, ounces Pre-Test - 87.8±87.5 - 76.3±83.3
Posttest 77.6±69.4 79.4±63.7 67.6±4S.3 70.9±49.9
D-Solid, inches Pre-Test - 6.3:±:21.2 - 4.2±16.S
Posttest 22.7±30.6 -O.4±19.9 6.9±28.1 IO.9±24.5
D-Amorpbus, cups or Pre-Test - 87.1±60.5 - S9.1±S7.9 tablespoons Posttest 62.1±3S.7 72.2±41.3 27.2±26.S 18.6±27.6
I 19 subjects took the prelest; 17 of the 19 subjects took the pOstlest 2 D-Total = Quantity of each food ilem reported by the subject, minus the correct quantity, divided by the correct quantity, times 100. This was added for each item on the leIt,
then divided by the: totsl number of ilems on the lest, for a total lest score for each subject and each group.
~

Table 12: Pre- and Posttest Ab-Mean Percent Errors + SDs by Group and Food/Measurement Type
F~easurernent Group Type Test
Control, Posttest ContlOl, PrelPost- Trained, Posttest Tmned. Pre/Post- : Only (n=16) test (n=19;17 I
) Only (n=19) tests (n=14) Mean±SD (%) MeilD±SD (%) Mean±SD (%) Mean±SD (%) I
Ab-Tota12 Pre-Test - 41.2±13.1 - 33.5±22.1
Posttest 3S.S±14.6 37.3±12.8 27.2±9.9 24.8±16.4
Ab-Liquid, fluid ounces Pre-Test - :l7.S±37.2 - 28.8±33.6
Posttest IS.6± 11.3 :11.1±33.3 IS.8±16.6 lS.5±16.3
Ab-Liquid, cups Pre-Test - 2.0.6±9.6 - 27.2±33.6
Posttest 17.4±11.0 18.3±12.6 14.1±11.8 14.9±16.7
Ab-Solid, cups Pre-Test - 40.5±30.1 - 33.2±46.1
Posttest 24.6±17.2 36.0±27.8 16.7±1O.1 18.9±1O.0
Ab-Solid, ounces Pre-Test - 65.3±78.8 - 76.3±83.3
Posttest 83.9±61.0 81.7±60.4 67.6±4S.3 70.9±SO.O
Ab-Solid, inches Pre-Test - IS.2±lS.7 - 13.3±1O.0
Posttest 24.9±28.7 16.4±10.6 21.0±19.3 16.3±21.0
Ah-Amorphus, cups or Pre-Test - B7.1±60.5 - S9.1±S7.9 tablespoons Posttest 62.1±3S.7 72.2±41.3 30.4±22.5 25.6±20.7
I 19 subjects took the pretest; 17 of the 19 subjects lOOk the postlest 2 Ab-Total = Same procedure as for D Total. only all plus and minus (over- and underestimation-signa were ignored, and the absolute value of the qUSlllity reported by the IIUbjecl
wa8used.
~

75
Tables 13 and 14 show the results of the main effect of training for the 14
ANOV As. The D-values are shown in Table 13, and the Ab-values are shown in
Table 14. Significant differences between the control (Groups 1 and 2) and trained
(Groups 3 and 4) groups are indicated by asterisks. A significant training effect was
found using both methods of calculating the total test score: D-Total (p=.OO7) and
Ab-Total (p=.OO3). For the D-values, significant training effects were found for
solids estimated by cups (D-Solid, cups; p= .000) and amorphous foods (D
Amorphous, cups or tablespoons; p=.OOO). For the Ab-Values, significant training
effects were also found for solids estimated by cups (Ab-Solid, cups; p=.OO8) and
amorphous foods (Ab-Amorphous, cups or tablespoons; p=.OOO). The control groups
overestimated portion sizes by a mean percent error of 25.3% for D-Total and 37.9%
for Ab-Total, compared to 13.25% for D-Total and 26.0% for Ab-Total for the two
trained groups. This represented about a 12 % decrease in overall estimation error
due to training in portion size estimation. Similar decreases in estimation error due to
training were seen for the solid foods estimated in cups. For D-Solid, cups, the
control groups overestimated portion sizes by 21.4%, compared to an underestimation
of -4.0% by the trained groups. This represented a 17.4% difference in estimation
error between the two treatment groups (disregarding direction of error). For Ab
Solid, cups, the control groups overestimated by 30.0%, and the trained groups
overestimated by 17.8%, reflecting a 12.5% difference between treatment groups.
For D- and Ab-Amorphous, the decrease in estimation error due to training was much
larger. The control groups overestimated the amorphous foods by 67.2% for both D-

and Ab-Amorphous, compared to overestimations of 22.7% (D-Amorphous) and
28.0% (Ab-Amorphous) for the two trained groups. This reflects a decrease in
estimation error of 39.2-44.5% for amorphous foods due to training in portion size
estimation.
No significant training effect was found for either of the two measurement
types for liquids (D-Liquid and Ab-Liquid in cups; D-Liquid and Ab-Liquid in fluid
ounces), estimation of solids by dimensions (D-Solid and Ab-Solid, inches), or
estimation of solids by ounces (D-Solid and Ab-Solid, ounces).
76
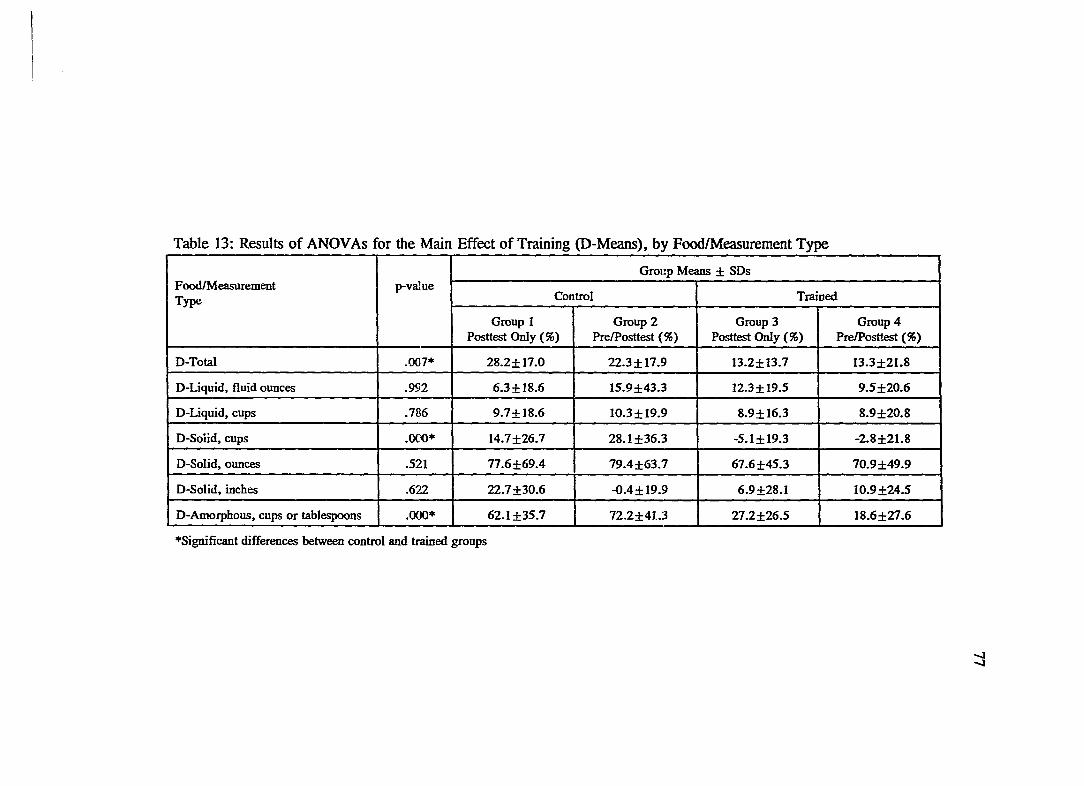
Table 13: Results of ANOVAs for the Main Effect of Training (D-Means), by Food/Measurement Type
Group Means ± SDs FoodfMeasurement p-va]ue Type Control Trained
Group 1 Group 2 Group 3 Group 4 Posttest Only (%) PrelPosttest (%) Posttest Only (%) PrelPosttest (%)
D-Total .007* 2S.2±17.0 22.3±17.9 13.2±13.7 13.3±21.S
D-Liquid, fluid ounces .992 6.3±lS.6 15.9±43.3 12.3±19.5 9.5±20.6
D-Liquid, cups .786 9.7±lS.6 lO.3±19.9 S.9±16.3 S.9±20.S
D-Solid, cups .000* 14.7±26.7 2S.1±36.3 -5.1±19.3 -2.S±21.S
D-Solid, ounces .521 77.6±69.4 79.4±63.7 67.6±45.3 70.9±49.9
D-Solid, inches .622 22.7±30.6 -O.4±19.9 6.9±2S.1 1O.9±24.5
D-Amorphous, cups or tablespoons .000* 62.1±35.7 72.2±41.3 27.2±26.5 lS.6±27.6 ---- _ .. _---- ------
*Significant differences between control and trained groups
I I
.....,J
.....,J

Table 14: Results of ANOVAs for the Main Effect of Training (Ab-Means), by Food/Measurement Type
Group Means ± SDs FoodlMeasurement p-value Type Control Trained
Group 1 Group 2 Group 3 Group 4 Posttest Only (%) PrelPosttest (%) Posttest Only (%) PrelPosttest (%)
All-Total .003* 38.5±14.6 37.3±i2.8 27.2±9.9 24.8±16.4
Ab-Liquid, fluid ounces .188 lS.6±11.3 31.1±33.3 IS.8±16.6 IS.5±16.3
All-Liquid, cups .310 17.4±! 1.0 18.3±12.6 14.1±I1.8 14.9±16.7
Ab-Solid, cups .008* 24.6±17.2 36.0±27.8 16.7±1O.1 18.9±1O.0
All-Solid, ounces .313 83.9±61.0 81.7±60.4 67.6±4S.3 70.9±50.0
Ab-Solid, inches .682 24.9±28.7 16.4±10.6 21.0±19.3 16.3±21.0
All-Amorphous, cups or tablespoons .000* 62.1±35.7 72.2±41.3 30.4±22.5 25.6±20.7 ------_ .. _--- L- ______
--.---~---- --
*Significant differences between control and trained groups
....J 00
79
Looking at the means for the liquids for both the D- and Ab-values (Tables 13
and 14), it is apparent that liquids were estimated fairly accurately by all four groups,
calculated by both methods. The mean percent errors of estimation for the four
groups ranged from 6.3% to 18.3% for all but one group (Group 2, Ab-Liquid, fluid
ounces; error = 31.1 %). Looking at the means for the estimation of solids by ounces
(one solid food: steak), it is apparent that the estimation of meat by ounces was
difficult for all four groups. The mean percent errors of estimation for the four
groups ranged from 67.6% to 83.9%. Training in portion size estimation did not
significantly improve subjects' ability to estimate solid food in ounces (in this case for
this one food item).
To interpret the non-significant effect of training on the estimation of solids by
dimensions (inches), it is important to look at the means for both the D- and Ab
values together. When looking just at the D-value means, it appears that the control
Group 2 experienced a reactive effect of testing, such that they decreased their error
of estimation to almost zero (-0.4) on the posttest, compared with a posttest score of
22.7% error for the other control Group 1. However, when looking at the absolute
value of the estimation error for solids estimated by dimensions (Ab-Solid, inches),
Group 2 had an error of 16.4 %, which is not different from the percent estimation
errors of the other three groups. In fact, for the main effect of testing, no significant
differences were found between the two groups that received the pretest (Groups 2
and 4) and the two groups that were posttested only (Groups 1 and 3) for either D
Total or Ab-Total or any of the food/measurement types. Similarly, no significant

80
interaction of training with testing was found for any food/measurement type except
solids estimated by dimensions using the D-value (D-Solid, inches; p=.043). Figure
2 shows the interaction of training with testing for D-Solid, inches. The
interpretation of Figure 2 is that control group subjects who are pretested achieve
lower errors of estimation for solid foods in dimensions than control group subjects
who are not pretested. Additionally, Figure 2 indicates that trained group subjects
who are not pretested achieve lower errors of estimation for solid foods in dimensions
than trained group subjects who are pretested. These results are somewhat
contradictory, and are not substantiated by a significant interaction for dimensions
using the Ab-value. Table 11 shows that the estimations for solid foods in inches
were quite accurate on both the pre- and posttests for the control and trained groups
that took both tests. It appears that the large overestimation for the control Group 1
may be an aberrant result which is the cause of the significant interaction.

81
Figure 2: Interaction of Training with Testing for D-Solid, Inches
... 25 g VI Group 1 0
c., C)
x =22,7 oS c: 20 0 c: 0 'i'j ,§ ~ 15 .... 0
~
~ C 10 C)
f::! ~ §
~ 5
Group 2
0 x = -0.4
Prc- lU1d POSllcS1Cd POSllcslcd Only

CHAYfER 5
Comparison Study
82
The purpose of training individuals in portion size estimation skills is to
improve the quantitative accuracy of the dietary intake data they report using diet
records and other self-reported dietary intake methods. Thus, the subjects enrolled in
the bone mineral study (pilot study) were trained in portion size estimation to prepare
them to record their dietary intake using an estimated diet record for a total of twelve
days. They recorded their dietary intake for four days at a time, six months apart.
The four days for each time period were randomly assigned over four weeks (one
recording day per week). Their first recording day occurred within 1-14 days of their
training session in portion size estimation. Once all 57 subjects in the study had
completed their first four recording days, they were given a second posttest in portion
size estimation.
Purposes of the Second Posttest
Three groups of subjects were administered the second posttest for the
comparison study. From the main study, utilizing the Solomon four-group design,
Group 2 (control, pre- and posUest) and Group 4 (trained, pre- and post-test) were
used. All 25 subjects from Group 5 (the pilot study) were used (all subjects pre- and
posttested). The rationale for using only Groups 2 and 4 from the main study was to
make comparisons between only those groups who received the same number of tests
from both studies.
For the subjects in all three groups, the first posUest was conducted

83
immediately following their respective training sessions (or in the case of the subjects
in the control Group 2, during the same week as the trained Group 4). During the six
months following the first posttest, no additional contact was made with the subjects
in either Group 2 or 4. In contrast, the subjects in Group 5 completed four days of
estimated diet records during that time. Six months following the first posttest, all
three groups were administered the second posttest. The purposes of the second
posttest were: 1) to determine whether the subjects trained in portion size estimation
(Group 4, main study, and Group 5, all subjects from the pilot study) would retain
some of their gain in accuracy up to six months after training, and 2) to determine
whether the retention of the gain in estimation accuracy would be greater for those
subjects who also completed four days of diet records (Group 5, pilot study) than for
those subjects who were trained but did not complete diet records (Group 4, main
study).
Methods
Posttests
As described in Chapter 3 (p. 52), there were ten food items on the posttests
administered to Group 5 that were comparable to the food items on the posttests
administered to Groups 2 and 4. Table 15 shows the food items and quantity of each
food item used on the first and second posttests for the main study (Groups 2 and 4)
and for the pilot study (Group 5).

Table 15: Comparison of Food Items, Food Types, and Quantities Used for the First and Second Posttests for the Main Study VS. the Pilot Study.
Food Item Quantity Food
First Posttest Second Posttest Type First Posttest Second Posttest
Main Study Pilot Study Main Study Pilot Study Main Study Pilot Study Main Study Pilot Study
milk juice milk water liquid, fluid 12 fl. oz. 10 fl. oz. 12 fl. oz. 12 fl. oz. ounces
hot tea coffee hot tea hot tea liquid, fluid 6 fl. oz. 5 fl. oz. 6 fl. oz. 7 fl. oz. ounces
cake with cheese cake with cheese solid, variable l'h"xl"x variable 2"x l"x I" icing icing inches ~.
steak steak steak ham solid, variable 51h" x 21h· variable 51h" x 3!,4" inches x !,4" x ~.
steak chicken steak chicken solid, variable 3oz. variable 3oz. ounces
flake cereal flake cereal flake cereal flake cereal solid, cups Ilh cups I cup llh cups % cup
- nugget cereal - nugget cereal solid, cups - Ih cup - 1f.a cup
refried beans applesauce refried canned amorphous, Ih cup % cup Ih cup 1hcup beans pumpkin cups
cottage - cottage - amorphous, ~ cup - ~ cup -cheese cheese cups
peas com peas mixed solid, cups % cup % cup % cup Ih cup vegetables
ranch cream cheese ranch cream cheese amorphous, 2 Tbsp. 1 Tbsp. 2 Tbsp. 2 Tbsp. dressing dressing tablespoons
_._-_._-- - - -- _.- -_ .. _-- '---~
I I I
00 ~

85
Both studies used two fluids measured in fluid ounces (milk and hot tea for both tests
in the main study and juice/water and coffee/hot tea in the pilot study), two solid
foods measured in dimensions (cake and steak for both tests in the main study, and
cheese and steak/ham in the pilot study), and one solid food measured in ounces
(steak for both tests in the main study, and chicken for both tests in pilot study). The
main study used two solid foods measured in cups (flake cereal and peas for both
tests) and three amorphous foods measured in cups or tablespoons (refried beans,
cottage cheese and Ranch dressing for both tests). The pilot study used three solid
foods measured in cups (flake cereal and nugget cereal for both tests, and corn/mixed
vegetables), and two amorphous foods measured in cups or tablespoons (cream cheese
and applesauce/pumpkin). These ten food items translated into 16 dependent
variables: liquid 1 in fluid ounces, liquid 2 in fluid ounces, solid 1 in length, width
and height, and total cubic inches (4 variables), solid 2 in length, width and height,
and total cubic inches (4 variables), solid 3 in ounces, solids 4 and 5 in cups and
amorphous foods 1, 2, and 3 in cups/tablespoons or solids 4, 5, and 6 in cups and
amorphous foods 1 and 2 in cups/tablespoons.
As described in Chapters 3 and 4, the mean total test score for each individual
and each group was calculated two different ways. "D-Total" was calculated by
subtracting the correct quantity for each food item from the quantity reported by each
subjects; this value was divided by the correct quantity, then multiplied by 100 to
obtain the total error of estimation reflected as a percentage of 100% (correct
quantity). D-Total, therefore, reflects both over- and underestimations (+ and -

86
scores). "Ab-Total" was calculated following the same procedure, but positive and
negative signs were ignored, thus providing the absolute value of the percent error of
estimation. The comparison study analysis used the D-values and Ab-values
calculated for each variable and for each food/measurement type as described in
Chapters 3 and 4 (Le. p. 67, Chapter 4).
Experimental Design and Statistical Procedures
The Solomon Four-Group design used in the main study was modified to
include Group 5 from the pilot study. Figure 3 shows how Group 5 compares with
Groups 1-4 in terms of number of tests taken and number of treatments received. For
the comparison study, the scores on the first and second posttests were compared
within each group (Groups 2, 4, and 5) and between groups. Paired t-tests were used
to test for significant differences within groups by test occasion. Mixed model
ANDV As were used to test the main effects of group, test occasion, and foodform,
and the interactions of group by test, group by foodform, food form by test, and group
by test by foodform. Significant effects were followed up using the Tukey's HSD test
and orthogonal contrasts. Alpha was set at the .05 level for all comparisons. The
Bonferoni's method was used to determine the p-value for significant contrasts (.05
divided by 3 contrasts per analysis equals a p-value of .016).

87
Figure 3: Modified Solomon Four-Group Design
Group Pretest Treatment 1 Posttest 1 Treatment 2 Posttest 2
Control 1 X
Control 2 X X X
Trained 3 X X
Trained 4 X X X X
Trained 5 X X X X X

88
Results and Discussion
In order to address the questions of: 1) whether the subjects trained in portion
size estimation (Groups 4 and 5) would retain some of their gain in estimation
accuracy up to six months after training, 2) whether the subjects who also completed
four days of diet records during the six months following training (Group 5) would
retain more of their estimation accuracy than the trained group that did not complete
diet records (Group 4), and 3) whether there were differences in estimation accuracy
by food form (liquid, solid, amorphous), the first procedure used was paired t-tests for
each group to assess retention of estimation accuracy by group (01' no change for the
control group). Table 16 shows the p-values for the differences between test scores
for D-Total, Ab-Total, and for the four food/measurement types for each group.
Significant differences are indicated with an asterisk.

Table 16: Results of Paired t-tests for Groups 2, 4, and 5 Comparing Means of the First and Second Posttests
% Change in Means from First Posttest to Second Posttest
Test Variable Group 2, Control Group 4, Trained Group 5, Trained (n= 14) (n= 14) and DRI (n=25)
Main Study Main Study Pilot Study
% Change p-vruue % Change p-va]ue % Change p-va]ue
D-Total 13.5 .125 9.0 .231 3.4 .365 Ab-Total 8.9 .278 11.5 .038* 4.0 .140
D-Liquid 2.4 .864 5.0 .560 3.2 .589 Ab-Liquid 1.2 .921 6.2 .243 1.1 .808
D-Solid 3.3 .605 11.9 .215 17.6 .004* Ab-Solid 0.6 .903 8.5 .272 7.7 .088
D-Amorphous 3.1 .784 14.7 .189 41.5 .000* Ab-Amorphous 3.1 .784 9.3 .235 1.6 .768
D-Dimensions 27.8 .083 12.0 .380 12.4 .035* Ab-Dimensions 24.6 .098 17.5 .151 11.3 .016*
* Significant p-value at level specified I DR = Diet Record; this group completed 4 days of estimated diet records
89

90
For Group 2 (control, main study), there were no significant differences
between the first and second posttests for any variable. For Group 4 (trained, main
study), the only significant difference between posttests was for Ab-Total (p=.038).
The mean percent error of estimation for Ab-Total for Group 4 on the first posttest
was 24.8%. The mean percent of estimation error for Ab-Total on the second
posttest was 36.3%, indicating an 11.5% increase in estimation error (or loss of the
gain in estimation accuracy) over the six months following the portion size estimation
training. Since the mean percent error of estimation for Group 4 on the pre-test was
33.5%, the 11.5% loss in estimation accuracy over the six months between posttests
represented a loss of all of the gain in estimation accuracy achieved through portion
size estimation training.
For Group 5 (trained, plus 4 days of diet records), significant differences
between the first and second posttests were found for four variables: D-Solid
(p=.OO4), D-Amorphous (p=.OOO), D-Dimensions (p=.035), and Ab-Dimensions
(p=.016). First, it is important to note that for the D-Solid and D-Amorphous
variables, no significant differences were found for their respective Ab-values (Ab
Solid and Ab-Amorphous). In both cases, this was the result of a mean
underestimation of portion size on the first posttest that changed to a mean
overestimation of portion size on the second posttest. For D-Solid, this change
represented a 17.8% difference between tests (and a decline in estimation accuracy).
The Ab-Solid variable represents the absolute value of the percent error of estimation
for solids, and therefore, is not affected by the direction of the error. The change in

91
percent error of estimation between the first and second posttests for Ab-Solid was
9.4%, which was not significant (p=.088). Similarly, for D-Amorphous, the
difference between the mean underestimation on the first posttest and the mean
overestimation on the second posttest represented a 41.5% change. The subjects
underestimated the portion size of amorphous foods by 18.5% on the first posttest,
and overestimated these foods by 23.0% on the second posttest. However, if the
direction of the estimation error is ignored, as it is for the Ab-Amorphous variable,
there is essentially no difference in the mean percent error of estimation between tests
for amorphous foods for this group. This is reflected in the means (26.6% error on
the first posttest vs. 25.0% error on the second posttest), and in the p-value obtained
via the paired t-test (p=. 768) for Ab-Amorphous. For the estimation of solid foods
by dimensions, however, a significant difference was found for both the D
Dimensions variable (p= .035) and the Ab-Dimensions variable (p= .016). In both
cases, the subjects in Group 5 improved in estimation accuracy using dimensions
(decreased the percent error of estimation) over the six months between the first and
second posttests. Since the subjects in this group completed four days of estimated
diet records during the six-month period between tests, it would appear that the
improvement in estimation accuracy may be attributable to the application of this type
of portion size estimation skill (through completion of the diet records). Estimation
accuracy improved by 12.4 % calculated as D-Dimensions, and by 11.3 % calculated
as Ab-Dimensions.
These results generally support the hypothesis that the subjects in the trained

92
groups (Groups 4 and 5) would retain some of their estimation accuracy up to six
months after training. Group 4 lost all of their gain in estimation accuracy after six
months when interpreted by Ab-Total, but there was no significant difference between
tests for any other variable. For Group 5, a significant loss of estimation accuracy
was found for the D-Solid and D-Amorphous variables, but when the direction of the
error is ignored, no significant change between tests was observed for the D
Amorphous variable. Even though the difference between tests was not significant for
the Ab-Solid variable, the mean percent error of estimation did increase from 17.7%
on the first posttest to 27.1 % on the second posttest. This evidence, plus the
significant finding for D-Solid, seems to indicate a true loss in estimation accuracy for
solid foods for Group 5.
In order to analyze differences between groups, test occasions (first and second
posttests), and food/measurement types, a series of mixed model ANOVAs were
performed. D-Total, Ab-Total, and the four food/measurement types (each calculated
with their D-value and their Ab-value) were analyzed by the between subjects factor
of group (three levels: control, trained, and trained plus diet records) and the within
subjects factor of test occasion (two levels: first and second posttests). The foodform
analyses were performed using the D- and Ab-values for the three food types: liquid,
solid and amorphous foods.
The results of all analyses except foodform are shown in Tables 17 and 18.
D-values are shown in Table 17, and Ab-values are shown in Table 18. Significant
differences for the main effect of group, the main effect of test occasion, and the

93
interaction effect of group by test are indicated by the asterisks. Significant effects
were followed up using the Tukey's HSD test and orthogonal contrasts. Alpha was
set at the .05 level for all comparisons. The Bonferoni's method was used to
determine the p-value for the contrasts (.05 divided by 3 contrasts equals a p-value of
.016).
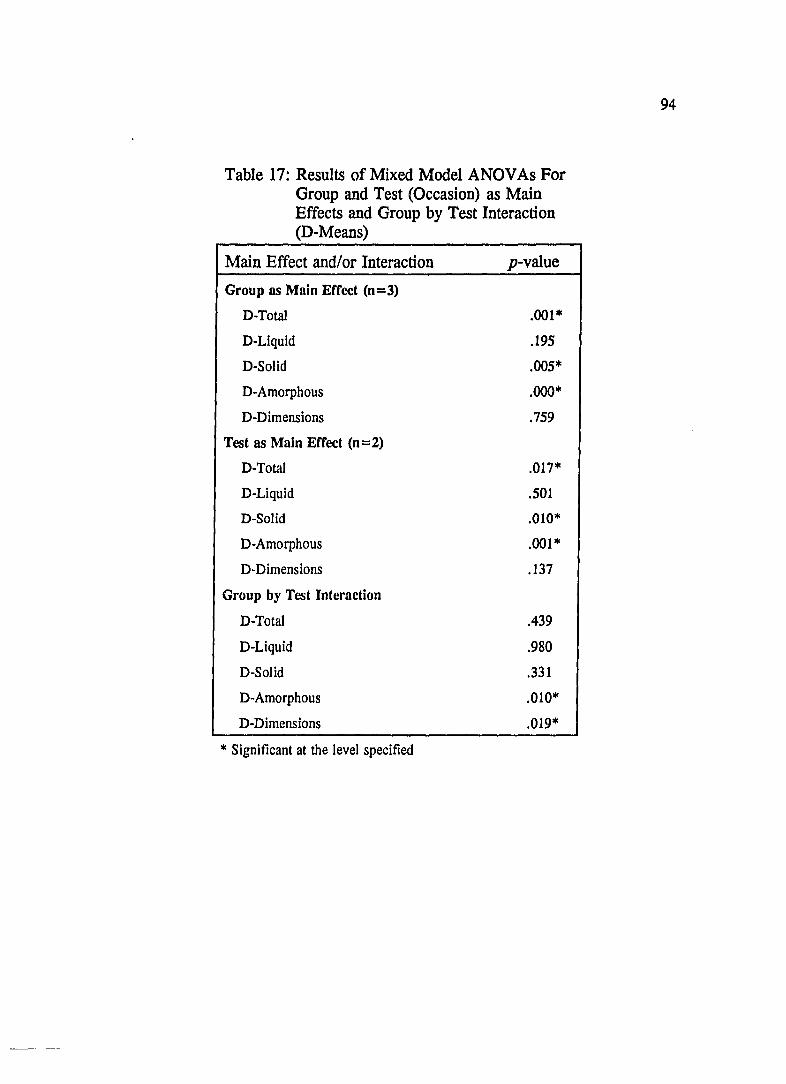
Table 17: Results of Mixed Model ANOVAs For Group and Test (Occasion) as Main Effects and Group by Test Interaction (D-Means)
Main Effect and/or Interaction p-value
Group as Main Effect (n=3)
D-Total .001*
D-Liquid .195
D-Solid .005*
D-Amorphous .000*
D-Dimensions .759
Test as Main Effect (n=2)
D-Total .017*
D-Liquid .501
D-Solid .010·
D-Amorphous .001*
D-Dimensions .137
Group by Test Interaction
D-Total .439
D-Liquid .980
D-Solid .331
D-Amorphous .010*
D-Dimensions .019*
* Significant at the level specified
94
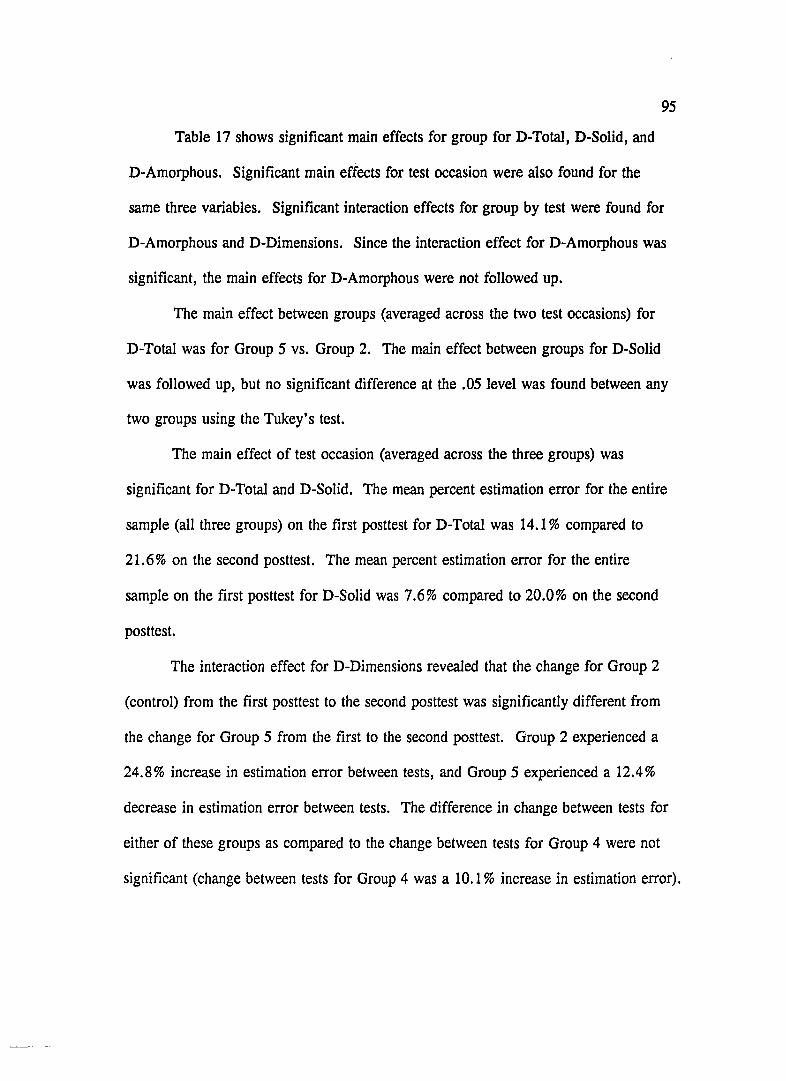
95
Table 17 shows significant main effects for group for D-Total, D-Solid, and
D-Amorphous. Significant main effects for test occasion were also found for the
same three variables. Significant interaction effects for group by test were found for
D-Amorphous and D-Dimensions. Since the interaction effect for D-Amorphous was
significant, the main effects for D-Amorphous were not followed up.
The main effect between groups (averaged across the two test occasions) for
D-Total was for Group 5 vs. Group 2. The main effect between groups for D-Solid
was followed up, but no significant difference at the .05 level was found between any
two groups using the Tukey's test.
The main effect of test occasion (averaged across the three groups) was
significant for D-Total and D-Solid. The mean percent estimation error for the entire
sample (all three groups) on the first posttest for D-Total was 14.1 % compared to
21.6% on the second posttest. The mean percent estimation error for the entire
sample on the first posttest for D-Solid was 7.6% compared to 20.0% on the second
posttest.
The interaction effect for D-Dimensions revealed that the change for Group 2
(control) from the first posttest to the second posttest was significantly different from
the change for Group 5 from the first to the second posttest. Group 2 experienced a
24.8% increase in estimation error between tests, and Group 5 experienced a 12.4%
decrease in estimation error between tests. The difference in change between tests for
either of these groups as compared to the change between tests for Group 4 were not
significant (change between tests for Group 4 was a 10.1 % increase in estimation error).

96
The interaction effect for D-Amorphous revealed that the change for Group 2
from the first posttest to the second posttest was significantly different from the
change for Group 5 from the first to the second posttest. Group 2 experienced a
3.1 % increase in estimation error between tests, and Group 5 experienced a 41.5%
change in estimation between tests. Similar to the results of the paired t-tests for
Group 5, this change in estimation error is due to the direction of the change, not the
magnitude of the change. Group 5 underestimated the amorphous foods by 18.5% on
the first posttest, and then overestimated these foods by 23.0 % on the second posttest.
No interaction effect for the Ab-value for amorphous foods was found (see Table 18;
p=.881). Additionally, the difference in change between tests for either of these
groups as compared to the change between tests for Group 4 were not significantly
different (the change between tests for Group 4 was an increase in estimation error of
14.6%).
Other significant differences between groups by test occasion for D
Amorphous were that: 1) each of the three groups were different from each other on
the first posttest (Group 2 = 80.9%, Group 4 = 18.6%, Group 5 = -18.5%),2)
Group 2 (84.0%) was different from Groups 4 (33.3%) and 5 (23.0%) on the second
posttest, but Groups 4 and 5 were not different from each other, and 3) Group 5 was
different from the first to the second posttest (due the change in the direction of the
error as discussed above).
The results of the analyses for the Ab-values are shown in Table 18.

Table 18: Results of Mixed Model ANOVAs For Group and Test (Occasion) as Main Effects and Group by Test Interaction (Ab-Means)
Main Effect and/or Interacton p-value
Group as Main Effect (n=3)
Ab-Total .001*
Ab-Liquid .142
Ab-Solid .068
Ab-Amorphous .000*
Ab-Dimensions .567
Test as Main Effect (n=2)
Ab-Total .061
Ab-Liquid .710
Ab-Solid .064
Ab-Amorphous .499
Ab-Dimensions .131
Group by Test Interaction
Ab-Total .042*
Ab-Liquid .743
Ab-Solid .182
Ab-Amorphous .881
Ab-Dimensions .005*
* Significant at the level specified
97
Significant main effects for group were found for Ab-Total and Ab
Amorphous. No significant main effects for test occasion were found. Significant
interaction effects for group by test occasion were found for Ab-Total and Ab
Dimensions. Because a significant interaction effect was found for Ab-Total, the
main effect for group for Ab-Total was not followed up.
98
A main effect for group (averaged across test occasions) for Ab-Amorphous
was found for Group 2 vs. Group 4, and for Group 2 vs. Group 5. The percent error
of estimation, averaged across test occasions, was 83.7% for Group 2, and 33.3%
and 31.5% for Groups 4 and 5 respectively. Clearly, there was no significant
difference between Groups 4 and 5.
An interaction effect of group by test occasion was found for Ab-Total and
Ab-Dimensions. For Ab-Total, Group 2 was significantly different from Group 5 on
the second posttest. The mean error of estimation for Group 2 on the second posttest
was 48.3% vs. 23.6% for Group 5. One contrast for Ab-Total approached
significance (p= .025). This contrast compared the change in estimation error from
the first posttest to the second posttest for Group 4 vs. Group 5. The mean percent
errors of estimation for Group 4 on the first and second posttests, respectively, were
24.5% and 35.7%. For Group 5 the mean percent errors of estimation were 27.6%
and 23.6%. Both the magnitude and the direction of error were different between
these two groups. Group 4 increased their estimation error after six months, and
Group 5 slightly decreased (not significant) their estimation error.
For Ab-Dimensions, similar relationships between groups by test occasion

99
were found. Group 2 (39.8% estimation error) was significantly different from
Group 5 (19.6% estimation error) on the second posttest. The change in estimation
error from the first posttest to the second posttest was significantly different for
Group 4 (14.9% increase in error) vs. Group 5 (11.9% decrease in error). The
change in estimation error for Group 5 was also significantly different from Group 2
(16.0% increase in error).
The results of the analyses by foodform are shown in Table 19.

Table 19: Results of Mixed Model ANOVAs for the Main Effects and Interactions Involving Foodform l
Main Effect and/or Interaction p-value
Main Effect of Foodform D-Foodform .000* Ab-Foodform .000*
Main Effect of Test D-Test .009* Ab-Test .149
Main Effect of Group D-Group .000* Ab-Group .000*
Interaction Effect of Group by Foodform D-Effect .000* Ab-Effect .000*
Interaction Effect of Group by Test D-Effect .075 Ab-Effect .346
Interaction Effect of Foodform by Test D-Effect .002* Ab-Effect .712
Interaction Effect of Group by Foodform by Test D-Effect .100 Ab-Effect .934
I Foodform = Solids in cups vs. Liquids in fluid ounces vs. Amorphous in cups and tablespoons.
100

101
For both the D- and Ab-values, the main effects of foodform and group were
significant (p=.OOO). Not surprisingly, the interaction effect of group by foodform
was also significant (p=.OOO) for both the D- and Ab-values. For the D-values,
significant differences were found between the mean estimation of amorphous foods
by Group 2 (across test occasions) and every food type by every group. The same
results were found for the Ab-values. The mean percent error of estimation for
Group 2 for D-Amorphous was 82.5%. For Ab-Amorphous, the mean percent error
of estimation was 83.7%. No other estimation of portion size by food type (liquid,
solid, or amorphous) by any of the three groups across test occasions was higher than
42.8% (Group 2, Ab-Solid). It is probably not meaningful, though, that the
estimation error for amorphous foods by Group 2 was significantly different from the
estimation error for Group 4 for liquids, for example. The meaningful significant
differences were between Group 2 for D-Amorphous and both Groups 4 and 5 for D
Amorphous. The same relationship is true for Ab-Amorphous.
The significant main effect of test for the D-value was not foHowed up because
there was also a significant interaction effect of food form by test for the D-value.
Because the mean error of estimation. for both posttests for Group 2 for amorphous
foods was so high, one would expect significant differences between the amorphous
food type and the solid and liquid food types for both posttests. When collapsed
across groups, D-Amorphous on the second posttest was significantly different from
D-Solid and D-Liquid on both the first and second posttests. What is interesting is
that D-Amorphous for the first posttest is not significantly different from any other

102
food type on either test occasion except D-Amorphous on the second posttest. This is
because when the results for each food type on each test occasion were collapsed
across groups, the more accurate estimations of the other two groups for amorphous
foods on the first posttest were better than they were for the second posttest.
Specifically, the underestimation of 18.5% on the first posttest by Group 5 pulls the
mean estimation error for all three groups on the first posttest down to 17.6% vs. the
mean estimation error for all three groups on the second posttest of 41.8% (Group 5
overestimated by 23.0% on the second posttest). This change in the direction of
estimation error for amorphous foods by Group 5 appears to be the primary impact of
the application of portion size estimation knowledge through the completion of the
four days of diet records.
Two food form by test occasion contrasts were also significant. The difference
in the change in error of estimation for D-Liquid from the first posttest to the second
posttest was significantly different from the change in estimation error from the first
posttest to the second posttest for D-Amorphous. This is due to the same phenomenon
in estimation error for amorphous foods by Group 5 discussed above. Second, the
difference in the error of estimation for D-Liquid from the first posttest to the second
posttest was different from the change in the error of estimation from the first to the
second posttest for D-Solid. The percent estimation error (across groups) for D
Liquid on the first posttest was 13.3%, compared to 9.9% on the second posttest.
The percent estimation error (across groups) for D-Solid on the first posttest was
7.6%, compared to 20.0% on the second posttest.
CHAPTER 6
Discussion of the Three Studies
103
The main study was designed to test the effectiveness of training in portion
size estimation, while taking into account the possible concomitant effects of testing
and the interaction of testing with treatment. Overall, it appears that the estimation of
portion sizes did improve with training, evidenced by the significant training effects
found for the mean total test scores, D-Total and Ab-Total. Partitioning the total test
into groupings by either food type (liquid, solid, amorphous) or measurement type
(cups, fluid ounces, ounces, dimensions), a significant training effect was found for
solid foods estimated in cups and amorphous foods estimated in either cups or
tablespoons. The decrease in percent error of estimation for the total test (by both
calculation methods) and for solid foods estimated in cups was approximately 12 %.
The decrease in percent estimation error for the amorphous foods was much greater,
at approximately 40%. Liquids, estimated in both cups and fluid ounces, were
estimated fairly accurately by both the trained and the control groups. Most
estimations for liquids were within 9-16% of the actual amounts.
Estimations of solid foods in inches (dimensions) were not changed by
training. Errors in percent estimation for both the trained and control groups ranged
from 0-25 %. The one solid food estimated in ounces, steak, was overestimated by all
groups by 68-84 %; training did not improve those estimations. There was no reactive
effect of testing, and only one significant interaction (D-Solid, inches), which appears
to be due to an aberrant result for Group 1.

104
Prior to the completion of diet records, Group 5, from the pilot study, was
essentially the same type of treatment group as Group 4, from the main study.
Therefore, the first posttest scores for Group 5 can be compared with the first posttest
scores of the two trained groups in the main study. This can be done by looking at
the means for Group 5 in Tables 4 and 5, and in Tables 13 and 14 for Groups 3 and
4. The D-Total mean percent error of estimation for Group 5 was 7.8%, compared
with 13.25% for Groups 3 and 4. For Ab-Total, the mean percent error of estimation
for Group 5 was 27.6%, compared with 26.0% for Groups 3 and 4. Liquids,
estimated in cups and fluid ounces, and solids, in cups, were similar in scores
between Group 5 and Groups 3 and 4 for both the D- and Ab-values. This is true
even to the point that D-Solid, cups, was slightly underestimated by all three trained
groups. Thus, it appears that training brought about the same changes in all of the
trained groups across the two studies on the first posttest.
The comparisons between the three groups that were posttested six months
after training (one control group included), yielded some results that were expected,
plus some that were unexpected. The first expected result was that there were no
significant differences between the first and second posttests for Group 2, the control
group. Second, there were also no significant differences between tests for all but
one variable for Group 4. This means that for those variables for which estimations
improved due to training, the improvement was not decreased (or increased)
significantly over the six months, and that for those variables for which training had
no impact, no significant differences were found either. The one variable that did
.j
105
change significantly between tests was Ab-Total, and this change represents a loss of
all of the gain in estimation accuracy by training over time, which was not expected.
Several significant results were found for Group 5. There was a loss of
estimation accuracy for solid foods estimated in cups by the D-method. Even though
this loss was not reflected by a significant change between tests for the Ab-value, the
means for the two tests for the Ab-value show an increase in estimation error for this
variable. A significant difference between tests was found for D-Amorphous, but this
difference was due to the underestimation of amorphous foods by 18.5 % on the first
posttest that changed to an overestimation of these foods by 23.0% on the second
posttest. It is this phenomenon that drives the significant findings for several of the
analyses and it is responsible for the significant main effects of group and test for D
Amorphous (mixed model ANOVAs), and the significant group by test interaction for
Group 2 vs. Group 5 for that variable. This phenomenon is also responsible for the
significant interaction effect of food form by test because the 18.5% underestimation
of D-Amorphous by Group 5 on the first posttest pulled the mean estimation error
across the three groups down to 17.6 %. This result is compared with a mean
estimation error of 41.8% for all three groups on the second posttest due to the
overestimation of 23.0% by Group 5. One of the significant foodform by test
contrasts was also due to this same phenomenon (see p. 102). Finally, there appears
to be a true improvement in the estimation of solid foods by dimensions by Group 5
from the first to the second posttest. Both the D- and Ab-values for dimensions were
significant, translating to an improvement of 11.3-12.4 %. It is possible that this

increase in estimation accuracy is due to the application of portion size estimation
skill via the completion of four days of diet records.
106
In the previous studies which tested the ability of individuals to accurately
estimate portion sizes of foods, estimation errors in the ranges of 6-260% (29), 16-
247% (52), 10-80% (16/20 foods; 27), and 2-59% (57) were found. In the studies
that implemented a training program, estimation errors in the ranges of -10.3-57.8%
(32), 18.8-125.0% (30), and 22.5-140.8% (33) were found for the trained groups.
Some of these estimation errors were reported for individual food items, rather than
for groupings of foods by total test or food type. In the studies reported in this
document, most results have been reported by total test or food group, however,
looking at the means for the individual food items (Tables 9 and 10 for trained
Groups 3 and 4, and Table 3 for trained Group 5), the largest percent estimation error
for an individual food item on a posttest was 70.9% for both the D- and Ab-values
for steak estimated in ounces (Group 4).
In the first study by Bolland, et al. (32), ten-minute training sessions
imprOVed estimation accuracy for only 2 of 17 foods by either of two training
activities (real foods vs. food models). When the results of the two training programs
were combined, 5 out of 17 foods were estimated significantly more accurately by
trained groups than by the control group. The effect of training was not significant
for the 17 food items as a whole. The results of the main study reported here showed
that the effect of training is significant for both the total test and for two food types
(solids in cups and amorphous foods). It may be that increasing the length of the

107
training session (one hour in the studies reported here vs. ten minutes in the Bolland
studies), contributes to a greater improvement in estimation ability.
Yuhas, Bolland and Bolland (33) found no significant difference between
trained groups tested immediately after training and trained groups tested one week
after training. Overall, the trained groups tested immediately following training and
trained groups tested one week later estimated portion sizes significantly more
accurately than trained groups tested four weeks after training. Estimates made by
trained subjects who were tested four weeks after training were not consistently better
or worse than those made by untrained subjects across the six food items. The
difficulty in comparing these results to the results regarding the effect of time in the
comparison study reported in this document is that the comparison study looked at
repeated measures for the same subjects, while the Yuhas et al. study tested separate
groups of subjects at each time period. It appears, though, that the effects of training
were longer lasting in the studies in this document than for the Yuhas study.
Additionally, the completion of four days of diet records seems to aid in the retention
of estimation ability, and may even improve estimation accuracy.
The strong trend for overestimation of portion sizes of foods reported in the
studies in this document, and by most of the studies cited here (28-30,32,33,52,57), is
contradictory to the trend reported by many other investigators (66-73) of
underreporting of dietary intake via self-reported dietary intake methods. A portion
of this discrepancy may be accounted for by the fact that most studies designed to test
the individual's ability to estimate portion sizes of foods require the individual to
108
estimate the quantities of pre-measured, displayed foods that are not, ultimately,
consumed by those individuals. These displays of foods are "neutral" because the
individuals being tested did not choose them or consume them. Conversely, the foods
and food quantities an individual reports regarding his/her own intake are subject to
both conscious and unconscious decisions made by the individual.
It is important to note that the standard deviations obtained in these analyses
were quite large, often larger than the means. It might have been expected that the
variability would decrease along with the means, but it did not. Therefore, even
though training resulted in significant changes in the group means, the within group
variability was not affected.
It must also be noted that portion size estimation error is just one of the many
potential errors cited in Chapter 2 which can plague self-reported dietary intake
methods. Efforts must be made to address all of the potential sources of error in
these methods in order to achieve reliable, valid dietary data.

Summary
CHAPTER 7
Summary and Conclusions
109
The purpose of this research was to investigate the effectiveness of training
individuals in portion size estimation skills in order to increase their accuracy of food
quantity estimation. The portion size estimation training program was taught in three
parts: 1) a measurement activity using real foods, 2) an estimation activity using food
models, and 3) an estimation activity using dimensions, rather than standard
household measures, to quantify amounts of foods. The first and second parts of the
training program used foods representing three food types: liquid, solid, and
amorphous foods. The third part of the training program, using dimensions, was
applicable only for solid foods.
Three studies were designed to carry out this investigation. For the first
study, the pilot study, 25 Caucasian, female subjects, aged 28-42 years, took a
portion size estimation pretest, participated in the portion size estimation training
program, then took a posttest. During the six months following the administration of
the posUest, each subject recorded four randomly assigned days of dietary intake
using the estimated diet record technique. Six months after the first posUest, a second
posttest on portion size estimation was administered. Test scores were calculated two
ways for all three studies. The "Difference Value" ("D" method) was calculated by
subtracting the correct quantity for each food item from the quantity reported by each
subject. This value was divided by the correct quantity, then multiplied by 100 to
110
obtain the percent error of estimation. The "D" method reflects both over- and
underestimations (+ and - scores), and therefore, the direction of the error, but not
the total magnitude of error, because some of the error cancels out. The" Absolute
Value" ("Ab" method) was calculated following the same procedure, but positive and
negative signs were ignored, thus providing the absolute value of the percent error of
estimation. The "Ab" method provides the total magnitude of the error, but not the
direction of the error.
No statistical analyses could be performed on the pilot study data comparing
the pretest scores with the first posttest scores due to the large incidence of uncode
able scores on the pretests (refer to Chapter 3, p. 55). However, paired t-tests
revealed four significant differences in scores from the first posttest to the second
posUest over the six month period between tests. The mean error of estimation for
solid foods estimated in cups increased from -0.8% to 16.8% (p=.004) using the "D"
method (D-Solid, cups). The mean estimation error for amorphous foods using the
"D" method changed from a mean underestimation error of -18.5% to a mean
overestimation error of 23.0% (P= .000). For solid foods estimated by dimensions, a
decrease in mean estimation error occurred using both the "D" method and the "Ab"
method. Using the "D" method, the mean estimation error decreased from 17.2% to
4.8% (p=.035). Using the "Ab" method, the mean estimation error decreased from
26.1 % to 14.8% (p=.016).
For the second study, the main study, the Solomon four-group design was used
to investigate the main effect of the treatment (the portion size estimation training

111
program), the main effect of testing (pretest vs. no pretest), and the interaction effect
of treatment with testing. Sixty-six Caucasian, female subjects, aged 28-42 years,
were randomly assigned to one of four groups: 1) a control group (no training)
receiving only the posttest, 2) a control group (no training) receiving both the pre-
and posttests, 3) a trained group receiving only the posttest, and 4) a trained group
receiving both the pre- and posttests. Fourteen 2x2 ANDV As (analysis of variance)
were performed to analyze these data. Training significantly decreased portion size
estimation error using both methods of calculating the total test score. For D-Total,
the total estimation error of the control groups was 25.3% vs. 13.25% for the trained
groups (p=.OO7). For Ab-Total, the total estimation error of the control groups was
37.9% vs. 26.0% for the trained groups (p=.OO3). This training effect for the total
test can be attributed specifically to the decrease in estimation error for solids
estimated in cups and for amorphous foods. For D-Solid, cups, the control groups
overestimated portion sizes by 21.4%, compared to an underestimation of -4.0% by
the trained groups following training (p=.OOO). For Ab-Solid, cups, the control
groups overestimated by 30.0%, compared to a 17.8% overestimation by the trained
groups (p=.OO8). For D- and Ab-Amorphous, the decrease in estimation error due to
training was much larger. The control groups overestimated the amorphous foods by
67.2% for both D- and Ab-Amorphous, compared to overestimations of 22.7% (D
Amorphous, p=.OOO) and 28.0% (Ab-Amorphous, p=.OOO) for the two trained
groups. No significant training effect was found for either of the two measurement
types for liquids (D-Liquid and Ab-Liquid in cups; D-Liquid and Ab-Liquid in fluid

112
ounces), estimation of solids by dimensions (D-Solid and Ab-Solid, inches), or
estimation of solids by ounces (D-Solid and Ab-Solid, ounces). No significant effect
of testing was found for any variable calculated by either method. Only one
significant inteIaction effect of treatment with testing was found (D-Solid, inches;
p=.043).
For the third study, the comparison study, two groups from the main study
were compared with the pilot study group. From the main study, Group 2, the
control group that was both pre- and posttested (n=14), and Group 4, the trained
group that was pre- and posttested (n=14), were each administered a second posttest
six months after their first posttest. From the pilot study, all 25 subjects (Group 5)
were administered the second posttest. During the six-month period between
posttests, no additional contact was made with the subjects in Groups 2 and 4. In
contrast, the subjects in Group 5 completed four days of estimated diet records during
that time. The purposes of the second posttest were: 1) to determine whether the
subjects trained in portion size estimation (Group 4, main study, and Group 5, pilot
study) would retain some of their gain in accuracy up to six months after training, and
2) to determine whether the retention of the gain in estimation accuracy would be
greater for those subjects who also completed four days of diet records (Group 5,
pilot study) than for those subjects who were trained but did not complete diet records
(Group 4, main study).
Paired t-tests were used to test for significant differences within groups by test
occasion. No significant differences between posttests were found for Group 2

113
(control, main study). For Group 4 (trained, main study), the only significant
difference between posttests was for the total test calculated by the "Ab" method (Ab
Total, p=.038). As shown above (p.1I0), significant differences between posttests
for Group 5 (trained + 4 days of diet records, pilot study) were found for four
variables: D-Solid (p=.OO4), D-Amorphous (p=.OOO), D-Dimensions (p=.035), and
Ab-Dimensions (p=.016).
Mixed model ANDV As were used to test the main effects of group, test
occasion, and foodform, and the interactions of group by test, group by foodform,
foodform by test, and group by test by foodform. Significant effects were followed
up using the Tukey's HSD test and orthogonal contrasts. Alpha was set at the .05
level for all comparisons. The Bonferoni's method was used to determine the p-value
for significant contrasts (.05 divided by 3 contrasts per analysis equals a p-value of
.016). Main effects of group were found for D-Total (p=.OOl) and Ab-Amorphous
(p=.OOO). For D-Total, Group 5 achieved a lower mean error of estimation (9.6%)
than Group 2 (32.6%). For Ab-Amorphous, both Groups 4 and 5 achieved a lower
error of estimation (33.3% and 31.5% respectively) than Group 2 (83.7%).
Main effects of test occasion were found for D-Total (p = .017) and D-Solid
(p=.01O). For D-Total, all three groups combined achieved a mean error of
estimation of 14.1 % on the first posttest vs. 21.6% error on the second posttest. For
D-Solid, the mean estimation error went from 7.6% on the first posttest to 20.0% on
the second posttest for the three groups combined.
Significant group by test interactions were found for Ab-Total (p= .042),

114
Ab-Dimensions (p=.OO5), D-Dimensions (p=.019), and D-Amorphous (p=.01O).
For Ab-Total, Group 5 estimated food portion sizes more accurately than Group 2 on
the second posttest (23.6% vs. 48.3%). For Ab-Dimensions, Group 5 also estimated
more accurately than Group 2 on the second posttest (19.6% vs. 39.8%).
Additionally, the change in scores from the first to the second posttest for Group 5
for Ab-Dimensions (~11.9%) was different from the change in scores for both Group
2 (t 16.0%) and Group 4 (t 14.9%). For D-Dimensions, the change in scores from
the first to the second posttest was different for Group 5 vs. Group 2 (~12.4% vs.
t 24.8%).
For D-Amorphous, there were two primary findings. First, the change in
scores from the first to the second posttest for Group 5 was 41.5 % due to a change in
the direction of the error (-18.5% on the first posttest to 23.0% on the second
posttest). Second, regardless of the direction of the error, both Groups 4 and 5
estimated amorphous foods more accurately than Group 2 on posttest 1 (18.6% vs.
-18.5% vs. 80.9%) and on posttest 2 (33.3% vs. 23.0% vs. 84.0%).
A significant group by food form effect was found for both D-Amorphous
(p=.OOO) and Ab-Amorphous (p=.OOO). Group 2 estimated amorphous foods
significantly less accurately on both posttests than either of the other two groups for
either of the other two foodforms. A significant foodform by test interaction was
found for the calculation of test scores by the "D" method. The change in scores
from the first to the second posHest (across groups) for liquids 0 3.4 %) was different
from the change in scores for both amorphous foods (t24.2%) and solids (t 12.4%).

115
Additionally, D-Amorphous on the second posttest (41.8%) was different from D
Solid and D-Liquid on both posttests and D-Amorphous on the first posttest (17.6%).
This is due to the change in the direction of estimation error by Group 5 (-18.5% on
posttest 1; 23.0% on posttest 2 for amorphous foods).
Conclusions
The effectiveness of the portion size estimation training program used for the
studies reported here was assessed through the testing of six hypotheses, shown in
Figure 4. Several of the hypotheses were tested by more than one of the three studies
reported here. The first hypothesis was intended to be tested by the pilot and main
studies:
1. Subjects trained in the portion size estimation program will increase their
accuracy of estimation of portion sizes of foods.
It was not possible to test this hypothesis using the pilot study data. The results of
the main study showed that training does improve the accuracy of the estimation of
portion sizes of solid foods estimated in cups and amorphous foods estimated in both
cups and tablespoons.

FIGURE 4: Hypotheses Tested by Each of the Three Studies
1. TRAINED SUBJECTS WILL INCREASE ACCURACY OF ESTIMATION
2. ACCURACY OF ESTIMATION WILL VARY BY FOODFORM
3. NO REACTIVE EFFECT OF TESTING
4. NO INTERACTION OF TESTING WITH TRAINING
5. SOME GAIN IN ACCURACY WILL BE RETAINED AFTER 6 MONTHS
6. RETENTION OF GAIN WILL BE GREATER FOR TRAINED/DIET RECORD GROUP THAN FOR TRAINED/NO DIET RECORD GROUP
PILOT MAIN
116
COMPARISON

The second hypothesis was addressed by the main and comparison studies:
2. Accuracy of estimation will vary with foodform (liquid vs. solid vs.
amorphous foods).
Training greatly improved the accuracy of portion size estimations of amorphous
foods. Overall, both before and after training, amorphous foods were the least
accurately estimated food type. Estimations of liquids were fairly accurately
estimated by all groups, both before and after training. There was no significant
effect of training for liquids. Solids estimated in cups were the most accurately
estimated food type after training, but the gain in estimation accuracy for this food
type was lost after six months. Training did not affect estimations of solid foods in
ounces, and these estimations were very inaccurate for all three groups.
The third and fourth hypotheses were tested by the main study only:
117
3. No reactive effect of testing will be found (Group 2 will not estimate
portion sizes more accurately than Group 1, and Group 4 will not estimate
portion sizes more accurately than Group 3).
The main effect of testing was not significant. Therefore, there was no reactive effect
of testing.
4. No interaction of testing with training will be found (the difference in
accuracy between Groups 2 and 4 will not be different from the difference
in accuracy between Groups 1 and 3).
Only one significant interaction of testing with training was found (D-Solid, inches).
This effect was probably an aberrant finding, as it was not substantiated by a

significant effect for Ab-Solid or any other variable.
The fifth hypothesis was addressed by both the pilot and comparison
studies, and the sixth hypothesis was addressed by the comparison study:
118
5. Subjects trained in the portion size estimation program (all subjects in the
pilot study, and using Group 4 from the main study) will retain some of
their gain in estimation accuracy six months after training.
6. The retention of the gain in estimation accuracy, as a result of the portion
size estimation training program, will be greater for those subjects who
also completed four days of diet records (pilot study) than for those
subjects who were trained but did not complete diet records (Group 4,
main study).
The subjects in the trained groups retained a significant amount of the gain in
estimation accuracy achieved through training. Group 4 subjects, who were trained
but did not complete diet records, lost some gain in estimation accuracy overall
expressed as Ab-Total, but this finding was not duplicated by the D-Total value or
any individual variable. Most importantly, the application of portion size estimation
knowledge (through the completion of diet records), increased the accuracy of
estimations of solid foods by dimensions, and changed the direction of the estimation
error for amorphous foods without changing the magnitude of the error.
The post-training estimation errors reported in these studies are substantially
lower than the errors reported by other investigators. It appears that increasing the
length of the training program (one hour in these studies vs. 10 minutes in the
Bolland et al. studies [30,32,33]) and using multiple training techniques (real food,
food models, and dimensions) rather than one technique are responsible for the
greater improvement in estimation accuracy reported in these studies. Previous
studies which have used a self-reported dietary intake method, which utilized a
portion size estimation component, may have resulted in invalid data if training in
portion size estimation skills was not included in the dietary protocol.
Implications for :Future Research
119
As mentioned above, the use of multiple training techniques probably
contributes to the increase in estimation accuracy due to training. However, it may
be important to investigate further the contribution of each technique individually. In
this study it was observed that food models may contribute to the overestimation trend
in portion size estimation. Because the plastic molding material fills in the air spaces
between the food particles, it appears that more food is present than what is intended
to be shown. Additionally, amorphous foods depicted through food models are rigid,
which is contrary to their flowing form in reality. In the studies reported in this
document, great care was taken to point out these discrepancies during the training
program. Even though the use of food models (or pictures) for training purposes has
obvious logistical advantages over real foods, their use should be investigated more
thoroughly before they are recommended for general use.
Most importantly, the use of food models may be contributing to the
overestimation vs. underreporting phenomenon discussed in Chapter 6. The
investigation of this apparent contradiction in trends requires a study design which

120
includes training and testing in portion size estimation, the completion of multiple
days of estimated diet records (or other method of self-reporting dietary intake), and
an independent method by which to concurrently validate the reported dietary intake
(e.g. doubly labeled water).
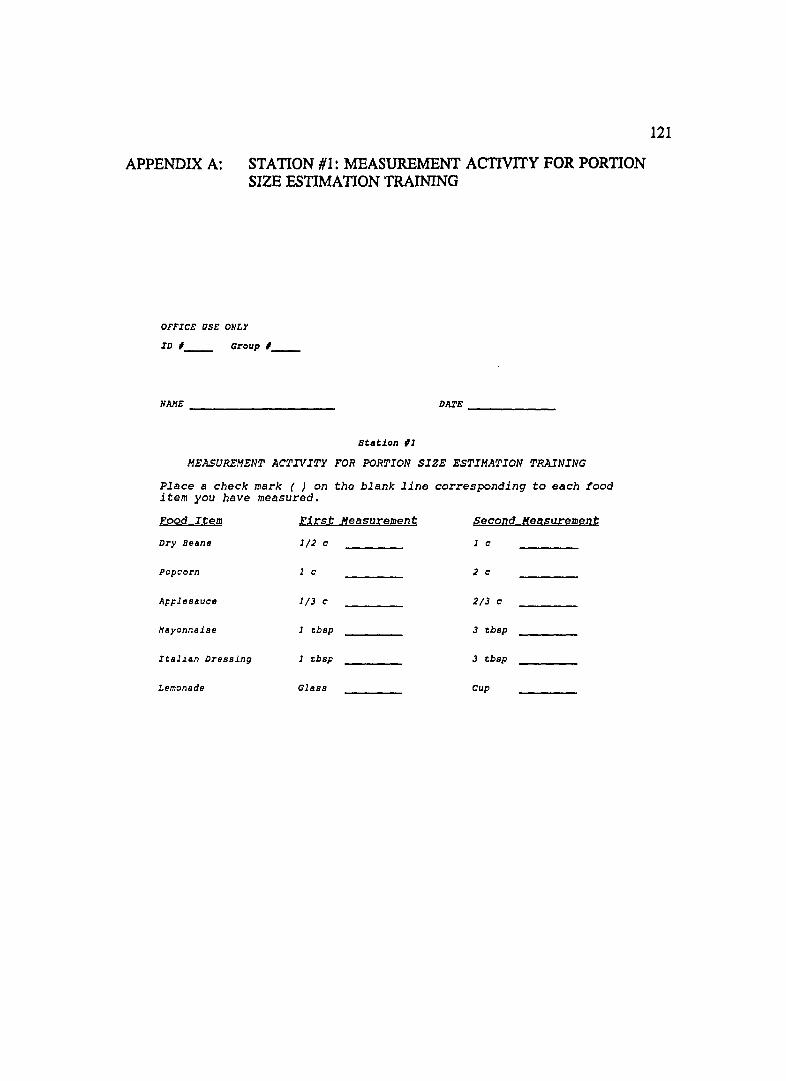
APPENDIX A: STATION #1: MEASUREMENT ACTIVITY FOR PORTION SIZE ESTIMATION TRAINING
OFFICE USE ONLY
ID ,__ Group , __
NAJ1E DIU'E _____ _
stlltion 11
MEASUREMENT ACTIVITY FOR PORTION SIZE ESTIMATION TRAINING
Place a check mark ( ) on the blank line corresponding to each food item you have measured.
Eood Item r.J,l:.st M,easurement ~econd M,easy;:.ement
Dry Beans 1/2 c 1 c
Popcorn 1 c 2 c
Applesauce 1/3 c 2/3 c
Hllyonnaise 1 tbsp 3 tbsp
Ieal~an Dressing 1 tbsp 3 tbsp
Lemonade Glass Cup
121

APPENDIX B: STATION #2: FOOD MODELS ACTIVITY FOR PORTION SIZE ESTIMATION TRAINING
OFFICE OSE ONLY
ID ,__ Group , __
HAHE DAXE ______ _
Station #2
FOOD MODELS ACTIVITY FOR PORTION SIZE ESTIMATION TRAINING
Observe each numbered food item on the table. Estimate the amount of each food item, and record that amount in cups, tablespoons or fluid ounces on the blank line corresponding to that food item. Then record the actual amount (from the answer cards) on the appropriate line.
Food Item Estimated Amount Actual Amount
Spaghetti ____ cups cups
Coleslaw ____ cups cups
French Dressing ____ tbsp tbsp
Hacaroni ____ cups cups
Spinach ____ ,cups cups
Beef Stew ____ cups cups
Kidney beans ____ cups cups
Tea ____ cups cups
____ fluid oz fl oz
Pudding ____ cups cups
Ca ul if lower ____ cups cups
Tossed Salad ____ cups cups
Oa tmeal ____ cups cups
122
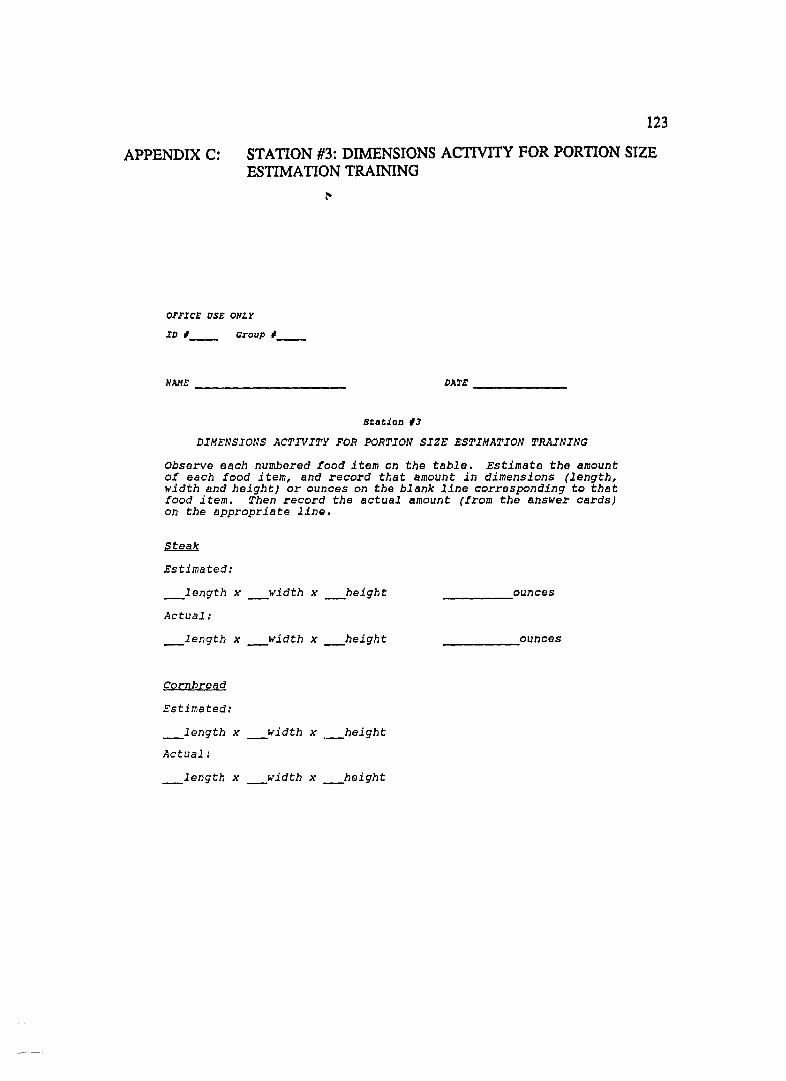
APPENDIX C:
123
STATION #3: DIMENSIONS ACTIVITY FOR PORTION SIZE ESTIMATION TRAINING
OFFICE aSE ONLY
ID #__ Group # __
NAHE DATE ________ _
Stlltion #3
DIMENSIONS ACTIVITY FOR PORTION SIZE ESTIMATION TRAINING
Observe each numbered food item on the table. Estimate the amount of each food item, and record that amount in dimensions (length, width and height) or ounces on the blank line corresponding to that food item. Then record the actual amount (from the answer cards) on the appropriate line.
Estimated:
_length x _width x _height
Actual:
_length x _width x _height
Cornbread
Estimated:
_length x _width x ._height
Actual:
_length x _width x _height
______ ,ounces
_________ ounces
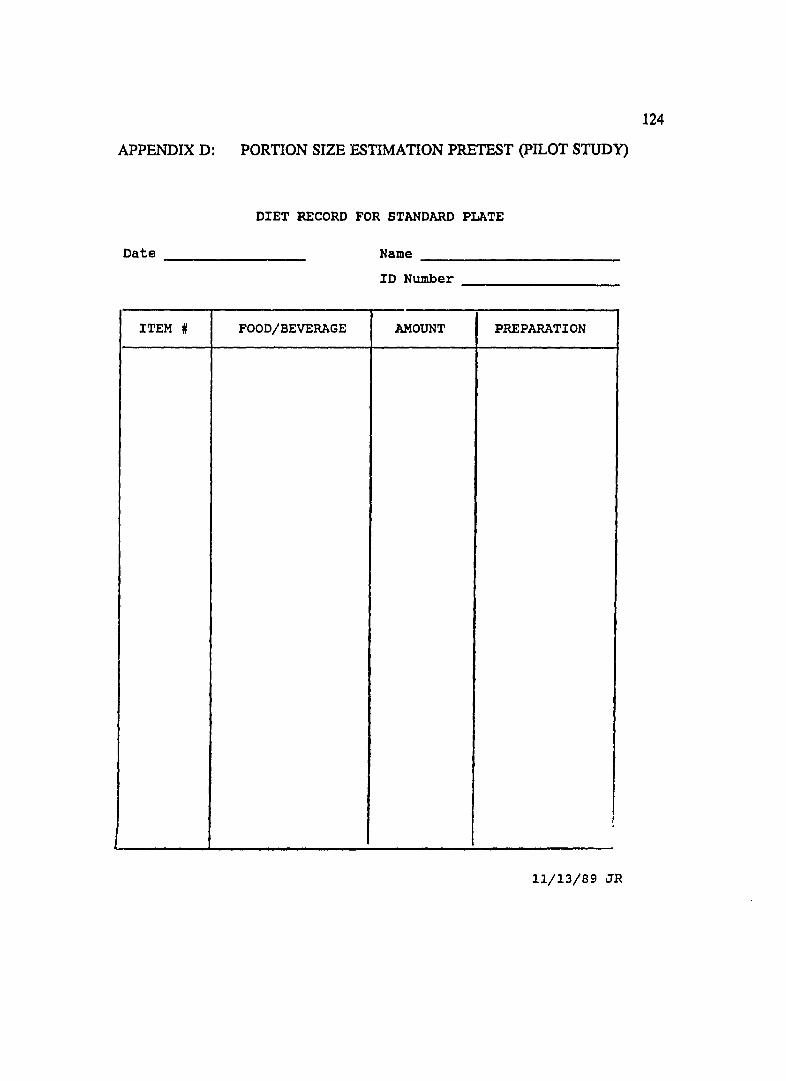
124
APPENDIX D: PORTION SIZE ESTIMATION PRETEST (pILOT STUDY)
DIET RECORD FOR STANDARD PLATE
Date ______ _ Name _________ _
ID Number _______ _
ITEM ~ FOOD/BEVERAGE AMOUNT PREPARATION
!
11/13/89 JR

125
APPENDIXE: PORTION SIZE ESTIMATION paSTIEST 1 (pILOT STUDY)
NA.\1E: _____________________ _ 1.0.# ________ _
PORTION·SIZE ESTIMATION
Observe each numbered food item on the table. Describe each food on the blank line for the corresponding item number. Then estimate the umount of each food item, and record that amount in cups, tablespoons, teaspoons, ounces, or dimensions on the blank line corresponding to that food item.
Food Hem Estimated Amounts
1. 1.
2. 2.
3. 3.
4. 4.
5. 5.
6. 6. (in ounces)
7. 7. (in ounces)
S. S, (in ounces)
9 9.
lO. 10.
11.
. ~ 12,
:3 13, (in small, medium, or Inrge)
4 ~', 14, (in smnll, medium, or large)
:5. 15, (in dimensions)
:6 16, (in dimensions)
17. 17, (in dimensions)

APPENDIX F:
Name:
126
PORTION SIZE ESTIMATION POSITEST 2 (pILOT STUDY)
I.D.#: ___ _
PORTION-SIZE ESTIMATION
FOLLOW-UP TEST
Observe each numbered food item. Describe each food on the blank line for the corresponding item number. Then estimate the amount of each food item, and record that amount in cups/ tablespoons, teaspoons, ounces or dimensions on the blank line corresponding to that food item.
FOOD ITEM
1.
2.
3.
4.
5.
6.
7.
8.
9.
10.
11.
12.
13.
14.
15.
16.
17.
s = small, m = medium,
ESTIMATED AMOUNTS
1.
2.
3.
4.
5.
6.
7.
8.
9.
10.
11.
12.
13.
14.
15.
16.
17.
1 =
(in ounces)
(in ounces)
(in ounces)
(in s/ m/ or 1)
(in s/ m/ or 1)
_______ (in dimensions)
(in dimensions)
_______ (in dimensions)
large 10/90 JW

APPENDIX G: PORTION SIZE ESTIMATION TEST (MAIN STUDy)
PORTION SIZE ESTIMATION TEST
NAME ________________ ___ DATE ____________ __
FOR EACH OF THE FOLJ:.CWING ~O BEVERAGES, PLEASE ESTIMATE THE AMOUNT OF BEVERAGE PRESENT IN BOTH CUPS AND FLUID OUNCES:
1. HILl{
____ cups _____ ,fluid ounces
2. TEA
____ cups ____ ,iluid ounces
FOR THE FOLLONING FOOD, PLEASE ESTIMATE THE AMOUNT OF FOOD PRESENT IN BOTH DIMENSIONS (length/width/height) AND OUNCES:
3. STEAK
__ length Jt __ width Jt __ height ____ ounces
FOR THE FOLLOIHNG FOOD, PLEASE ESTIMATE THE AMOUNT OF FOOD PRESENT IN DIMENSIONS ONLY:
4. CAKE WITH ICING
__ length Jt __ width Jt __ heJ.ght
FOR THE FOLLOh'ING FOUR FOODS, PLEASE ESTIMATE THE AMOUNT OF FOOD PRESE1;T IN CUPS ONLY:
5. FLAKE CEREAL 6. REFRIED BEANS
____ cups ____ cups
7. COrTAGE CHEESE 8. PEAS
____ cups ____ cups
FOR THE FOLLOIl'ING FOOD, PLEASE ESTIMATE THE AMOUNT OF FOOD PRESENT IN TABLESPOONS ONLY:
9. RANCH S!.:..AD DRESSIIo'G
____ tablespoons
127

128
APPENDIXH: HUMAN SUBJECTS COMMITTEE APPROVAL LETTER
THE U"'IVERSJn or
Human Sublec'. Committe. ARIZONA HE~LTH SCIE'<CES CE"'TER
-ua 1690 N. Warren !Bldg S26BJ Tuc.on. Amona 85724 16021626·6721 or 626·7575
May 27, 1993
Judith L. Weber, B.A. Department of Nutritional sciences Family and Consumer Resources Shantz Building, Room 118 Main campus
RE: EFFECT OF TRAINING ON PORTION SIZE ESTIMATION
Dear Ms. Weber:
We received documents concerning your above cited project. Regulations published by the u.s. Department of Health and Human Services (45 CFR Part 46.101(b) (2)) exempt this type of research from review by our committee.
Thank you for informing us of your work. If you have any questions concerning the above, please contact this office.
sincerely yours,
I Jl~l1li.-. F;S~ Wil~':- Denny, M~. Chairman, Human Subjects Committee
WFD:sj
cc: Departmental/College Review Committee
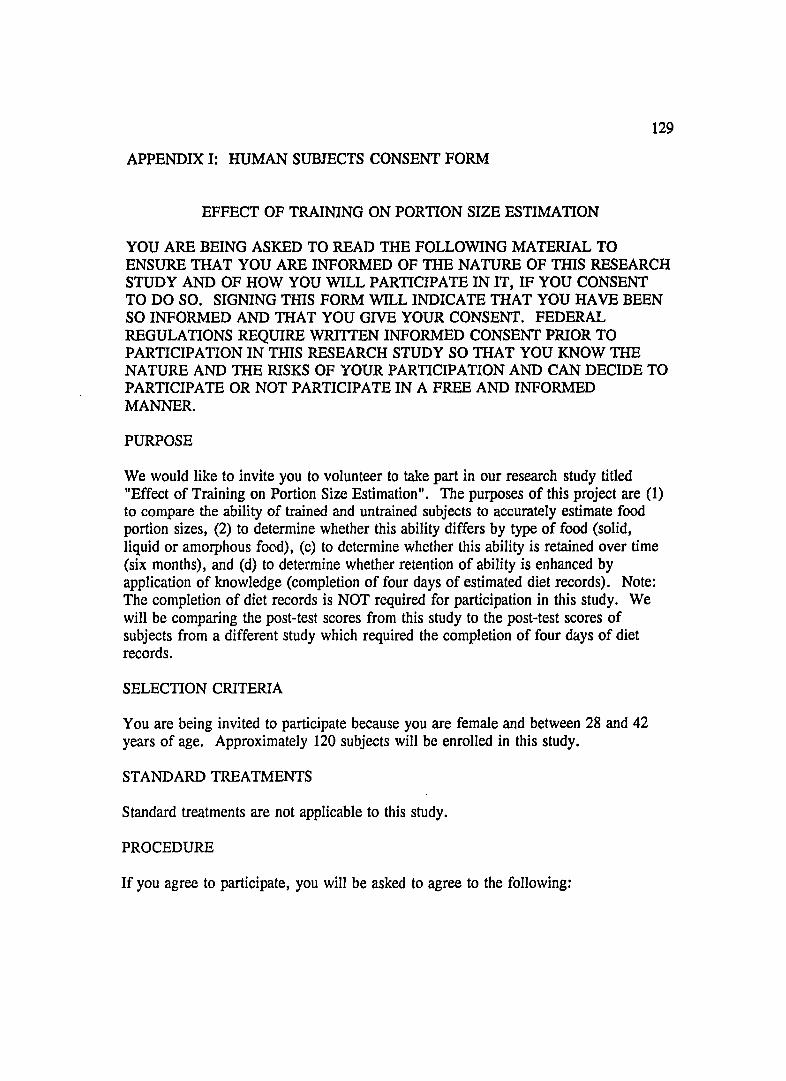
129
APPENDIX I: HUMAN SUBJECTS CONSENT FORM
EFFECT OF TRAINING ON PORTION SIZE ESTIMATION
YOU ARE BEING ASKED TO READ THE FOLLOWING MATERIAL TO ENSURE THAT YOU ARE INFORMED OF THE NATURE OF THIS RESEARCH STUDY AND OF HOW YOU WILL PARTICIPATE IN IT, IF YOU CONSENT TO DO SO. SIGNING THIS FORM WILL INDICATE THAT YOU HAVE BEEN SO INFORMED AND THAT YOU GIVE YOUR CONSENT. FEDERAL REGULATIONS REQUIRE WRITTEN INFORMED CONSENT PRIOR TO PARTICIPATION IN TIllS RESEARCH STUDY SO THAT YOU KNOW THE NATURE AND THE RISKS OF YOUR PARTICIPATION AND CAN DECIDE TO PARTICIPATE OR NOT PARTICIPATE IN A FREE AND INFORMED MANNER.
PURPOSE
We would like to invite you to volunteer to take part in our research study titled "Effect of Training on Portion Size Estimation". The purposes of this project are (1) to compare the ability of trained and untrained subjects to accurately estimate food portion sizes, (2) to determine whether this ability differs by type of food (solid, liquid or amorphous fOCld), (c) to determine whether this ability is retained over time (six months), and (d) to determine whether retention of ability is enhanced by application of knowledge (completion of four days of estimated diet records). Note: The completion of diet records is NOT required for participation in this study. We will be comparing the post-test scores from this study to the post-test scores of subjects from a different study which required the completion of four days of diet records.
SELECTION CRITERIA
You are being invited to participate because you are female and between 28 and 42 years of age. Approximately 120 subjects will be enrolled in this study.
STANDARD TREATMENTS
Standard treatments are not applicable to this study.
PROCEDURE
If you agree to participate, you will be asked to agree to the following:
130
(1) You will be randomly assigned to one of four groups: (a) a control group that will be tested once (one post-test), (b) a control group that will be tested three times (one pre-test and two post-tests), (c) a treatment group that will participate in the portion size estimation training program and be tested once (one post-test), or (d) a treatment group that will participate in the training program and be tested three times (one pre-test and two post-tests).
(2) The time commitment required of you (depending on your group assignment) will be 15 minutes per test and one hour for the training program.
(3) If you are assigned to either Group "a" or "c" above, you will be asked to come in only one time for your test or test and training. If you are assigned to Group "b" above, you will be asked to come in three times. You will take the second test approximately 1-2 weeks after the first test, and the third test in September 1992. If you are assigned to Group "d" above, you will be asked to come in two times. You will participate in the training program and take the first and second tests all in one session, then come in the second time to take the third test in September 1992.
(4) For each test, you will be asked to estimate the amounts of nine foods on display.
(5) For the training program, you will be asked to participate in three activities: (a) the measurement of six foods (two solids, two liquids, two amorphous), (b) the quantity estimation of 12 food models, and (c) the quantity estimation of two foods by dimensions. The training will take place in groups of 4-12 subjects per session.
RISKS
There are no risks to you as a participant in this study.
BENEFITS
Each participant in this study will have a chance to win $100 from a random drawing at the completion of the study. This means that the drawing will take place in late September or early October after the completion of the third test (even though only Groups "b" and lid" will be taking that test).
CONFIDENTIALITY
Your identity as a participant in this study will be guaranteed by the assignment of a subject number. Only subject numbers will be used in the analysis and reporting of the results of this study.

131
PARTICIPATION COSTS
There are no costs to you as a participant in this study.
LIABILITY
Not applicable; this study does not involve risk to the participants.
AUTHORIZATION
In giving my consent by signing this form, I agree that the methods, inconveniences, risks, and benefits have been explained to me and my questions have been answered. I understand that I may ask questions at any time and that I am free to withdraw from the project at any time without causing bad feelings or affecting my medical care. My participation in this project may be ended by the investigator or by the sponsor for reasons that would be explained. New information developed during the course of this study which may affect my willingness to continue in this research project will be given to me as it becomes available. I understand that this consent form will be filed in an area designated by the human subjects committee with access restricted to the Principal Investigator, Judith L. Weber, or authorized representative of the department. I understand that I do not give up any of my legal rights by signing this form. A copy of this signed consent form will be given to me.
Subject's Signature Date
INVESTIGATOR'S AFFIDAVIT
I have carefully explained to the subject the nature of the above project. I hereby certify that to the best of my knowledge the person who is signing this consent form understands clearly the nature, demands, benefits, and risks involved in his/her participation and his/her signature is legally valid. A medical problem or language or educational barrier has not precluded this understanding.
Investigator'S Signature Date

132
REFERENCES
(1) Bakkum A, Bloemberg B, van Staveren WA, Verschuren M, West CEo The relative validity of a retrospective estimate of food consumption based on a current dietary history and a food frequency list. Nutr Cancer 1988;11:41-53.
(2) Barrett-Connor E. Nutrition epidemiology: how do we know what they ate? Am J Clin Nutr 1991;54:182S-7S.
(3) Bingham SA. The dietary assessment of individuals; methods, accuracy, new techniques and recommendations. Nut Ab Rev (Series A) 1987;57(10):705-42.
(4) Burke BS. The dir.tary history as a tool in research. J Am Diet Assoc 1947;23: 1041-6.
(5) Hankin JH. 23rd Lenna Frances Cooper Memorial Lecture: A diet history method for research, clinical, and community use. J Am Diet Assoc 1986;86:868-75.
(6) Lee-Han H, McGuire V, Boyd NF. A review of the methods used by studies of dietary measurement. J Clin Epidemiol 1989;42(3):269-79.
(7) Livingstone MBE, Prentice AM, Coward WA, Strain JJ, Black AE, Davies PSW, Stewart CM, McKenna PG, Whitehead RG. Validation of estimates of energy intake by weighed dietary record and diet history in children and adolescents. Am J Clin Nutr 1992;56:29-35.
(8) van Staveren WA, 0 de Boer J, Burema J. Validity and reproducibility of a dietary history method estimating the usual food intake during one month. Am J Clin Nutr 1985;42:554-9.
(9) Roberge AG, Sevigny J, Seoane N, Richard L. Dietary intake data: usefulness and limitations. Prog Food Nutr Sci 1984;8:27-42.
(10) Bingham SA. Limitations of the various methods for collecting dietary intake data. Ann Nutr Metab 1991;35:117-27.
(11) Smith-Porter E, Cook RA. Comparison of nutrient intake levels in older adults as estimated by self-administered versus interview-assisted food frequency questionnaire. J Nutr Educ 1990;22(6):298-302.
133
(12) Zulkifli SN, Yu SM. The food frequency method for dietary assessment. I Am Diet Assoc 1992;92:681-5.
(13) Pietinen P, Hartman AM, Haapa E, Rasanen L, Haapakoski J, Palmgren I, Albanes D, Virtamo I, Huttunen IK. Reproducibility and validity of dietary assessment instmments. Am I Epidemiol 1988; 128:667-76.
(14) Quandt SA. Methods for determining dietary intake. In: Nutritional Anthropology. Alan R, Liss, Inc, 1987:67-84.
(15) Acheson 10, Campbell IT, Edholm OG, Miller DS, Stock MI. The measurement of food and energy intake in man - an evaluation of some techniques. Am I Clin Nutr 1980;33: 1147-54.
(16) Morgan 10, Iohnson SR,Rizek RL, Reese R, Stampley GL. Collection of food intake data: an evaluation of methods. I Am Diet Assoc 1987;87:888-96.
(17) Balogh M, Kahn HA, Medalie m. Random repeat 24-hour dietary recalls. Am I Clin Nutr 1971;24:304-10.
(18) Beaton GH, Milner I, Corey P, McGuire V, Cousins M, Stewart E, de Ramos M, Hewitt D, Grambsch PV, Kassim N, Little IA. Sources of variance in 24-hour dietary recall data: implications for nutrition study design and interpretation. Am I Clin Nutr 1979;32:2546-59.
(19) Chianetta MM, Head MK. Effect of prior notification on accuracy of dietary recall by the elderly. I Am Diet Assoc 1992;92:741-3.
(20) Dwyer IT, Krall EA, Coleman KA. The problem of memory in nutritional epidemiology research. I Am Diet Assoc 1987;87: 1509-12.
(21) Gam SM, Larkin FA, Cole PE. The problem with one-day dietary intakes. 1976;5:245-7.
(22) Morgan RW, lain M, Miller AB, Choi NW, Matthews V, Munan L, Burch ID, Feather I, Howe GR, Kelly A. A comparison of dietary methods in epidemiologic studies. Am I Epidemiol 1978; 107(6):488-98.
(23) Rush D, Kristal AR. Methodologic studies during pregnancy: the reliability of the 24-hour dietary recall. Am I Clin Nutr 1982;35:1259-68.

134
(24) Suitor CJW, Gardner II Willett WC. A comparison of food frequency and diet recall methods in studies of nutrient intake of low-income pregnant women. J Am Diet Assoc 1989;89:1786-94.
(25) Livingstone MBE, Prentice AM, Strain JJ, Coward WA, Black AE, Barker ME, McKenna PG, Whitehead RG. Accuracy of weighed dietary records in studies of diet and health. Br Med J 1990;300:708-12.
(26) Stockley L. Changes in habitual food intake during weighed inventory surveys and duplicate diet collections. A short review. Bcol Food Nutr 1985;17:263-9.
(27) Blake AJ, Guthrie HA, Smiciklas-Wright H. Accuracy of food portion estimation by overweight and normal-weight subjects. J Am Diet Assoc 1989;89(7):962-4.
(28) Guthrie HA. Selection and quantification of typical food portions by young adults. J Am Diet Assoc 1984;84(12): 1440-4.
(29) Lansky D, Brownell KD. Estimates of food quantity and calories: errors in self-report among obese patients. Am J Clin Nutr 1982;35:727-32.
(30) Yuhas JA, Bolland JE, Bolland TW. The impact of training, food type, gender, and container size on the estimation of food portion sizes. J Am Diet Assoc 1989;89: 1473-7.
(31) Smiciklas-Wright H, Guthrie HA, Cook RA, Beal VA, Brown PT, Crane S, Lachance PA, Laus MI, Rasmussen AI. Subjects' ability to estimate portions of beverages. Northeastern Cooperative Regional Research Publication, Progress Report 390, 1988.
(32) Bolland JE, Yuhas, JA, Bolland, TW. Estimation of food portion sizes: effectiveness of training. J Am Diet Assoc 1988;88:817-21.
(33) Bolland JE, Ward JY, Bolland TW. Improved accuracy of estimating food quantities up to 4 weekI! after training. J Am Diet Assoc 1990;90:1402-4,1407.
(34) Gibson RS. Sources of error and variability in dietary assessment methods: A review. J Can Diet Assoc 1987;48:150-5.
(35) Beal VA. The nutritional history in longitudinal research. J Am Diet Assoc 1967;51 :426.
(36) Errors in reporting habitual energy intake. Nut Rev 1991;49(7):215-17.

135
(37) Huck SW, Cormier WH, Bounds WG. Reading Statistics and Research. New York: Harper and Row, Publishers, 1974.
(38) Beaton GH, Milner J, McGuire V, Feather TE, Little JA. Sources of variance in 24-hour dietary recall data: implications for nutrition study design and interpretation. Carbohydrate sources, vitamins, and minerals. Am J Clin Nutr 1983;37:986-95.
(39) Sempos CT, Johnson NE, Smith EL, Gilligan C. Effects of intra-individual and interindividual variation in repeated dietary records. Am J Epidemiol 1985; 121: 120-30.
(40) Gibson RS, Gibson IL, Kitching J. A study of inter- and intrasubject variability in seven-day weighed dietary intakes with particular emphasis on trace elements. BioI Trace Elem Res 1985;8:79-91.
(41) Todd KS, Hudes M, Calloway DH. Food intake measurements: problems and approaches. Am J Clin Nutr 1983;37: 139-46.
(42) Pao EM, Fleming KH, Guenther PM, Mickel SI. Foods commonly eaten by individuals: Amount per day and per eating occasion. Home Economics Research Report No. 44. Human Nutrition Information Service, U.S. Department of Agriculture, Washington, D.C., 1982.
(43) Worsley A, Baghurst KI, Leitch DR. Social desirability response bias and dietary inventory responses. Hum Nutr: Appl Nutr 1984;38A:29-35.
(44) Mathews LI. Principles of interviewing and patient counseling. J Am Diet Assoc 1967;50:469-74.
(45) Wakefield LM. The interview technique in research - source of bias. J Home Bcon 1966;58:640-46.
(46) Madden JP, Goodman SJ, Thompson FE. Recording the 24-hour dietary recall. Department of Agricultural Economics and Rural Soc. Pennsylvania State University Report No. 109, 1974.
(47) Gersovitz M, Madden IP, Smiciklas-Wright H. Validity of the 24-hour dietary recall and seven-day record for group comparisons. J Am Diet Assoc 1978;73:48-55.

136
(48) Houtkooper LB, Ritenbaugh C, Aickin M, Lohman TG, Going SB, Weber IL, Greaves KA, Boyden TW, Pamenter RW, Hall MC. Relationships among nutrients, body composition, and change in bone mineral density in healthy premenopausal women. Am I Clin Nutr, Submitted.
(49) National Research Council. Nutrient Adequacy. Assessment Using Food Consumption Surveys. Subcommittee on Criteria for Dietary Evaluation, Coordinating Committee on Evaluation of Food Consumption Surveys, Food and Nutrition Board, Commission on Life Sciences. National Research Council, 1986.
(50) Hoover LW, Pelican S. Nutrient data bases - considerations for educators. I Nutr Ed 1984;16:58-62.
(51) Hoover LW, Perloff BP. Model for review of nutrient data base system capabilities. Columbia, MO: University of Missouri-Columbia Printing Services, 1981.
(52) Webb CA, Yuhas JA. Ability of WIC clientele to estimate food quantities. J Am Diet Assoc 1988;88:601-2.
(53) Young CM, Chalmers FW, Church HN, Clayton MM, Gates LO, Hagan GC, Steele BF, Tucker RE, Wertz AW, Foster WD. Cooperative Nutritional Status Studies in the Northeast Region. III. Contributions to Dietary Methodology Studies. University of Massachusetts Agricultural Experiment Station, Amherst, Mass. Bulletin No. 469, August 1952.
(54) Thompson CH, Head MK, Rodman SM. Factors influencing accuracy in estimating plate waste. I Am Diet Assoc 1987;87: 1219-20.
(55) Moore MC, Judlin BC, Kennemur PM. Using graduated food models in taking dietary histories. I Am Diet Assoc 1967;51:447-50.
(56) Improving estimates of food and nutrient intake: Applications to individuals and groups. Commentary. J Am Diet Assoc 1985;85:295-6.
(57) Rapp SA, Dubbert PM, Burkett PA, Buttross Y. Food portion size estimation by men with Type II diabetes. J Am Diet Assoc 1986;86:249-51.
(58) Faggiano F, Vineis P, Cravanzola D, Pisani P, Xompero G, Riboli E, Kaaks R. Validation of a method for the estimation of food portion size. Epidemiol 1992;3(4):379-82.
(59) Moore-Armitage MM, Duncan SE, Barker WF, Baron RF. Nutrition knowledge, complexity of food systems and form of food presentation: its relationship to caloric and quantity estimations. Association for the Study of Food and Society, Third Annual Meeting, 1989.
(60) Posner BM, Smigelski C, Duggal A, Morgan IL, Cobb I, Cupples A. Validation of two-dimensional models for estimation of portion size in nutrition research. I Am Diet Assoc 1992;92:738-41.
(61) Kintsch W. The paradigms of verbal learning. In Memory and Recognition. New York: John Wiley and Sons, 1977.
(62) Darley J, Glucksberg S, Kamin L, Kinchla R. Memory. In Psychology. 2nd ed. Englewood Cliffs, NJ: Prentice-Hall, 1984.
(63) Shavelson RJ. Statistical Reasoning for the Behavioral Sciences. Allyn and Bacon, Inc. Needham Heights, Massachusetts, 1988.
(64) Hays WL. Statistics. CBS College Publishing. New York, New York, 1981.
137
(65) Neter, Wasserman. Applied Linear Statistical Models. Richard D. Irwin, Inc. Homewood, Illinois, 1974.
(66) Westerterp KR, Saris WH, van Es M, ten Hoor F. Use of the doubly labeled water technique in humans during heavy sustained exercise. J Appl Physiol 1986;61 (6):2162-7.
(67) Haggarty P, McGaw BA, Maughan RJ, Fenn C. Energy expenditure of elite female athletes measured by the doubly-labeledwatermethod.1988;Proc. Nutr. Soc.47:35A.
(68) Prentice AM, Black AE, Coward WA, Davies HL, Goldberg GR, Murgatroyd PR, Ashford J, Sawyer M, Whitehead. High levels of energy expenditure in obese women. Br Med J 1986;292:983-6.
(69) Livingstone MBE, Prentice AM, Strain JJ, Coward WA, Black AE, Barker ME, McKenna PG, Whitehead RG. Accuracy of weighed dietary records in studies of diet and health. Br Med J 1990;300:708-12.
(70) Livingstone MBE, Strain JJ, Nevin GB, Barker ME, Hickey RJ, McKenna PG, Prentice AM, Coward WA, Whitehead RG. The use of weighed dietary records and the doubly-labelled (2H2
180) water method to compare energy intake and expenditure. Proc Nutr Soc 1988;48:21A.
138
(71) Livingstone MBE, Davies PSW, Prentice AM, Coward WA, Black AE, Strain JJ, McKenna PG. Comparison of simultaneous measures of energy intake and expenditure in children and adolescents.
(72) Bandini LG, Schoeller DA, Cyr HN, Dietz WH. Validity of reported energy intake in obese and nonobese adolescents. Am J Clin Nutr 1990;52:421-5.
(73) Lichtman SW, Pisarska K, Berman ER, Pestone M, Dowling H, Offenbacher E, Weisel H, Heshka S, Matthews DE, Heymsfield SB. Discrepancy between !telf-reported and actual caloric intake and exercise in obese subjects. N Engl J Med 1992;327:1893-8.