Embed Size (px)
Citation preview

UMASS FOOD SCIENCEEXTENSION RESEARCH
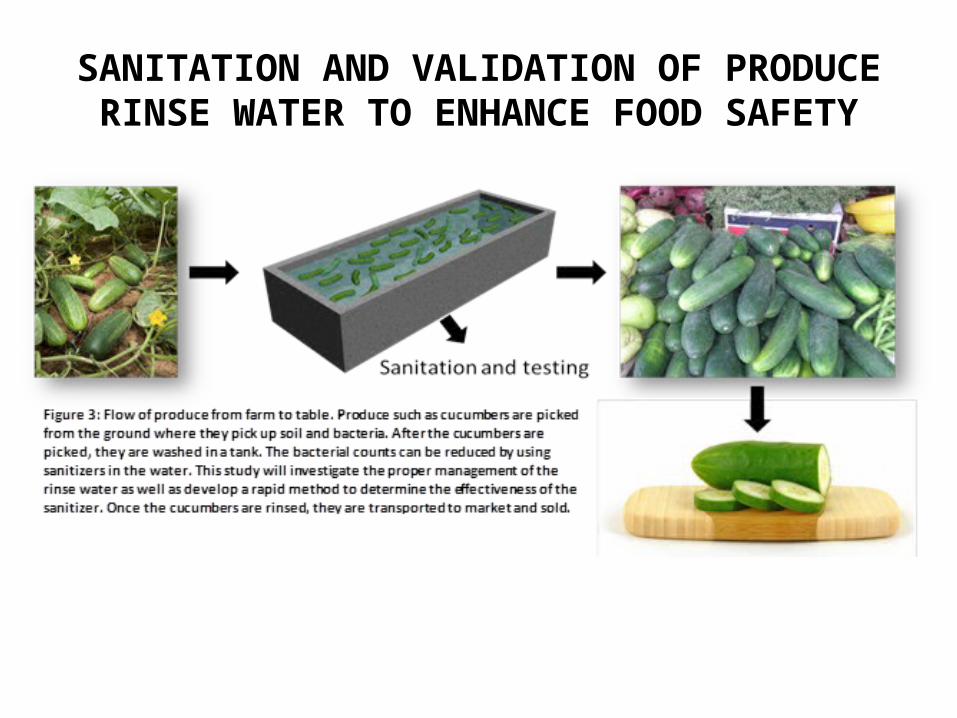
SANITATION AND VALIDATION OF PRODUCE RINSE WATER TO ENHANCE FOOD SAFETY

Results
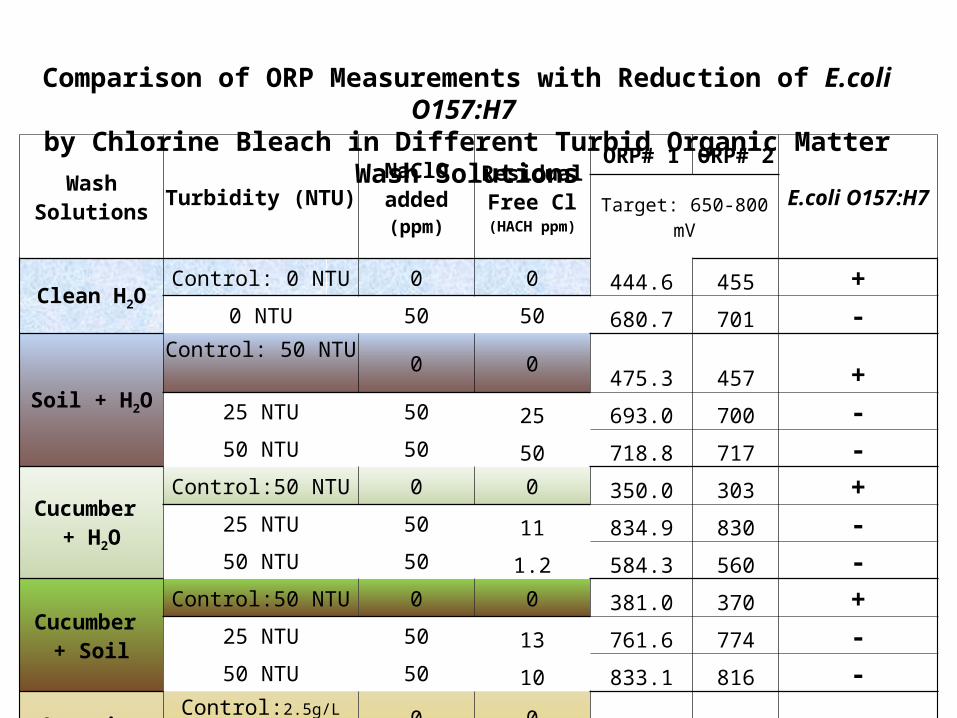
Wash Solutions Turbidity (NTU)
NaClOadded (ppm)
ResidualFree Cl
(HACH ppm)
ORP# 1 ORP# 2
E.coli O157:H7Target: 650-800 mV
Clean H2OControl: 0 NTU 0 0 444.6 455 +
0 NTU 50 50 680.7 701 -
Soil + H2OControl: 50 NTU 0 0 475.3 457 +
25 NTU 50 25 693.0 700 -50 NTU 50 50 718.8 717 -
Cucumber + H2O
Control:50 NTU 0 0 350.0 303 +25 NTU 50 11 834.9 830 -50 NTU 50 1.2 584.3 560 -
Cucumber + Soil
Control:50 NTU 0 0 381.0 370 +25 NTU 50 13 761.6 774 -50 NTU 50 10 833.1 816 -
Organic Challenge
H2O
Control:2.5g/L TOC/TDS 0 0 220.1 223 +2.5 g/L TOC/TDS 50 0 209.9 224 +2.5 g/L TOC/TDS 200 0 211.8 210 +
Comparison of ORP Measurements with Reduction of E.coli O157:H7 by Chlorine Bleach in Different Turbid Organic Matter Wash Solutions
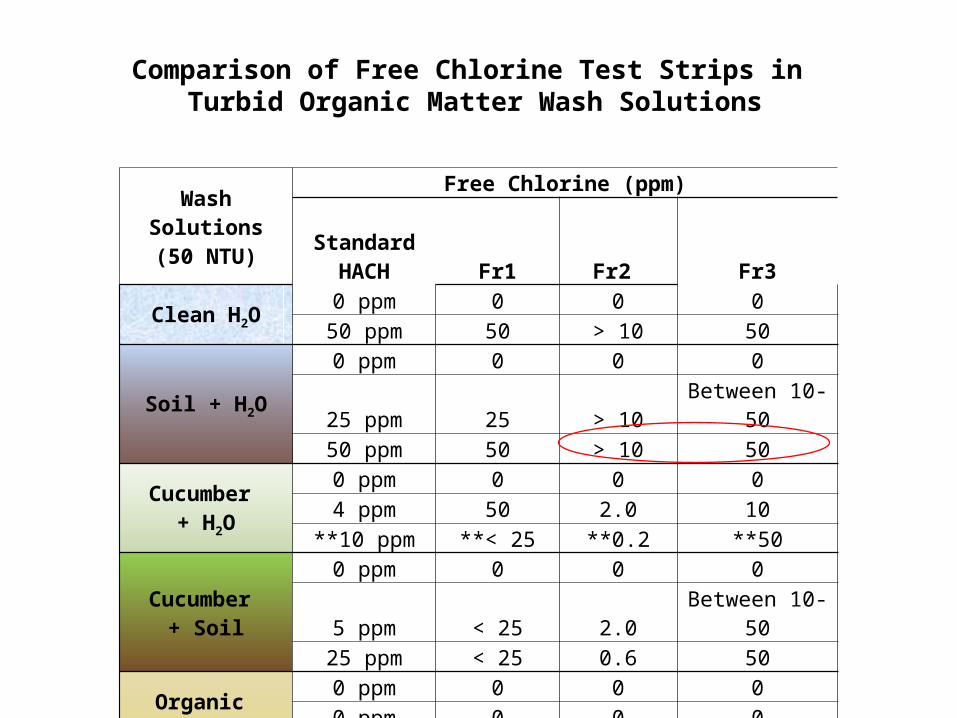
Wash Solutions(50 NTU)
Free Chlorine (ppm)Standard
HACH Fr1 Fr2 Fr3
Clean H2O0 ppm 0 0 0
50 ppm 50 > 10 50
Soil + H2O0 ppm 0 0 0
25 ppm 25 > 10 Between 10-5050 ppm 50 > 10 50
Cucumber + H2O
0 ppm 0 0 04 ppm 50 2.0 10
**10 ppm **< 25 **0.2 **50
Cucumber + Soil
0 ppm 0 0 05 ppm < 25 2.0 Between 10-50
25 ppm < 25 0.6 50
Organic Challenge H2O
0 ppm 0 0 00 ppm 0 0 00 ppm 0 0 0
Comparison of Free Chlorine Test Strips in Turbid Organic Matter Wash Solutions
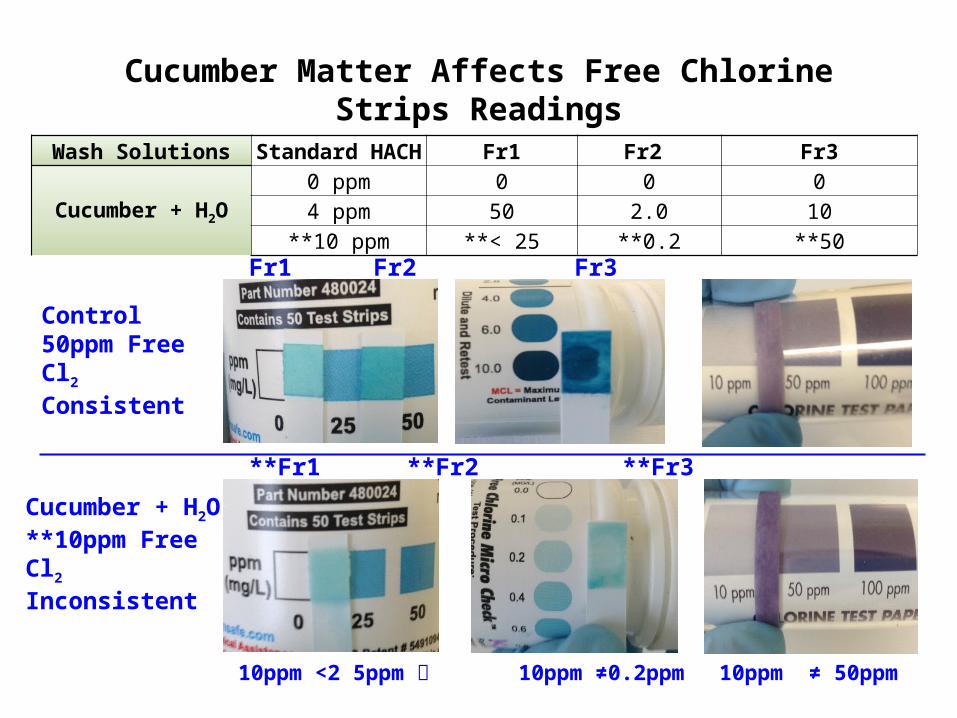
Cucumber Matter Affects Free Chlorine Strips Readings
Wash Solutions Standard HACH Fr1 Fr2 Fr3
Cucumber + H2O0 ppm 0 0 04 ppm 50 2.0 10
**10 ppm **< 25 **0.2 **50
Control50ppm Free Cl2
Consistent
Cucumber + H2O**10ppm Free Cl2
Inconsistent
Fr1 Fr2 Fr3
**Fr1 **Fr2 **Fr3
10ppm <2 5ppm 10ppm ≠0.2ppm 10ppm ≠ 50ppm
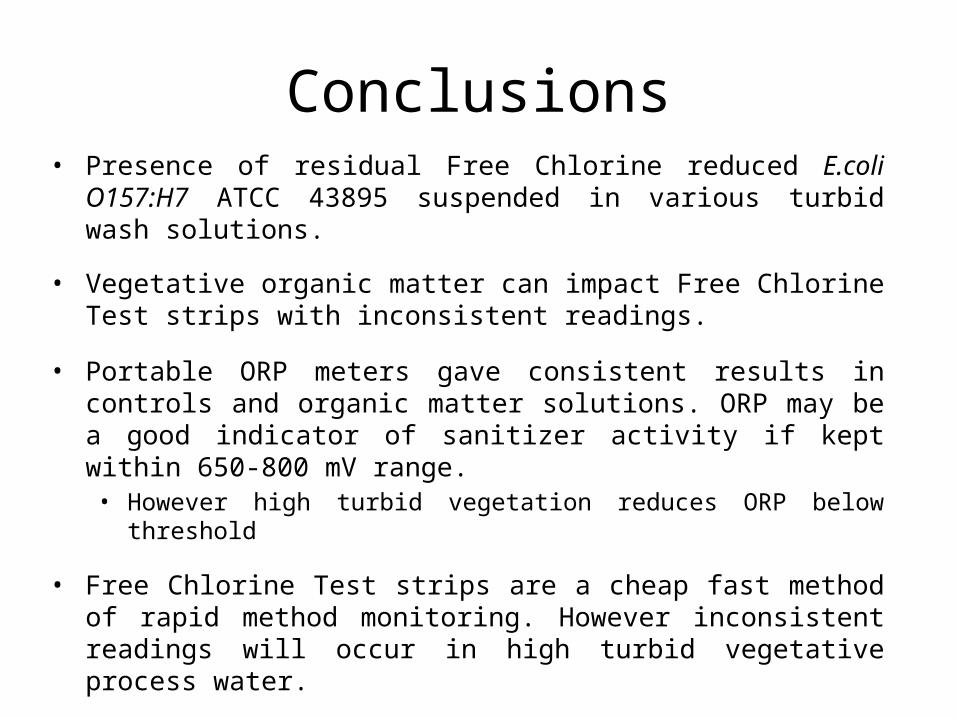
Conclusions• Presence of residual Free Chlorine reduced E.coli O157:H7 ATCC
43895 suspended in various turbid wash solutions.
• Vegetative organic matter can impact Free Chlorine Test strips with inconsistent readings.
• Portable ORP meters gave consistent results in controls and organic matter solutions. ORP may be a good indicator of sanitizer activity if kept within 650-800 mV range. • However high turbid vegetation reduces ORP below threshold
• Free Chlorine Test strips are a cheap fast method of rapid method monitoring. However inconsistent readings will occur in high turbid vegetative process water.

UMass Work In progress

Best Practices for Implementing an On-Farm Food Safety Plan
• Documentation• Environmental monitoring
– River shed– On-farm facilities– Operators
• SOP• Extension Programming
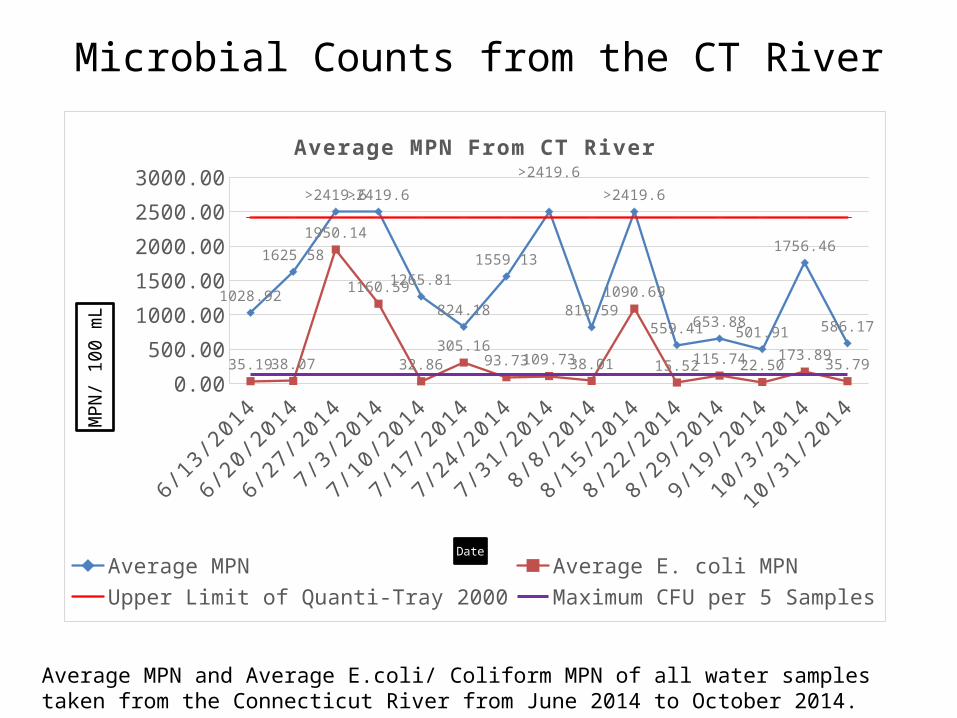
Microbial Counts from the CT River
Average MPN and Average E.coli/ Coliform MPN of all water samples taken from the Connecticut River from June 2014 to October 2014.
6/13/2
014
6/20/2
014
6/27/2
014
7/3/2
014
7/10/2
014
7/17/2
014
7/24/2
014
7/31/2
014
8/8/2
014
8/15/2
014
8/22/2
014
8/29/2
014
9/19/2
014
10/3/2
014
10/31/2
0140.00
500.00
1000.00
1500.00
2000.00
2500.00
3000.00
1028.92
1625.58
>2419.6>2419.6
1265.81
824.18
1559.13
>2419.6
819.59
>2419.6
559.41653.88501.91
1756.46
586.17
35.19 38.07
1950.14
1160.59
32.86
305.1693.73 109.73 38.01
1090.69
15.52 115.74 22.50173.89
35.79
Average MPN From CT River
Average MPN Average E. coli MPN Upper Limit of Quanti-Tray 2000Maximum CFU per 5 Samples
Date
MPN
/ 100
mL
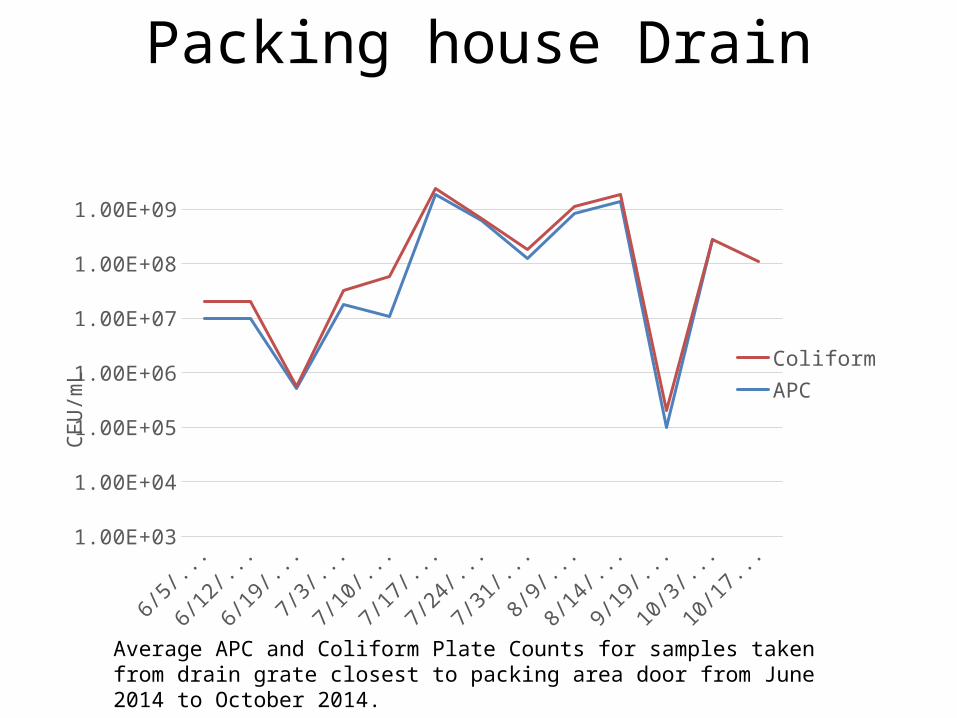
Packing house Drain
6/5/2
014
6/12/...
6/19/...
7/3/2
014
7/10/...
7/17/...
7/24/...
7/31/...
8/9/2
014
8/14/...
9/19/...
10/3/...
10/17/...
1.00E+03
1.00E+04
1.00E+05
1.00E+06
1.00E+07
1.00E+08
1.00E+09
ColiformAPC
CFU/
mL
Average APC and Coliform Plate Counts for samples taken from drain grate closest to packing area door from June 2014 to October 2014.
H1 Day 1 H1 Day 2 H1 Day 3 H2 Day 1 H2 Day 2 H2 Day 3 H3 Day 11.00E+00
1.00E+01
1.00E+02
1.00E+03
1.00E+04
1.00E+05
1.00E+06
1.00E+07
9.99E+00
7.90E+06 5.18E+06
9.99E+00
2.46E+06 3.20E+06
9.99E+00
7.00E+043.31E+05 2.23E+05
8.60E+04 1.53E+05 2.66E+05 2.35E+05
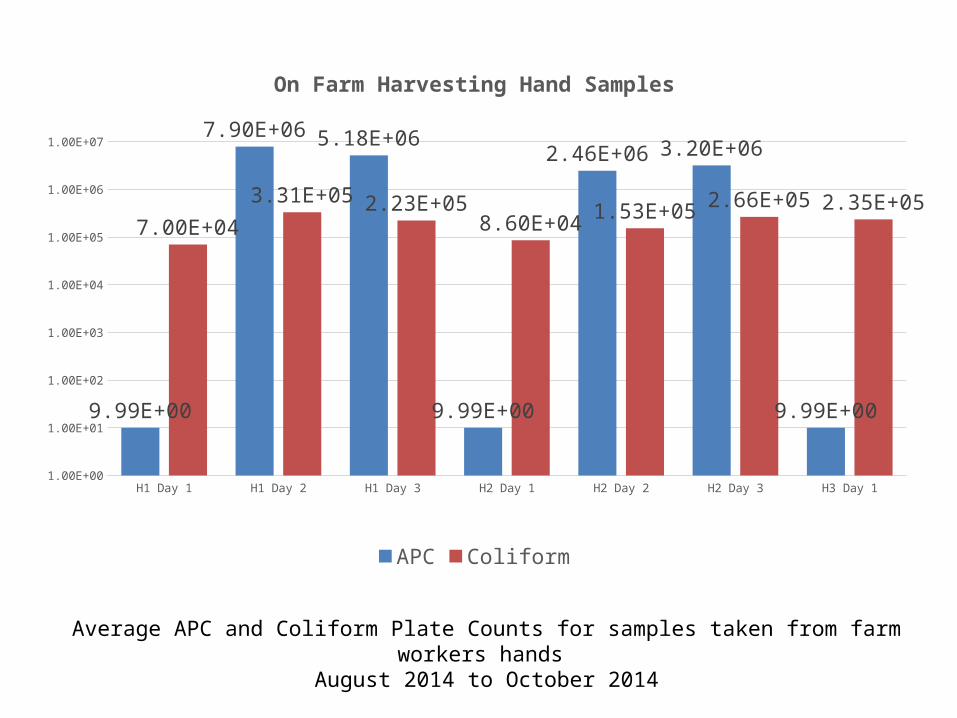
On Farm Harvesting Hand Samples
APC Coliform
Average APC and Coliform Plate Counts for samples taken from farm workers hands August 2014 to October 2014
Next Steps
• Develop and implement SOPs• Establish training program• Continue environmental monitoring• Extension Activities
– On-line materials– Workshops for best food safety practices
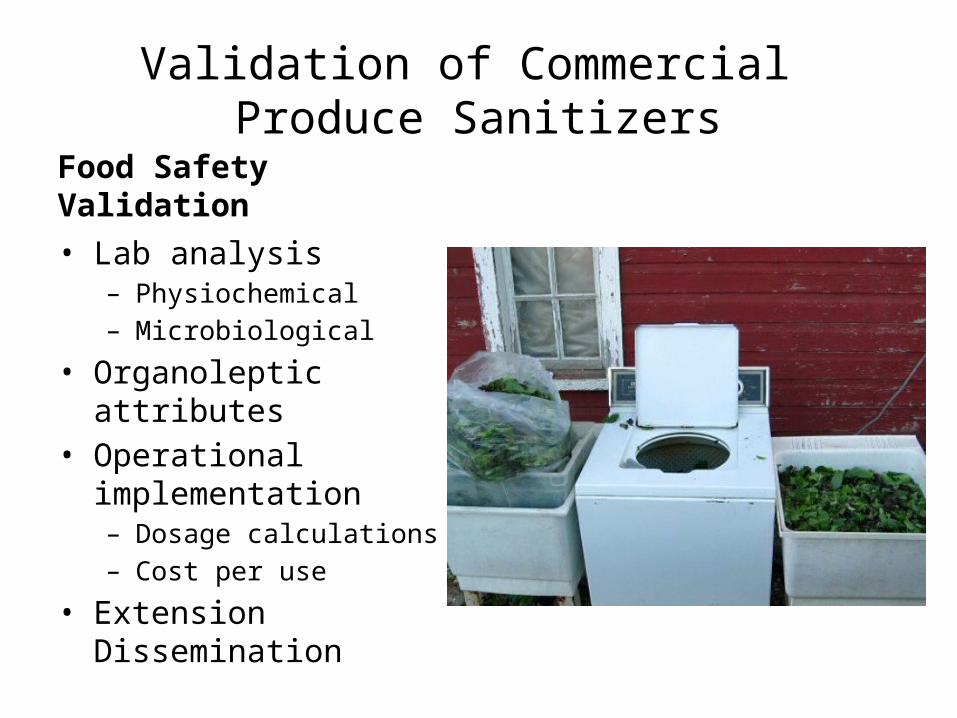
Validation of Commercial Produce Sanitizers
Food Safety Validation• Lab analysis
– Physiochemical– Microbiological
• Organoleptic attributes• Operational implementation
– Dosage calculations– Cost per use
• Extension Dissemination

On Farm Research Needs Diagnostic tools that can support QA on-farm• Must Account for Resource Limitations
– Ease of use:• No/little sample preparation• No/little technical skills
– Account for the farming conditions• Limited electricity
– Affordable– Rapid
• i.e. Agricultural water cannot be used unless the issue has been resolved
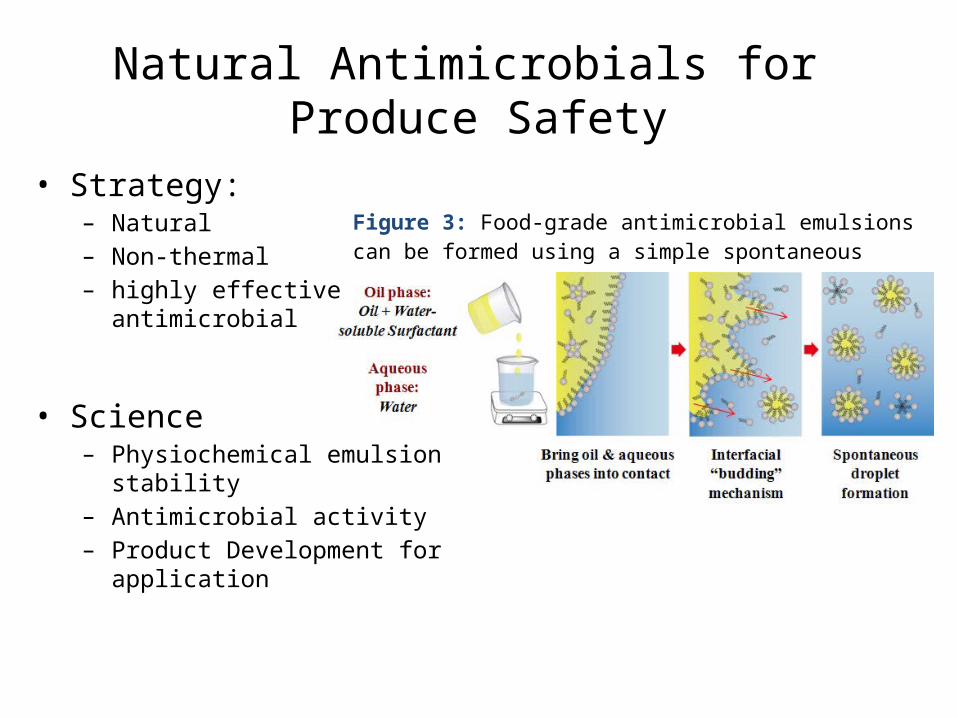
Figure 3: Food-grade antimicrobial emulsions can be formed using a simple spontaneous emulsification method
Natural Antimicrobials for Produce Safety
• Strategy:– Natural– Non-thermal– highly effective
antimicrobial
• Science– Physiochemical emulsion stability– Antimicrobial activity– Product Development for application
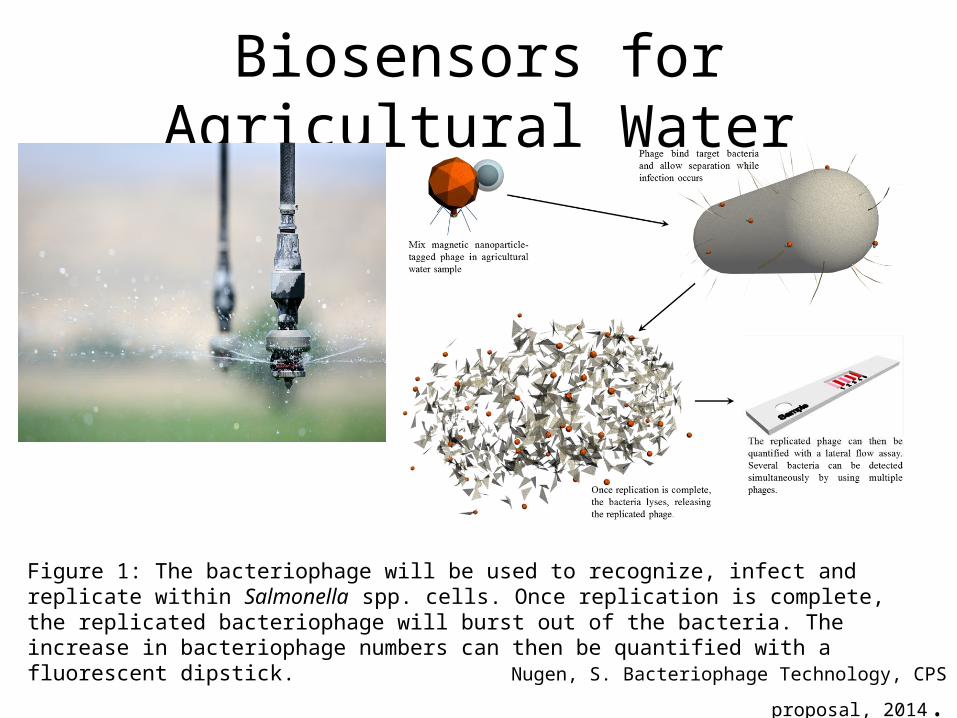
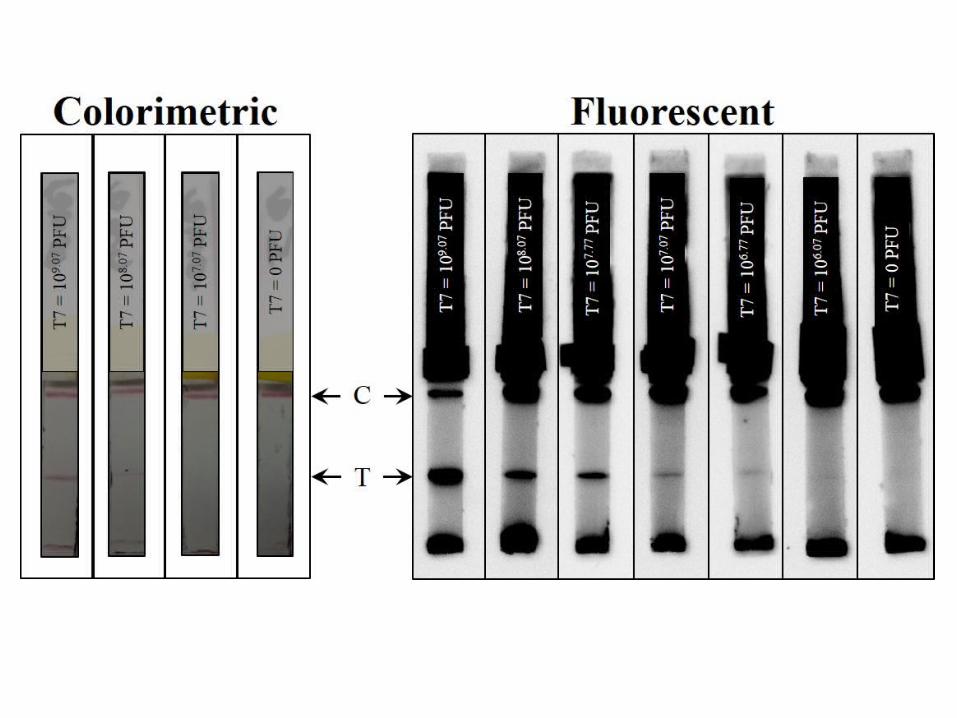
Biosensors for Agricultural Water
Figure 1: The bacteriophage will be used to recognize, infect and replicate within Salmonella spp. cells. Once replication is complete, the replicated bacteriophage will burst out of the bacteria. The increase in bacteriophage numbers can then be quantified with a fluorescent dipstick.
Nugen, S. Bacteriophage Technology, CPS proposal,
2014.

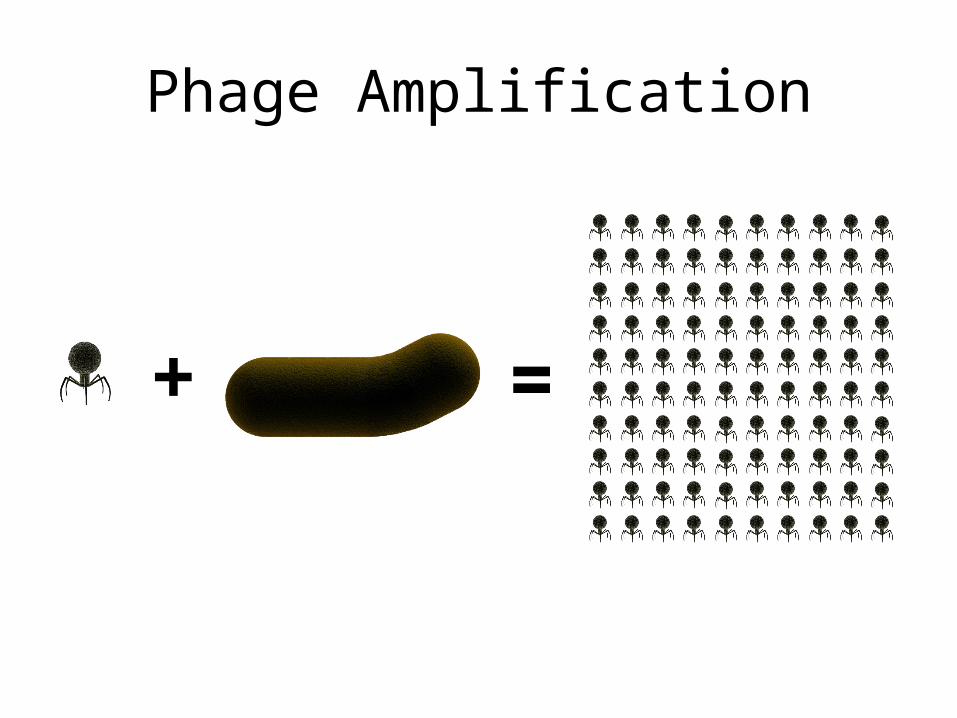
Phage Amplification
+ =