Embed Size (px)
Citation preview

Ultrospec 2100 pro User Manual
Biochrom US Telephone: 1-508-893-8999 84 October Hill Road Toll Free: 1-800-272-2775 Holliston, MA Fax: 1-508-429-5732 01746-1388 [email protected] USA www.biochromspectros.com

5061-047 Rev7 Ultrospec 2100 pro, English 1
CONTENTS UNPACKING, POSITIONING AND INSTALLATION 2
Safety Notes 3
OPERATION 4 Introduction 4 Keypad and display 5 Basic Modes (1) 6
Absorbance (1.1) 6 % Transmission (1.2) 6 Factor Concentration (1.3) 6
Applications (2) 7 Wavescan (2.1) 7 Simple Kinetics (2.2) 8 Reaction Rate (2.3) 9 Standard Curve (2.4) 10 Multiwave and Equation Entry (2.5) 11
Nucleic Modes (3) 12 Methods A (4), B (5) and C (6) 13 System Utilities 14 Output to Printer 16
Seiko DPU-414 (1) 16 Epson FX-80+ / Epson 9 pin (2) 16 Text printer (no graphics) (3) 16 HP PCL 3 (4) 16 Epson 24 pin (ESC P) (5) 16
Download to Spreadsheet 17 Messages 17 Connectors Inside the Sample Compartment 17
ACCESSORIES 18 Multiple Cell Holder Accessories 18 Single Cell Holder Accessories 19 Other Accessories, consumables etc. 20 Datrys 21
MAINTENANCE 22 After Sales Support 22 Fuse Replacement 22 Cleaning and General Care 23
APPENDIX 24 Text entry 24 Good Laboratory Practice 25 Least squares regression analysis and linearity 26
SPECIFICATION AND WARRANTY 27
2 Ultrospec 2100 pro, English 5061-047 Rev7
Unpacking, Positioning and Installation
• Inspect the instrument for any signs of damage caused in transit. If any damage is discovered, inform your supplier immediately.
• Ensure your proposed installation site conforms to the environmental conditions for safe operation: Indoor use only Temperature 10°C to 40°C Maximum relative humidity of 80 % up to 31°C decreasing linearly to 50 % at 40°C
• The instrument must be placed on a hard flat surface, for example a laboratory bench or table, which can take its weight (13 kg) such that air is allowed to circulate freely around the instrument.
• Ensure that the cooling fan inlets and outlets are not obstructed; position at least 2 inches from the wall.
• This equipment must be connected to the power supply with the power cord supplied and must be earthed (grounded). It can be used with mains supplied from 90 to 264V~.
• Switch on the instrument and check that the display works (see Operation). • To enter laboratory name, operator name, instrument asset number details, and
current date/time, refer to System Utilities.

5061-047 Rev7 Ultrospec 2100 pro, English 3
Safety
Spectrophotometer Health & Safety Document including General Operating Instructions are available as a booklet provided with each instrument. The booklet, translated into the European Union languages, is available on the delivered CD. The instructions provide the user with basic use, troubleshooting and how to use the instrument in a safe manner.
CAUTION This instrument contains a UV source that generates a light beam which traverses the sample chamber and is accessible in the lamp chamber. Under normal use the lamp beam is confined within the instrument. The unit should not be operated with the lamp housing lid removed or with the sample chamber lid open as prolonged exposure to the beam may cause permanent eye damage.
WARNING High voltages exist inside these units. Repair and maintenance should only be carried out by individuals trained specifically to work on these instruments
CAUTION These instruments may be fitted with heated cell holder accessories that depending on operation may become hot to touch. Care should be taken to avoid touching the heated accessory when running at elevated temperatures.
WARNING Ensure that the baseplate plug supplied with single cell accessories is fitted to optimise air flow and to prevent light ingress that might otherwise compromise the measurements taken.
WARNING If the instrument is used in a manner not specified or in environmental conditions not appropriate for safe operation, the protection provided may be impaired and the instrument warranty withdrawn.

4 Ultrospec 2100 pro, English 5061-047 Rev7
OPERATION Introduction Your UV/Visible spectrophotometer is a stand alone, simple-to-use instrument with a high-resolution liquid crystal display (LCD), and a comprehensive range of spectrophotometry measurements can be undertaken.
It works on the basis of light from the xenon lamp being directed by a fixed mirror through the monochromator inlet slit. This passes through one of several (dependent on wavelength selected) filters mounted on filter quadrant: the filtered light is then directed onto the holographic grating which produces light of the selected wavelength. The light then leaves the monochromator via the exit slit, and mirrors focus and direct the light into the sample compartment. This passes through your cell, containing the sample of interest, and then a defocusing lens to a solid state detector unit. The resulting signal is then filtered and displayed.
Your spectrophotometer has the following capabilities:
• Basic Modes for -Absorbance -% Transmission -Factor Concentration
• Application Modes for - Wavescan (Wavelength Scanning ) - Simple Kinetics - Reaction Rate - Standard Curve - Multiple Wavelength (Multi Wavelength Equation Entry)
• Stored parameters for Nucleic Acid quantification and purity checking - DNA - RNA - Oligonucleotide
• 18 user defined methods, in 3 groups of 6 - Methods A, B, C
• Print results from the instrument display in graphical format • Download of results directly to Excel for manipulation and archiving, via a serial
interface lead to a PC • Self test diagnostics for GLP purposes
A range of accessories further enhances the capability of the instrument. The home page provides access to user modes, system utilities and accessory identification and set-up.

5061-047 Rev7 Ultrospec 2100 pro, English 5
Keypad and display
Press the soft key on the keypad directly below the corresponding option on the display (F1, F2 and F3) to select that option. For example, on the home page (above): • press F1 to take you to System Utilities • press F2 to identify the type of cell changer / holder that has been fitted • press F3 to toggle the display back-light on/off (display contrast can be
changed within System (F1)
Press: • to print result if auto-print is off, or to re-print result if auto-print is on
to correct text and characters in appropriate boxes
to start making measurements and print results to stop making measurements or entering parameters and return to the home page; use as an “escape mechanism”
Press the corresponding number on the keypad to enter the user mode choices; for example 1 followed by 1 is Absorbance mode, whereas 2 followed by 4 is Standard Curve Mode.

6 Ultrospec 2100 pro, English 5061-047 Rev7
Basic Modes (1)
Absorbance (1.1) Absorbance mode measures the amount of light that has passed through a sample relative to a blank (this can be air). The procedure is as follows: • Enter appropriate wavelength and press OK (F3) • Insert reference and press . The cell changer, if fitted, automatically moves
to position 2 and displays the result for the reference measurement (0.000) • Xenon lamp based instruments are “press to read”, to monitor sample
stabilization, the simple kinetics mode must be used • This reference value is used for subsequent samples until changed
• Insert samples as required and press (repeat as necessary) • To go back and change the wavelength press Method (F1)
% Transmission (1.2) Transmission mode measures the amount of light that has passed through a sample relative to a blank (this can be air), but displays the result as a percentage. The procedure is as follows: • Enter appropriate wavelength and press OK (F3) • Insert reference and press
• This reference value is used for subsequent samples until changed
• Insert samples as required and press (repeat as necessary) • To go back and change the wavelength press Method (F1)
Factor Concentration (1.3) Concentration mode is used when a conversion factor is known, and converts the absorbance measurement for a sample at a specific wavelength into a concentration, by a simple multiplication of absorbance x factor. The procedure is as follows: • Enter appropriate wavelength and press OK (F3) • Enter known factor (range 0.01-9999) and press OK (F3)
• To enter a negative factor press – (F1); the reference should have a higher absorbance than the samples
• Insert reference and press • This reference value is used for subsequent samples until changed
• Insert samples as required and press (repeat as necessary) • To go back and change the wavelength or factor press Method (F1)

5061-047 Rev7 Ultrospec 2100 pro, English 7
Applications (2)
Wavescan (2.1) An absorption spectrum can be obtained from your instrument; this enables simple identification of peak height and position. A reference scan has to be obtained first. The procedure is as follows:
• Enter start wavelength (range 190-890nm) and press OK (F3) • Enter end wavelength (range 200-900nm) and press OK (F3) • Select scan speed as appropriate; slow (1), medium (2), fast (3) or survey
(4). The scan speed depends on the wavelength range due to the wide range in baseline energy and this in turn affects data interval, so the figures are nominal.
• Select if the peak check table is required; if selected, a table of wavelengths and absorbance maxima for up to 20 peaks can be printed out
Nominal scan speed, nm/min Slow 250
Medium 750 Fast 1800
Survey 3000 • Insert reference and press to obtain reference spectrum
• This reference spectrum is used for subsequent samples until changed • Insert samples as required and press (repeat as necessary) • Press Data (F3) to access data points; these can be viewed by moving
the cursor (F2 and F1) a peak is indicated by a flag symbol • For rapid movement, press 4 / 6 to go to left / right side of the graph, or
5 to go the centre • Press 2 to zoom in (8 to zoom out)
• To go back and change the parameters press Method (F1)

8 Ultrospec 2100 pro, English 5061-047 Rev7
Simple Kinetics (2.2) Simple kinetics studies to investigate the shape of an assay curve can be readily performed. The wavelength of interest is entered together with the time interval at which absorbances are to be read: the results are displayed graphically, simulating a chart recorder output. The procedure is as follows:
• Enter appropriate wavelength and press OK (F3) • Select time units; seconds (1) or minutes (2) • Enter the duration of the assay and press OK (F3) • Enter the time interval; minimum 2, maximum 60 seconds • Select if the actual absorbance time data should be printed with the results • Insert reference and press
• This reference value is used for subsequent samples until changed
• Insert samples as required and press (repeat as necessary) • To see the assay on the whole display, press Data (F3); to return press OK (F3)
• Data points can be viewed by moving the cursor (F2 and F1); this enables the identification of slope start and end times, for example
• To go back and change the parameters press Method (F1)
NOTE This mode should be used to check sample stabilization prior to kinetics studies, for example, since the xenon lamp is not a continuous output source (unlike deuterium and tungsten lamps).

5061-047 Rev7 Ultrospec 2100 pro, English 9
Reaction Rate (2.3) Reagent test kits are routinely used for the enzymatic determination of compounds in food, beverage and clinical laboratories by measuring NAD / NADH conversion at 340 nm. The change in absorbance over a specified time period can be used to provide useful information when an appropriate factor, defined in the reagent kit protocol, is applied. Note that reaction rate and enzyme activity can be calculated if the factor used takes account of the absorbance difference per unit time, as opposed to the absorbance difference per se. The correlation (quality of line fit) is calculated from 10 equally spaced absorbance / time points during the course of the experiment. The procedure is as follows:
• Enter appropriate wavelength and press OK (F3) • Select time units; seconds (1) or minutes (2) • Enter delay time (or lag time), if applicable and press OK (F3) • Enter the duration of the assay and press OK (F3) • Enter factor required to convert slope to meaningful units and press OK (F3) • Insert reference and press
• This reference value is used for subsequent samples until changed
• Insert samples as required and press (repeat as necessary) • The assay is shown graphically as it proceeds and reverts to show
• The result (total change in absorbance over the reaction time as defined by the intercepts multiplied by the factor), slope and the line quality (a coefficient of determination of > 95 % is expected if the assay was carried out over a linear section). The slope is always presented as Abs/min, even in seconds mode
• Start and final absorbances, as well as absorbance difference • To see the assay on the whole display, press Graph (F3); to return press OK (F3)
• Data points can be viewed by pressing Data (F1) moving the cursor (F2 and F1) • To go back and change the parameters press Method (F1)

10 Ultrospec 2100 pro, English 5061-047 Rev7
Standard Curve (2.4) The construction of a multi point calibration curve from standards of known concentration in order to quantify unknown samples is a fundamental use of a spectrophotometer; a common example is the Bradford determination for proteins. This instrument has the advantage of being able to store this curve as a method. The procedure to construct the standard curve is as follows:
• Press Standards (F3) followed by New (F1) and confirm (F3) [this step is not necessary if this mode is being used for the first time]
• Enter appropriate wavelength and press OK (F3) • Select Curve Fit method; Single Point (1), Linear Regression (2) or Linear
Interpolation (3) • Enter number of standards (2-12) and press OK (F3) • Enter number of replicates (1-3) and press OK (F3) • Enter concentration of first standard and press (F3)
• To include a zero concentration standard, include this in the number of standards to be entered and enter 0.00 for concentration; use a blank when required to enter standard 1
• Enter concentrations of other standards as prompted • Insert reference and press
• This reference value is used for subsequent samples until changed
• Insert standards as required and press followed by OK (F3), repeating as necessary to construct the standard curve. Values can be written down if required.
• Press Standards (F3) to see the standard curve, press OK (F3) to return • If in linear regression mode, the values for the slope, intercept and coefficient
of determination are printed out
• Insert reference and press • This reference value is used for subsequent samples until changed
• Insert samples as required and press (repeat as necessary)
• To go back and change the parameters press Method (F1)
5061-047 Rev7 Ultrospec 2100 pro, English 11
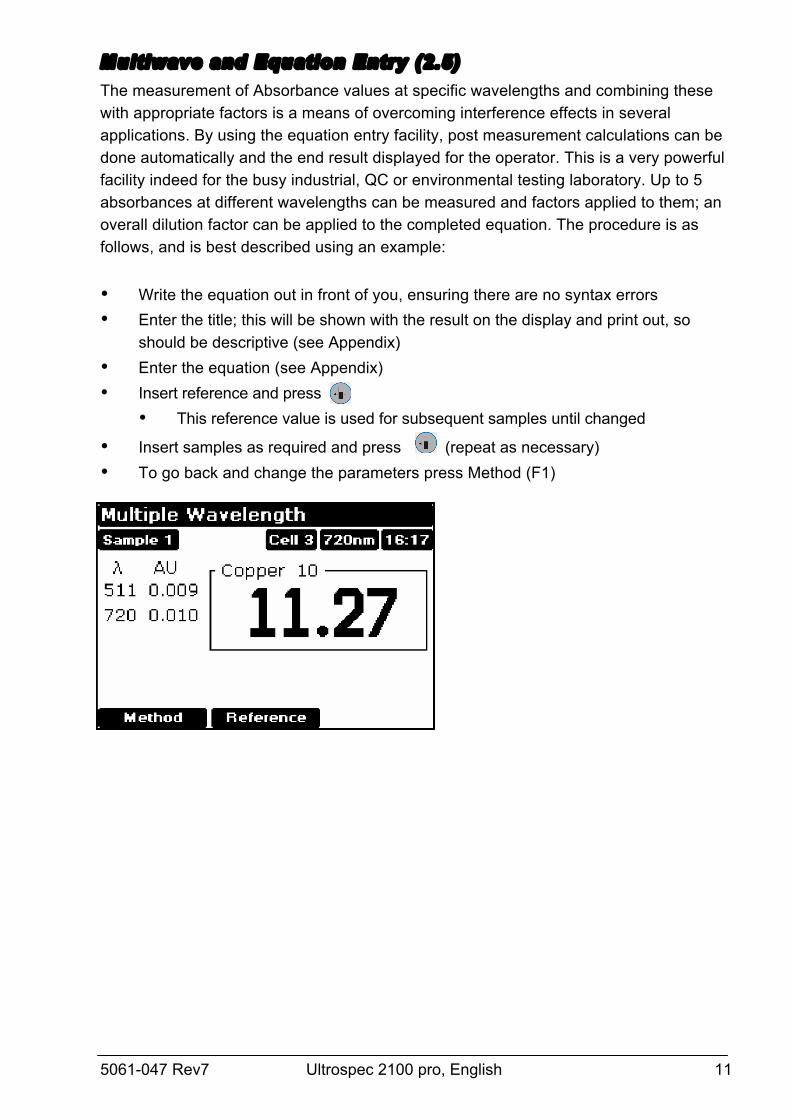
Multiwave and Equation Entry (2.5) The measurement of Absorbance values at specific wavelengths and combining these with appropriate factors is a means of overcoming interference effects in several applications. By using the equation entry facility, post measurement calculations can be done automatically and the end result displayed for the operator. This is a very powerful facility indeed for the busy industrial, QC or environmental testing laboratory. Up to 5 absorbances at different wavelengths can be measured and factors applied to them; an overall dilution factor can be applied to the completed equation. The procedure is as follows, and is best described using an example:
• Write the equation out in front of you, ensuring there are no syntax errors • Enter the title; this will be shown with the result on the display and print out, so
should be descriptive (see Appendix) • Enter the equation (see Appendix) • Insert reference and press
• This reference value is used for subsequent samples until changed
• Insert samples as required and press (repeat as necessary) • To go back and change the parameters press Method (F1)

12 Ultrospec 2100 pro, English 5061-047 Rev7
Nucleic Modes (3)
Nucleic acids can be quantified at 260 nm because it is well established that a solution of DNA or RNA with an optical density of 1.0 has a concentration of 50 or 40 µg/ml, respectively, in a 10mm pathlength cell. Oligonucleotides, as a rule of thumb, have a corresponding factor of 33 µg/ml, although this does vary with base composition. Extracting nucleic acids from cells is accompanied by protein, and extensive purification is required to separate the protein impurity. The 260/280 ratio gives an indication of purity; it is only this, however, and not a definitive assessment. Pure DNA and RNA preparations have expected ratios of ≥ 1.8 and ≥ 2.0, respectively; deviations from this indicate the presence of protein impurity in the sample, but care must be taken in interpretation of results. An elevated absorbance at 230 nm can indicate the presence of impurities as well; 230 nm is near the absorbance maximum of peptide bonds and also indicates buffer contamination since Tris, EDTA and other buffer salts absorb at this wavelength. When measuring RNA samples, the 260/230 ratio should be > 2.0; a ratio lower than this is generally indicative of contamination with guanidinium thiocyanate, a reagent commonly used in RNA purification and which absorbs over the 230 - 260 nm range. Background correction at a wavelength totally separate from the nucleic acid and protein peaks at 260 and 280 nm, respectively, is sometimes used to compensate for the effects of background absorbance. The wavelength used is 320 nm and it can allow for the effects of turbidity, high absorbance buffer solution and the use of reduced aperture cells. The instrument calculates concentration, displays 260/280 and 260/230 ratios, and compensates for dilution and use of cells that do not have 10mm pathlength. A wavelength scan of a sample can also be obtained for visual inspection of integrity.
The procedure is as follows for DNA (3.1), RNA (3.2) and oligo (3.3):
• Enter pathlength of cell; 10mm (1), 5mm (2), 2mm (3), 1mm (4) or 0.5mm (5) • Select units; µg/ml (1), ng/µl (2) or µg/µl (3) • Select if background correction at 320 nm is required • Select if sample scan is required (scans 220 to 330 nm, with autoscaling) • Enter dilution factor • [Oligo (3.3) only; enter conversion factor. If not known, use 33] • Insert reference and press
• This reference scan is used for subsequent samples until changed
• Insert samples as required and press (repeat as necessary)

5061-047 Rev7 Ultrospec 2100 pro, English 13
• To go back and change the parameters press Method (F1) • Press Graph to view the sample spectrum
Methods A (4), B (5) and C (6) After defining parameters in any of the applications, and prior to measuring a sample, a method can be saved. To save a method: • press stop to return to the home page • select one of the three method banks (4, 5, or 6) • press save (F1) and choose an unfilled method by pressing the appropriate number • enter the method name (see below) and press OK (F3)
A stored method is available as an option directly on the instrument menu. To change parameters, the method must be deleted first. To delete a method:. • press stop to return to the home page • select one of the three method banks • press delete (F2) and select the required method by pressing the appropriate
number; you are asked to confirm this.
Entry of alphanumeric characters for print outs and method names • Remove default characters, if necessary, using • Press appropriate key on keypad to cycle through options of lower case letter,
numbers and upper case letters (for example pressing key 2 cycles through abc2ABC). Note that a space is entered using key 1, which cycles between 1_1_)
• Press another key to move to next letter. To enter a doubled letter (eg AA) or number (eg 00), press > (F2) and then the appropriate key again.
• Delete incorrect characters using • Complete entry by pressing OK (F3) • An example of name entry is given in the Appendix.

14 Ultrospec 2100 pro, English 5061-047 Rev7
System Utilities
After selecting the system option (F1) on the home page, there is initial information, including the calibration status of the instrument and the date of the last full GLP calibration (see above). The GLP calibration details can be printed out for record purposes by pressing F2 if required; note they are printed automatically depending on the specified GLP calibration interval (see below).
Set up To adjust the contrast of the display to suit lighting conditions, press Contrast ▼ or Contrast ▲ to decrease or increase (F1 or F2, respectively).
Clock (1) Press OK (F3) to cycle through year, month, day, hour, minute and use F1 or F2 to adjust the parameter down or up, as appropriate.
Customize (2) Instrument description (for example asset number), operator name and replacement group names for Methods A, B and C (for example application types or operator name if a multi-user environment) can be entered here. To enter a name, press appropriate key on keypad to cycle through options of lower case letter, numbers and upper case letters (for example pressing key cycles through abc2ABC).
Preferences (3) Set your preferences as follows: • Sample number prompt no / yes (enables entry of sample number between 1999
prior to running an experiment, rather than starting from Sample = 1 again). • Autoprint on / off (if off, results can be printed manually using . key • Printer • Default graph scale (0 – 3, 0 – 2, 0 – 1, 0 – 0.5 and Autoscale) • Confirm exit from application no / yes • Key click on / off

5061-047 Rev7 Ultrospec 2100 pro, English 15
GLP (4) Refer to Appendix for more information. This option determines whether GLP is on or off in terms of printing and reporting the results; the calibration interval for GLP, however, is always on and can be done automatically at pre-defined time intervals (always on, daily, weekly, monthly, quarterly). If GLP is on, the results are printed automatically after calibration; they can also be printed on demand using Print (F2) on the System page. Note that the GLP print out will show the date for when the full calibration was done (“Calibrated”), and that this can be different to the date of instrument operation (“Date”); this is shown on the example below. If the date is the same, “Calibrated” shows the time that it was done instead. Press “More...” (F3) on the system page to view the GLP results on the instrument display.
Ultrospec 2100 pro GLP Report
Instrument Ultrospec 2100 pro Operator A T Dadd Date 22 September 2000 Time 10:00:17
Serial No. 79500 Version 4190 V1.0 Calibrated 21 September 2000 Instrument Life 25.6 Hours Service 10 September 2000
Bandwidth (2.0 – 3.0nm) 2.9 PASS
Wavelength Accuracy 881.9nm (± 1 nm) 881.9 PASS
Absorbance Accuracy 220nm (1.763 – 1.781A) 1.772 PASS 340nm (1.633 – 1.665A) 1.649 PASS 500nm (1.477 – 1.491A) 1.484 PASS
Stray Light 220 nm (<0.05%) 0.021 PASS
Language (5) Select language for the display and print out.
Service (6) This is for accredited service engineers only and requires the entry of a pass code.

16 Ultrospec 2100 pro, English 5061-047 Rev7
Output to Printer
The graphics capability of the instrument means that the following requirements for printer compatibility should be fulfilled: • The printer must not be USB only style; parallel Centronics is required • The printer must not be designed to work with MS Windows only (GDI type); these
are less expensive printers and can only function when connected to a PC with the appropriate driver installed
If in doubt, check with the printer manufacturer. Note that printer output is always in black and white even on color printers.
Seiko DPU-414 (1)
If obtained in your country, it should already be configured properly. If not, set software DIP SW2 to American character set.
Cat. No. 80-2108-80
Epson FX-80+ / Epson 9 pin (2)
Includes Epson FX 850 and similar.
Text printer (no graphics) (3)
Use for any class of parallel printer; no graphics or accents on text are printed.
HP PCL 3 (4)
Intended for printers such as HP LaserJet II/III/4, HP DeskJet 500, HP DeskJet 690C. The printer must be HP PCL level 3 or greater; HP DeskJet 700, 820 and 1000 series printers do not fulfill this requirement and cannot be used Use for letter or A4 sized paper (European)
Epson 24 pin (ESC P) (5)
For use with Epson 24 pin dot matrix printers and older inkjet printers such as the Stylus 400.
Output is automatic when the key is pressed and auto-print (in Preferences) is
on. If auto-print is off, results can be printed on demand using the . key.

5061-047 Rev7 Ultrospec 2100 pro, English 17
Download to Spreadsheet
Results can be downloaded directly to Excel when the PC has the Spreadsheet Interface Software installed (80-2110-73) and the two are linked with the serial cable (80-2105-97); detailed instructions are supplied with the software. Thus absorbance / wavelength data comprising a scan, for example, can be picked up as columns of numbers and converted to a more conventional graph using the spreadsheet; results can then be formatted or manipulated as appropriate prior to inclusion in reports or archiving / saving to hard disk. Results from all modes of use on the instrument can be output in this way. Output
is automatic when the key is pressed.
Messages
Most messages are self-explanatory and relate to use of the instrument. Others relate to the calibration of the instrument on switch on:
This instrument has failed 1 or more GLP tests
One or more of the parameters tested for during GLP calibration is out of specification (see Appendix). You can accept this status and continue to use the instrument as normal, but you are advised to seek help from your local service engineer
Failed to find Abs Failed to calibrate properly; contact local service engineer Failed to find Ref 1 Failed to calibrate properly; contact local service engineer Failed to align filters Failed to calibrate properly; contact local service engineer Failed to align grating Failed to calibrate properly; contact local service engineer
Connectors Inside the Sample Compartment · Connector 1 - used to connect the Peltier/Electrically-Heated Cell Holder Accessory
· Connector 2 - used to connect the Sipper Pump
· Connector 3 - is the continuation of the “Auxiliary” connector at the back of the instrument
18 Ultrospec 2100 pro, English 5061-047 Rev7
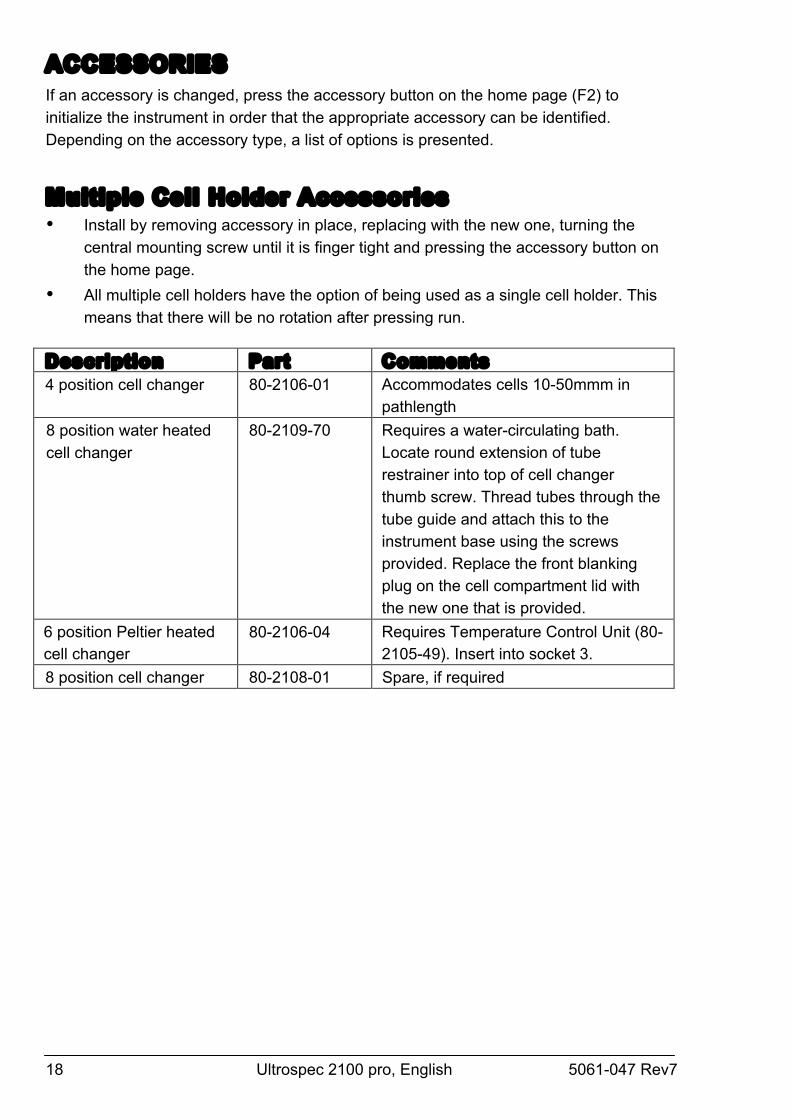
ACCESSORIES If an accessory is changed, press the accessory button on the home page (F2) to initialize the instrument in order that the appropriate accessory can be identified. Depending on the accessory type, a list of options is presented.
Multiple Cell Holder Accessories • Install by removing accessory in place, replacing with the new one, turning the
central mounting screw until it is finger tight and pressing the accessory button on the home page.
• All multiple cell holders have the option of being used as a single cell holder. This means that there will be no rotation after pressing run.
Description Part number
Comments 4 position cell changer 80-2106-01 Accommodates cells 10-50mmm in
pathlength 8 position water heated cell changer
80-2109-70 Requires a water-circulating bath. Locate round extension of tube restrainer into top of cell changer thumb screw. Thread tubes through the tube guide and attach this to the instrument base using the screws provided. Replace the front blanking plug on the cell compartment lid with the new one that is provided.
6 position Peltier heated cell changer
80-2106-04 Requires Temperature Control Unit (80-2105-49). Insert into socket 3.
8 position cell changer 80-2108-01 Spare, if required

5061-047 Rev7 Ultrospec 2100 pro, English 19
Single Cell Holder Accessories • Install by removing accessory in place, replacing, if necessary, the baseplate plug
supplied and positioning the single cell holder so that the arrow is on the front face and it locates in place. Then push the finger locks backwards so that they lock into position. Press the accessory button on the home page
Description Part number
Comments Cell holder, 10mm pathlength 80-2106-05 Cell holder, for sample stirring
80-2108-10 Requires magnetic flea and controller
Cell holder, 50mm pathlength 80-2106-07 Cell holder, 100 mm pathlength
80-2107-14
Ultramicrovolume cell holder 80-2106-06 Use with 5 µl cell (80-2103-68) and 70 µl cell (80-2103-69)
Microvolume cell holder 80-2106-09 Use with 50 µl cell (80-2076-38) Cylindrical cell holder 80-2106-10 Up to 100 mm pathlength cylindrical
cells Water heated cell holder 80-2106-08 10-40 mm pathlength.
Requires a water-circulating bath.. Replace the front blanking plug on the cell compartment lid with the new one that is provided..
Peltier cell holder 80-2106-13 Set required temp in range 20-49 °C. Insert into socket 2. See sample compartment connnectors
Electrical cell holder 80-2106-12 Set required temperature: off, 25, 30, 37 °C. Insert into socket 2. See sample compartment connnectors
Tm Programmable heated cell holder
80-2106-14 Supplied with SWIFT Tm software. Temp range 20-105°C. Used for DNA/RNA denaturing studies. Requires Temperature Control Unit (80-2105-49). Insert into socket 3 See sample compartment connnectors

20 Ultrospec 2100 pro, English 5061-047 Rev7
Other Accessories, consumables etc. Description Part
number Comments
Sipper 80-2112-15 Use if a large number of samples for single readings is required. Requires single cell holder (80-2106-05 or 80-2106-13). 10mm flowcell and tubing supplied, together with separate user instructions.
Temperature Control Unit
80-2105-49 Required to supply the extra power required by the 6 position Peltier heated cell changer (80-2106-04) and Tm Programmable heated cell holder (80-2106-14).
PC support plinth 80-2112-14 For portable PC Printer stand 80-2112-13 For Seiko DPU-414 thermal printer Dust cover 80-2106-19 Spare
Consumables and other items
Pump head tubes (6) for Sipper 80-2080-74 PTFE flowcell tubing with connectors 80-2055-13 Replacement flowcell (including tubing) 80-2080-60 Autosampler Interface kit 80-2104-96
Serial interface cable for connection to PC (D9 male instrument to D9 PC)
80-2105-97
Spreadsheet Interface Software 80-2110-73
Centronics parallel printer interface cable 80-2071-87
Separate information giving details on serial and parallel interface connections, if required, is available from a Service Engineer with your local supplier, whom you should contact for further details.

5061-047 Rev7 Ultrospec 2100 pro, English 21
Datrys System Control Software
For many users, having an external PC
to control their spectrophotometer and
manipulate data, gives them the
ultimate in flexibility and control.
Whether looking for small differences
in multiple spectral overlays, carrying
out post-run manipulations on large
numbers of samples, Datrys software
has the flexibility to work in the way
you want.
Datrys software is supplied in different modules to meet the application requirements of
different customer groups and offers a simple upgrade path should your requirements
change.
Choose:
• Datrys Lite for Quick Read and fast scanning only
• Datrys for all routine measurements
• Datrys Life Science for nucleic acids, proteins and cell density measurements
• Datrys CFR supports 21 CFR part 11 compatibility
Offering the familiar look and feel of Microsoft™ Office 2007, Datrys software is
compatible with Windows™ XP, Windows Vista™, Windows 7, and Windows 8, 8.1
operating systems. Data export options include Microsoft Word™ and Excel plus Adobe™
PDF formats.

22 Ultrospec 2100 pro, English 5061-047 Rev7
MAINTENANCE After Sales Support We supply support agreements that help you to fulfill the demands of regulatory guidelines concerning GLP/GMP.
• Calibration, certification using filters traceable to international standards • Certificated engineers and calibrated test equipment • Approved to ISO 9001 standard
Choice of agreement apart from break down coverage can include
• Preventative maintenance • Certification
When using calibration standard filters, insert such that the flat surface is facing away from the spring end of the cell holder
User maintenance is restricted to changing the mains fuse. For any other maintenance operation, including fitting a replacement xenon lamp, contact your local supplier.
Fuse Replacement 1. Switch off the instrument and disconnect the power supply cord. The fuse holder
can only be opened if the power supply plug has been removed, and is located in the power input socket on the back panel of the instrument.
2. Slide the fuse holder open by pulling at the notch. 3. Place fuses T2AH 250V AC (Anti-surge, high breaking capacity) into the fuse
holder and slide back into position. 4. Reconnect the power supply cord and switch on the instrument.
Fuses are not normally consumed in an instrument's lifetime. If they blow repeatedly contact your supplier.

5061-047 Rev7 Ultrospec 2100 pro, English 23
Cleaning and General Care
External cleaning
• Switch off the instrument and disconnect the power cord. • Use a soft damp cloth. • Clean all external surfaces • A mild liquid detergent may be used to remove stubborn marks.
Sample compartment spillages
• Switch off the instrument and disconnect the power cord. • The cell holders, baseplate and sample compartment are all coated in a chemical
resistant finish. Strong concentration of sample, however, may affect the surface, and spillages should be dealt with immediately.
• Observe all necessary precautions if dealing with samples or solvents that are hazardous.
• There is a small drain hole in the sample compartment to allow excess liquid to drain away. Liquids will drain onto the bench or table under the spectrophotometer or if preferred, this drain hole can be connected to waste using suitable tubing.
• Remove the cell holder and clean separately. • Use a soft dry cloth to mop out the sample compartment. Replace the cell
holder. • Reconnect the power cord and switch on the instrument.

24 Ultrospec 2100 pro, English 5061-047 Rev7
APPENDIX Text entry The following example shows how to enter a title and equation in Multiwave. The principles are identical, however, for other text entry options such as Method Names. • To enter the title “Copper 10”:
• Use ← to remove any text still there • Press 2 repeatedly until “C” appears • Press 6 repeatedly until “o” appears • Press 7 repeatedly until “p” appears • Press F2 to move to next place • Press 7 to enter a second “p” • Press 3 repeatedly until “e” appears • Press 7 repeatedly until “r” appears • Press 1 to initiate entry of a space • Press F2 to move to next place, then F2 again to enter the space • Press 1 repeatedly until “1” appears • Press 0 to enter “0” • Press OK (F3) to confirm the name entry
• To enter the equation “((Abs511*12.5) – (Abs 720*0.3))*100” • Use ← to remove any entries still there • Press F2 twice to enter “((“ • Press F1,1 to enter the first absorbance, A1 (wavelength value is defined later) • Press F1, 3 to enter the * sign • Enter numerical factor 12.5 using the keypad, press F3 • Press F2 to close the first bracket, “)” • Press F1, 2 to enter the minus sign • Press F2 to enter “(“ • Press F1, 2 to enter the second absorbance, A2 (wavelength value is
defined later) • Press F1, 3 to enter the * sign • Enter numerical factor 0.3 using the keypad, press F3 • Press F2 twice to close the brackets, “))” • Press F3 to confirm the equation is correct • The two wavelengths for A1 and A2 now have to be defined, enter 511 and
720 when prompted The dilution factor (*100) now has to be entered; enter 100

5061-047 Rev7 Ultrospec 2100 pro, English 25
Good Laboratory Practice
Good laboratory Practice (GLP) concerns being able to trace experimental results to an instrument, an operator and the time the result was obtained so that a laboratory can prove that the instrument was functioning correctly. Laboratory, operator and internal instrument reference names can be entered on the spectrophotometer.
If the GLP option is on, during calibration or re-calibration the instrument self-checks its integrity for GLP purposes. The GLP test of this instrument is essentially a “confidence test” that it is performing as it was when manufactured and tested. For absolute measurements, an annual certification service agreement with your supplier is recommended. The integrity of the instrument for GLP purposes is quantified from:
• the calibration status of the instrument • the bandwidth (this is assessed during calibration by measuring the zero order
beam width) • the wavelength accuracy by comparing to the 881.9 nm xenon emission line • the values of built in absorbance filters compared to when the instrument
was manufactured (or last serviced by an accredited engineer) • the instrumental stray light
The expected values are given in parentheses on the GLP print out after calibration; the range of acceptance is defined by the technical specification of the instrument.
In the unlikely event that the instrument fails calibration or goes out of specification, a message will appear on the display. In this event, the following should be checked:- • is the cell compartment lid closed properly • is a sample in the light beam - if so, remove it • is the baseplate plug in place (single cell accessory) • is the in-fill panel at the front of the cell compartment in place
Pressing OK after the message "GLP Calibration Fail" appears confirms that you have accepted the instrument status. If you are working in a regulated environment such as a drug discovery laboratory that generates data for GLP/GMP activities or reports, you should not use the instrument and contact your local service engineer.

26 Ultrospec 2100 pro, English 5061-047 Rev7
Least squares regression analysis and linearity
The slope (or best straight line) and intercept in a kinetics assay or standard curve determination is calculated from a least squares linear regression of the data. The following equations are used, where n is the number of data points:
Linearity is an estimate of the “goodness of fit” of the least squares linear regression analysis, a perfect fit being 100%. It is used in both the Reaction Rate and Standard Curve modes, and is expressed by a coefficient of determination (r2), calculated using the following equation:

5061-047 Rev7 Ultrospec 2100 pro, English 27
SPECIFICATION AND WARRANTY Wavelength range 190 - 900nm Monochromator 1200 lines/mm Aberration corrected concave grating Maximum scanning speed 3000 nm/minute Spectral bandwidth < 3nm Wavelength accuracy ± 1nm Wavelength reproducibility ± 0.5nm Light source xenon lamp Detectors two silicon photodiodes Photometric range - 3.000 to 3.000A, -9999 to 9999
concentration units, 0.1 to 200%T Photometric accuracy ± 0.5% or ± 0.003A to 3.000A at 546 nm, whichever
is the larger Photometric reproducibility within 0.5% of absorbance value to 3.000A at
546 nm Stability ± 0.001A per hour at 340nm at 0A Stray light <0.05 %T at 220nm using NaI and <0.05 %T
at 340nm using NaNO2 Digital output 9 pin serial and Centronics parallel Sample compartment size 210 x 140 x 80mm Dimensions 510 x 350 x 160mm Weight 13kg Power requirements 100 - 240V~ ± 10%, 50/60Hz, 100VA
Specifications are measured at a constant ambient temperature and are typical of a production unit. As part of our policy of continuous development, we reserve the right to alter specifications without notice.
Warranty Biochrom guarantees that the product supplied has been thoroughly tested to ensure that it meets its published specification. The warranty included in the conditions of supply is valid for 12 months only if the product has been used according to the instructions supplied. They can accept no liability for loss or damage, however caused, arising from the faulty or incorrect use of this product.