Embed Size (px)
Citation preview

ULTRASOUND IMAGING
Prof. Yasser Mostafa Kadah – www.k-space.orgEE 472 – F2018

Recommended Textbook
Diagnostic Ultrasound: Physics and Equipment, 2nd ed., by
Peter R. Hoskins (Editor), Kevin Martin (Editor), Abigail Thrush
(Editor) Cambridge University Press, 2010.

B-mode image is an anatomic cross-sectional image
Constructed from echoes (reflection and scattering) of waves
Echo is displayed at a point in image, which corresponds to
relative position of its origin within the body cross section
Brightness of image at each point is related to strength of echo
Term B-mode stands for Brightness-mode
Introduction to B-mode imaging

Echo Ranging
To display each echo in a position corresponding to that of the
interface or feature (known as a target) that caused it, the B-
mode system needs two pieces of information:
(1) Range (distance) of the target from the transducer
(2) Position and orientation of the ultrasound beam

Ultrasound Physics
Sound waves used to form medical images are longitudinal
waves, which propagate (travel) only through a physical
medium (usually tissue or liquid)
Characterized by frequency, wavelength, speed and phase

Ultrasound Physics
Medical ultrasound frequencies used in the range 2–15 MHz
Higher frequencies are now utilized for special applications
Resolution proportional to wavelegth
Acoustic impedance
p is the local pressure and v is the local particle velocity.
Analogous to electrical impedance (or resistance R )

Ultrasound Physics
Reflection: Large Interfaces

Ultrasound Physics
Scattering: Small Interfaces (size less than wavelength)
Two important aspects of scattering:
Ultrasonic power scattered back is small compared to reflections
Beam angle-independent appearance in the image unlike reflections
Diffuse Reflection: Rough Surfaces
Ultrasound Physics
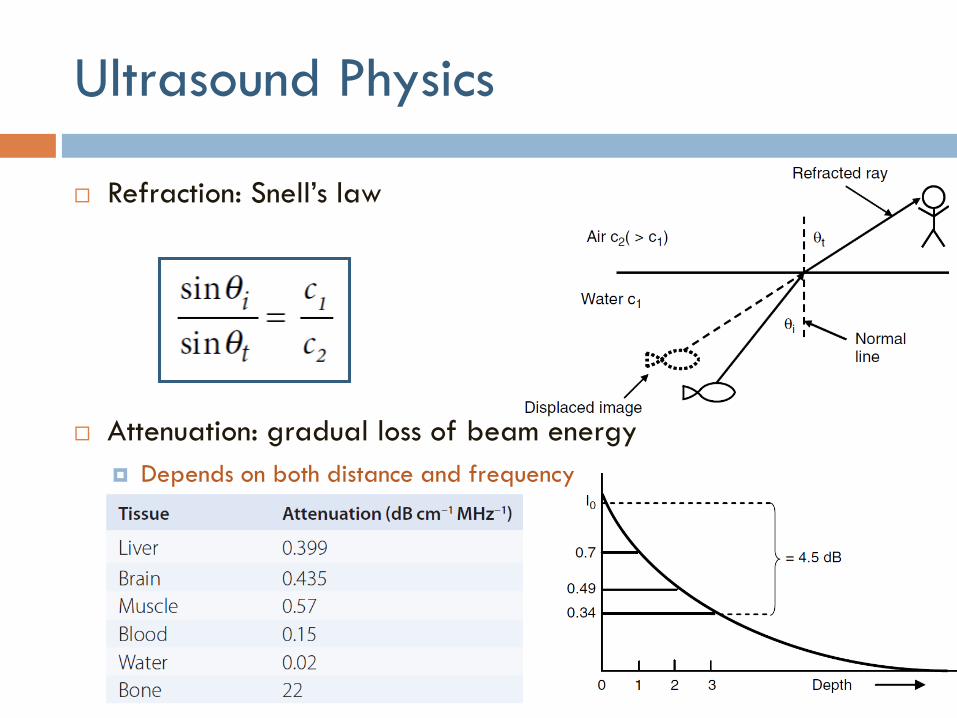
Refraction: Snell’s law
Attenuation: gradual loss of beam energy
Depends on both distance and frequency

Ultrasound Physics
Interference and diffraction
Constructive/Destructive interference

Ultrasound Physics
Focusing: narrower ultrasound beam

Ultrasound Physics
Ultrasound pulse
Harmonic Imaging

Ultrasound Physics
Acoustic pressure and intensities within ultrasound beam

Ultrasound Physics
Acoustic pressure and intensities within ultrasound beam
IsptpIsptaIsata

Transducers and Beamforming
Transducer: device that actually converts electrical transmission
pulses into ultrasonic pulses and, conversely, ultrasonic echo
pulses into electrical echo signals
Beamformer: part of scanner that determines the shape, size
and position of the interrogating beams by controlling
electrical signals to and from the transducer array elements

Transducers and Beamforming
Quarter-wavelength matching layer
Bandwidth for multi-frequency
transducers

Transducers and Beamforming
Linear- and curvilinear-array transducers

Transducers and Beamforming
Transmission Focusing
Reception focusing
Delay-Sum beamforming

Transducers and Beamforming
Dynamic reception focusing

Transducers and Beamforming
Beamforming: selecting active elements and apodization
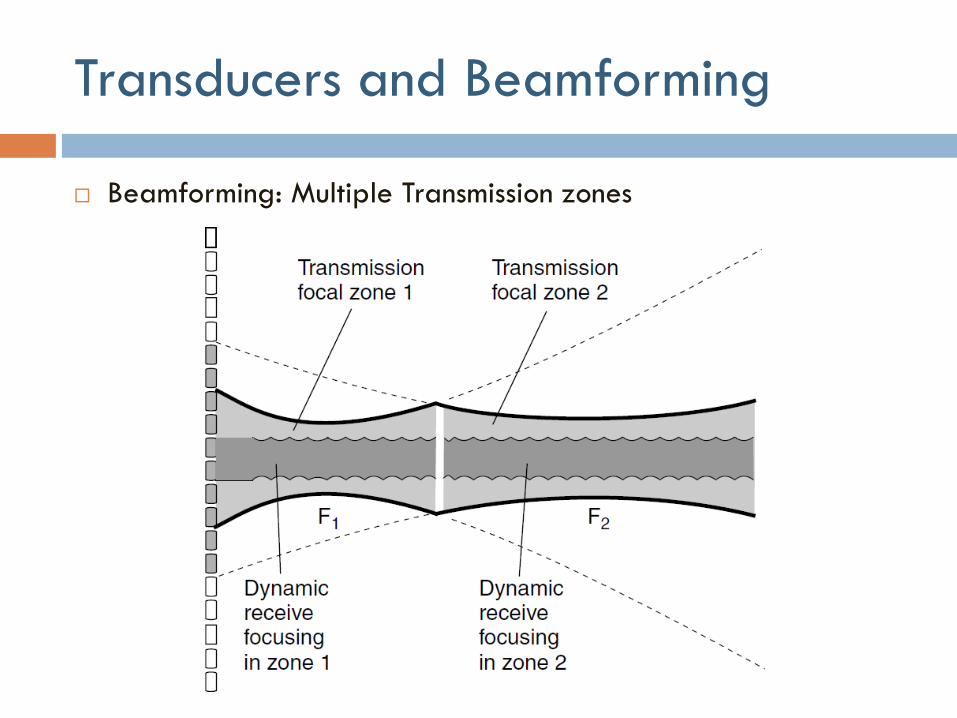
Transducers and Beamforming
Beamforming: Multiple Transmission zones

Transducers and Beamforming
Beamforming: Grating lobes
No grating lobes, if the center-to-center distance between elements is
half a wavelength or less

Transducers and Beamforming
Slice thickness: elevation direction
1.5D or 2D arrays
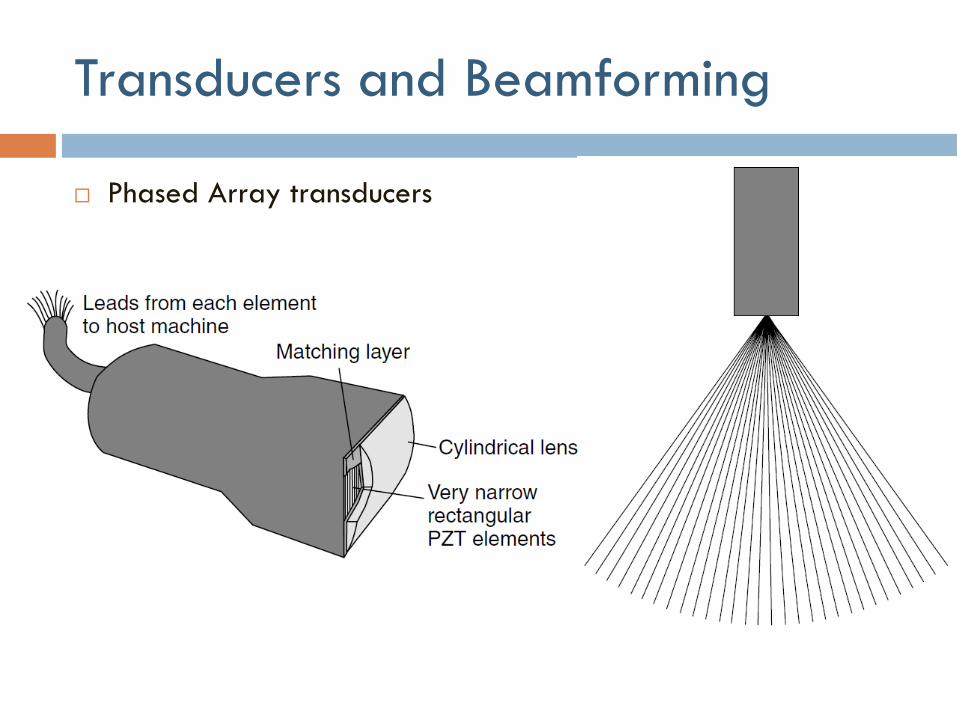
Transducers and Beamforming
Phased Array transducers

Transducers and Beamforming
Electronic steering/focusing
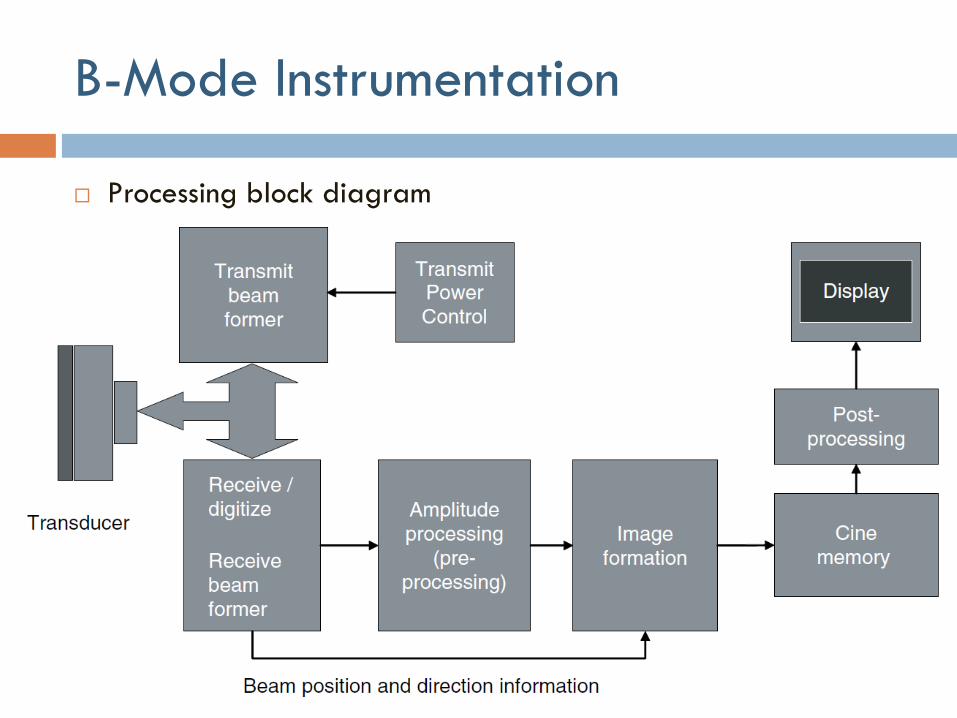
B-Mode Instrumentation
Processing block diagram

B-Mode Instrumentation
Time-Gain Compensation

B-Mode Instrumentation
Dynamic range of echoes

B-Mode Instrumentation
Image reconstruction: scan conversion and interpolation
Real-time display: frame every 1/25 s
Freeze: updating frame stops
Cine Loop: recording of real-time scan as a movie
Frame Averaging: moving average filter to improve SNR

B-Mode Image Properties
Lateral Resolution
Thickness resolution
Elevation

B-Mode Image Properties
Axial resolution
Half pulse length
Speckle
Random yet stationary pattern

B-Mode Image Properties
Frame time / Frame rate
Time to scan a complete image
Example: time to scan 1 cm= 2x1cm/c= 2 cm/(1540 m/s) = 13 s
Then, frame time to scan a 20 cm depth with 128 lines=13 s x20 x128
Frame rate = 1/ frame time = 30 frames/s
Smaller D
Smaller N
Higher Frame Rate

Doppler Ultrasound
Doppler effect: Change in the observed frequency of the
sound wave compared to the emitted frequency which occurs
due to relative motion between observer and source
Up-Shift
Down-Shift
No Shift

Doppler Ultrasound
RBCS in blood are hardly visible in ultrasound images
Scattering because of its very small size

Doppler Ultrasound
Doppler Shift Equation

Doppler Ultrasound
Doppler display modes
Spectral Doppler Color Doppler

Doppler Ultrasound
Continuous Wave (CW) Doppler
Only a small region for Doppler sensitivity
No range information
No limitation on maximum velocity and high velocity accuracy

Doppler Ultrasound
Pulsed-Wave (PW) Doppler
Range information is available and region is selectable by user
Limitations on maximum velocity and accuracy

Doppler Ultrasound
CW Signal Processing Transmitted
Received
Transmitted x Received
Low-pass Filtered
Transmitted x Received

Doppler Ultrasound
Clutter: signal from stationary tissues
Low Doppler shift and much stronger signal
Signal from stationary tissue and wall motion
Critical step in Doppler processing
Doppler Ultrasound
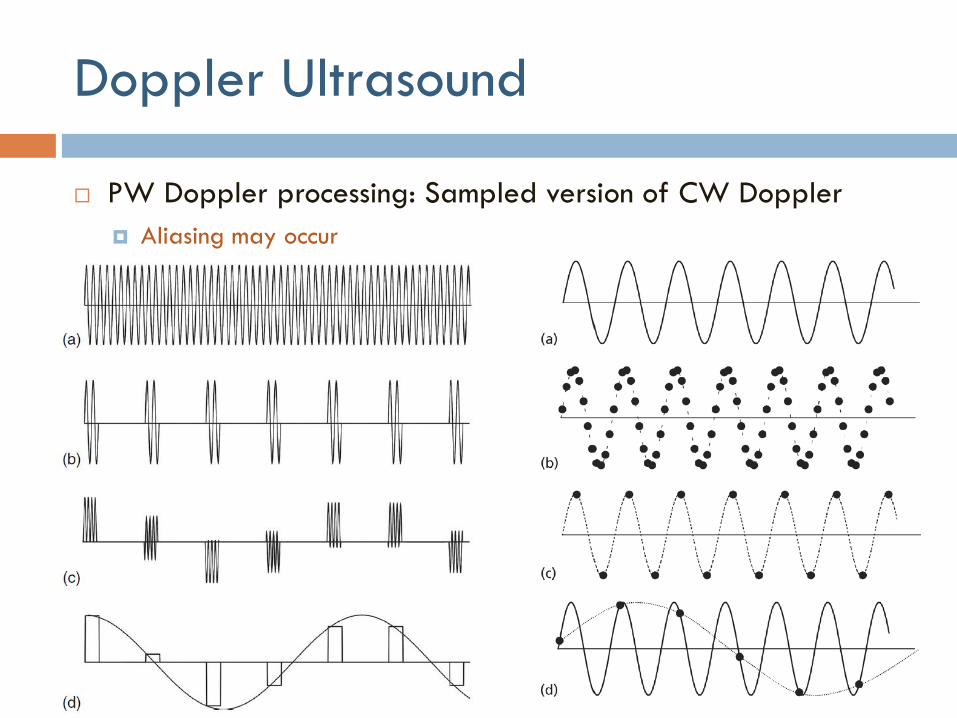
PW Doppler processing: Sampled version of CW Doppler
Aliasing may occur

Doppler Ultrasound
Time-domain PW processing techniques

Doppler Ultrasound
Example: Consider Doppler imaging of a vessel at depth d1=
10 cm. derive the maximum detectible velocity if the
transmitted signal frequency was 5 MHz and Doppler angle
was 45.
Time to collect one sample = PRI = 13s/cm x (10 cm)= 130s
Sampling frequency = PRF = 1/PRI= 7692 Sa/s = 2 fdmax
vmax=(1540 x 7692/2)/(2x5x106xCos(45))
Doppler Ultrasound
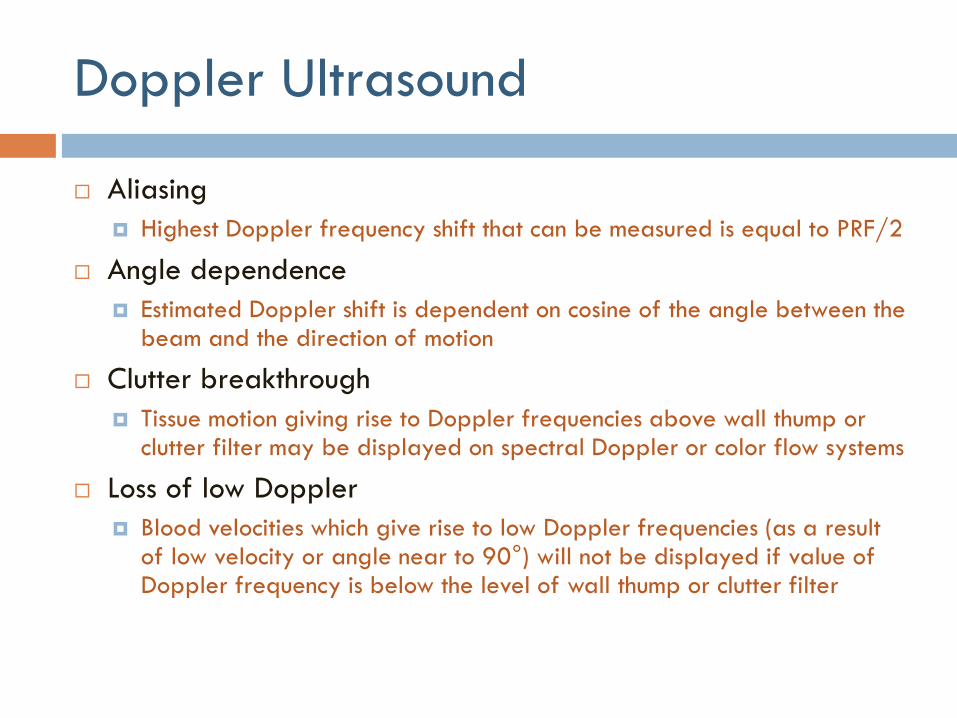
Aliasing
Highest Doppler frequency shift that can be measured is equal to PRF/2
Angle dependence
Estimated Doppler shift is dependent on cosine of the angle between the beam and the direction of motion
Clutter breakthrough
Tissue motion giving rise to Doppler frequencies above wall thump or clutter filter may be displayed on spectral Doppler or color flow systems
Loss of low Doppler
Blood velocities which give rise to low Doppler frequencies (as a result of low velocity or angle near to 90°) will not be displayed if value of Doppler frequency is below the level of wall thump or clutter filter
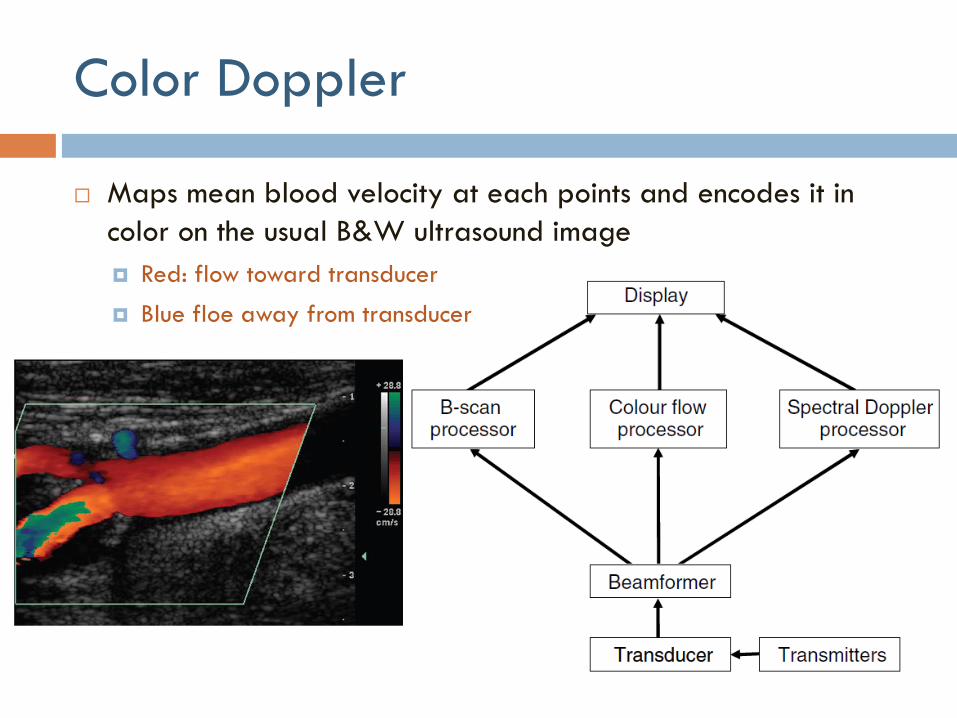
Color Doppler
Maps mean blood velocity at each points and encodes it in
color on the usual B&W ultrasound image
Red: flow toward transducer
Blue floe away from transducer

Power Doppler
Estimate of the power of all shifted components
Not just mean like in color Doppler
Very useful for assessing perfusion
Encoded in shades of red only

Ultrasound Safety
A fundamental approach to the safe use of diagnostic
ultrasound is to use the lowest output power and the shortest
scan time consistent with acquiring the required diagnostic
information
“ALARA” principle (i.e. as low as reasonably achievable)

Ultrasound Imaging System:
External Look

Keyboard Controls
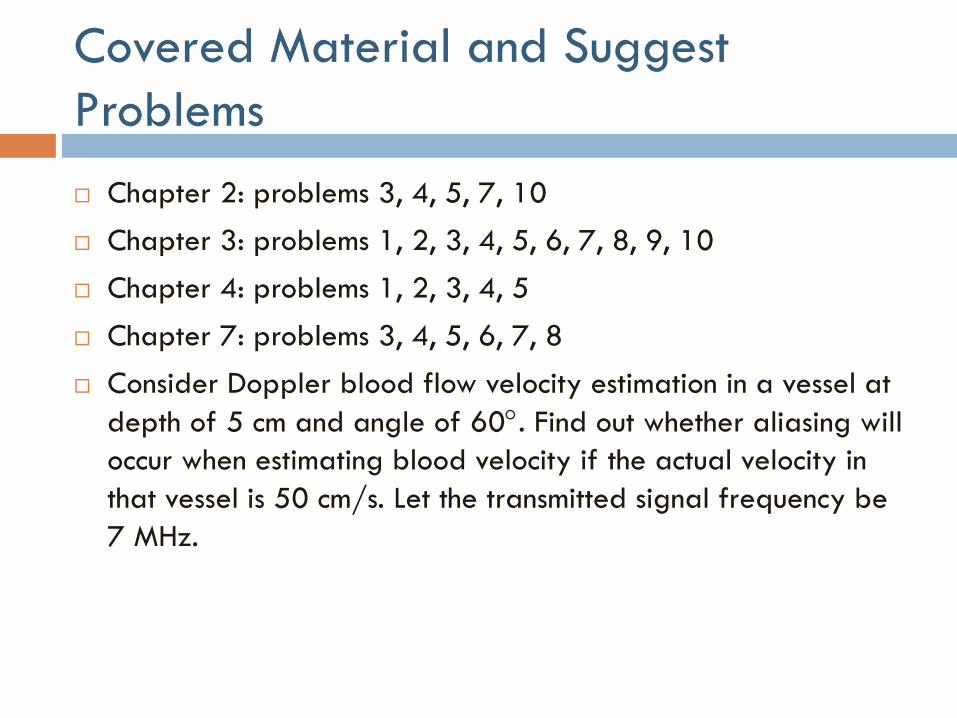
Covered Material and Suggest
Problems
Chapter 2: problems 3, 4, 5, 7, 10
Chapter 3: problems 1, 2, 3, 4, 5, 6, 7, 8, 9, 10
Chapter 4: problems 1, 2, 3, 4, 5
Chapter 7: problems 3, 4, 5, 6, 7, 8
Consider Doppler blood flow velocity estimation in a vessel at
depth of 5 cm and angle of 60. Find out whether aliasing will
occur when estimating blood velocity if the actual velocity in
that vessel is 50 cm/s. Let the transmitted signal frequency be
7 MHz.