Embed Size (px)
Citation preview

Laghi Jr. et al. BMC Pulm Med (2021) 21:85 https://doi.org/10.1186/s12890-021-01441-6
REVIEW
Ultrasound and non-ultrasound imaging techniques in the assessment of diaphragmatic dysfunctionFranco A. Laghi Jr.1, Marina Saad2 and Hameeda Shaikh3,4*
Abstract
Diaphragm muscle dysfunction is increasingly recognized as an important element of several diseases including neuromuscular disease, chronic obstructive pulmonary disease and diaphragm dysfunction in critically ill patients. Functional evaluation of the diaphragm is challenging. Use of volitional maneuvers to test the diaphragm can be limited by patient effort. Non-volitional tests such as those using neuromuscular stimulation are technically complex, since the muscle itself is relatively inaccessible. As such, there is a growing interest in using imaging techniques to characterize diaphragm muscle dysfunction. Selecting the appropriate imaging technique for a given clinical sce-nario is a critical step in the evaluation of patients suspected of having diaphragm dysfunction. In this review, we aim to present a detailed analysis of evidence for the use of ultrasound and non-ultrasound imaging techniques in the assessment of diaphragm dysfunction. We highlight the utility of the qualitative information gathered by ultrasound imaging as a means to assess integrity, excursion, thickness, and thickening of the diaphragm. In contrast, quantitative ultrasound analysis of the diaphragm is marred by inherent limitations of this technique, and we provide a detailed examination of these limitations. We evaluate non-ultrasound imaging modalities that apply static techniques (chest radiograph, computerized tomography and magnetic resonance imaging), used to assess muscle position, shape and dimension. We also evaluate non-ultrasound imaging modalities that apply dynamic imaging (fluoroscopy and dynamic magnetic resonance imaging) to assess diaphragm motion. Finally, we critically review the application of each of these techniques in the clinical setting when diaphragm dysfunction is suspected.
Keywords: Diaphragm dysfunction, Ultrasound imaging, Static imaging techniques, Dynamic imaging techniques, Phrenic nerve, Mechanical ventilation, Neuromuscular disorders
© The Author(s) 2021. Open Access This article is licensed under a Creative Commons Attribution 4.0 International License, which permits use, sharing, adaptation, distribution and reproduction in any medium or format, as long as you give appropriate credit to the original author(s) and the source, provide a link to the Creative Commons licence, and indicate if changes were made. The images or other third party material in this article are included in the article’s Creative Commons licence, unless indicated otherwise in a credit line to the material. If material is not included in the article’s Creative Commons licence and your intended use is not permitted by statutory regulation or exceeds the permitted use, you will need to obtain permission directly from the copyright holder. To view a copy of this licence, visit http://creat iveco mmons .org/licen ses/by/4.0/. The Creative Commons Public Domain Dedication waiver (http://creat iveco mmons .org/publi cdoma in/zero/1.0/) applies to the data made available in this article, unless otherwise stated in a credit line to the data.
BackgroundThe diaphragm is the main muscle of respiration dur-ing resting breathing [1]. When respiratory demands are increased or diaphragm function is impaired, rib cage muscles and expiratory muscles are progressively recruited [2]. In some patients with diaphragm dys-function, this compensation is associated with minimal
or no respiratory symptoms [1]. In other patients, this compensation is associated with significant respiratory symptoms. Diaphragm dysfunction can cause alveolar hypoventilation and, in the most severe cases, respira-tory failure requiring mechanical ventilation [1, 2]. The ultimate causes of diaphragmatic dysfunction can be broadly grouped into three major categories: disorders of central nervous system or peripheral neurons, disorders of the neuromuscular junction and disorders of the con-tractile machinery of the diaphragm itself [3] (Table 1). Early diagnosis of diaphragmatic dysfunction is essential,
Open Access
*Correspondence: [email protected] Division of Pulmonary and Critical Care Medicine, Hines Veterans Affairs Hospital (111N), 5th Avenue and Roosevelt Road, Hines, IL 60141, USAFull list of author information is available at the end of the article
Page 2 of 29Laghi Jr. et al. BMC Pulm Med (2021) 21:85
because it may be responsive to therapeutic intervention [4–7].
A number of static and dynamic imaging techniques are used in the evaluation of patients suspected of dia-phragm dysfunction [8]. Static imaging techniques are used to assess the position, shape and dimensions of the diaphragm and include chest radiography [9], brightness mode (B-mode) ultrasound [10, 11], computed tomog-raphy (CT) [12], and static magnetic resonance imag-ing (MRI) [13]. Dynamic imaging techniques are used to assess diaphragm motion in one or more directions. This group of imaging techniques include fluoroscopy [14], motion mode (M-mode) ultrasonography [10, 11, 15], and dynamic MRI [16].
The purpose of this review is to present the accumu-lated knowledge on imaging techniques used in the evaluation of diaphragm dysfunction. A MEDLINE search of articles published between 2010 and 2020 was undertaken. Searches of the bibliographies of articles resulted in several additional articles and book chapters. Information was selected on the basis of scientific qual-ity and potential relevance to patients suffering from a pulmonary disease or a disorder requiring admission to an intensive care unit; in all, a total of 128 sources were included in this review.
In this review we will first discuss ultrasound imaging techniques and then non-ultrasound imaging techniques. We will then discuss the clinical applications of these techniques. Finally, we will provide a critical appraisal of the limitations of ultrasound and non-ultrasound imag-ing in the evaluation of diaphragmatic dysfunction and considerations about future directions.
Ultrasound imaging of the diaphragmDiaphragm ultrasonography was first described in the late 1960s as a means to determine position and size of supra- and subphrenic mass lesions, and to assess the motion and contour of the diaphragm [17]. Two decades later, Wait et al. [18] developed a technique to measure diaphragm thickness based on ultrasonography. The
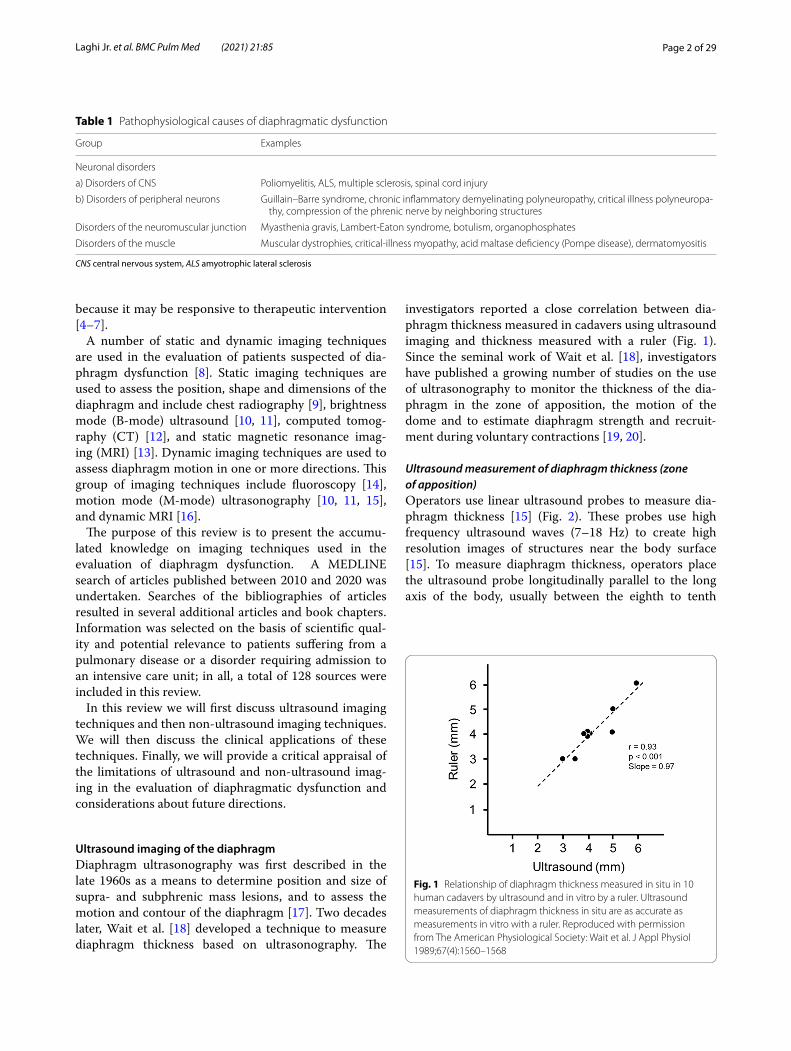
investigators reported a close correlation between dia-phragm thickness measured in cadavers using ultrasound imaging and thickness measured with a ruler (Fig. 1). Since the seminal work of Wait et al. [18], investigators have published a growing number of studies on the use of ultrasonography to monitor the thickness of the dia-phragm in the zone of apposition, the motion of the dome and to estimate diaphragm strength and recruit-ment during voluntary contractions [19, 20].
Ultrasound measurement of diaphragm thickness (zone of apposition)Operators use linear ultrasound probes to measure dia-phragm thickness [15] (Fig. 2). These probes use high frequency ultrasound waves (7–18 Hz) to create high resolution images of structures near the body surface [15]. To measure diaphragm thickness, operators place the ultrasound probe longitudinally parallel to the long axis of the body, usually between the eighth to tenth
Table 1 Pathophysiological causes of diaphragmatic dysfunction
CNS central nervous system, ALS amyotrophic lateral sclerosis
Group Examples
Neuronal disorders
a) Disorders of CNS Poliomyelitis, ALS, multiple sclerosis, spinal cord injury
b) Disorders of peripheral neurons Guillain–Barre syndrome, chronic inflammatory demyelinating polyneuropathy, critical illness polyneuropa-thy, compression of the phrenic nerve by neighboring structures
Disorders of the neuromuscular junction Myasthenia gravis, Lambert-Eaton syndrome, botulism, organophosphates
Disorders of the muscle Muscular dystrophies, critical-illness myopathy, acid maltase deficiency (Pompe disease), dermatomyositis
Fig. 1 Relationship of diaphragm thickness measured in situ in 10 human cadavers by ultrasound and in vitro by a ruler. Ultrasound measurements of diaphragm thickness in situ are as accurate as measurements in vitro with a ruler. Reproduced with permission from The American Physiological Society: Wait et al. J Appl Physiol 1989;67(4):1560–1568

Page 3 of 29Laghi Jr. et al. BMC Pulm Med (2021) 21:85
intercostal space [21, 22], at the anterior axillary line [15] or midway between the anterior- and mid-axillary lines [23]. The costo-phrenic sinus [24] is identified as the transition between lung and liver (right) or between lung and spleen (left). The zone of apposition, where the dia-phragm is opposed to the rib cage, is located caudal to the costo-phrenic sinus [24]. To identify the diaphragm, sub-jects are asked to inhale while operators select B-mode imaging. As the lung comes between transducer and dia-phragm, it creates an hyperechoic bright artifact (“lung curtain sign”) [25] that obliterates the muscle’s image [18] (Additional file 1). The diaphragm is identified as a three-layer structure (two echogenic layers of peritoneum and pleura sandwiching a more hypoechoic layer of the mus-cle itself ) underneath the intercostal muscles [26] that reappear as lung artifact recedes [15, 18] (Fig. 2). Occa-sionally, an additional bright layer due to connective tis-sue and vessels can be seen within the muscle layer itself [27]. To reduce lung artifact operators can move the transducer towards the anterior axillary line [25] or to the next (caudal) intercostal space. It is easier to visualize the right than the left hemidiaphragm [24, 28].
Intra- and interobserver agreement of measurements of diaphragm thickness obtained at a single sitting in healthy adults [26, 29] and in ventilated patients [28] are high as long as the operator marks the site and all sub-sequent images are recorded from that mark [28]. This caveat is critical because measurements of diaphragm thickness are highly variable depending on the chosen
intercostal space: in a study of 150 healthy subjects [26] investigators reported as much as a 6-mm change in rest-ing thickness from one intercostal space to another.
Diaphragm thickness while healthy subjects rest at functional residual capacity (FRC) varies widely from 1.2 to 11.8 mm among individuals, with group mean val-ues ranging from 1.6 to 3.4 mm [18, 25, 26, 29–32]. The lower limit of normal (LLN) in adults can range from 0.80 to 1.60 mm [26, 29–31]. Some of these wide varia-tions may be due to failure to standardize body position [33], lung volume or the intercostal space where the thickness of the diaphragm is measured. The thickness of the diaphragm varies, with more inferior portions of the diaphragm being thicker than more superior portions [15]. Measurements of diaphragm thickness can be diffi-cult in some individuals: a poor acoustic window occurs in 2–10% of ambulatory subjects [34, 35] and 5–15% of intensive care unit (ICU) patients [28, 34]. Adiposity has a detrimental effect on the quality of ultrasound imaging [27].
Ultrasound estimation of diaphragm strength and recruitment (zone of apposition)Recordings of diaphragm thickening during voluntary contractions, two-dimensional speckle tracking imag-ing and shear wave elastography are ultrasound-based techniques that have been used to estimate diaphragm strength.
Fig. 2 Ultrasound image of the zone of apposition of the diaphragm. In brightness-mode (B-mode; left panel), the diaphragm appears as a three-layer structure. In motion-mode (M-mode; right panel), the diaphragm is thinnest at end-exhalation and thickest at end-inhalation; stronger diaphragmatic inspiratory efforts are associated with greater tidal thickening of the diaphragm. Reproduced with permission from The American Association for Respiratory Care: Shaikh et al. Respir Care 2019;64:1600–2. The entirety of both images was obtained by Dr. Shaikh

Page 4 of 29Laghi Jr. et al. BMC Pulm Med (2021) 21:85
Diaphragm thickening The contracting diaphragm shortens and thickens [18]. This thickening can be quan-tified as thickening fraction (change in thickness from end exhalation to peak inhalation divided by thickness at end exhalation × 100 [18]) (Fig. 3) or as thickening ratio (thickness at peak inhalation divided by thickness at end exhalation [27]). According to some [27, 28] but not all investigators [36], diaphragm thickening during volun-tary contractions correlates with inspiratory pressures [27, 28] (Fig. 4). When a correlation has been reported, there is high inter-individual variability in the relation-ship between diaphragmatic thickening and changes in airway pressure (Paw) [27], transdiaphragmatic pressure (Pdi) or electrical activity of the diaphragm (EAdi) [28]. A likely contributor for the high inter-individual variability is shifting recruitment of the various inspiratory muscles during inspiration [37].
Two‑dimensional speckle tracking imaging The meas-urement of diaphragm thickening does not assess con-traction-associated longitudinal muscle shortening—the plane of muscle fiber motion [25]. Speckle tracking has the potential to describe this longitudinal shortening dur-ing diaphragm contractions [25, 36]. This technique takes advantage of the fact that ultrasound images are made up of different grey-scale pixels called speckles. A speckle-
tracking software follows unique groups of these pixels (known as ‘kernels’) to measure their displacement in relation to one another (deformation) [36, 38] (Fig. 5). The extent of deformation is known as ‘strain’. Negative strain values indicate kernels are coming closer together (Addi-tional file 2). For example, a strain value of -30% indicates local muscle fiber shortening of 30%. The more negative a number, the greater the deformation and the greater the contraction (Fig. 5). During loaded breathing, strain is closely correlated with Pdi (r2 = 0.72) and EAdi (r2 = 0.60), whereas diaphragmatic thickening is not [36]. The per-formance of this technique under different loading condi-tions (isometric contractions, high inspiratory volume) is still unknown.
Shear wave elastography Ultrasound shear wave elas-tography is an imaging method that allows real-time quantification of tissue mechanical properties [39]. Shear wave elastography relies on the estimation of the propaga-tion velocity of shear waves generated inside tissues [39]. With this technique it is possible to calculate the shear modulus (SM) of the tissue being studied [40]. (The shear modulus, or modulus of rigidity, is defined as the ratio of shear stress to the shear strain where shear stress refers to the deforming force applied on an object, and shear strain refers to the change in size or shape that object.) In limb muscles, local muscle stiffness measured using shear wave elastography provides estimates of muscle force [41].
Chino et al. [42] were the first to report that the dia-phragm’s shear modulus (SMdi) increases along with increases in Paw. The rate of increase of the shear mod-ule slowed when the pressure reached higher levels. In a
Fig. 3 Diaphragmatic thickening fraction. (Upper panel) Schematic representation of the points used to measure diaphragm thickness and formula used to calculate thickening fraction (TF). (Lower panels) Relationship of thickening fraction to lung volume expressed as a percent of inspiratory capacity (IC) in two healthy subjects. Each point represents the mean of three measurements taken from one breath. The slope of the relationship between thickening fraction and lung volume has high interindividual variability. Reproduced with permission from The American Physiological Society: Wait et al. J Appl Physiol 1989;67(4):1560–1568
Fig. 4 Relationship between the thickening of the diaphragm recorded with ultrasonography and changes in transdiaphragmatic pressure (∆Pdi; left panel) and diaphragmatic electrical activity (∆EAdi; right panel) in five healthy subjects during a series of inspiratory maneuvers. Diaphragmatic thickening increased as transdiaphragmatic pressure (left panel) and electrical activity of the diaphragm (right panel) increased. The correlation was weak (r2 = 0.32 and 0.28, respectively, p < 0.01). Adapted with permission from Springer Nature: Goligher et al. Intensive Car Med 2015;41(4):642–9

Page 5 of 29Laghi Jr. et al. BMC Pulm Med (2021) 21:85
study by Bachasson et al. [22] investigators determined whether shear wave elastography could be used as a sur-rogate of Pdi in healthy subjects. In that study, mean Pdi was related to mean SMdi during closed-airways maneu-vers and during inspiratory threshold loading (Additional file 3). The intra- and inter-rater agreement of SMdi measurements are yet to be determined.
Ultrasound measurement of diaphragm motion (dome)The cranio-caudal movement of the dome of the dia-phragm during quiet breathing [31, 43–45] and dur-ing forceful inspiratory efforts such as sniff maneuvers or maximal inspirations [43, 45, 46] can be moni-tored using curvilinear ultrasound probes. Curvilinear probes use low frequency ultrasound waves (2–6 Hz) [15] that penetrate deeply in the body giving a wide depth of field. On the right, operators position the probe longitudinally in the subcostal area between the mid-clavicular and anterior axillary lines using the liver as acoustic window. The probe is directed medially,
cephalad and dorsally so that the ultrasound beam reaches the right dome of the diaphragm perpendicu-larly. On the left side, operators use the spleen as an acoustic window [45]. (Less often, operators may use the right or left lateral view (midaxillary lines) [47] or the posterior subcostal view or the subxiphoid view [15].) Once a good quality B-mode image is obtained, operators adjust the M-mode interrogation line as to be perpendicular to the movement of the hemidiaphragm [45, 48]. With M-mode ultrasonography, the diaphragm appears as a single thick echogenic line (Fig. 6). During inhalation the contracting diaphragm moves towards the ultrasound probe (Additional file 4). Diaphragm excursion are greater in men than in women [43, 45, 46, 49]. In up to 28% of patients, it is impossible to record maximal diaphragmatic excursions with M-mode ultra-sonography [50].
Reported normal values of diaphragm motion during quiet breathing and deep breathing range from 2.6 to 30 mm [43, 45, 46], and 16.7 to 110.0 mm [43, 45, 46],
Fig. 5 Two-dimensional speckle tracking imaging of the diaphragm’s zone of apposition at end-exhalation (left panel) and end-inhalation (right panel). The image of the diaphragm has a granularity caused by an inherent ultrasound artifact known as speckle. A cluster of speckles form a kernel. The stronger the contraction of the diaphragm, the closer kernels come together (strain). With speckle-tracking software, it is possible to quantify the strain of the diaphragm as: 100 multiplied by the difference of the distance between two representative kernels at end-inhalation (D2) minus the distance between the same kernels at end-exhalation (D1) divided by D1. In the example above, the distance between two representative kernels at end-exhalation (left panel) is 10 mm (D1) and at end-inhalation (right panel) 6 mm (D2), yielding a strain of -40%. Reproduced under Open Access Creative Commons License: Orde et al. BMC Anesthesiol 2015;16(1):43

Page 6 of 29Laghi Jr. et al. BMC Pulm Med (2021) 21:85
respectively. Diaphragm motion is greater posteriorly than anteriorly and greater laterally than medially [46]. The reported LLN of diaphragm excursion can range from 6.8 to 9.1 mm during resting breathing and from 29.3 to 61.8 mm during deep breathing [31, 43]. Some of these wide variations may be due to failure to stand-ardize body position [13, 14], lung volume, and gender distribution among study participants [44, 45].
The association between diaphragm excursion and dia-phragm thickening is very weak [25] and that between diaphragm excursions and diaphragm pressure output [31, 51] is weak-to-absent. A likely contributor for the limited [31] or absent [51] correlation between inspira-tory pressure output and diaphragm excursions is the high inter-individual variability in recruitment of various inspiratory muscles during inspiration [37].
Non‑ultrasound imaging of the diaphragm: static imaging techniquesChest radiographyChest radiography is used to assess the position of each hemidiaphragm. An elevated hemidiaphragm suggests unilateral phrenic nerve paralysis (Fig. 7). This, however, is a nonspecific finding that can occur in several other conditions including atelectasis, pneumonia, lobectomy and pulmonary fibrosis (Fig. 8). Another limiting fac-tor of chest radiography is the moderate interobserver agreement to detect the presence of unilateral hemidi-aphragm elevation (kappa value ranging from 0.48 to
0.59) [52]. It can be difficult to detect diaphragm eleva-tion in patients with bilateral paralysis unless chest radio-graphs before the onset of the paralysis are available for comparison [53].
Computed tomographyCT images obtained while subjects maintain different lung volumes have been used to assess diaphragm posi-tion [54], and diaphragm dimensions in terms of thick-ness [55–57], surface area [58] and volume [59].
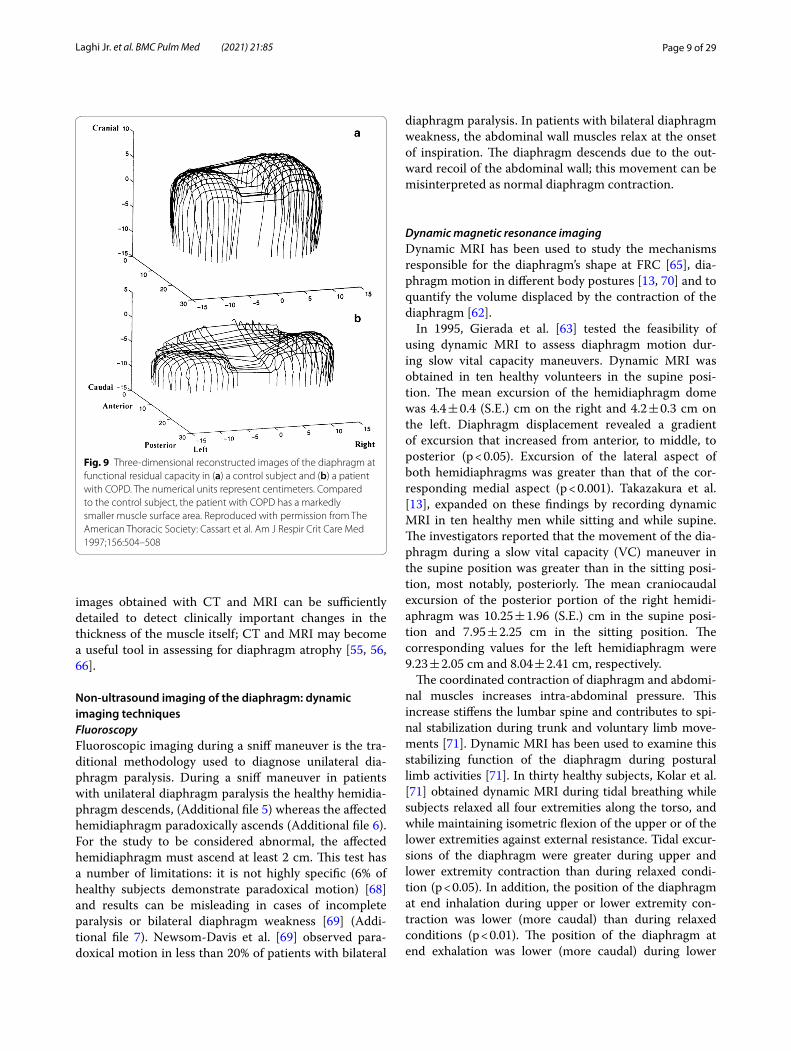
In 1987, Whitelaw [60] was the first to generate a three-dimensional reconstruction of the diaphragm in one healthy subject using serial CT images. Ten years later, Pettiaux et al. [61] validated a technique of using spiral CT in four healthy subjects. Using this technique, Cas-sart et al. [58] studied the effect of chronic hyperinflation on diaphragm length and surface area in 10 patients with severe chronic obstructive pulmonary disease (COPD) (forced expiratory flow in one second (FEV1) = 27 ± 6% (S.D.) predicted) with severe hyperinflation (functional residual capacity (FRC) = 225 ± 2% predicted) and 10 healthy subjects matched for age, sex, and height (Fig. 9). They concluded that patients with COPD have marked reductions in the diaphragm’s total surface area and sur-face area of the zone of apposition at FRC. At similar absolute lung volumes, however, diaphragm dimensions of patients were similar to those of healthy subjects.
CT imaging has been proposed as a means to measure crural diaphragm thickness in ventilated patients [55]
Fig. 6 Ultrasound image of the dome of the diaphragm in brightness-mode (B-mode; left panel) and motion-mode (M-mode; right panel). As the diaphragm contracts, the dome moves towards the ultrasound probe. The larger the caudal displacement of the diaphragm, the greater the diaphragmatic contribution to tidal breathing. Reproduced with permission from The American Association for Respiratory Care: Shaikh e al. Respir Care 2019;64:1600–2. The entirety of both images was obtained by Dr. Shaikh

Page 7 of 29Laghi Jr. et al. BMC Pulm Med (2021) 21:85
(Fig. 10) and in patients with suspected diaphragm paral-ysis [56]. Unfortunately, there is no consensus on which area of the muscle should be measured and at which lung volume [57]. Accordingly, the role of CT measurement of the crural diaphragm thickness remains uncertain.
Spiral CT has been used to calculate the volume of the diaphragm [59]. With this technique, Jung et al. [59] reported that, upon ICU admission, the diaphragm’s vol-ume in 23 critically ill patients (14 of whom were septic) was not different from the volume of the diaphragm in 17 control patients. Twenty-five days after admission, the volume of the diaphragm had decreased by 11 ± 13% in nonseptic patients and by 27 ± 12% in septic patients (p = 0.01) (Fig. 11). Upon ICU admission, diaphragm vol-ume only weakly correlated with diaphragm strength as
measured by airway twitch pressure (PawTw) elicited by magnetic stimulation of the phrenic nerves. To date, no investigator has validated the accuracy of spiral CT imag-ing to calculate the volume of the diaphragm.
Static magnetic resonance imagingStatic MRI obtained while subjects maintain different lung volumes can be used to assess the diaphragm’s shape [62], position [63], thickness [54] and surface area [58, 64].
Using static MRI in four healthy subjects, Paiva et al. [65] concluded that the shape of the dorsal half of the relaxed diaphragm in the supine position at FRC can be explained by the Laplace law—i.e., the lung and abdominal contents do not impose their shape on the
Fig. 7 Phrenic nerve injury and diaphragm dysfunction in a patient after coronary artery bypass surgery (CABG). (Top panels) Initial posteroanterior (left) and lateral (right) films demonstrate both hemidiaphragms in a relatively normal position. (Bottom panels) After CABG, posteroanterior (left) and lateral (right) films demonstrates new elevation of the left hemidiaphragm, suggestive of postoperative phrenic nerve injury. Reproduced under Open Access Creative Commons License: Kokatnur et al. Diseases 2018:6(1):16

Page 8 of 29Laghi Jr. et al. BMC Pulm Med (2021) 21:85
diaphragm. In a subsequent static MRI study, Gauthier et al. [64] reported that, with lung inflation, the dimen-sion of the zone of apposition is a function of dia-phragm shortening and, to a lesser extent, widening of the lower rib cage. The investigators concluded that the diaphragm is more accurately modeled by a "widening piston" (Petroll’s model) than a simple "piston in a cyl-inder" model.
More recently, Cluzel et al. [62] evaluated the use of three-dimensional reconstruction of the static MRI of the thorax in five healthy subjects while supine. Compared to measurements of residual volume (RV) and total lung capacity (TLC) obtained using a spirometer and helium dilution technique, measurements obtained with static MRI tended to overestimate RV and underestimate TLC. Between RV and TLC, the mean volume under the dome of the diaphragm decreased by 66%, and the mean vol-ume of the cavity delimited by the rib cage increased by
23%. The diaphragm contributed to 60% of the inspira-tory capacity (Fig. 12).
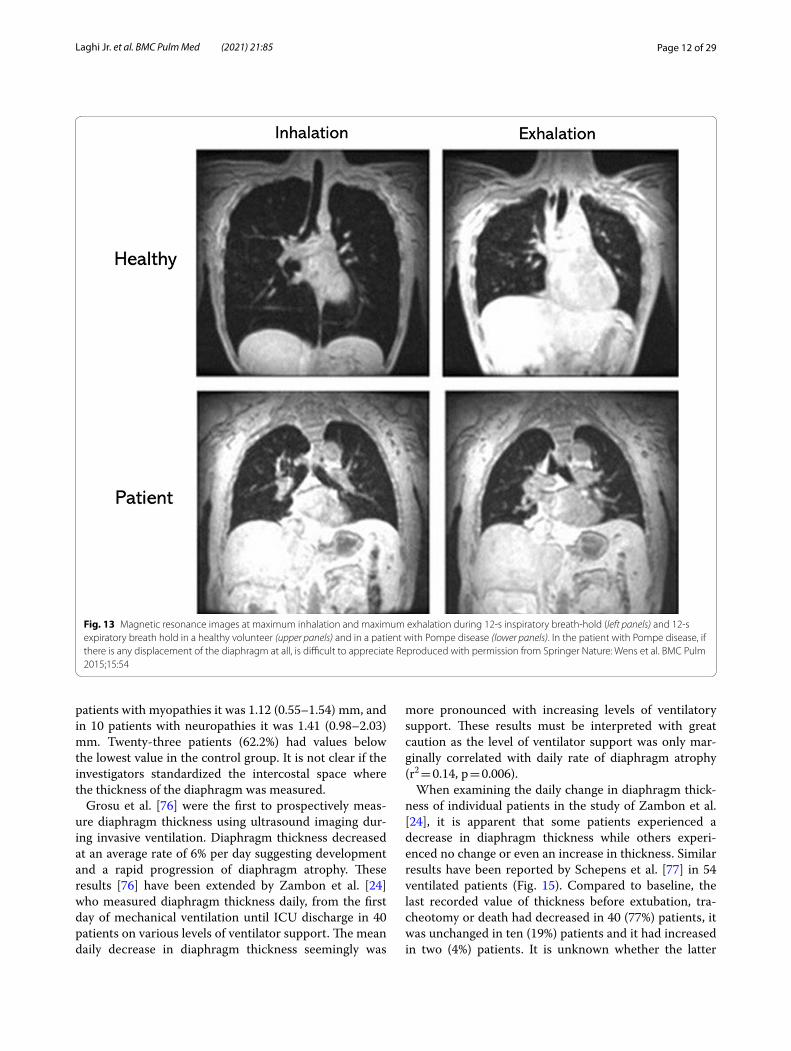
In patients with late-onset glycogen storage disease type II, also known as late-onset POMPE disease, Gaeta et al. [54, 66] reported that diaphragm atrophy and maxi-mal diaphragm excursions assessed with static MRI, correlate with forced vital capacity (FVC) in the supine position, standing-to-supine decrease in FVC, peak cough flow and maximal inspiratory pressure. Similar results were reported by Wens et al. [67] (Fig. 13).
In summary, chest radiograph provides limited infor-mation pertaining to diaphragm morphology [52]. The more advanced static imaging techniques, CT and MRI, provide useful information regarding the surface area and positioning of the entirety of the diaphragm within the thorax. As such, using CT and MRI, it is possible to correlate changes in diaphragm position with changes in lung volume [58, 62], and elucidate the role of the dia-phragm in pulmonary disease states [54, 58]. In addition,
Fig. 8 Right hemidiaphragm elevation in a patient with idiopathic pulmonary fibrosis and dyspnea. Posteroanterior (a) and lateral (b) radiographs show pulmonary fibrosis with low lung volume and elevation of the right hemidiaphragm, concerning for paralysis. Axial (c) and coronal (d) CT images demonstrate diaphragm crura (arrows) without thinning, arguing against paralysis. CT images with lung window views in the axial (e) and coronal (f) plane show more lung fibrosis on the right than on the left. Right hemidiaphragm elevation likely reflects the greater degree of fibrosis and volume loss on the right. Reproduced with permission from Wolters Kluwer Health: Sukkasem et al. Journal of Thoracic Imaging 2017;32(6):383–390
Page 9 of 29Laghi Jr. et al. BMC Pulm Med (2021) 21:85
images obtained with CT and MRI can be sufficiently detailed to detect clinically important changes in the thickness of the muscle itself; CT and MRI may become a useful tool in assessing for diaphragm atrophy [55, 56, 66].
Non‑ultrasound imaging of the diaphragm: dynamic imaging techniquesFluoroscopyFluoroscopic imaging during a sniff maneuver is the tra-ditional methodology used to diagnose unilateral dia-phragm paralysis. During a sniff maneuver in patients with unilateral diaphragm paralysis the healthy hemidia-phragm descends, (Additional file 5) whereas the affected hemidiaphragm paradoxically ascends (Additional file 6). For the study to be considered abnormal, the affected hemidiaphragm must ascend at least 2 cm. This test has a number of limitations: it is not highly specific (6% of healthy subjects demonstrate paradoxical motion) [68] and results can be misleading in cases of incomplete paralysis or bilateral diaphragm weakness [69] (Addi-tional file 7). Newsom-Davis et al. [69] observed para-doxical motion in less than 20% of patients with bilateral
diaphragm paralysis. In patients with bilateral diaphragm weakness, the abdominal wall muscles relax at the onset of inspiration. The diaphragm descends due to the out-ward recoil of the abdominal wall; this movement can be misinterpreted as normal diaphragm contraction.
Dynamic magnetic resonance imagingDynamic MRI has been used to study the mechanisms responsible for the diaphragm’s shape at FRC [65], dia-phragm motion in different body postures [13, 70] and to quantify the volume displaced by the contraction of the diaphragm [62].
In 1995, Gierada et al. [63] tested the feasibility of using dynamic MRI to assess diaphragm motion dur-ing slow vital capacity maneuvers. Dynamic MRI was obtained in ten healthy volunteers in the supine posi-tion. The mean excursion of the hemidiaphragm dome was 4.4 ± 0.4 (S.E.) cm on the right and 4.2 ± 0.3 cm on the left. Diaphragm displacement revealed a gradient of excursion that increased from anterior, to middle, to posterior (p < 0.05). Excursion of the lateral aspect of both hemidiaphragms was greater than that of the cor-responding medial aspect (p < 0.001). Takazakura et al. [13], expanded on these findings by recording dynamic MRI in ten healthy men while sitting and while supine. The investigators reported that the movement of the dia-phragm during a slow vital capacity (VC) maneuver in the supine position was greater than in the sitting posi-tion, most notably, posteriorly. The mean craniocaudal excursion of the posterior portion of the right hemidi-aphragm was 10.25 ± 1.96 (S.E.) cm in the supine posi-tion and 7.95 ± 2.25 cm in the sitting position. The corresponding values for the left hemidiaphragm were 9.23 ± 2.05 cm and 8.04 ± 2.41 cm, respectively.
The coordinated contraction of diaphragm and abdomi-nal muscles increases intra-abdominal pressure. This increase stiffens the lumbar spine and contributes to spi-nal stabilization during trunk and voluntary limb move-ments [71]. Dynamic MRI has been used to examine this stabilizing function of the diaphragm during postural limb activities [71]. In thirty healthy subjects, Kolar et al. [71] obtained dynamic MRI during tidal breathing while subjects relaxed all four extremities along the torso, and while maintaining isometric flexion of the upper or of the lower extremities against external resistance. Tidal excur-sions of the diaphragm were greater during upper and lower extremity contraction than during relaxed condi-tion (p < 0.05). In addition, the position of the diaphragm at end inhalation during upper or lower extremity con-traction was lower (more caudal) than during relaxed conditions (p < 0.01). The position of the diaphragm at end exhalation was lower (more caudal) during lower
Fig. 9 Three-dimensional reconstructed images of the diaphragm at functional residual capacity in (a) a control subject and (b) a patient with COPD. The numerical units represent centimeters. Compared to the control subject, the patient with COPD has a markedly smaller muscle surface area. Reproduced with permission from The American Thoracic Society: Cassart et al. Am J Respir Crit Care Med 1997;156:504–508

Page 10 of 29Laghi Jr. et al. BMC Pulm Med (2021) 21:85
extremity contraction than during upper extremity con-traction or during relaxed conditions (p < 0.01). The latter finding suggests that during lower extremity contraction, the diaphragm does not relax fully and remains in higher tonic state of activity. In turn, the higher tonic state of activity supports critical involvement of the diaphragm in stabilizing the spine during postural activity.
Dynamic MRI has been used for the evaluation of dia-phragm movements in patients with COPD. Unal et al. [72], reported that during slow VC maneuvers, the ceph-alocaudal excursion of the dome of the diaphragm in 26 patients with COPD was less than half that recorded in 15 healthy subjects. Later, these same investigators reported an increase in diaphragm excursion following
Fig. 10 Assessment of crural diaphragm thickness by chest CT using axial and coronal images. (Left panel) With axial imaging, the thickness of the right and left crural hemidiaphragms (arrows) can be measured at level of the origin of the celiac artery (arrowhead). Note the nodularity of the left crus, a normal variant of the diaphragm’s shape. (Right panel) With coronal imaging, the thickness of the crural hemidiaphragms (arrows) can be measured at level of the first lumbar vertebra
Fig. 11 Computed tomography measurements of diaphragm volume in a critically ill, septic patient on admission to the intensive care unit (left panel) and ten days later (right panel). Sepsis was associated with a decrease in diaphragm volume. The images were provided, with permission, by Drs. Boris Jung, Stephanie Nougaret and Samir Jaber, University Hospital of Montpellier, France

Page 11 of 29Laghi Jr. et al. BMC Pulm Med (2021) 21:85
administration of theophylline in 26 out of 30 patients with COPD [73]. The mean increase in diaphragm excur-sion was 8.73 ± 1.17 (S.D.) mm. Lack of blinding and a lack of a control group limit the internal validity of this study.
In summary, of the above dynamic imaging techniques, fluoroscopy is the traditional (and more widely available) technique used in the evaluation of suspected unilat-eral diaphragm weakness, but it is not a specific test and results of the test can often confound the diagnostic pro-cess [69]. Dynamic MRI is not widely available, but this technique has great potential in that it can image, in real time, the coordinated movement of the lungs, muscles and adjacent structures throughout the respiratory cycle [71] and help elucidate the role of the diaphragm in pul-monary disease states [72].
Clinical applicationsDiaphragm dysfunction can present as weakness, paraly-sis and eventration [8, 74]; imaging modalities can aid in the assessment of these clinical conditions.
Ultrasound imaging in the identification of diaphragm weakness and paralysisDiaphragm ultrasound of patients with diaphragm weak-ness and paralysis can demonstrate abnormalities of thickness, thickening and motion.
Ultrasound: diaphragm thickness Ultrasound measure-ments of diaphragm thickness have been used to identify diaphragm atrophy in patients with neuromuscular disorders [32, 75] and in mechanically ventilated patients [21, 76–78].
In seven patients with unilateral diaphragm paralysis, Gottesman and McCool [32] found that the paralyzed hemidiaphragm was thinner than the healthy hemidi-aphragm, l.7 ± 0.2 and 2.7 ± 0.5 (S.D.) mm, respectively. A resting thickness at FRC of less than 2 mm combined with less than 20% increase in thickness on inhalation from FRC to TLC, discriminated between a paralyzed and normal diaphragm (Fig. 14). Of note, some healthy subjects may have a thickness ratio close to 20%; in such individuals, the diagnosis of paralysis would remain uncertain [44].
Noda et al. [75] assessed diaphragm thickness in 37 patients with a variety of neuromuscular disorders. Com-pared with diaphragm thickness of 1.68 (range 1.29–2.40) mm in 10 healthy subjects, diaphragm thickness in 16 patients with ALS was 1.08 (range 0.67–1.61) mm, in 11
Fig. 12 Magnetic resonance images of the diaphragm and rib cage in the sagittal view. Images were obtained at (a) total lung capacity, (b) functional residual capacity, and (c) residual volume, 7 cm to the left of the midline. At total lung capacity (a) the anterior insertion of the diaphragm onto chest wall (left white arrowhead) is in close proximity to the lower anterior ribs (black arrows) indicating that the zone of apposition is close to zero. Posteriorly, the diaphragm is positioned nearly at the level of the posterior insertion point at the twelfth rib (right white arrowhead). As the diaphragm moves to functional residual capacity (b) and residual volume (c) the zone of apposition increases indicated by the cranial movement of the upper limits of the zone of apposition (right and left thin white arrowheads). Reproduced with permission from Radiologic Society of North America: Cluzel et al. Radiology 2000;215(2):574–83
Page 12 of 29Laghi Jr. et al. BMC Pulm Med (2021) 21:85
patients with myopathies it was 1.12 (0.55–1.54) mm, and in 10 patients with neuropathies it was 1.41 (0.98–2.03) mm. Twenty-three patients (62.2%) had values below the lowest value in the control group. It is not clear if the investigators standardized the intercostal space where the thickness of the diaphragm was measured.
Grosu et al. [76] were the first to prospectively meas-ure diaphragm thickness using ultrasound imaging dur-ing invasive ventilation. Diaphragm thickness decreased at an average rate of 6% per day suggesting development and a rapid progression of diaphragm atrophy. These results [76] have been extended by Zambon et al. [24] who measured diaphragm thickness daily, from the first day of mechanical ventilation until ICU discharge in 40 patients on various levels of ventilator support. The mean daily decrease in diaphragm thickness seemingly was
more pronounced with increasing levels of ventilatory support. These results must be interpreted with great caution as the level of ventilator support was only mar-ginally correlated with daily rate of diaphragm atrophy (r2 = 0.14, p = 0.006).
When examining the daily change in diaphragm thick-ness of individual patients in the study of Zambon et al. [24], it is apparent that some patients experienced a decrease in diaphragm thickness while others experi-enced no change or even an increase in thickness. Similar results have been reported by Schepens et al. [77] in 54 ventilated patients (Fig. 15). Compared to baseline, the last recorded value of thickness before extubation, tra-cheotomy or death had decreased in 40 (77%) patients, it was unchanged in ten (19%) patients and it had increased in two (4%) patients. It is unknown whether the latter
Fig. 13 Magnetic resonance images at maximum inhalation and maximum exhalation during 12-s inspiratory breath-hold (left panels) and 12-s expiratory breath hold in a healthy volunteer (upper panels) and in a patient with Pompe disease (lower panels). In the patient with Pompe disease, if there is any displacement of the diaphragm at all, is difficult to appreciate Reproduced with permission from Springer Nature: Wens et al. BMC Pulm 2015;15:54

Page 13 of 29Laghi Jr. et al. BMC Pulm Med (2021) 21:85
finding is a surrogate marker of load-induced muscle swelling [79] or of ineffective compensatory myofiber hypertrophy [80, 81].
Variability in the change of diaphragm thickness was reported also in a study of more than 200 ventilated patients cared for in three Canadian ICUs [21]. Forty percent of patients developed a decrease in diaphragm thickness by day 4 of ventilation. This decrease was asso-ciated with a lower probability of weaning success and increased risk of complications (reintubation, tracheos-tomy, prolonged ventilation). A quarter of the patients exhibited an increase in diaphragm thickness over the first several days of ventilation. These patients were also less successful in weaning and had an increased risk of reintubation. The remaining 35% of patients experienced less than 10% change in diaphragm thickness. This last group had a greater probability of weaning success and fewer complications than the other two groups. The risk of death was similar in the three groups of patients. The investigators concluded that development of either pro-gressive decrease or progressive increase in diaphragm thickness during the early course of mechanical venti-lation increases the risk of complications and predicts prolonged ventilation. The latter conclusion, however, should be interpreted with caution as the weaning strat-egy and use of rescue noninvasive ventilation after extu-bation in the ICUs were not standardized. The study [21] also underscores a potential limitation of cross-sec-tional investigations of diaphragm thickness in critically ill patients. Moreover, it seriously puts into question the existence of a linear relationship between diaphragm
Fig. 14 Values of diaphragm thickness at resting functional residual capacity (FRC) and percentage increase in thickness on inhaling from FRC to total lung capacity (TLC) in 5 patients with bilateral diaphragm paralysis, in 7 patients with unilateral diaphragm paralysis, 3 patients with normal function, and 15 healthy volunteers. A paralyzed diaphragm (solid symbols) could be distinguished from a functioning diaphragm (open symbols) by a resting thickness of less than 2 mm and a less than 20% increase in thickening on inhaling to TLC. Reproduced with permission from The American Thoracic Society: Gottesman et al. Am J Respir Crit Care Med 1997;155(5):1570–4
Fig. 15 Ultrasound measurements of diaphragm thickness in critically ill patients requiring mechanical ventilation. Raw values of diaphragm thickness for each day of mechanical ventilation. Lines use a Bézier curve construction (see text for details). Reproduced under Open Access Creative Commons License: Schepens et al. Crit Care 2015;19(1):422
Page 14 of 29Laghi Jr. et al. BMC Pulm Med (2021) 21:85
thickness and the number (and function) of diaphragm contractile elements in these patients [82, 83]. The absence of such a relationship and, thus, the absent rela-tionship between diaphragm thickness and clinical out-comes, is supported by the data of Dubé et al. [78], Vivier et al. [84], and Grosu et al. [85]. In the first study [78], investigators reported no correlation between PawTw elicited by magnetic stimulation of the phrenic nerves and diaphragm thickness in 99 intubated patients recov-ering from respiratory failure. In the second study [84], investigators reported no association between diaphragm atrophy and clinical outcomes in 35 patients receiving mechanical ventilation. In the third study [85], investiga-tors reported that among 57 patients receiving mechani-cal ventilation, paradoxically, the thinner the diaphragm at baseline and the greater the extent of diaphragm thin-ning at 72 h of mechanical ventilation, the greater the likelihood of successful extubation.
Ultrasound: diaphragm thickening Measurements diaphragm thickening as a surrogate measurement of the intensity of voluntary diaphragm contraction has been used in patients with phrenic neuropathy and in critically ill patients. Summerhill et al. [86] measured
diaphragm thickening in 16 patients with phrenic neu-ropathy and followed them for up to 60 months, and concluded that ultrasound may be useful for assessing functional recovery from diaphragm weakness.
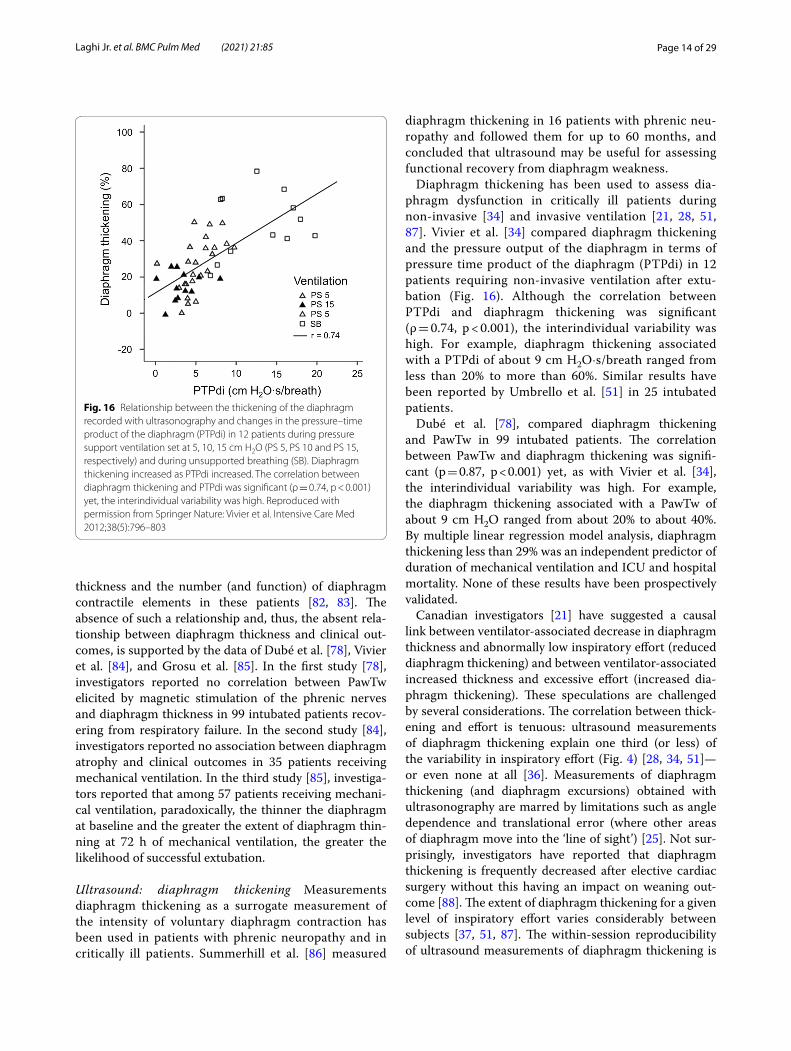
Diaphragm thickening has been used to assess dia-phragm dysfunction in critically ill patients during non-invasive [34] and invasive ventilation [21, 28, 51, 87]. Vivier et al. [34] compared diaphragm thickening and the pressure output of the diaphragm in terms of pressure time product of the diaphragm (PTPdi) in 12 patients requiring non-invasive ventilation after extu-bation (Fig. 16). Although the correlation between PTPdi and diaphragm thickening was significant (ρ = 0.74, p < 0.001), the interindividual variability was high. For example, diaphragm thickening associated with a PTPdi of about 9 cm H2O·s/breath ranged from less than 20% to more than 60%. Similar results have been reported by Umbrello et al. [51] in 25 intubated patients.
Dubé et al. [78], compared diaphragm thickening and PawTw in 99 intubated patients. The correlation between PawTw and diaphragm thickening was signifi-cant (p = 0.87, p < 0.001) yet, as with Vivier et al. [34], the interindividual variability was high. For example, the diaphragm thickening associated with a PawTw of about 9 cm H2O ranged from about 20% to about 40%. By multiple linear regression model analysis, diaphragm thickening less than 29% was an independent predictor of duration of mechanical ventilation and ICU and hospital mortality. None of these results have been prospectively validated.
Canadian investigators [21] have suggested a causal link between ventilator-associated decrease in diaphragm thickness and abnormally low inspiratory effort (reduced diaphragm thickening) and between ventilator-associated increased thickness and excessive effort (increased dia-phragm thickening). These speculations are challenged by several considerations. The correlation between thick-ening and effort is tenuous: ultrasound measurements of diaphragm thickening explain one third (or less) of the variability in inspiratory effort (Fig. 4) [28, 34, 51]—or even none at all [36]. Measurements of diaphragm thickening (and diaphragm excursions) obtained with ultrasonography are marred by limitations such as angle dependence and translational error (where other areas of diaphragm move into the ‘line of sight’) [25]. Not sur-prisingly, investigators have reported that diaphragm thickening is frequently decreased after elective cardiac surgery without this having an impact on weaning out-come [88]. The extent of diaphragm thickening for a given level of inspiratory effort varies considerably between subjects [37, 51, 87]. The within-session reproducibility of ultrasound measurements of diaphragm thickening is
Fig. 16 Relationship between the thickening of the diaphragm recorded with ultrasonography and changes in the pressure–time product of the diaphragm (PTPdi) in 12 patients during pressure support ventilation set at 5, 10, 15 cm H2O (PS 5, PS 10 and PS 15, respectively) and during unsupported breathing (SB). Diaphragm thickening increased as PTPdi increased. The correlation between diaphragm thickening and PTPdi was significant (ρ = 0.74, p < 0.001) yet, the interindividual variability was high. Reproduced with permission from Springer Nature: Vivier et al. Intensive Care Med 2012;38(5):796–803

Page 15 of 29Laghi Jr. et al. BMC Pulm Med (2021) 21:85
weak [28]. Finally, in the Canadian study [21], ultrasound recordings of diaphragm thickening where obtained over a limited period of time once a day, five days a week. This limits the generalizability of the study considering that during mechanical ventilation patient-ventilator interac-tion is not uniform over time [89].
DiNino et al. [90] prospectively assessed the value of diaphragm thickening during tidal breathing to predict extubation success in 63 ventilated patients. The com-bined sensitivity and specificity of a diaphragm thick-ening value ≥ 30% for extubation success was 88% and 71%, respectively. The area under the receiver operat-ing characteristic curve was 0.79. Similar results have been obtained by Ferrari et al. [87] (diaphragm thicken-ing > 36% was associated with extubation success) and Pirompanich and Romsaiyut [91] (diaphragm thicken-ing > 26% was associated with extubation success). None of these thresholds has been prospectively validated. In a recent multicenter trial, the proportion of patients with
diaphragm dysfunction was similar between extubation successes and extubation failures: 71% vs. 68% (p = 0.73) (Fig. 17) [92]. The investigators concluded that dia-phragm dysfunction assessed by ultrasound is not associ-ated with an increased risk of extubation failure.
Ultrasound: diaphragm excursions Ultrasound meas-urements of diaphragm excursions have been used to assess diaphragm function in patients with a variety of neuromuscular disorders [44, 46, 93, 94], after surgery [47, 95], and in critically ill patients requiring mechanical ventilation [48, 51, 78].
In 45 patients, most of whom had amyotrophic lat-eral sclerosis or myotonic dystrophy, Carrié et al. [94] reported that the relationship between excursions of the right hemidiaphragm during deep breathing and percent predicted FVC was weak: r2 = 0.52 (p < 0.0001). Mecha-nisms responsible for these disappointing results include abnormal respiratory mechanics, variable recruitment of
Fig. 17 Right and left hemidiaphragm excursion and thickening in more than 150 patients who succeeded or failed extubation from mechanical ventilation. Excursion (upper panels) of the right (a) and left (b) hemidiaphragms. There was no difference in hemidiaphragm excursions between patients whose extubation succeeded and those whose extubation failed. Negative values reflect paradoxical movements (passive ascent) associated with complete hemidiaphragm paralysis. Thickening fraction (lower panels) of the right (c) and left (d) hemidiaphragms. There was no difference in hemidiaphragm diaphragm thickening between patients whose extubation succeeded and those whose extubation failed. Negative values reflect paradoxical movements (passive thinning) associated with complete hemidiaphragm paralysis. Hemidiaphragm excursions and thickening are presented by a box plot representation with median, 25th and 75th percentiles, and adjacent values. Reproduced with permission from Elsevier: Vivier et al. Chest 2019;155(6):1131–9

Page 16 of 29Laghi Jr. et al. BMC Pulm Med (2021) 21:85
the hemidiaphragm and of the rib cage and accessory res-piratory muscles.
Boussuges et al. [44] recorded diaphragm motion in 26 patients with known hemidiaphragm paralysis. During quiet breathing the paralyzed hemidiaphragm had either no detectable motion or a weak paradoxical (cranial) dis-placement (less than 0.5 cm). During sniffing and deep breathing, a paradoxical motion of the paralyzed hemidi-aphragm of approximately 10 mm or more was recorded in all patients (Fig. 18). Excursions of the non-paralyzed hemidiaphragm, during quiet breathing and voluntary sniffing, but not during deep breathing, were greater in patients than in healthy controls. Despite the encourag-ing results, a major limitation of the study acknowledged by the investigators, is that the study was not designed to detect diaphragm paralysis but to describe the ultra-sonographic characteristics in patients with known dia-phragm paralysis.
Fayssoil et al. [96] built upon the results of Boussuges et al. [44] by recording diaphragm sniff ultrasound in 89 patients with a variety of neuromuscular disorders. Sniff diaphragm motion was associated with sniff nasal pres-sure with a correlation coefficient (r) ranging from 0.60 to 0.63 that would correspond to a coefficient of deter-mination (r2) of only about 0.30—i.e., sniff diaphragm motion would explain about 30% of the variance in sniff nasal pressure. Fayssoil et al. [96] measured the peak sniff inspiratory velocity (cm/s) using diaphragm tissue Dop-pler imaging (Fig. 19); correlation coefficient between sniff nasal pressure and peak sniff inspiratory velocity
remained poor. The investigators recognize the technical difficulties in using diaphragm tissue Doppler imaging.
In intubated patients, diaphragm excursions are not related to the muscle’s pressure output recorded during voluntary contractions (PTPdi) [51], and only marginally related to the muscle’s pressure output elicited by phrenic nerve stimulation (PawTw) [78]. Despite these negative results, Lerolle et al. [47] assessed whether diaphragm excursions during deep breathing could be used to diag-nose severe diaphragm dysfunction in 28 patients requir-ing mechanical ventilation for more than 7 days after cardiac surgery. Diaphragm excursions during a trial of unsupported breathing (T-tube trial), were smaller in patients with severe diaphragm dysfunction than in those without it: mean (IQR) excursion of 19 (7) mm and 30 (10) mm, respectively (p = 0.001). These results have not been prospectively validated.
Non‑ultrasound imaging in the identification of dia‑phragm weakness and paralysis Plain chest radio-graphs and CT imaging generate still images of the diaphragm and, thus, they provide information about shape and position of the muscle (Fig. 20). They can-not provide direct information on diaphragm move-ment and diaphragm function. Indeed, using plain chest radiographs, the correct identification of patients with unilateral diaphragm paralysis (sensitivity) is as low as 66.6% [97] and the correct identification of patients without unilateral diaphragm paralysis (specificity) is only 44% [52]. Elevation of both hemidiaphragms, along
Fig. 18 M-mode ultrasonography in a representative patient with hemidiaphragm paralysis recorded during a sniff (left panel) and during deep breathing (right panel). During a sniff (left panel), the paralyzed hemidiaphragm show a paradoxical motion (arrow). During deep breathing (right panel), the hemidiaphragm displays a biphasic movement characterized by an initial paradoxical movement (left arrow) and a terminal caudal displacement (right arrow). (Reproduced with permission from John Wiley and Sons: Boussuges et al. Clin Physiol Funct Imaging 2019;39(2):143–9)
Page 17 of 29Laghi Jr. et al. BMC Pulm Med (2021) 21:85
with small pulmonary volumes and bibasilar atelectasis, can be seen in patients with bilateral diaphragm paraly-sis. These findings, however, are not necessarily a sign of weakness or paralysis. Absence of diaphragm elevation makes diaphragm weakness or paralysis unlikely [52].
Fluoroscopy during a sniff provides two-dimensional information of the movement of (mainly) the central tendon of the diaphragm. Unfortunately, as already dis-cussed, fluoroscopy can give misleading results particu-larly when assessing patients with hemidiaphragm paresis
or bilateral paralysis [69]. Finally, the test is marred by the need for radiation exposure.
In one retrospective study of 72 patients with CT scans, Sukkasem et al. [56] reported that the crura of a para-lyzed hemidiaphragm is, on average, 2 mm thinner than the crura of the contralateral healthy hemidiaphragm (Fig. 21). The study, however, has several limitations. The diagnosis of hemidiaphragm paralysis was based on fluoroscopy. All measurements were performed by one observer. The slice thickness of the CT was variable (range: 0.625 to 5 mm). In spite of these limitations, CT
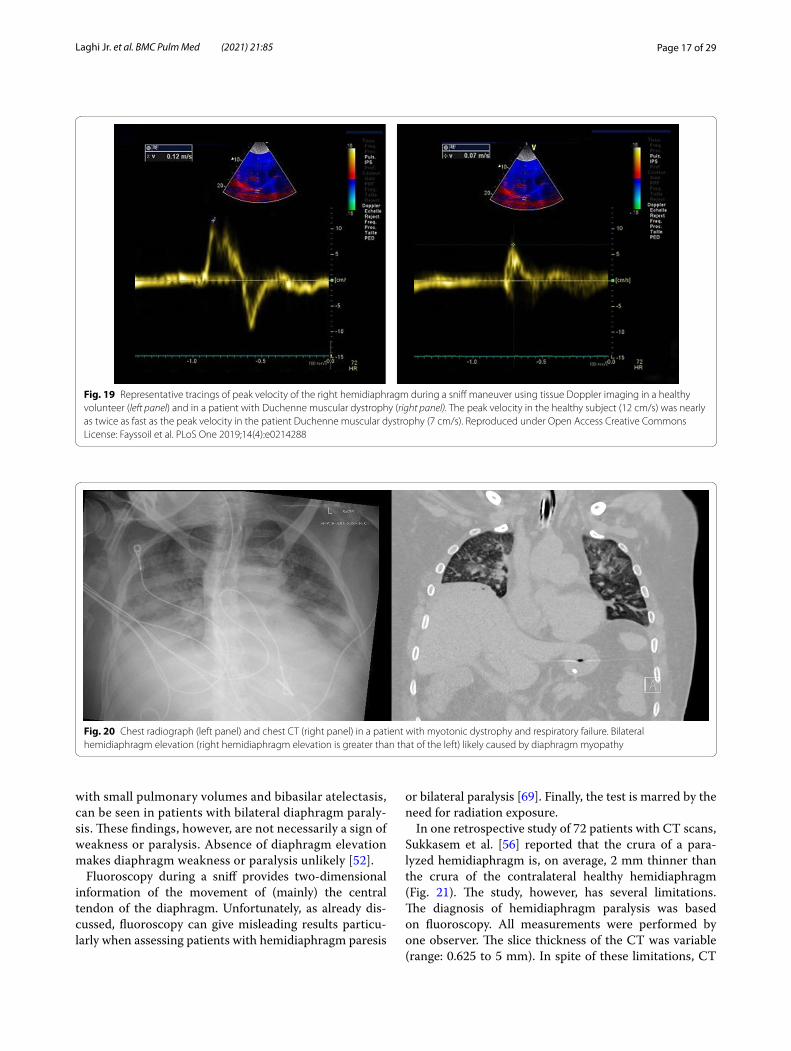
Fig. 19 Representative tracings of peak velocity of the right hemidiaphragm during a sniff maneuver using tissue Doppler imaging in a healthy volunteer (left panel) and in a patient with Duchenne muscular dystrophy (right panel). The peak velocity in the healthy subject (12 cm/s) was nearly as twice as fast as the peak velocity in the patient Duchenne muscular dystrophy (7 cm/s). Reproduced under Open Access Creative Commons License: Fayssoil et al. PLoS One 2019;14(4):e0214288
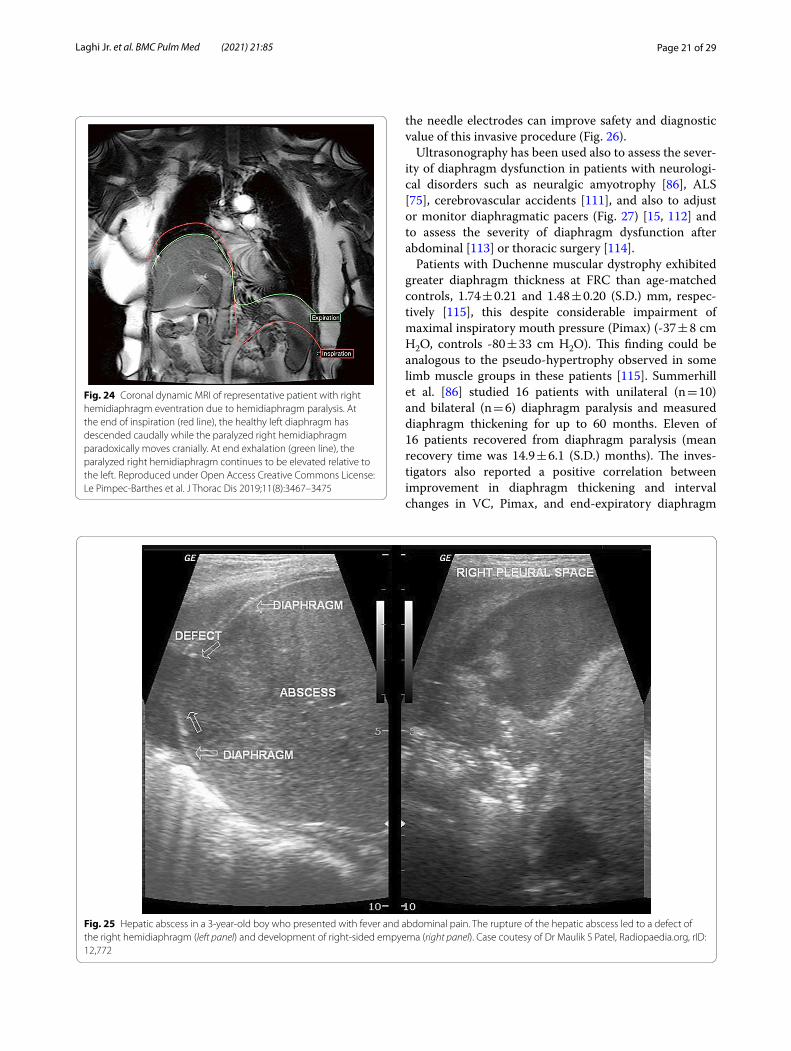
Fig. 20 Chest radiograph (left panel) and chest CT (right panel) in a patient with myotonic dystrophy and respiratory failure. Bilateral hemidiaphragm elevation (right hemidiaphragm elevation is greater than that of the left) likely caused by diaphragm myopathy

Page 18 of 29Laghi Jr. et al. BMC Pulm Med (2021) 21:85
imaging of the diaphragm, remains more objective and simpler to interpret than a fluoroscopic sniff test or ultra-sound studies [56].
In contrast to fluoroscopy and CT, dynamic MRI has the advantage of allowing to study of the motion of seg-ments of the diaphragm in multiple planes [74] (Addi-tional file 8). This technique has been used to assess diaphragmatic dysfunction and response to therapy in
patients with late-onset Pompe disease, polymyositis, and myasthenia gravis and surgical plication [6, 16, 66]. Whether dynamic MRI of the diaphragm is superior to ultrasound imaging in making a diagnosis of diaphragm weakness or paralysis remains to be determined.
Fig. 21 Progressive hemidiaphragm thinning after double lung transplantation for COPD. Axial (a–c) and coronal (d–f) CT images pre-transplantation (left panels), 1 month after transplantation (middle panels) and 11 months after lung transplantation (right panels). The pre-transplantation images demonstrate equal crural diaphragm thickness; the left hemidiaphragm (white arrow) becomes progressively thinner and moves cranially after transplantation. These findings are indicative of post-operative left hemidiaphragm paralysis. Reproduced with permission from Wolters Kluwer Health: Sukkasem et al. Journal of Thoracic Imaging 2017;32(6): 383–390

Page 19 of 29Laghi Jr. et al. BMC Pulm Med (2021) 21:85
Identification of diaphragm eventrationDiaphragm eventration is an abnormal elevation of the diaphragm that retains normal attachments to the ster-num, ribs and dorsolumbar spine [74]. In contrast to diaphragmatic hernias, in which there is a defect of the muscle through which the abdominal viscera may migrate into the chest, in diaphragm eventration, the continuity of diaphragm remains intact. With eventra-tion, the diaphragm exhibits incomplete muscularization with a membranous sheet replacing normal muscle fib-ers. With diaphragmatic paralysis, muscle fibers—albeit atrophic—are still present [98]. Diaphragm eventration can be congenital or acquired [6]. In patients with con-genital eventration, a portion of the hemidiaphragm,
typically the anteromedial portion of the right hemidi-aphragm, is elevated while the remaining portion is of normal height [8]. Acquired eventration is most often caused by phrenic nerve injury, and it usually involves the entirety of the hemidiaphragm (usually the left one) [6].
Karmazyn et al. [99] reported on 17 infants who had undergone diaphragm ultrasound before surgery for eventration (n = 8) or hernia (n = 9) (Fig. 22). The sensitivity and specificity of diaphragm ultrasound to diagnose hernia was 100% and 62.5%, respectively. Dif-ferentiation between eventration and hernia was not possible in about a third of infants. In adults, the use of diaphragm ultrasonography to assess for diaphragm eventration has not been validated [6, 100].
Fig. 22 Chest radiographs and ultrasound images in representative patients with diaphragmatic hernia (upper panels) and diaphragmatic eventration (lower panels). (Upper panels) A 5-month-old boy, with right Bochdalek hernia. Anteroposterior and lateral chest radiographs demonstrate what would appear as global elevation of the right hemidiaphragm (a, b). Lateral long-view ultrasound (c) demonstrates the normal anterior hypoechogenic muscle (arrowheads), the folding free edge of the diaphragm at a narrow angle waist (arrow), and the herniated liver through the diaphragmatic defect (H). (Lower panels) A 9-month-old boy, with right diaphragmatic eventration. Anteroposterior and lateral chest radiographs demonstrate global elevation of the right hemidiaphragm (a, b). Long-view ultrasound (c) demonstrates posterior elevation of the diaphragm with a wide-angle waist. The normal anterior hypoechogenic diaphragm (arrowheads) with focal thickening of the muscle (arrow) covering the entire waist. Reproduced with permission from Springer Nature: Karmazyn et al. Pediatr Radiol 2019;49(8):1010–7

Page 20 of 29Laghi Jr. et al. BMC Pulm Med (2021) 21:85
On chest radiographs, hemidiaphragm elevation can be a sign of diaphragmatic eventration, however, it is a nonspecific finding as the same may occur with dia-phragm paralysis and with processes affecting the lung parenchyma (atelectasis, fibrosis), the pleural (pleural effusions, masses), and with subdiaphragmatic processes (hepatomegaly, splenomegaly, gastric dilatation, and sub-phrenic abscesses). The role of fluoroscopy in establishing a diagnosis of diaphragm eventration remains controver-sial [74] (Additional file 9). On CT, the affected portion of the diaphragm can have undercut edges or a ‘mushroom’ appearance (Fig. 23). MRI has also been used to charac-terize the extent of diaphragm eventration [6] (Fig. 24).
Etiology and prognosis of diaphragm dysfunctionRespiratory muscle dysfunction may be a clinical concern in critically ill patients who are difficult to wean from mechanical ventilation [101–103]. Diaphragm ultra-sound is an increasingly available, noninvasive imaging modality familiar to most intensivists. Diaphragm ultra-sound measurements, however, must be interpreted with
extreme caution [104]. Use of diaphragm ultrasound to predict weaning outcome has yielded inconsistent results [35, 87, 91, 92, 105]. Most mechanically ventilated patients diagnosed with diaphragm dysfunction are suc-cessfully extubated [106–108]. To date, diaphragm ultra-sound parameters cannot supplant standard weaning indices or clinical judgement [104].
Ultrasound imaging can assist in identifying patho-logical processes extrinsic to the diaphragm such as pleural fluid, subphrenic and hepatic abscesses, and thoracic masses [15, 109], and processes intrinsic to the diaphragm such as eventration, hernias and rupture (Fig. 25). Unfortunately, the specificity of the “focused assessment with sonography for trauma” (FAST) to diag-nose diaphragm rupture is only 50% [110].
Occasionally, patients suspected of having diaphragm dysfunction require electromyographic examination of the diaphragm to distinguish between upper and lower motor neuron disease using needle electrodes [1, 15]. Ultrasound imaging of the diaphragm while inserting
Fig. 23 Bilateral hemidiaphragm eventration. Posteroanterior (a) and lateral (b) radiographs demonstrate focal elevation of the right and left hemidiaphragms (white arrows). Axial (c) CT image shows the mushroom appearance of the right and left hemidiaphragms with undercut edges (white arrows). On the right, a portion of the liver occupies the eventration herniation. Eventration (d) on pathology photograph showing the medial aspect (white arrow) of the muscle band and the groove on the liver created by the diaphragm (black arrow). Reproduced with permission from Radiologic Society of North America: Nason et al. Radiographics 2012;32(2):E51–E70
Page 21 of 29Laghi Jr. et al. BMC Pulm Med (2021) 21:85
the needle electrodes can improve safety and diagnostic value of this invasive procedure (Fig. 26).
Ultrasonography has been used also to assess the sever-ity of diaphragm dysfunction in patients with neurologi-cal disorders such as neuralgic amyotrophy [86], ALS [75], cerebrovascular accidents [111], and also to adjust or monitor diaphragmatic pacers (Fig. 27) [15, 112] and to assess the severity of diaphragm dysfunction after abdominal [113] or thoracic surgery [114].
Patients with Duchenne muscular dystrophy exhibited greater diaphragm thickness at FRC than age-matched controls, 1.74 ± 0.21 and 1.48 ± 0.20 (S.D.) mm, respec-tively [115], this despite considerable impairment of maximal inspiratory mouth pressure (Pimax) (-37 ± 8 cm H2O, controls -80 ± 33 cm H2O). This finding could be analogous to the pseudo-hypertrophy observed in some limb muscle groups in these patients [115]. Summerhill et al. [86] studied 16 patients with unilateral (n = 10) and bilateral (n = 6) diaphragm paralysis and measured diaphragm thickening for up to 60 months. Eleven of 16 patients recovered from diaphragm paralysis (mean recovery time was 14.9 ± 6.1 (S.D.) months). The inves-tigators also reported a positive correlation between improvement in diaphragm thickening and interval changes in VC, Pimax, and end-expiratory diaphragm
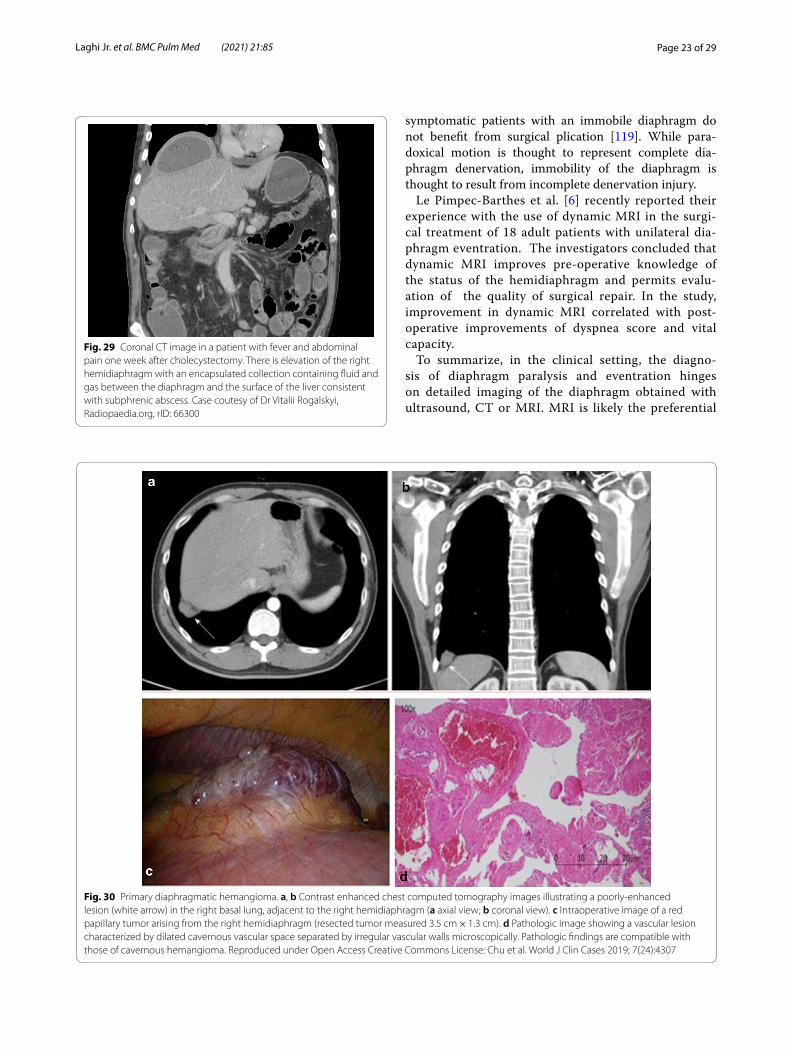
Fig. 24 Coronal dynamic MRI of representative patient with right hemidiaphragm eventration due to hemidiaphragm paralysis. At the end of inspiration (red line), the healthy left diaphragm has descended caudally while the paralyzed right hemidiaphragm paradoxically moves cranially. At end exhalation (green line), the paralyzed right hemidiaphragm continues to be elevated relative to the left. Reproduced under Open Access Creative Commons License: Le Pimpec-Barthes et al. J Thorac Dis 2019;11(8):3467–3475
Fig. 25 Hepatic abscess in a 3-year-old boy who presented with fever and abdominal pain. The rupture of the hepatic abscess led to a defect of the right hemidiaphragm (left panel) and development of right-sided empyema (right panel). Case coutesy of Dr Maulik S Patel, Radiopaedia.org, rID: 12,772

Page 22 of 29Laghi Jr. et al. BMC Pulm Med (2021) 21:85
thickness. These results suggest that ultrasonography may be used to assess functional recovery from dia-phragm weakness and diaphragm paralysis.
Pathologic lesions and diaphragm dysfunctionPlain chest radiographs can occasionally be helpful in identifying the etiology of diaphragm dysfunction such as in patients with neoplastic processes in the mediastinum causing phrenic nerve damage (Fig. 28). To assess for subdiaphragm pathology contributing to diaphragmatic dysfunction, CT imaging is a useful tool. Subdiaphrag-matic abscess or mass, pancreatitis, ascites, organo-megaly or ileus can all affect diaphragm function [1, 116]
(Figs. 29, 30). CT may be useful in the identification of contributory pulmonary pathology, such as obstructive lung disease, subpulmonic effusion or pleural thickening [8]. Similar considerations apply to MRI and ultrasound (Fig. 25).
Selection of patients for surgical plicationPatients with hemidiaphragm paralysis and eventration who complain of dyspnea [6] and demonstrate hemidi-aphragm paradoxical motion and mediastinal shifts may benefit from surgical plication [117, 118]. In contrast,
Fig. 26 Ultrasound guidance for needle electromyography. (Left panel, a) Setup for real‐time ultrasound imaging of the diaphragm during placement of a needle electrode. (Right panel, b) Needle electrode penetrating the zone of apposition of the diaphragm. Reproduced with permission from John Wiley and Sons: Sarwal et al. Muscle Nerve 2013;47(3):319–29
Fig. 27 Paralyzed left hemidiaphragm with implanted electronic pacer. M-mode imaging shows diaphragm motion in response to the pacer triggering. Reproduced under Open Access Creative Commons License: Gerscovich et al. J Ultrasound Med 2001;20(6):597–604
Fig. 28 Right hemidiaphragm paralysis due to phrenic nerve invasion by apical pulmonary metastasis from colorectal carcinoma. Coronal CT image shows right apical mass (star) and right hemidiaphragm elevation. Case coutesy of Assoc Prof Frank Gaillard, Radiopaedia.org, rID: 8543
Page 23 of 29Laghi Jr. et al. BMC Pulm Med (2021) 21:85
symptomatic patients with an immobile diaphragm do not benefit from surgical plication [119]. While para-doxical motion is thought to represent complete dia-phragm denervation, immobility of the diaphragm is thought to result from incomplete denervation injury.
Le Pimpec-Barthes et al. [6] recently reported their experience with the use of dynamic MRI in the surgi-cal treatment of 18 adult patients with unilateral dia-phragm eventration. The investigators concluded that dynamic MRI improves pre-operative knowledge of the status of the hemidiaphragm and permits evalu-ation of the quality of surgical repair. In the study, improvement in dynamic MRI correlated with post-operative improvements of dyspnea score and vital capacity.
To summarize, in the clinical setting, the diagno-sis of diaphragm paralysis and eventration hinges on detailed imaging of the diaphragm obtained with ultrasound, CT or MRI. MRI is likely the preferential
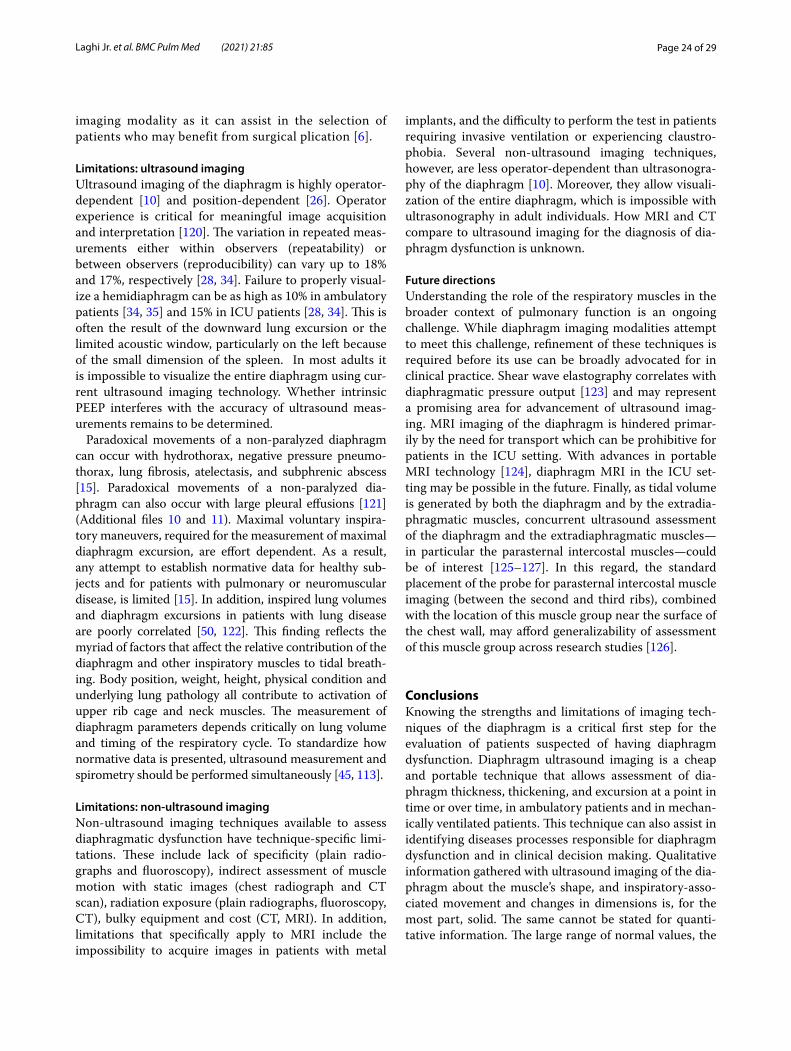
Fig. 29 Coronal CT image in a patient with fever and abdominal pain one week after cholecystectomy. There is elevation of the right hemidiaphragm with an encapsulated collection containing fluid and gas between the diaphragm and the surface of the liver consistent with subphrenic abscess. Case coutesy of Dr Vitalii Rogalskyi, Radiopaedia.org, rID: 66300
Fig. 30 Primary diaphragmatic hemangioma. a, b Contrast enhanced chest computed tomography images illustrating a poorly-enhanced lesion (white arrow) in the right basal lung, adjacent to the right hemidiaphragm (a axial view; b coronal view). c Intraoperative image of a red papillary tumor arising from the right hemidiaphragm (resected tumor measured 3.5 cm × 1.3 cm). d Pathologic image showing a vascular lesion characterized by dilated cavernous vascular space separated by irregular vascular walls microscopically. Pathologic findings are compatible with those of cavernous hemangioma. Reproduced under Open Access Creative Commons License: Chu et al. World J Clin Cases 2019; 7(24):4307
Page 24 of 29Laghi Jr. et al. BMC Pulm Med (2021) 21:85
imaging modality as it can assist in the selection of patients who may benefit from surgical plication [6].
Limitations: ultrasound imagingUltrasound imaging of the diaphragm is highly operator-dependent [10] and position-dependent [26]. Operator experience is critical for meaningful image acquisition and interpretation [120]. The variation in repeated meas-urements either within observers (repeatability) or between observers (reproducibility) can vary up to 18% and 17%, respectively [28, 34]. Failure to properly visual-ize a hemidiaphragm can be as high as 10% in ambulatory patients [34, 35] and 15% in ICU patients [28, 34]. This is often the result of the downward lung excursion or the limited acoustic window, particularly on the left because of the small dimension of the spleen. In most adults it is impossible to visualize the entire diaphragm using cur-rent ultrasound imaging technology. Whether intrinsic PEEP interferes with the accuracy of ultrasound meas-urements remains to be determined.
Paradoxical movements of a non-paralyzed diaphragm can occur with hydrothorax, negative pressure pneumo-thorax, lung fibrosis, atelectasis, and subphrenic abscess [15]. Paradoxical movements of a non-paralyzed dia-phragm can also occur with large pleural effusions [121] (Additional files 10 and 11). Maximal voluntary inspira-tory maneuvers, required for the measurement of maximal diaphragm excursion, are effort dependent. As a result, any attempt to establish normative data for healthy sub-jects and for patients with pulmonary or neuromuscular disease, is limited [15]. In addition, inspired lung volumes and diaphragm excursions in patients with lung disease are poorly correlated [50, 122]. This finding reflects the myriad of factors that affect the relative contribution of the diaphragm and other inspiratory muscles to tidal breath-ing. Body position, weight, height, physical condition and underlying lung pathology all contribute to activation of upper rib cage and neck muscles. The measurement of diaphragm parameters depends critically on lung volume and timing of the respiratory cycle. To standardize how normative data is presented, ultrasound measurement and spirometry should be performed simultaneously [45, 113].
Limitations: non‑ultrasound imagingNon-ultrasound imaging techniques available to assess diaphragmatic dysfunction have technique-specific limi-tations. These include lack of specificity (plain radio-graphs and fluoroscopy), indirect assessment of muscle motion with static images (chest radiograph and CT scan), radiation exposure (plain radiographs, fluoroscopy, CT), bulky equipment and cost (CT, MRI). In addition, limitations that specifically apply to MRI include the impossibility to acquire images in patients with metal
implants, and the difficulty to perform the test in patients requiring invasive ventilation or experiencing claustro-phobia. Several non-ultrasound imaging techniques, however, are less operator-dependent than ultrasonogra-phy of the diaphragm [10]. Moreover, they allow visuali-zation of the entire diaphragm, which is impossible with ultrasonography in adult individuals. How MRI and CT compare to ultrasound imaging for the diagnosis of dia-phragm dysfunction is unknown.
Future directionsUnderstanding the role of the respiratory muscles in the broader context of pulmonary function is an ongoing challenge. While diaphragm imaging modalities attempt to meet this challenge, refinement of these techniques is required before its use can be broadly advocated for in clinical practice. Shear wave elastography correlates with diaphragmatic pressure output [123] and may represent a promising area for advancement of ultrasound imag-ing. MRI imaging of the diaphragm is hindered primar-ily by the need for transport which can be prohibitive for patients in the ICU setting. With advances in portable MRI technology [124], diaphragm MRI in the ICU set-ting may be possible in the future. Finally, as tidal volume is generated by both the diaphragm and by the extradia-phragmatic muscles, concurrent ultrasound assessment of the diaphragm and the extradiaphragmatic muscles—in particular the parasternal intercostal muscles—could be of interest [125–127]. In this regard, the standard placement of the probe for parasternal intercostal muscle imaging (between the second and third ribs), combined with the location of this muscle group near the surface of the chest wall, may afford generalizability of assessment of this muscle group across research studies [126].
ConclusionsKnowing the strengths and limitations of imaging tech-niques of the diaphragm is a critical first step for the evaluation of patients suspected of having diaphragm dysfunction. Diaphragm ultrasound imaging is a cheap and portable technique that allows assessment of dia-phragm thickness, thickening, and excursion at a point in time or over time, in ambulatory patients and in mechan-ically ventilated patients. This technique can also assist in identifying diseases processes responsible for diaphragm dysfunction and in clinical decision making. Qualitative information gathered with ultrasound imaging of the dia-phragm about the muscle’s shape, and inspiratory-asso-ciated movement and changes in dimensions is, for the most part, solid. The same cannot be stated for quanti-tative information. The large range of normal values, the

Page 25 of 29Laghi Jr. et al. BMC Pulm Med (2021) 21:85
operator-dependent nature of image acquisition, and the modest [28] to absent [36] association between ultra-sound imaging and diaphragm force output are some of the factors that mar quantitative analysis of ultrasound imaging of the diaphragm. Non-ultrasound imaging tech-niques can be employed in the evaluation of patients sus-pected of having diaphragmatic dysfunction. CT imaging and static MRI provide important morphological infor-mation about the diaphragm and surrounding struc-tures. Neither, however, offers functional information. The latter can be afforded by conventional fluoroscopy, and more recently, by dynamic MRI. This is an emerging technique that can give information on the contribution of diaphragm dysfunction to pulmonary impairment. The possibility to image the entire thorax and the absence of radiation make dynamic MRI particularly appealing. Despite its limited availability and high cost, dynamic MRI has the potential to be applied in the evaluation patients with neuromuscular diseases [66, 128], and may help in predicting the natural history of respiratory fail-ure in these conditions.
AbbreviationsCT: Computed tomography; MRI: Magnetic resonance imaging; FRC: Func-tional residual capacity; LLN: Lower limit of normal; ICU: Intensive care unit; Paw: Airway pressure; Pdi: Transdiaphragmatic pressure; EAdi: Electrical activity of the diaphragm; SM: Shear modulus; SMdi: Diaphragm’s shear modulus; COPD: Chronic obstructive pulmonary disease; FEV1: Forced expiratory flow in one second; PawTw: Airway twitch pressure; RV: Residual volume; TLC: Total lung capacity; FVC: Forced vital capacity; VC: Vital capacity; PTPdi: Pressure time product of the diaphragm; Pimax: Maximum effort inspiratory mouth pressure.
Supplementary InformationThe online version contains supplementary material available at https ://doi.org/10.1186/s1289 0-021-01441 -6.
Additional file 1. Ultrasound zone of apposition. (Left panel) In brightness-mode (B-mode), the diaphragm appears as a three-layer structure: two echogenic layers of peritoneum and pleura sandwiching a more hypoechoic layer of the muscle itself. Occasionally, an additional bright layer which is due to connective tissue and vessels can be seen within the hypoechoic diaphragm muscle layer. (Right panel) To identify the diaphragm, subjects are asked to inhale. As the lung comes between the transducer and the diaphragm, it creates a hyperechoic bright artifact (“lung curtain sign”) that obliterates the image of the muscle.
Additional file 2. Speckle-tracking analysis of diaphragm contraction. (Left panel) The operator traces the inner surface of the two hyperechogenic lines bordering the diaphragm muscle. The analyzed area during the inspira-tory effort is the central portion of the region depicted in blue (region of interest). The speckle tracking software follows unique groups of grey-scale pixels (known as ‘kernels’) and measures their displacement and how dif-ferent ‘kernels’ move in relation to one another (deformation). (Right panel) During a diaphragmatic contraction the ‘kernels’ come closer together. The degree of this deformation is known as ‘strain’ and negative values indicate ‘kernels’ coming closer together (Reproduced under Open Access Creative Commons License: Orde et al. BMC Anesthesiol 2015;16(1):43).
Additional file 3. Ultrasound shear wave elastography of the diaphragm during inspiratory threshold loading set at 30% of maximal inspiratory
pressure. (Upper panel) Diaphragm shear modulus (SMdi) map in kPa measured using shear wave elastography overlaid with standard B-Mode. As the diaphragm contracts and becomes stiffer, the SMdi increases (from purple becomes green and yellow). (Lower panel) Changes in esophageal (Pes), gastric (Pga), and transdiaphragmatic (Pdi) pressures in real time along with ultrasound imaging (Reproduced with permission from The American Physiological Society: Bachasson et al. J Appl Physiol 2019;126:699–707).
Additional file 4. Ultrasound dome of the diaphragm. (Left panel) Dome of the diaphragm in brightness-mode (B-mode). With this technique, the diaphragm appears as a single thick echogenic line. (Right panel) As the diaphragm contracts, the dome moves towards the ultrasound probe.
Additional file 5. Normal fluoroscopic sniff test. The test was performed in the anterioposterior and lateral projections, showing normal ortho-grade motion of both hemidiaphragms during quiet breathing and upon sniff maneuver. (Reproduced with permission from Radiologic Society of North America: Nason et al. Radiographics 2012;32(2):E51–E70).
Additional file 6. Fluoroscopic sniff test in a patient with right hemidi-aphragm paralysis. Performance of the sniff test in anteroposterior and lateral projections shows paradoxical movements of the right hemidi-aphragm. (Reproduced under Open Access Creative Commons License: Kokatnur et al. Diseases 2018;6(1):16).
Additional file 7. Fluoroscopic sniff test in a patient with bilateral hemidi-aphragm paralysis. During quiet breathing, the test shows no orthograde motion of either hemidiaphragm. On deep breathing, there is paradoxical motion of the right and left hemidiaphragms, which move cranially on inspiration. (Reproduced with permission from Radiologic Society of North America: Nason et al. Radiographics 2012;32(2):E51–E70).
Additional file 8. Magnetic resonance imaging fluoroscopy performed during quiet breathing. The test shows physiologic diaphragm move-ments. (Reproduced with permission from Scientific Scholar: Cicero G et al. J Clin Imaging Sci 2020;10:1.https ://doi.org/10.25259 /JCIS_138_2019).
Additional file 9. Fluoroscopic sniff test; diaphragmatic eventration. The sniff test shows elevation of the anterior aspect of the right hemidi-aphragm. During quiet breathing, the right hemidiaphragm has a reduced orthograde motion; on sniffing, there is minimal focal paradoxical motion, which can be seen on the lateral projection. In contrast, the left hemidi-aphragm moves normally. (Reproduced with permission from Radiologic Society of North America: Nason et al. Radiographics 2012;32(2):E51–E70).
Additional file 10. Pleural effusion and diaphragm paradox. (Left panel) Pre-thoracentesis ultrasound image showing inversion of the left hemidi-aphragm and large amount of pleural fluid. (Right panel) During inhalation the hemidiaphragm is pulled into the chest cavity while the chest wall expands (paradox). (Reproduced with permission from the American Thoracic Society: Smith et al. Ann Am Thorac Soc 2014;11(8):1323–1326).
Additional file 11. Pleural effusion and diaphragm paradox. (Left panel) Post-thoracentesis ultrasound image after draining 900 ml of pleural fluid (same patient as in Video 10). The left hemidiaphragm is convex, and the amount of fluid has decreased. (Right panel) The hemidiaphragm has regained its normal contour and movement. (Reproduced with permis-sion from the American Thoracic Society: Smith et al. Ann Am Thorac Soc 2014; 11(8):1323–1326).
AcknowledgementsNot applicable.
Authors’ contributionsThe authors FAL, MS and HS are accountable for all aspects of the work and were major contributors in writing the manuscript. All authors read and approved the final manuscript.

Page 26 of 29Laghi Jr. et al. BMC Pulm Med (2021) 21:85
FundingNot applicable.
Availability of data and materialsNot applicable.
Declarations
Ethic approval and consent to participateNot applicable.
Consent for publicationNot applicable.
Competing interestsThe authors declare that they have no competing interests.
Author details1 Department of Internal Medicine, Sinai Hospital, 2401 W Belvedere Ave, Baltimore, MD 21215, USA. 2 Department of Biomedical and Clinical Sciences (DIBIC), Division of Pulmonary Diseases, University of Milan, Ospedale L. Sacco, ASST Fatebenfratelli-Sacco, V. G.B. Grassi, 74, 20157 Milan, Italy. 3 Division of Pulmonary and Critical Care Medicine, Hines Veterans Affairs Hospital (111N), 5th Avenue and Roosevelt Road, Hines, IL 60141, USA. 4 Division of Pul-monary and Critical Care Medicine, Loyola University Chicago Stritch School of Medicine, 2160 S 1st Ave, Maywood, IL 60153, USA.
Received: 13 October 2020 Accepted: 19 February 2021
References 1. Laghi F, Tobin MJ. Disorders of the respiratory muscles. Am J Respir Crit
Care Med. 2003;168(1):10–48. 2. Tobin MJ, Laghi F, Jubran A. Ventilatory failure, ventilator support, and
ventilator weaning. Compr Physiol. 2012;2(4):2871–921. 3. McCool FD, Manzoor K, Minami T. Disorders of the diaphragm. Clin
Chest Med. 2018;39(2):345–60. 4. Durand MC, Porcher R, Orlikowski D, Aboab J, Devaux C, Clair B, et al.
Clinical and electrophysiological predictors of respiratory failure in Guillain-Barre syndrome: a prospective study. Lancet Neurol. 2006;5(12):1021–8.
5. Semplicini C, De Antonio M, Taouagh N, Behin A, Bouhour F, Echaniz-Laguna A, et al. Long-term benefit of enzyme replacement therapy with alglucosidase alfa in adults with Pompe disease: prospec-tive analysis from the French Pompe Registry. J Inherit Metab Dis. 2020;43(6):1219–31.
6. Le Pimpec-Barthes F, Hernigou A, Mazzella A, Legras A, Rivera C, Bouacida I, et al. Dynamic magnetic resonance imaging in unilateral diaphragm eventration: knowledge improvement before and after plication. J Thorac Dis. 2019;11(8):3467–75.
7. Abbott RA, Hammans S, Margarson M, Aji BM. Diaphragmatic paralysis and respiratory failure as a complication of Lyme disease. J Neurol Neurosurg Psychiatry. 2005;76(9):1306–7.
8. Nason LK, Walker CM, McNeeley MF, Burivong W, Fligner CL, Godwin JD. Imaging of the diaphragm: anatomy and function. Radiographics. 2012;32(2):E51-70.
9. Tanaka R. Dynamic chest radiography: flat-panel detector (FPD) based functional X-ray imaging. Radiol Phys Technol. 2016;9(2):139–53.
10. Laghi F, Tobin M. Monitoring respiratory muscle function. In: Sheldon M, Malhotra A, editors. Cardiopulmonary monitoring—basic physiology, tools, and bedside management. New York: Springer; 2020.
11. Shaikh H, Laghi F. Role of diaphragm ultrasound when NIV fails in COPD exacerbations. Respir Care. 2019;64:1600–2.
12. Li G, Wei J, Huang H, Gaebler CP, Yuan A, Deasy JO. Automatic assess-ment of average diaphragm motion trajectory from 4DCT images through machine learning. Biomed Phys Eng Express. 2015;1(4):045015.
13. Takazakura R, Takahashi M, Nitta N, Murata K. Diaphragmatic motion in the sitting and supine positions: healthy subject study using a
vertically open magnetic resonance system. J Magn Reson Imaging. 2004;19(5):605–9.
14. Leal BE, Goncalves MA, Lisboa LG, Linne LMS, Tavares MGS, Yamaguti WP, et al. Validity and reliability of fluoroscopy for digital radiography: a new way to evaluate diaphragmatic mobility. BMC Pulm Med. 2017;17(1):62.
15. Sarwal A, Walker FO, Cartwright MS. Neuromuscular ultrasound for evaluation of the diaphragm. Muscle Nerve. 2013;47(3):319–29.
16. Cicero G, Mazziotti S, Blandino A, Granata F, Gaeta M. Magnetic reso-nance imaging of the diaphragm: from normal to pathologic findings. J Clin Imaging Sci. 2020;10(1):1.
17. Cohen WH, editor. Evaluation of the diaphragm by a subcostal B-scan technique. In: UltarsonoGraphia Media1969 1969; Vienna Austria: proceedings of the first world congress on ultrasound diagnostics in medicine and SIDUO III.
18. Wait JL, Nahormek PA, Yost WT, Rochester DP. Diaphragmatic thickness-lung volume relationship in vivo. J Appl Physiol. 1989;67(4):1560–8.
19. Laveneziana P, Albuquerque A, Aliverti A, Babb T, Barreiro E, Dres M, et al. ERS statement on respiratory muscle testing at rest and during exercise. Eur Respir J. 2019;53(6):1801214.
20. Umbrello M, Formenti P. Ultrasonographic assessment of diaphragm function in critically ill subjects. Respir Care. 2016;61(4):542–55.
21. Goligher EC, Dres M, Fan E, Rubenfeld GD, Scales DC, Herridge MS, et al. Mechanical ventilation-induced diaphragm atrophy strongly impacts clinical outcomes. Am J Respir Crit Care Med. 2018;197(2):204–13.
22. Bachasson DDM, Niérat MC, Gennisson JL, Hogrel JY, Doorduin J, Similowski T. Diaphragm shear modulus reflects transdiaphragmatic pressure during isovolumetric inspiratory efforts and ventilation against inspiratory loading. J Appl Physiol. 2019;126:699–707.
23. Sferrazza Papa GF, Pellegrino GM, Di MF, Imeri G, Brochard L, Goligher E, et al. A review of the ultrasound assessment of diaphragmatic function in clinical practice. Respiration. 2016;91(5):403–11.
24. Zambon M, Beccaria P, Matsuno J, Gemma M, Frati E, Colombo S, et al. Mechanical ventilation and diaphragmatic atrophy in critically ill patients: an ultrasound study. Crit Care Med. 2016;44(7):1347–52.
25. Orde SR, Boon AJ, Firth DG, Villarraga HR, Sekiguchi H. Diaphragm assessment by two dimensional speckle tracking imaging in normal subjects. BMC Anesthesiol. 2015;16(1):43.
26. Boon AJ, Harper CJ, Ghahfarokhi LS, Strommen JA, Watson JC, Sorenson EJ. Two-dimensional ultrasound imaging of the diaphragm: quantita-tive values in normal subjects. Muscle Nerve. 2013;47(6):884–9.
27. Ueki J, de Bruin PF, Pride NB. In vivo assessment of diaphragm contrac-tion by ultrasound in normal subjects. Thorax. 1995;50(11):1157–61.
28. Goligher EC, Laghi F, Detsky ME, Farias P, Murray A, Brace D, et al. Meas-uring diaphragm thickness with ultrasound in mechanically ventilated patients: feasibility, reproducibility and validity. Intensive Care Med. 2015;41(4):642–9.
29. Scarlata S, Mancini D, Laudisio A, Raffaele AI. Reproducibility of diaphragmatic thickness measured by M-mode ultrasonography in healthy volunteers. Respir Physiol Neurobiol. 2019;260:58–62.
30. Carrillo-Esper R, Perez-Calatayud AA, Arch-Tirado E, Diaz-Carrillo MA, Garrido-Aguirre E, Tapia-Velazco R, et al. Standardization of sonographic diaphragm thickness evaluations in healthy volunteers. Respir Care. 2016;61(7):920–4.
31. Cardenas LZ, Santana PV, Caruso P, Ribeiro de Carvalho CR, Pereira de Albuquerque AL. Diaphragmatic ultrasound correlates with inspira-tory muscle strength and pulmonary function in healthy subjects. Ultrasound Med Biol. 2018;44(4):786–93.
32. Gottesman E, McCool FD. Ultrasound evaluation of the paralyzed diaphragm. Am J Respir Crit Care Med. 1997;155(5):1570–4.
33. Hellyer NJ, Andreas NM, Bernstetter AS, Cieslak KR, Donahue GF, Steiner EA, et al. Comparison of diaphragm thickness measurements among postures via ultrasound imaging. PM&R. 2017;9(1):21–5.
34. Vivier E, Dessap AM, Dimassi S, Vargas F, Lyazidi A, Thille AW, et al. Dia-phragm ultrasonography to estimate the work of breathing during non-invasive ventilation. Intensive Care Med. 2012;38(5):796–803.
35. Kim WY, Suh HJ, Hong S-B, Koh Y, Lim C-M. Diaphragm dysfunction assessed by ultrasonography: influence on weaning from mechanical ventilation. Crit Care Med. 2011;39(12):2627–30.
36. Oppersma E, Hatam N, Doorduin J, Van Der Hoeven JG, Marx G, Goe-tzenich A, et al. Functional assessment of the diaphragm by speckle

Page 27 of 29Laghi Jr. et al. BMC Pulm Med (2021) 21:85
tracking ultrasound during inspiratory loading. J Appl Physiol. 2017;123(5):1063–70.
37. De Troyer A, Estenne M. Limitations of measurement of transdia-phragmatic pressure in detecting diaphragmatic weakness. Thorax. 1981;36(3):169–74.
38. Huang SJ, Orde S. From speckle tracking echocardiography to tor-sion: research tool today, clinical practice tomorrow. Curr Opin Crit Care. 2013;19(3):250–7.
39. Gennisson J-L, Deffieux T, Fink M, Tanter M. Ultrasound elastography: principles and techniques. Diagn Interv Imaging. 2013;94(5):487–95.
40. Nowicki A, Dobruch-Sobczak K. Introduction to ultrasound elastogra-phy. J Ultrason. 2016;16(65):113–24.
41. Hug F, Tucker K, Gennisson J-L, Tanter M, Nordez A. Elastography for muscle biomechanics: toward the estimation of individual muscle force. Exerc Sport Sci Rev. 2015;43(3):125–33.
42. Chino K, Ohya T, Katayama K, Suzuki Y. Diaphragmatic shear modulus at various submaximal inspiratory mouth pressure levels. Respir Physiol Neurobiol. 2018;252:52–7.
43. Scarlata S, Mancini D, Laudisio A, Benigni A, Antonelli I. Reproducibil-ity and clinical correlates of supine diaphragmatic motion measured by M-mode ultrasonography in healthy volunteers. Respiration. 2018;96(3):259–66.
44. Boussuges A, Brégeon F, Blanc P, Gil JM, Poirette L. Characteristics of the paralysed diaphragm studied by M-mode ultrasonography. Clin Physiol Funct Imaging. 2019;39(2):143–9.
45. Boussuges A, Gole Y, Blanc P. Diaphragmatic motion studied by m-mode ultrasonography: methods, reproducibility, and normal values. Chest. 2009;135(2):391–400.
46. Gerscovich EO, Cronan M, McGahan JP, Jain K, Jones CD, McDonald C. Ultrasonographic evaluation of diaphragmatic motion. J Ultrasound Med. 2001;20(6):597–604.
47. Lerolle N, Guérot E, Dimassi S, Zegdi R, Faisy C, Fagon J-Y, et al. Ultra-sonographic diagnostic criterion for severe diaphragmatic dysfunc-tion after cardiac surgery. Chest. 2009;135(2):401–7.
48. Palkar A, Narasimhan M, Greenberg H, Singh K, Koenig S, Mayo P, et al. Diaphragm excursion-time index: a new parameter using ultrasonography to predict extubation outcome. Chest. 2018;153(5):1213–20.
49. Kantarci F, Mihmanli I, Demirel MK, Harmanci K, Akman C, Aydogan F, et al. Normal diaphragmatic motion and the effects of body compo-sition: determination with M-mode sonography. J Ultrasound Med. 2004;23(2):255–60.
50. Scott S, Fuld JP, Carter R, McEntegart M, MacFarlane NG. Diaphragm ultrasonography as an alternative to whole-body plethysmography in pulmonary function testing. J Ultrasound Med. 2006;25(2):225–32.
51. Umbrello M, Formenti P, Longhi D, Galimberti A, Piva I, Pezzi A, et al. Diaphragm ultrasound as indicator of respiratory effort in critically ill patients undergoing assisted mechanical ventilation: a pilot clinical study. Crit Care. 2015;19(1):161.
52. Chetta A, Rehman AK, Moxham J, Carr DH, Polkey MI. Chest radiography cannot predict diaphragm function. Respir Med. 2005;99(1):39–44.
53. Tobin MJ, Laghi F. Monitoring respiratory muscle function. In: Tobin MJ, editor. Principles and practice of intensive care monitoring. New York: McGraw-Hill Co.; 1998. p. 497–544.
54. Gaeta M, Barca E, Ruggeri P, Minutoli F, Rodolico C, Mazziotti S, et al. Late-onset Pompe disease (LOPD): correlations between respiratory muscles CT and MRI features and pulmonary function. Mol Genet Metab. 2013;110(3):290–6.
55. Lee GD, Kim HC, Yoo JW, Lee SJ, Cho YJ, Bae K, et al. Computed tomography confirms a reduction in diaphragm thickness in mechanically ventilated patients. J Crit Care. 2016;33:47–50.
56. Sukkasem W, Moftah SG, Kicska G, Godwin JD, Pipavath S, Stern E. Crus atrophy: accuracy of computed tomography in diagnosis of diaphragmatic paralysis. J Thorac Imaging. 2017;32(6):383–90.
57. Ufuk F, Çakmak P, Sağtaş E, Herek D, Arslan M, Baki YB. Diaphragm thickness measurement in computed tomography: intra- and inter-observer agreement. İstanbul Med J. 2019;20:101–6.
58. Cassart M, Pettiaux N, Gevenois PA, Paiva M, Estenne M. Effect of chronic hyperinflation on diaphragm length and surface area. Am J Respir Crit Care Med. 1997;156(2 Pt 1):504–8.
59. Jung B, Nougaret S, Conseil M, Coisel Y, Futier E, Chanques G, et al. Sepsis Is associated with a preferential diaphragmatic atrophy: a criti-cally ill patient study using tridimensional computed tomography. Anesthesiology. 2014;120(5):1182–91.
60. Whitelaw WA. Shape and size of the human diaphragm in vivo. J Appl Physiol (1985). 1987;62(1):180–6.
61. Pettiaux N, Cassart M, Paiva M, Estenne M. Three-dimensional reconstruction of human diaphragm with the use of spiral computed tomography. J Appl Physiol. 1997;82(3):998–1002.
62. Cluzel P, Similowski T, Chartrand-Lefebvre C, Zelter M, Derenne JP, Grenier PA. Diaphragm and chest wall: assessment of the inspira-tory pump with MR imaging-preliminary observations. Radiology. 2000;215(2):574–83.
63. Gierada DS, Curtin JJ, Erickson SJ, Prost RW, Strandt JA, Goodman LR. Diaphragmatic motion: fast gradient-recalled-echo MR imaging in healthy subjects. Radiology. 1995;194(3):879–84.
64. Gauthier AP, Verbanck S, Estenne M, Segebarth C, Macklem PT, Paiva M. Three-dimensional reconstruction of the in vivo human diaphragm shape at different lung volumes. J Appl Physiol. 1994;76(2):495–506.
65. Paiva M, Verbanck S, Estenne M, Poncelet B, Segebarth C, Macklem PT. Mechanical implications of in vivo human diaphragm shape. J Appl Physiol (1985). 1992;72(4):1407–12.
66. Gaeta M, Musumeci O, Mondello S, Ruggeri P, Montagnese F, Cucinotta M, et al. Clinical and pathophysiological clues of respira-tory dysfunction in late-onset Pompe disease: new insights from a comparative study by MRI and respiratory function assessment. Neuromuscul Disord. 2015;25(11):852–8.
67. Wens SC, Ciet P, Perez-Rovira A, Logie K, Salamon E, Wielopolski P, et al. Lung MRI and impairment of diaphragmatic function in Pompe disease. BMC Pulm Med. 2015;15:54.
68. Alexander C. Diaphragm movements and the diagnosis of diaphrag-matic paralysis. Clin Radiol. 1966;17(1):79–83.
69. Newsom-Davis JG, Loh M, Casson M. Diaphragm function and alveo-lar hypoventilation. Q J Med. 1976;177:87–100.
70. Kiryu S, Loring SH, Mori Y, Rofsky NM, Hatabu H, Takahashi M. Quan-titative analysis of the velocity and synchronicity of diaphragmatic motion: dynamic MRI in different postures. Magn Reson Imaging. 2006;24(10):1325–32.
71. Kolar P, Sulc J, Kyncl M, Sanda J, Neuwirth J, Bokarius AV, et al. Sta-bilizing function of the diaphragm: dynamic MRI and synchronized spirometric assessment. J Appl Physiol (1985). 2010;109(4):1064–71.
72. Unal O, Arslan H, Uzun K, Ozbay B, Sakarya ME. Evaluation of dia-phragmatic movement with MR fluoroscopy in chronic obstructive pulmonary disease. Clin Imaging. 2000;24(6):347–50.
73. Etlik O, Sakarya ME, Uzun K, Harman M, Temizoz O, Durmus A. Dem-onstrating the effect of theophylline treatment on diaphragmatic movement in chronic obstructive pulmonary disease patients by MR-fluoroscopy. Eur J Radiol. 2004;51(2):150–4.
74. Groth SS, Andrade RS. Diaphragmatic eventration. Thorac Surg Clin. 2009;19(4):511–9.
75. Noda Y, Sekiguchi K, Kohara N, Kanda F, Toda T. Ultrasonographic dia-phragm thickness correlates with compound muscle action potential amplitude and forced vital capacity. Muscle Nerve. 2016;53(4):522–7.
76. Grosu HB, Im Lee Y, Lee J, Eden E, Eikermann M, Rose KM. Diaphragm muscle thinning in patients who are mechanically ventilated. Chest. 2012;142(6):1455–60.
77. Schepens T, Verbrugghe W, Dams K, Corthouts B, Parizel PM, Jorens PG. The course of diaphragm atrophy in ventilated patients assessed with ultrasound: a longitudinal cohort study. Crit Care. 2015;19(1):422.
78. Dubé B-P, Dres M, Mayaux J, Demiri S, Similowski T, Demoule A. Ultra-sound evaluation of diaphragm function in mechanically ventilated patients: comparison to phrenic stimulation and prognostic implica-tions. Thorax. 2017;72(9):811–8.
79. Yasuda T, Fukumura K, Iida H, Nakajima T. Effect of low-load resistance exercise with and without blood flow restriction to volitional fatigue on muscle swelling. Eur J Appl Physiol. 2015;115(5):919–26.
80. Cacciani N, Ogilvie H, Larsson L. Age related differences in diaphragm muscle fiber response to mid/long term controlled mechanical ventila-tion. Exp Gerontol. 2014;59:28–33.

Page 28 of 29Laghi Jr. et al. BMC Pulm Med (2021) 21:85
81. Radell P, Edström L, Stibler H, Eriksson L, Ansved T. Changes in diaphragm structure following prolonged mechanical ventilation in piglets. Acta Anaesthesiol Scand. 2004;48(4):430–7.
82. Heunks LM, Dekhuijzen R. Mechanical ventilation and disuse atrophy of the diaphragm. N Engl J Med. 2008;359:90–2.
83. Corpeno R, Dworkin B, Cacciani N, Salah H, Bergman HM, Ravara B, et al. Time course analysis of mechanical ventilation-induced diaphragm contractile muscle dysfunction in the rat. J Physiol. 2014;592(17):3859–80.
84. Vivier E, Roussey A, Doroszewski F, Rosselli S, Pommier C, Carteaux G, et al. Atrophy of diaphragm and pectoral muscles in critically ill patients. Anesthesiology. 2019;131(3):569–79.
85. Grosu HB, Ost DE, Im Lee Y, Song J, Li L, Eden E, et al. Diaphragm muscle thinning in subjects receiving mechanical ventilation and its effect on extubation. Respir Care. 2017;62(7):904–11.
86. Summerhill EM, El-Sameed YA, Glidden TJ, McCool FD. Monitor-ing recovery from diaphragm paralysis with ultrasound. Chest. 2008;133(3):737–43.
87. Ferrari G, De Filippi G, Elia F, Panero F, Volpicelli G, Aprà F. Diaphragm ultrasound as a new index of discontinuation from mechanical ventila-tion. Crit Ultrasound J. 2014;6(1):8.
88. Moury P-H, Cuisinier A, Durand M, Bosson J-L, Chavanon O, Payen J-F, et al. Diaphragm thickening in cardiac surgery: a perioperative prospec-tive ultrasound study. Ann Intensive Care. 2019;9(1):50.
89. Vaporidi K, Babalis D, Chytas A, Lilitsis E, Kondili E, Amargianitakis V, et al. Clusters of ineffective efforts during mechanical ventilation: impact on outcome. Intensive Care Med. 2017;43(2):184–91.
90. DiNino E, Gartman EJ, Sethi JM, McCool FD. Diaphragm ultrasound as a predictor of successful extubation from mechanical ventilation. Thorax. 2014;69(5):431–5.
91. Pirompanich P, Romsaiyut S. Use of diaphragm thickening fraction combined with rapid shallow breathing index for predicting success of weaning from mechanical ventilator in medical patients. J Intensive Care. 2018;6(1):1–7.
92. Vivier E, Muller M, Putegnat JB, Steyer J, Barrau S, Boissier F, et al. Inability of diaphragm ultrasound to predict extubation failure: a multicenter study. Chest. 2019;155(6):1131–9.
93. Fayssoil A, Stojkovic T, Ogna A, Laforet P, Prigent H, Lofaso F, et al. Assessment of diaphragm motion using ultrasonography in a patient with facio-scapulo-humeral dystrophy: a case report. Medicine. 2019;98(4):e13887.
94. Carrié C, Bonnardel E, Vally R, Revel P, Marthan R, Biais M. Vital capacity impairment due to neuromuscular disease and its correlation with diaphragmatic ultrasound: a preliminary study. Ultrasound Med Biol. 2016;42(1):143–9.
95. Ayoub J, Cohendy R, Prioux J, Ahmaidi S, Bourgeois JM, Dauzat M, et al. Diaphragm movement before and after cholecystectomy: a sono-graphic study. Anesth Analg. 2001;92(3):755–61.
96. Fayssoil A, Nguyen LS, Ogna A, Stojkovic T, Meng P, Mompoint D, et al. Diaphragm sniff ultrasound: normal values, relationship with sniff nasal pressure and accuracy for predicting respiratory involvement in patients with neuromuscular disorders. PLoS ONE. 2019;14(4):e0214288.
97. Lloyd T, Tang YM, Benson MD, King S. Diaphragmatic paralysis: the use of M mode ultrasound for diagnosis in adults. Spinal Cord. 2006;44(8):505–8.
98. Groth SS, Andrade RS. Diaphragm plication for eventration or paralysis: a review of the literature. Ann Thorac Surg. 2010;89(6):S2146–50.
99. Karmazyn B, Shold AJ, Delaney LR, Brown BP, Marine MB, Jennings SG, et al. Ultrasound evaluation of right diaphragmatic eventration and hernia. Pediatr Radiol. 2019;49(8):1010–7.
100. Podgaetz E, Garza-Castillon R Jr, Andrade RS. Best approach and benefit of plication for paralyzed diaphragm. Thorac Surg Clin. 2016;26(3):333–46.
101. Laghi F, Shaikh H, Littleton SW, Morales D, Jubran A, Tobin MJ. Inhibition of central activation of the diaphragm: a mechanism of weaning failure. J Appl Physiol. 2020;129(2):366–76.
102. Cattapan SE, Laghi F, Tobin MJ. Can diaphragmatic contractility be assessed by airway twitch pressure in mechanically ventilated patients? Thorax. 2003;58(1):58–62.
103. Dres M, De Abreu MG, Similowski T. Late breaking abstract-temporary transvenous diaphragm neurostimulation in difficult-to-wean
mechanically ventilated patients—results of the RESCUE 2 rand-omized controlled trial. Eur Respir Soc. 2020;56:4352. https ://doi.org/10.1183/13993 003.congr ess-2020.4352.
104. Tuinman PR, Jonkman AH, Dres M, Shi Z-H, Goligher EC, Goffi A, et al. Respiratory muscle ultrasonography: methodology, basic and advanced principles and clinical applications in ICU and ED patients—a narrative review. Intensive Care Med. 2020;46(4):594-605
105. Spadaro S, Grasso S, Mauri T, Dalla Corte F, Alvisi V, Ragazzi R, et al. Can diaphragmatic ultrasonography performed during the T-tube trial pre-dict weaning failure? The role of diaphragmatic rapid shallow breathing index. Crit Care. 2016;20(1):1–11.
106. Dres M, Goligher EC, Heunks LM, Brochard LJ. Critical illness-associated diaphragm weakness. Intensive Care Med. 2017;43(10):1441–52.
107. Dres M, Schmidt M, Ferre A, Mayaux J, Similowski T, Demoule A. Dia-phragm electromyographic activity as a predictor of weaning failure. Intensive Care Med. 2012;38(12):2017–25.
108. Jung B, Moury PH, Mahul M, de Jong A, Galia F, Prades A, et al. Dia-phragmatic dysfunction in patients with ICU-acquired weakness and its impact on extubation failure. Intensive Care Med. 2016;42(5):853–61.
109. Surya M, Bhoil R, Sharma YP. Study of ultrasound-guided needle aspira-tion and catheter drainage in the management of liver abscesses. J Ultrasound. 2020;23:553–62.
110. Sharifi A, Kasraianfard A, Chavoshi Khamneh A, Kanani S, Aldarraji M, Seif-Rabiei MA, et al. Value of ultrasonography in detection of dia-phragmatic injuries following thoracoabdominal penetrating trauma; a diagnostic accuracy study. Arch Acad Emerg Med. 2019;7(1):e45.
111. Houston JG, Morris AD, Grosset DG, Lees KR, McMillan N, Bone I. Ultra-sonic evaluation of movement of the diaphragm after acute cerebral infarction. J Neurol Neurosurg Psychiatry. 1995;58(6):738–41.
112. Ayas NT, McCool FD, Gore R, Lieberman SL, Brown R. Prevention of human diaphragm atrophy with short periods of electrical stimulation. Am J Respir Crit Care Med. 1999;159(6):2018–20.
113. Kim SH, Na S, Choi J-S, Na SH, Shin S, Koh SO. An evaluation of diaphragmatic movement by M-mode sonography as a predictor of pulmonary dysfunction after upper abdominal surgery. Anesth Analg. 2010;110(5):1349–54.
114. Spadaro S, Grasso S, Dres M, Fogagnolo A, Dalla Corte F, Tamburini N, et al. Point of care ultrasound to identify diaphragmatic dysfunction after thoracic surgery. Anesthesiology. 2019;131(2):266–78.
115. de Bruin PF, Ueki J, Bush A, Khan Y, Watson A, Pride NB. Diaphragm thickness and inspiratory strength in patients with Duchenne muscular dystrophy. Thorax. 1997;52(5):472–5.
116. Chu PY, Lin KH, Kao HL, Peng YJ, Huang TW. Three-dimensional image simulation of primary diaphragmatic hemangioma: a case report. World J Clin Cases. 2019;7(24):4307–13.
117. Celik S, Celik M, Aydemir B, Tunckaya C, Okay T, Dogusoy I. Long-term results of diaphragmatic plication in adults with unilateral diaphragm paralysis. J Cardiothorac Surg. 2010;5:111.
118. Freeman RK, Wozniak TC, Fitzgerald EB. Functional and physiologic results of video-assisted thoracoscopic diaphragm plication in adult patients with unilateral diaphragm paralysis. Ann Thorac Surg. 2006;81(5):1853–7 (discussion 7).
119. Kunovsky P, Gibson GA, Pollock JC, Stejskal L, Houston A, Jamieson MP. Management of postoperative paralysis of diaphragm in infants and children. Eur J Cardiothorac Surg. 1993;7(7):342–6.
120. Khurana J, Gartner SC, Naik L, Tsui BCH. Ultrasound identification of diaphragm by novices using ABCDE technique. Reg Anesth Pain Med. 2018;43(2):161–5.
121. Smith JA, Albarghuthy B, Khosla R. Inversion of the hemidiaphragm due to pleural effusion. Ann Am Thorac Soc. 2014;11(8):1323–6.
122. Fedullo AJ, Lerner RM, Gibson J, Shayne DS. Sonographic measurement of diaphragmatic motion after coronary artery bypass surgery. Chest. 1992;102(6):1683–6.
123. Fossé Q, Poulard T, Niérat M-C, Virolle S, Morawiec E, Hogrel J-Y, et al. Ultrasound shear wave elastography for assessing diaphragm function in mechanically ventilated patients: a breath-by-breath analysis. Crit Care. 2020;24(1):1–13.
124. Sheth KN, Mazurek MH, Yuen MM, Cahn BA, Shah JT, Ward A, et al. Assessment of brain injury using portable, low-field magnetic reso-nance imaging at the bedside of critically ill patients. JAMA Neurol. 2020;78:41–7.
Page 29 of 29Laghi Jr. et al. BMC Pulm Med (2021) 21:85
• fast, convenient online submission
•
thorough peer review by experienced researchers in your field
• rapid publication on acceptance
• support for research data, including large and complex data types
•
gold Open Access which fosters wider collaboration and increased citations
maximum visibility for your research: over 100M website views per year •
At BMC, research is always in progress.
Learn more biomedcentral.com/submissions
Ready to submit your researchReady to submit your research ? Choose BMC and benefit from: ? Choose BMC and benefit from:
125. Dres M, Dubé B-P, Goligher E, Vorona S, Demiri S, Morawiec E, et al. Use-fulness of parasternal intercostal muscle ultrasound during weaning from mechanical ventilation. Anesthesiology. 2020;132(5):1114–25.
126. Formenti P, Umbrello M, Dres M, Chiumello D. Ultrasonographic assess-ment of parasternal intercostal muscles during mechanical ventilation. Ann Intensive Care. 2020;10(1):1–9.
127. Umbrello M, Formenti P, Lusardi AC, Guanziroli M, Caccioppola A, Cop-pola S, et al. Oesophageal pressure and respiratory muscle ultrasono-graphic measurements indicate inspiratory effort during pressure support ventilation. Br J Anaesth. 2020;125(1):e148–57.
128. Taylor AM, Jhooti P, Keegan J, Simonds AK, Pennell DJ. Magnetic resonance navigator echo diaphragm monitoring in patients with sus-pected diaphragm paralysis. J Magn Reson Imaging. 1999;9(1):69–74.
Publisher’s NoteSpringer Nature remains neutral with regard to jurisdictional claims in pub-lished maps and institutional affiliations.