Embed Size (px)
Citation preview
1
Ultrasonic Spot Welds of Gas Diffusion Layer to Proton Exchange Membrane of
Fuel Cells
Quang Khoa Dang1, Pei-Lun Chang1, Thien Ngon Dang2, Fangbor Weng3, Jun-Yen Uan4,
Dung-An Wang1*,
1Graduate Institute of Precision Engineering, National Chung Hsing University,
Taichung 40227, Taiwan, ROC 2Faculty of Mechanical Engineering, Ho Chi Minh City University of Technology and
Education, Vietnam. 3Department of Mechanical Engineering, Yuan Ze University, Taoyuan 320, Taiwan,
ROC 4Department of Materials Science and Engineering, National Chung Hsing University,
Taichung 40227, Taiwan, ROC
October 4, 2018
Abstract
Ultrasonic spot welding of gas diffusion layer to proton exchange membrane of fuel cells
is investigated under various processing parameters. Key parameters are found to be the
welding time and the pressure. The optimum welding time and the peak pressure are
0.25 sec and 2.75 MPa, respectively. The holding time has no significant effect on the
bonding strength of the welds and the holding time 0.2 sec seems to be a reasonable
selection. Mechanical interlocking is found to be the major contributing factor of the
ultrasonic bonding. Ultrasonic weld of the carbon paper and the proton exchange
membrane for membrane exchange assemblies of fuel cells is demonstrated as a viable
technology to replace hot-pressing, which may be time consuming and energy inefficient.
Keywords: Gas diffusion layer; Proton exchange membrane; Ultrasonic spot welding
* Corresponding author. Tel.:+886-4-22840531; fax:+886-4-22858362
E-mail address: [email protected] (Dung-An Wang).
2
1. Introduction
Fuel cells have a high potential in powering portable devices, stationary devices
and transportation vehicles. Satyapal (2018) reported that proton exchange membrane
(PEM) fuel cell has seen the greatest increase in total power shipped by fuel cell
industries among the various fuel cells. Romdhane and Louahlia-Gualous (2018)
described that PEM fuel cells have high-power density and efficiency, and fast start-up
time due to their low operating temperature. These characteristics make PEM fuel cells a
superior power source for real life applications. Tang et al. (2008) also noted that PEM
fuel cells are considered as an alternative power source for transportation, due to their
high-energy efficiency and clean operation. The Toyota MIRAI powered by PEM fuel
cells has started sales in December 2014 (Yoshida and Kojima, 2015). Owens and
McGuinness (2015) reported that PEM fuel cells with sizes ranging from 1 W to 20 kW
were used in recreational settings (campers, boats, lighting) and skid mounted generators.
Fuel Cells Bulletin (2017) revealed that Toshiba had received an order to supply a 100
kW PEM fuel cell system to Japanese chemical engineering company Showa Denko, for
installation in a new hotel.
Since late 1980s, various fabrication methods of PEMs were developed and
optimized to accelerate applications of PEM fuel cells. Litster and McLean (2004)
provided an overview of several fabrication methods that have been shown to produce
effective electrodes and have high future potential. Hack et al. (2018) reported that hot-
pressing is the most common means of fabricating membrane exchange assemblies
(MEAs) for PEM fuel cells. Meyer et al. (2017) have explored the optimum temperature
and pressure for hot-pressing of MEA components based on microstructure observations

3
and electrochemical performance. They pointed out that certain pressure and temperature
are required to achieve optimum interfacial contact for effective lamination of MEA
layers. Kim et al. (2010) stated that hot-pressing method may cause structural
deformation in the porous catalyst layers and gas diffusion layers (GDLs) and induce
slow gas transportation and high electrical resistance. Towne et al. (2007) reported that
applying hot-pressing step in the catalyst-coated membrane based method can improve
the MEA performance and has a positive effect on MEA’s performance. However, Beck
et al. (2013) stated that the viability of hot-pressing of MEA components for PEM fuel
cells is strongly correlated with process cycle time and energy consumption. However,
Kim et al. (2010) reported that one disadvantage of hot-pressing method is a large
amount of catalyst may immerse into the catalyst coated GDL and be wasted when the
catalyst layer is heat bonded into the Nafion membrane. Given the fact that relatively
long process cycle time and high energy consumption during thermal bonding of the
MEAs, a cost and time efficient means for bonding MEA components may be developed
to address the above cycle time and energy consumption issues.
Ultrasonic welding is a promising technology for joining similar and dissimilar
materials where ultrasonic vibrations are locally applied to parts being held together
under pressure to form a solid state weld. Rani and Rudramoorthy (2013) mentioned that
ultrasonic welding is an efficient and economical process and the welding time is usually
less than a second for bonding of a variety of industrial thermoplastic components.
Truckenmuller et al. (2006) demonstrated ultrasonic welding of polymer parts and
reported that processing time of ultrasonic welding is relatively short and an effective
bonding can be achieved without adding additional substance, such as adhesives or
4
solvents. Nguyen et al. (2014) have shown that the vibration during ultrasonic welding
generates sufficient heat at the joint area and the adjacent material is softened and melted,
then cooled to create a fast, strong and clean bond. Kelly et al. (2014) suggested that
ultrasonic bonding may occur well below the material melting temperatures, where
interfacial friction and shearing bring material from both surfaces into intimate contact to
form a solid-state bond. Due to low cycle time and energy efficiency, ultrasonic welding
has been used to join parts in the manufacturing sector. There is a potential to lower the
energy cost and process time by adopting ultrasonic welding for bonding of MEA
components for PEM fuel cells. Beck et al. (2012) reported that MEAs produced by
ultrasonic bonding have comparable performance to those made using thermal bonding.
Bonding mechanisms and mechanical strength of the ultrasonic welds of MEA
components have not been revealed in their studies.
In this paper, processing parameters for ultrasonic bonding of a GDL and a PEM
were investigated by spot welding of lap-shear specimens. Bonding strength and failure
mechanisms of the ultrasonic spot welds of a GDL and a PEM in lap-shear specimens
were examined based on experimental observations. An ultrasonic spot welding machine
with an ultrasonic horn of 12 m peak to peak vibration amplitude and 35 kHz resonant
frequency was used. Effects of the processing parameters of the ultrasonic spot welding
on the bonding strength of the lap-shear specimens were investigated. Micrographs of
ultrasonic spot welds in lap-shear specimens before and after testing were obtained.
Failure mechanisms for the ultrasonic spot welds were then examined. Finally, the
optimal processing parameters for the ultrasonic spot welds of the MEA components
were presented.
5
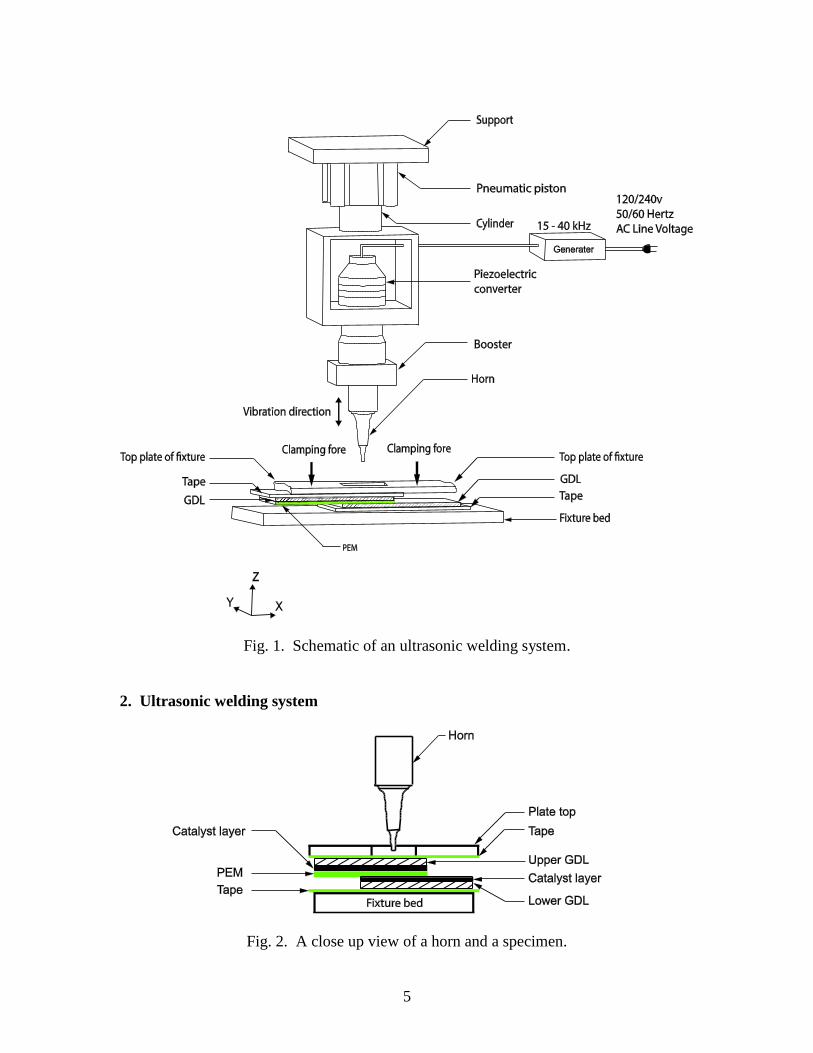
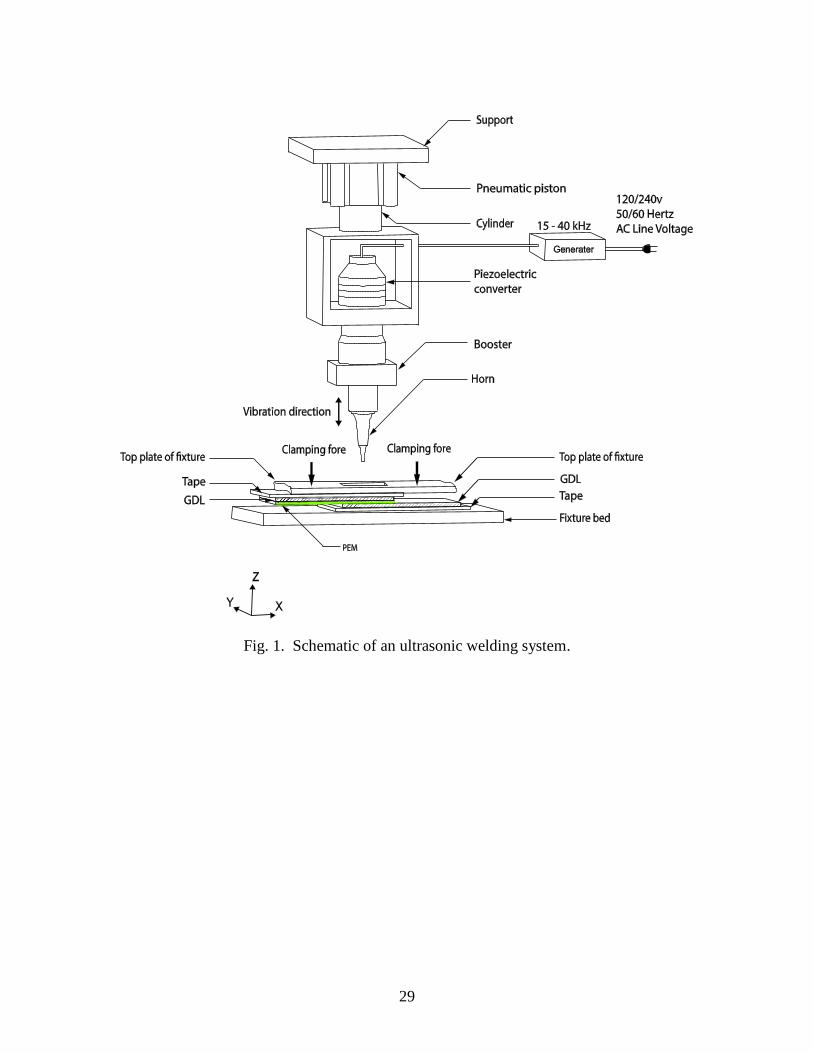
Fig. 1. Schematic of an ultrasonic welding system.
2. Ultrasonic welding system
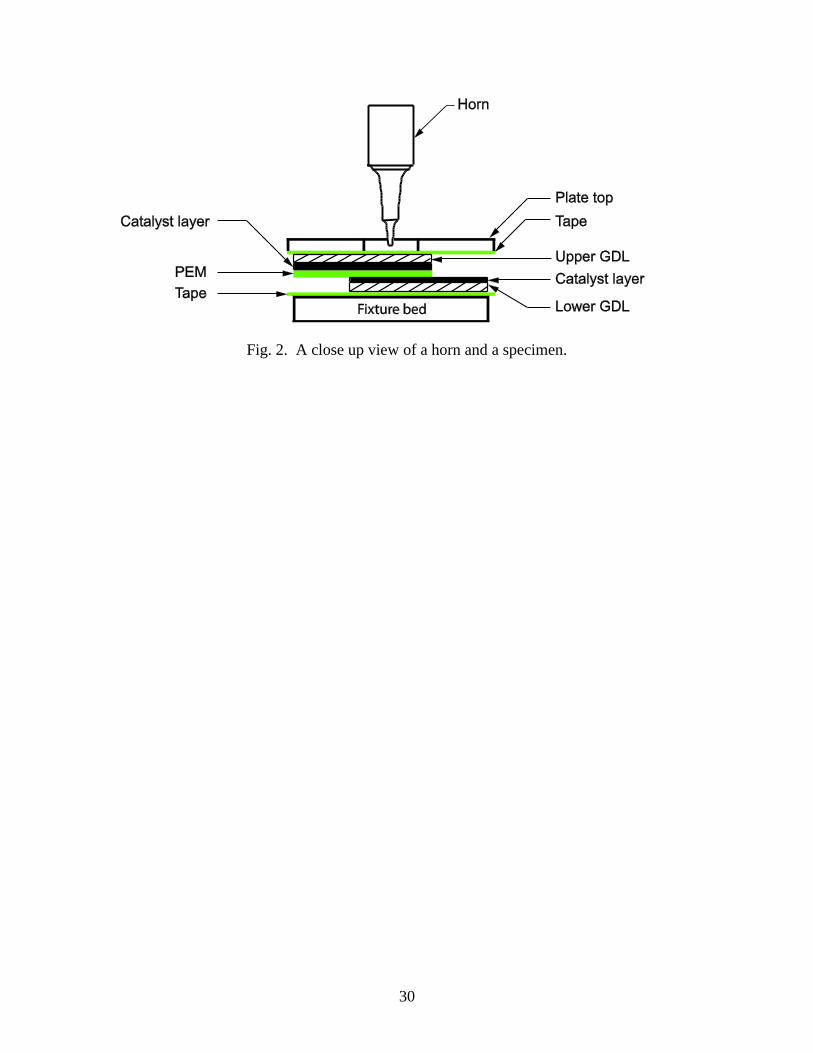
Fig. 2. A close up view of a horn and a specimen.

6
Fig. 1 is a schematic of an ultrasonic welding system for bonding of the MEA
components. The vibration generated by a piezoelectric converter is amplified by a
booster and an ultrasonic horn. The MEA components are held by a fixture. The high
frequency oscillations of the ultrasonic horn ensure effective bonding at the interfaces of
the MEA components. In this investigation, spot welding is utilized to examine the
bonding strength of weld-bonded joints of the MEA. Fig. 2 is a schematic close up view
of the horn and the components of the MEAs to be welded. A typical single-cell PEM
fuel cell consists of two flow fields, two GDLs and one PEM. One side of the GDL is
coated with the catalyst. The GDL acts as an interface of the flow field and the catalyst.
The catalyst coated side of the GDL is in touch with the PEM. As shown in Fig. 2, a
PEM is sandwiched between two carbon paper GDLs in the experimental setup. The
catalyst side of the GDLs is facing the PEM. Thin Kapton tapes are placed between the
upper GDL and the horn and between the lower GDL and the fixture bed to avoid
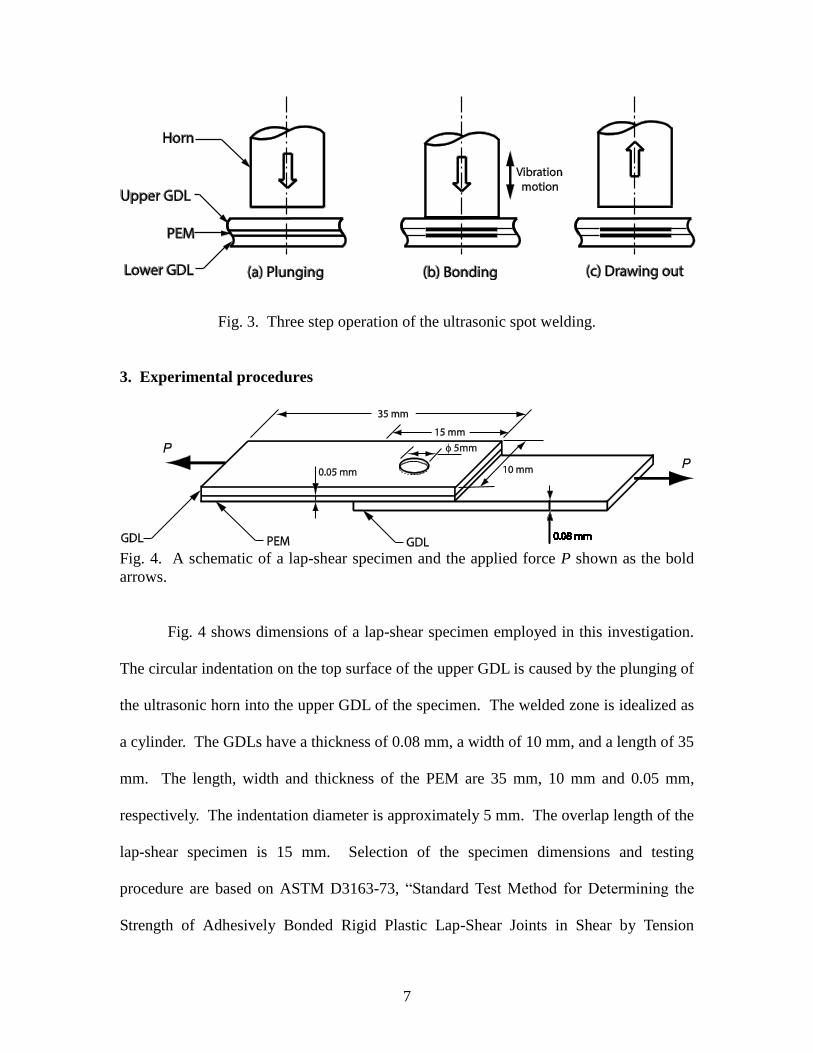
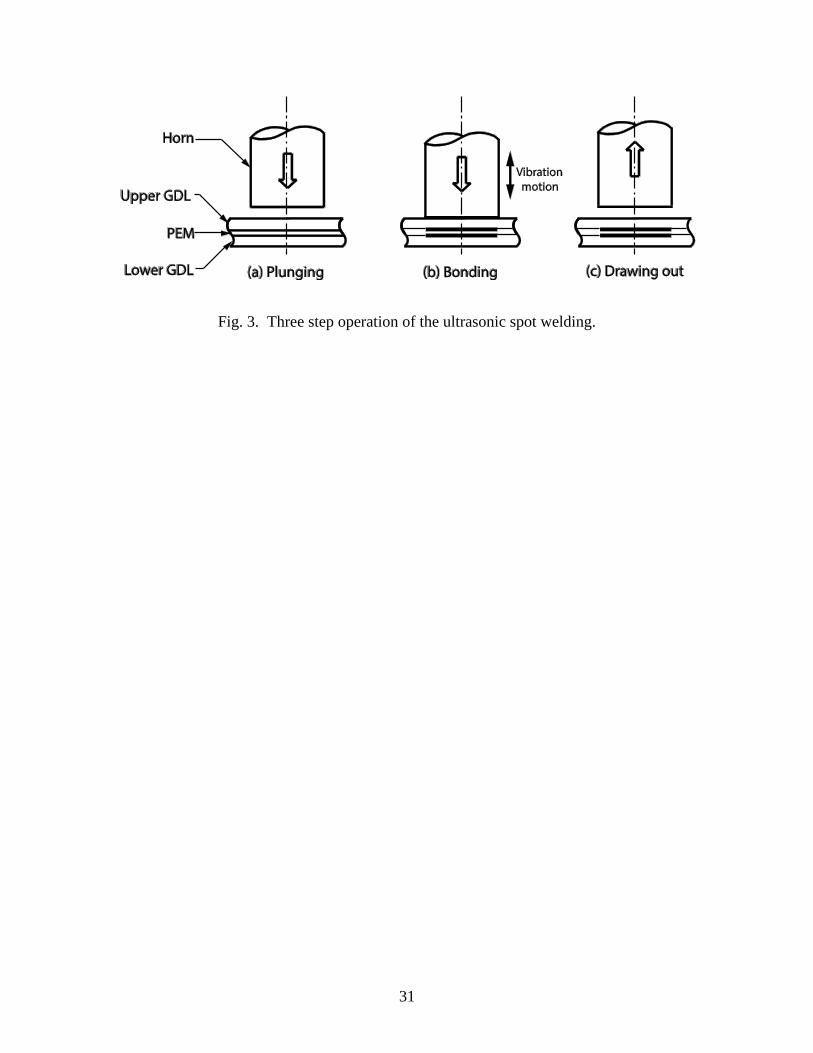
sticking. Fig. 3 schematically shows the ultrasonic spot welding process. The horn tip is
pressured into the top surface of the upper GDL. The lower GDL is supported by the
fixture bed. The ultrasonic vibration of the horn is switched on and the pressure is kept at
an adequate level for a period of time to generate enough mechanical disruptions at the
joint interface. Entanglement of fiber/polymer chains occurs across the interface. The
ultrasonic bonding causes fiber disruption locally near the interface and the integrity of
the material is maintained. The frictional heat does not cause glass transition or melting
of the material and a solid state bond at the interface is created. Then, the ultrasonic horn
is drawn out of the upper GDL.
7
Fig. 3. Three step operation of the ultrasonic spot welding.
3. Experimental procedures
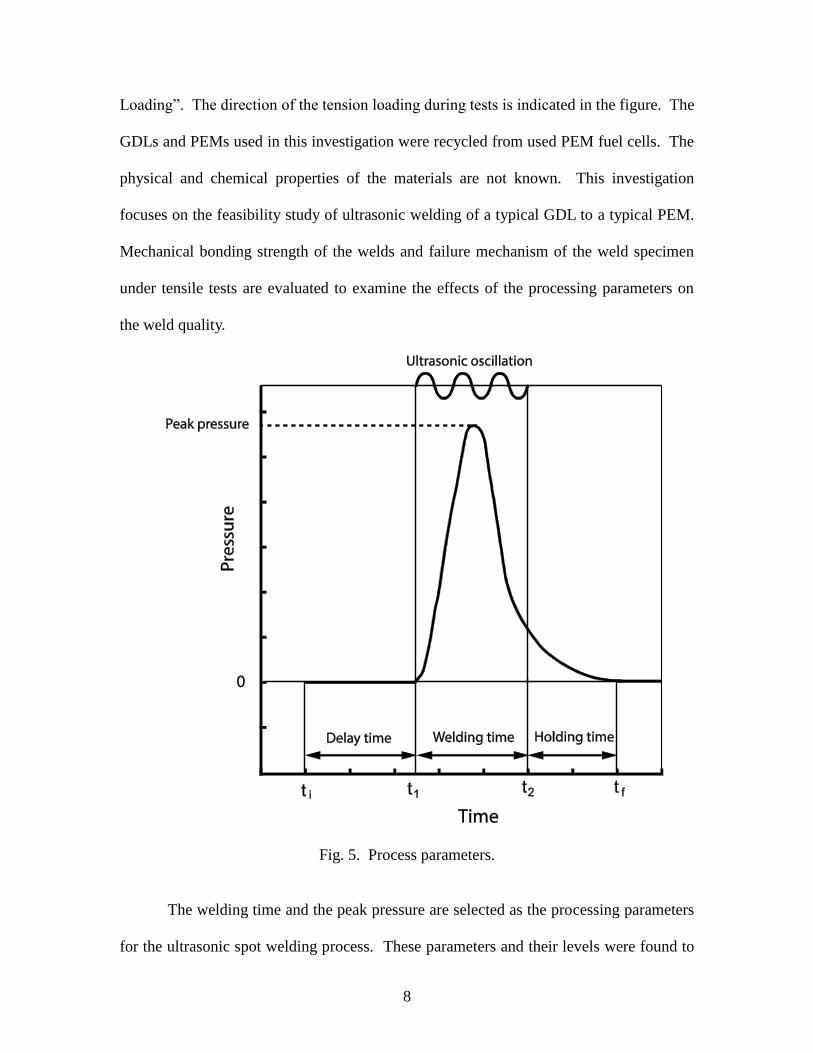
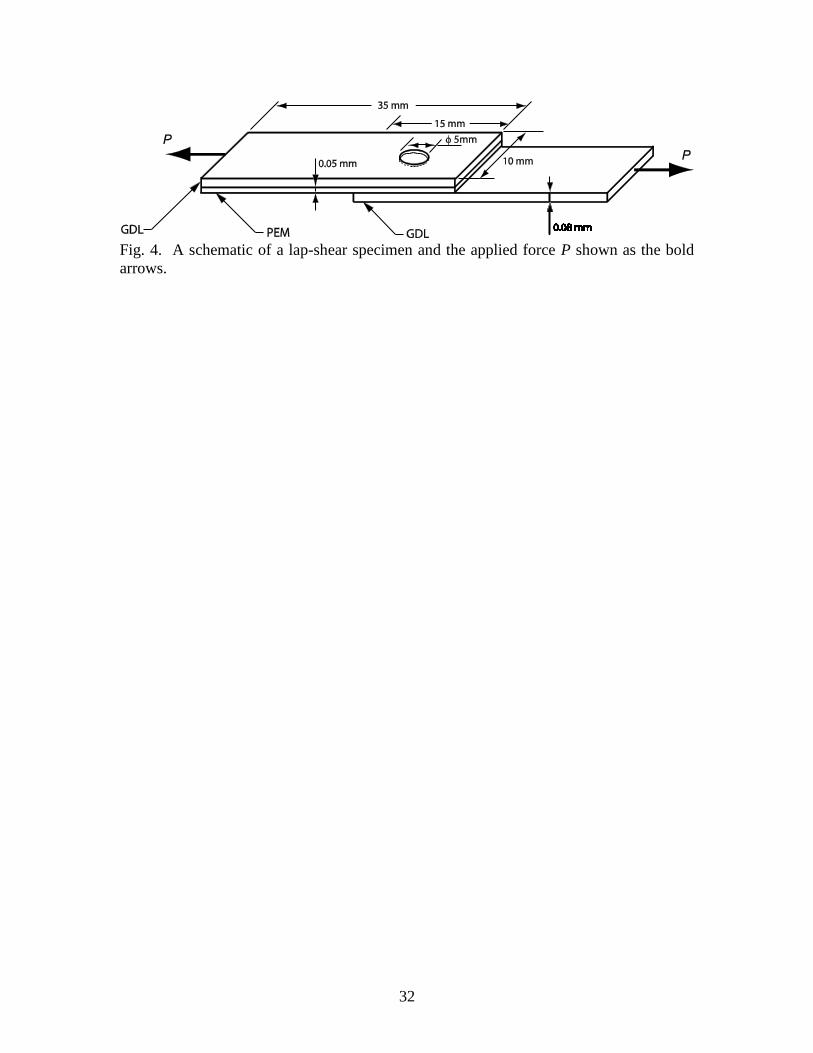
Fig. 4. A schematic of a lap-shear specimen and the applied force P shown as the bold
arrows.
Fig. 4 shows dimensions of a lap-shear specimen employed in this investigation.
The circular indentation on the top surface of the upper GDL is caused by the plunging of
the ultrasonic horn into the upper GDL of the specimen. The welded zone is idealized as
a cylinder. The GDLs have a thickness of 0.08 mm, a width of 10 mm, and a length of 35
mm. The length, width and thickness of the PEM are 35 mm, 10 mm and 0.05 mm,
respectively. The indentation diameter is approximately 5 mm. The overlap length of the
lap-shear specimen is 15 mm. Selection of the specimen dimensions and testing
procedure are based on ASTM D3163-73, “Standard Test Method for Determining the
Strength of Adhesively Bonded Rigid Plastic Lap-Shear Joints in Shear by Tension
8
Loading”. The direction of the tension loading during tests is indicated in the figure. The
GDLs and PEMs used in this investigation were recycled from used PEM fuel cells. The
physical and chemical properties of the materials are not known. This investigation
focuses on the feasibility study of ultrasonic welding of a typical GDL to a typical PEM.
Mechanical bonding strength of the welds and failure mechanism of the weld specimen
under tensile tests are evaluated to examine the effects of the processing parameters on
the weld quality.
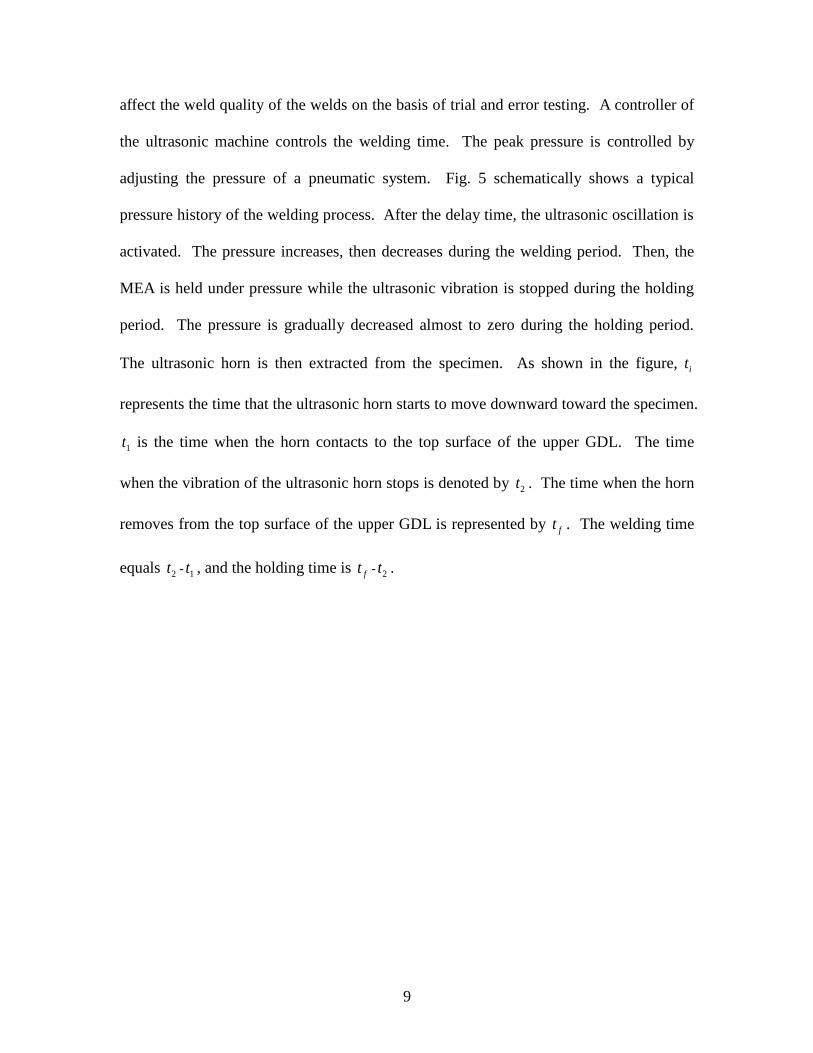
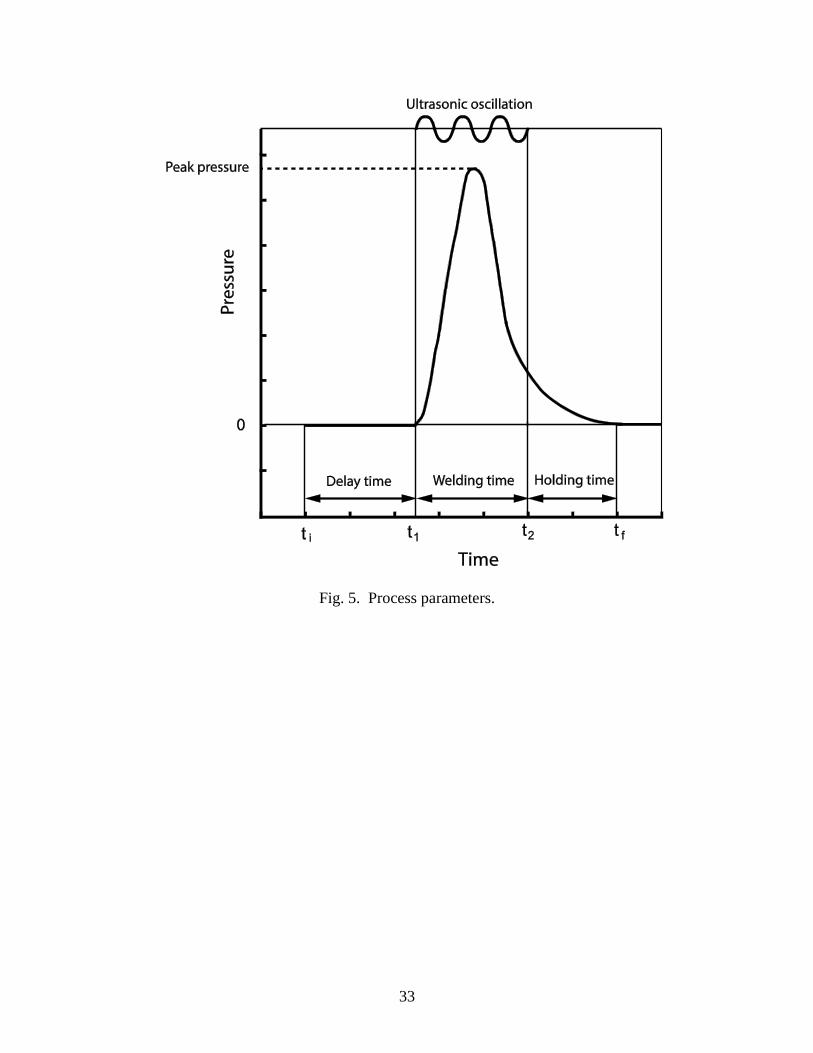
Fig. 5. Process parameters.
The welding time and the peak pressure are selected as the processing parameters
for the ultrasonic spot welding process. These parameters and their levels were found to
9
affect the weld quality of the welds on the basis of trial and error testing. A controller of
the ultrasonic machine controls the welding time. The peak pressure is controlled by
adjusting the pressure of a pneumatic system. Fig. 5 schematically shows a typical
pressure history of the welding process. After the delay time, the ultrasonic oscillation is
activated. The pressure increases, then decreases during the welding period. Then, the
MEA is held under pressure while the ultrasonic vibration is stopped during the holding
period. The pressure is gradually decreased almost to zero during the holding period.
The ultrasonic horn is then extracted from the specimen. As shown in the figure, it
represents the time that the ultrasonic horn starts to move downward toward the specimen.
1t is the time when the horn contacts to the top surface of the upper GDL. The time
when the vibration of the ultrasonic horn stops is denoted by 2t . The time when the horn
removes from the top surface of the upper GDL is represented by ft . The welding time
equals 2t - 1t , and the holding time is ft - 2t .
10
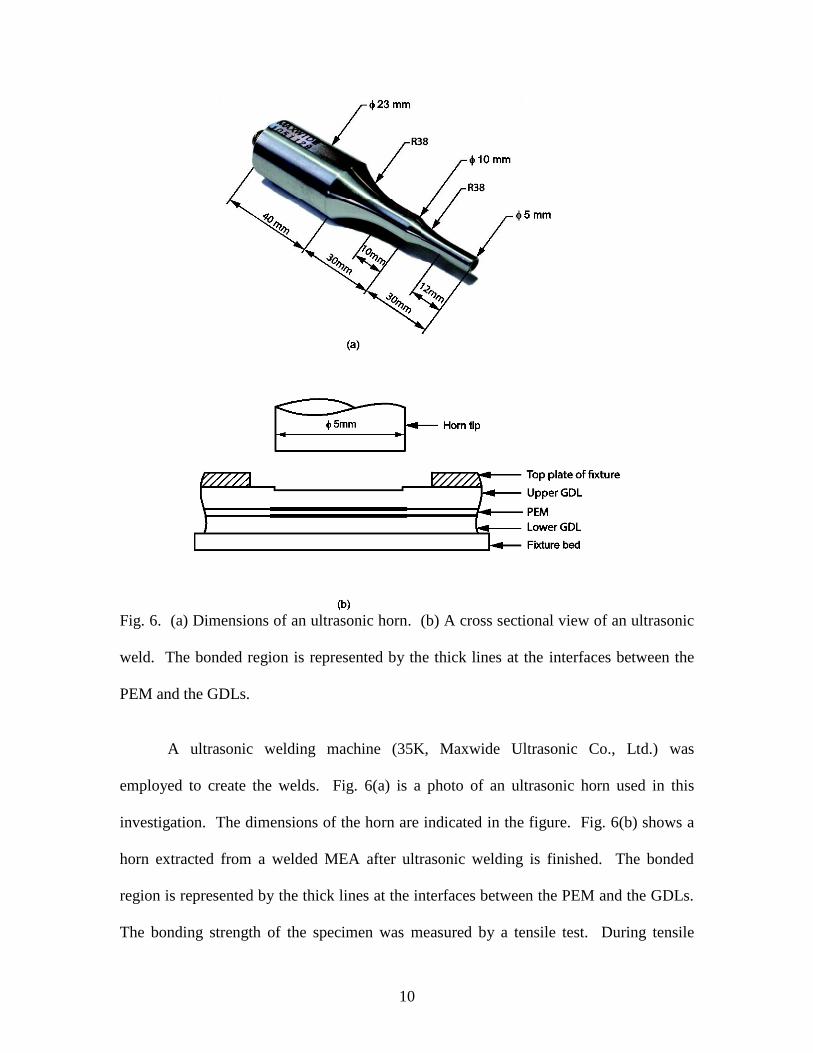
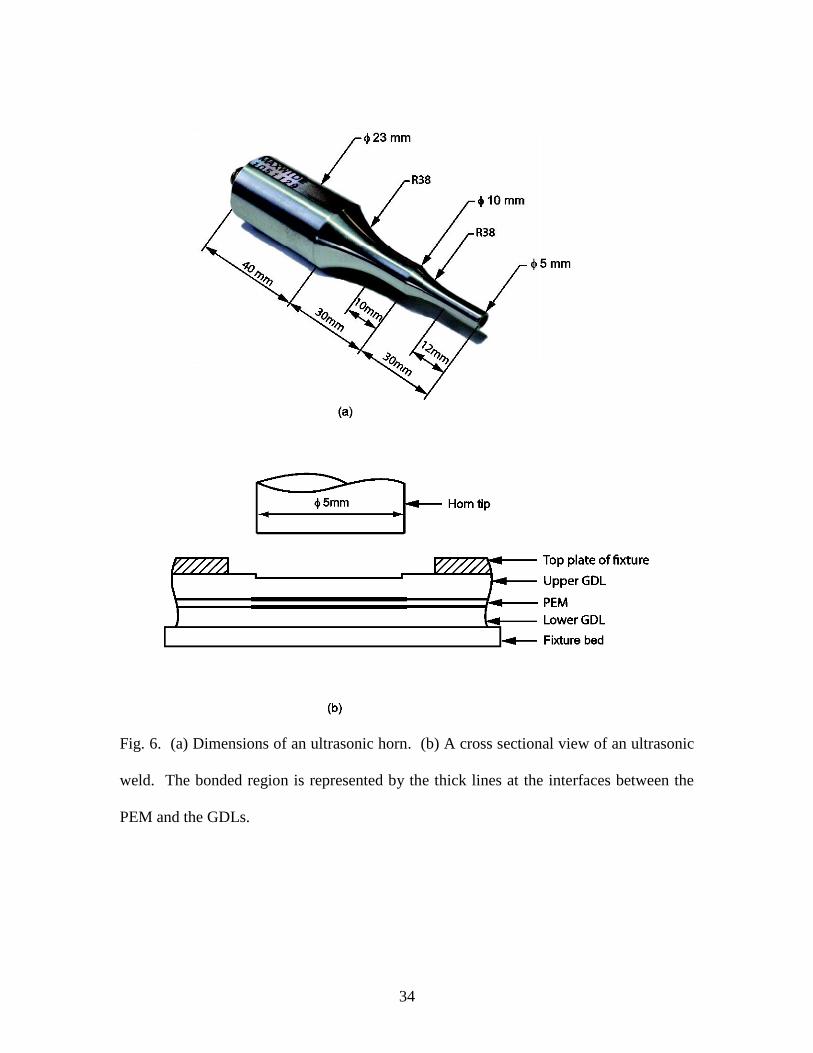
Fig. 6. (a) Dimensions of an ultrasonic horn. (b) A cross sectional view of an ultrasonic
weld. The bonded region is represented by the thick lines at the interfaces between the
PEM and the GDLs.
A ultrasonic welding machine (35K, Maxwide Ultrasonic Co., Ltd.) was
employed to create the welds. Fig. 6(a) is a photo of an ultrasonic horn used in this
investigation. The dimensions of the horn are indicated in the figure. Fig. 6(b) shows a
horn extracted from a welded MEA after ultrasonic welding is finished. The bonded
region is represented by the thick lines at the interfaces between the PEM and the GDLs.
The bonding strength of the specimen was measured by a tensile test. During tensile

11
tests, one end of the specimens was pulled by a force gauge (FG5020, Lutron Electronic
Enterprise Co., Ltd., Taiwan). The quasi-static tensile strength of the specimen was
recorded by the force gauge at a monotonic displacement rate of 5.8 mm per minute.
Tests were terminated when the upper GDL was separated from the lower GDL. The
maximum load recorded by the force gauge represents the bonding strength of the lap-
shear specimen under tensile loading.
12
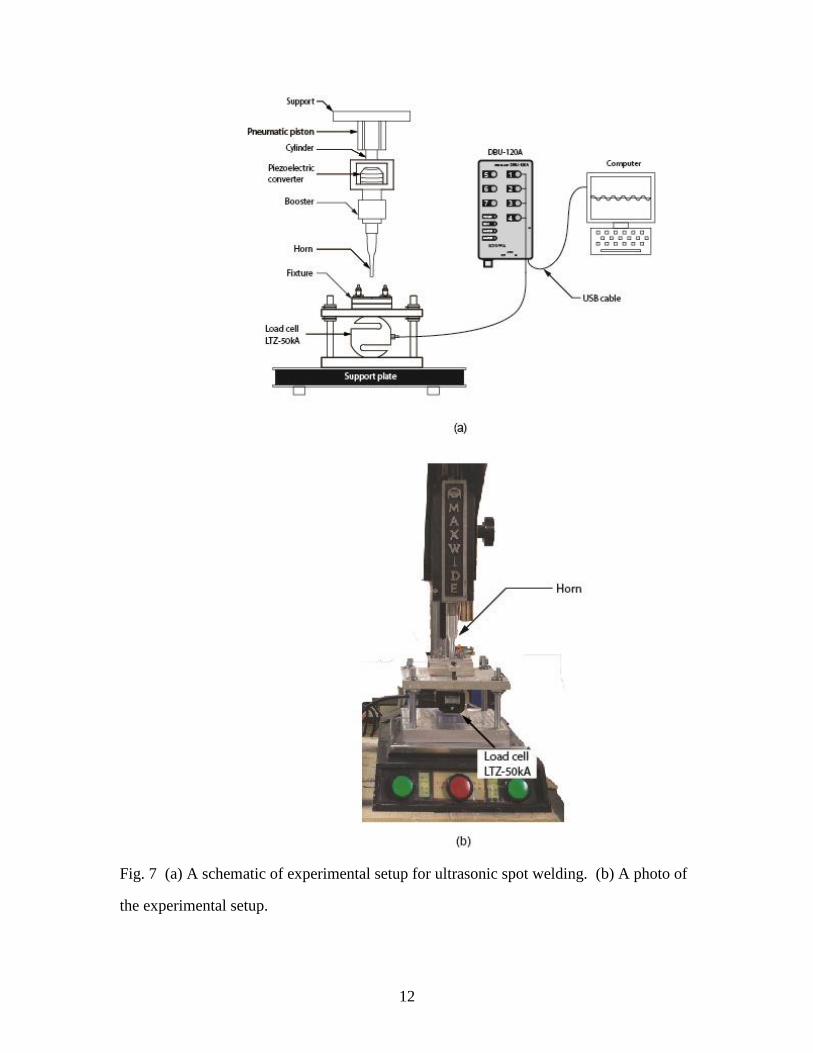
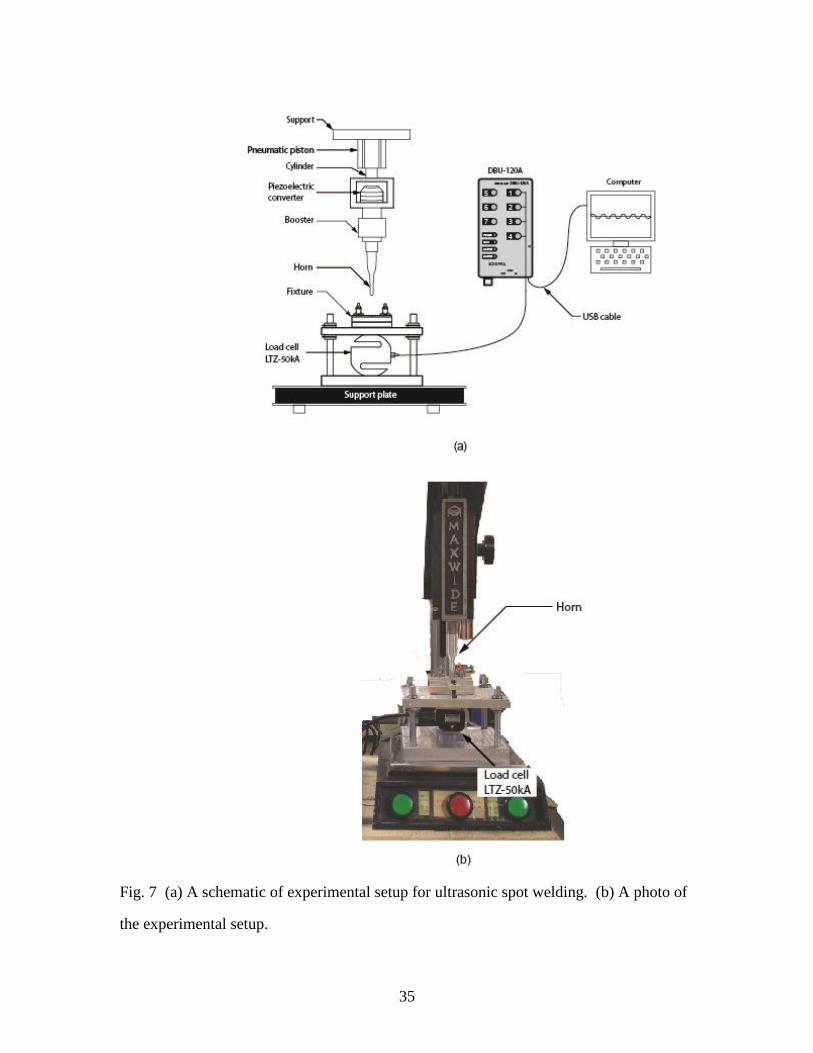
Fig. 7 (a) A schematic of experimental setup for ultrasonic spot welding. (b) A photo of
the experimental setup.
13
Fig. 7(a) is a schematic for measurement of the pressure during welding of the
specimens. The specimen is placed on top of a fixture. The top plate of the fixture is free
to move along longitudinal direction of the ultrasonic horn. The pressure applied to the
specimen is measured by a load cell (LTZ-50kA, Kyowa Electronic Instruments Co., Ltd.)
below the top plate of the fixture. The pressure data of the load cell was acquired by a
data acquisition unit (DBU-120A, Kyowa Electronic Instruments Co., Ltd.) with a
sampling rate up to 31020 samples/sec. Fig. 7(b) is a photo of the experimental setup
for the pressure measurement. Temperature of the specimens during welding were taken
using a thermal imaging camera (F30W, NEC Avio Infrared Technologies Co., Ltd.,
Japan). The camera has a measurement range ranging from -20 °C to 350 °C, a
resolution of 0.2 °C and a frame rate of 8.5 frames/sec. The output frequency of the
ultrasonic welding machine is 35 kHz. The horn has a vibration amplitude of 12 m at
35 kHz. The material of the GDL is a carbon paper, and a DuPont’s Nafion membrane is
selected as the material of the PEM.

14
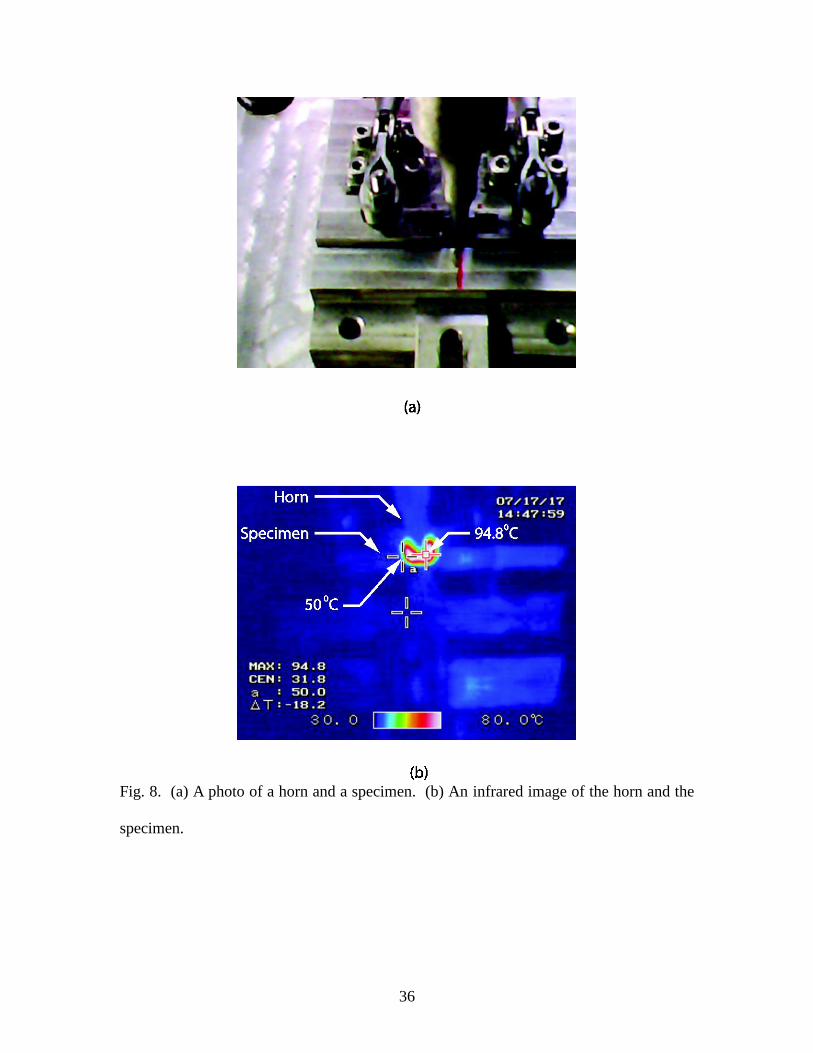
Fig. 8. (a) A photo of a horn and a specimen. (b) An infrared image of the horn and the
specimen.
4. Results
Fig. 8(a) and (b) show a photo of a specimen and a horn and the corresponding
infrared image of the specimen and the horn during ultrasonic welding, respectively, with
15
a welding time of 0.25 sec, a holding time of 0.2 sec and a peak pressure of 2.75 MPa.
The maximum temperature at the surface of the specimen near the horn tip is 50 oC. The
temperature of the horn near the horn tip is 94.8 oC. In fact, the real maximum
temperature of the specimen should occur inside the specimen and may be a bit higher
than 50 oC, but well below the typical glass transition temperature of PEMs, considering
the porous nature of the GDLs and the PEMs. For example, Lin et al. (2009) reported
that a Nafion material used in their experiments has a glass transition temperature of
nearly 125°C. Yazdanpour et al. (2012) pointed out that a microstructure change in the
Nafion membranes can happen when the processing temperature is much higher than the
glass transition temperature gT , therefore an irreversible water uptake loss may ensue.
Osborn et al., (2012) reported that mechanical stability of Nafaion membranes may
deteriorate at temperatures higher than gT . Mathur et al. (2007) and Kusoglu et al.
(2007) suggested that mechanical behavior of PEMs is critical in operation of PEM fuel
cells. From the material viewpoint, an polymer’s stiffness may decrease significantly
when its temperature is increased above its glass transition temperature. Besides, Jung
and Kim. (2012) revealed that thermal heating may cause PEMs to develop a crystalline
morphology that led to reduced water uptake and proton conductivity. In this
investigation, the maximum temperatures of the specimens during ultrasonic welding
were well below the typical glass transition temperature of Nafion materials, 100°C. It is
recognized that the temperature measured in this study represent a measurement over a
certain area and may not be the maximum. Considering the thickness of the specimen
0.21 mm and the porous nature of the materials, it is believed that the maximum
16
temperature of the specimen does not exceed twice that of the measured, 50 oC, and thus
is still far below that of the typical glass transition temperature of Nafion materials.
The tensile test described in the section of Experimental procedures was used as
the criterion of a "good" weld; a "good" weld is defined as one in which the whole nugget
is pulled, leaving a similar sized hole in the other member being joined. Optical
micrographs of the cross sections of the specimens before and after tensile testing were
utilized to examine the quality of the ultrasonic spot welds. There are two competing
failure modes of the welds, the circumferential failure mode (nugget put-out) and the
interfacial failure mode. In the circumferential failure mode, the failure of the spot weld
may be initiated in the upper or lower GDL near the middle of the circumference of the
circular weld, and then propagates along the thickness direction of the weld. In the
interfacial failure mode, the failure occurs via crack propagation through the interface
between the GDL and the PEM. The failure load of the circumferential failure mode is
higher than that of the interfacial failure mode. In this investigation, the ultrasonic spot
welds failed in the circumferential mode are considered successful. The welding time
and the peak pressure are taken as the processing parameters to be optimized for the
ultrasonic welds to fail in the circumferential failure mode under tensile tests.
17
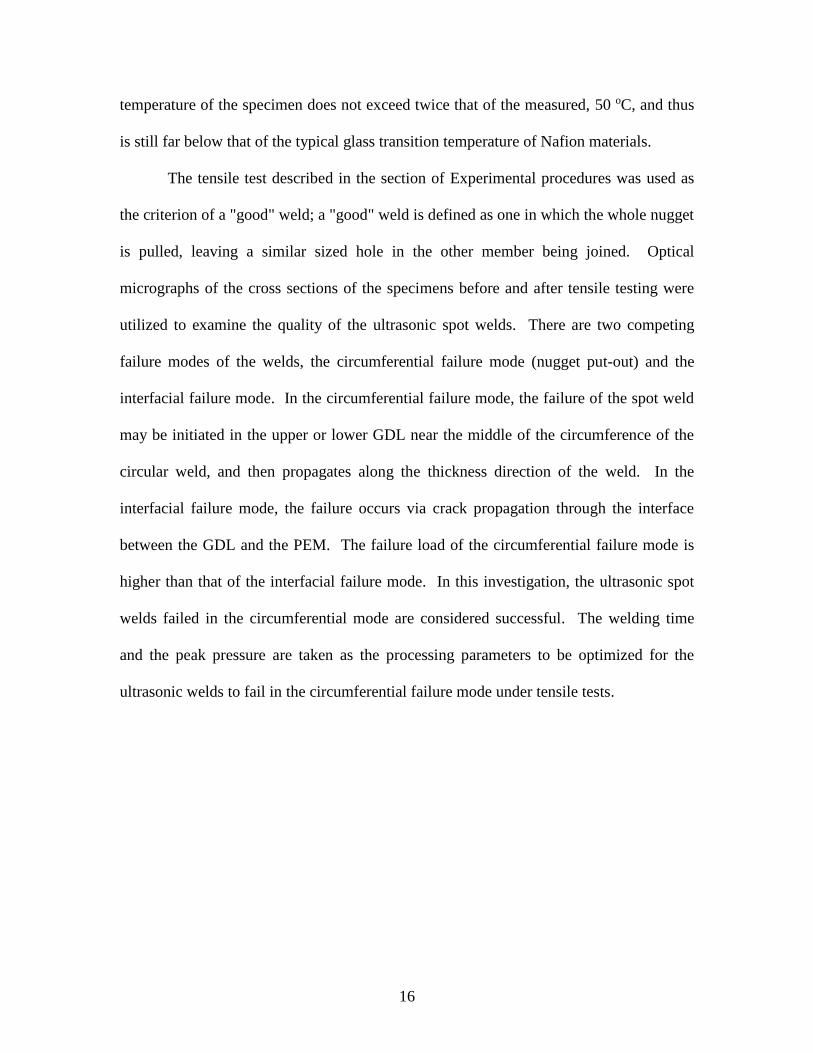
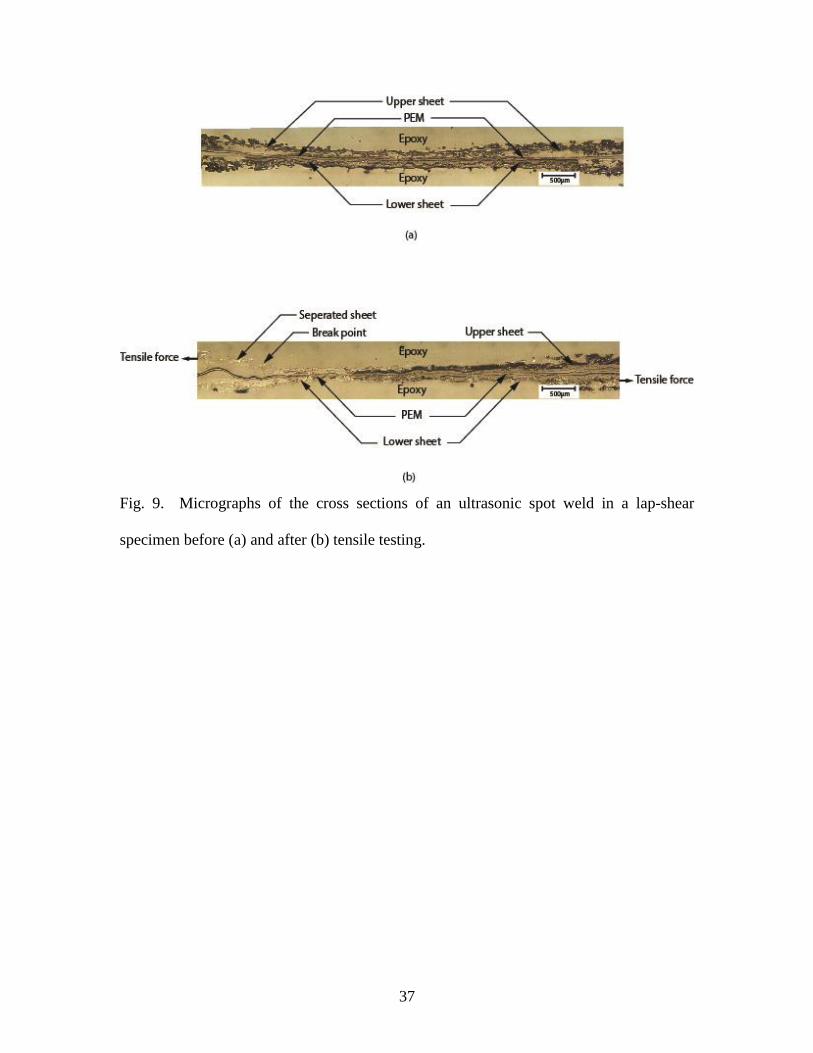
Fig. 9. Micrographs of the cross sections of an ultrasonic spot weld in a lap-shear
specimen before (a) and after (b) tensile testing.
A micrograph of the cross section of an ultrasonic weld before testing is shown in
Fig. 9(a). There is an indentation with a length scale of the diameter of the horn tip.
Outside of this bonding zone, the upper sheet (upper GDL) and the PEM are slighted
bended upward due to the plunging of the ultrasonic horn. The bending of the upper
sheet creates a gap between the PEM and the lower sheet (lower GDL). Near the
intersection of the faying surfaces between the upper sheet and the lower sheet, notches
appear to be formed. Fig. 9(b) shows a micrograph of the cross section of the ultrasonic
spot weld in the failed lap-shear specimen. The direction of the tensile force is indicated
by arrows in the figure. The circumferential failure mode can be seen in the upper sheet
of the specimen. Near the upper left portion of the weld, a crack (marked as break point)
18
in the upper GDL appears to emanate from the tip of the notch tip, and then propagates
through the thickness direction of the upper GDL. However, no breakage can be seen in
the lower right portion of the weld. This can be attributed to the different geometries of
the weld in the upper and the lower GDL.
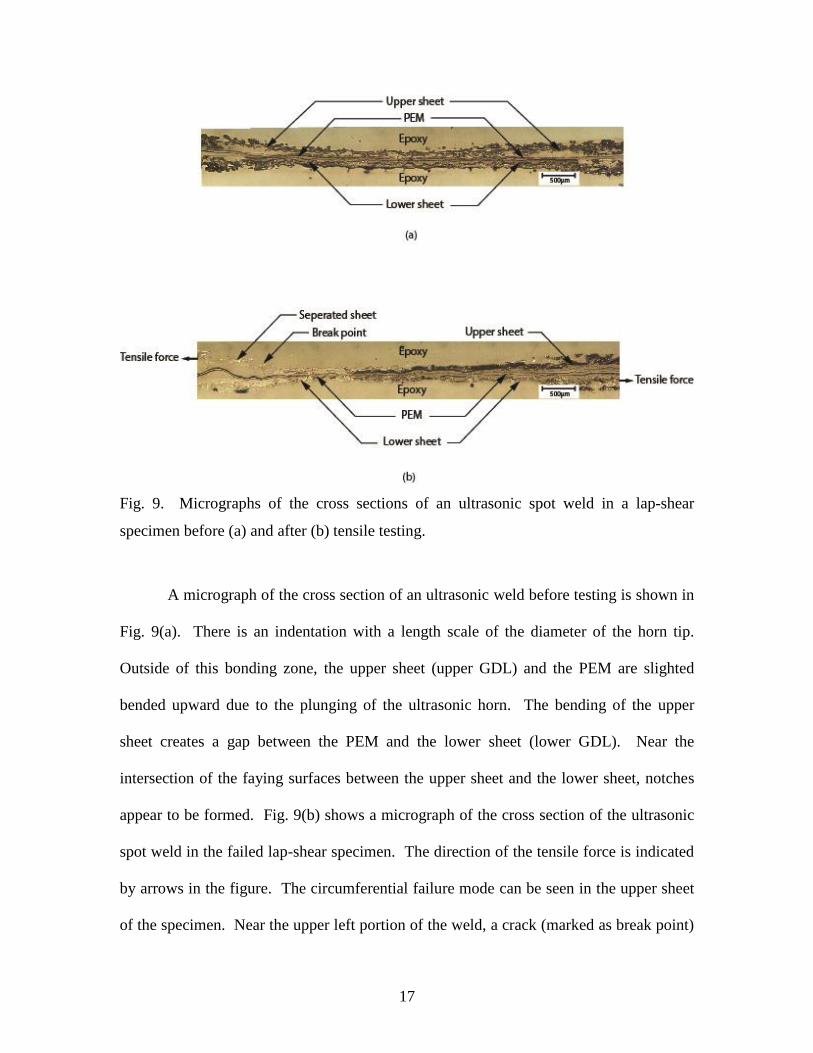
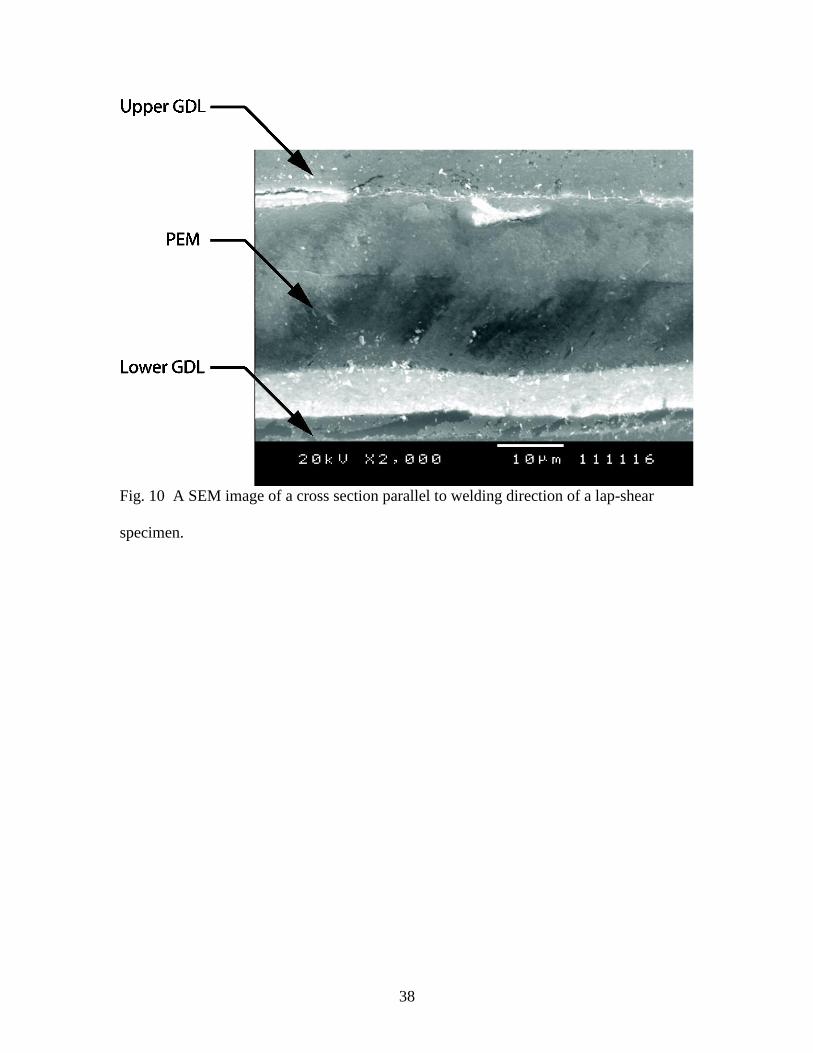
Fig. 10 A SEM image of a cross section parallel to welding direction of a lap-shear
specimen.
Due to the magnification limit of the available microscope, the optical micrograph
has a low resolution. SEM images of the cross section of the welded specimen were
taken in order to examine the continuity of the weld at the interface between the GDLs
and the PEM. Fig. 10 shows a SEM image (scale: 10 m ) of a cross section of an
ultrasonic spot weld in a lap-shear specimen welded using a welding time of 0.25 sec, a
holding time of 0.2 sec and a peak pressure of 2.75 MPa. The upper GDL, the PEM and
19
the lower GDL are marked in the figure. The interfaces between the GDLs and the PEM
in the bonding zone appeared nearly flat and mechanical interlocking can be seen from
the saw-tooth like interface. The mechanical interlocking is considered as an indication
of a sound weld.
\
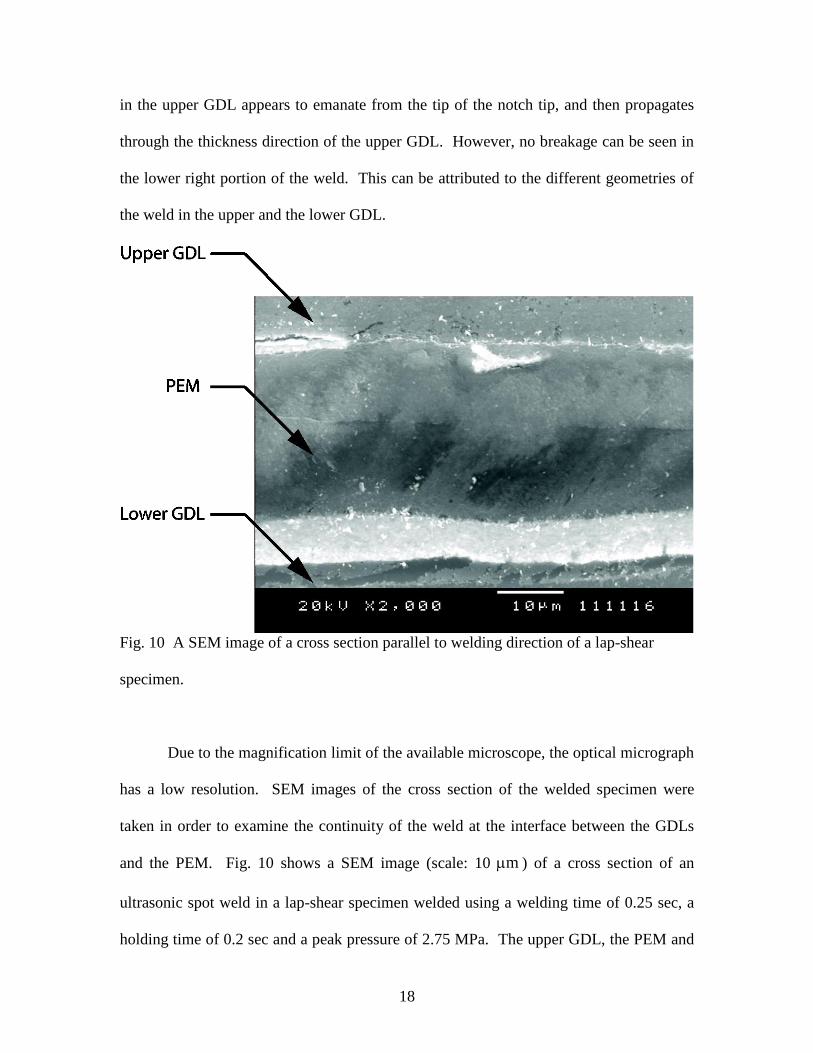
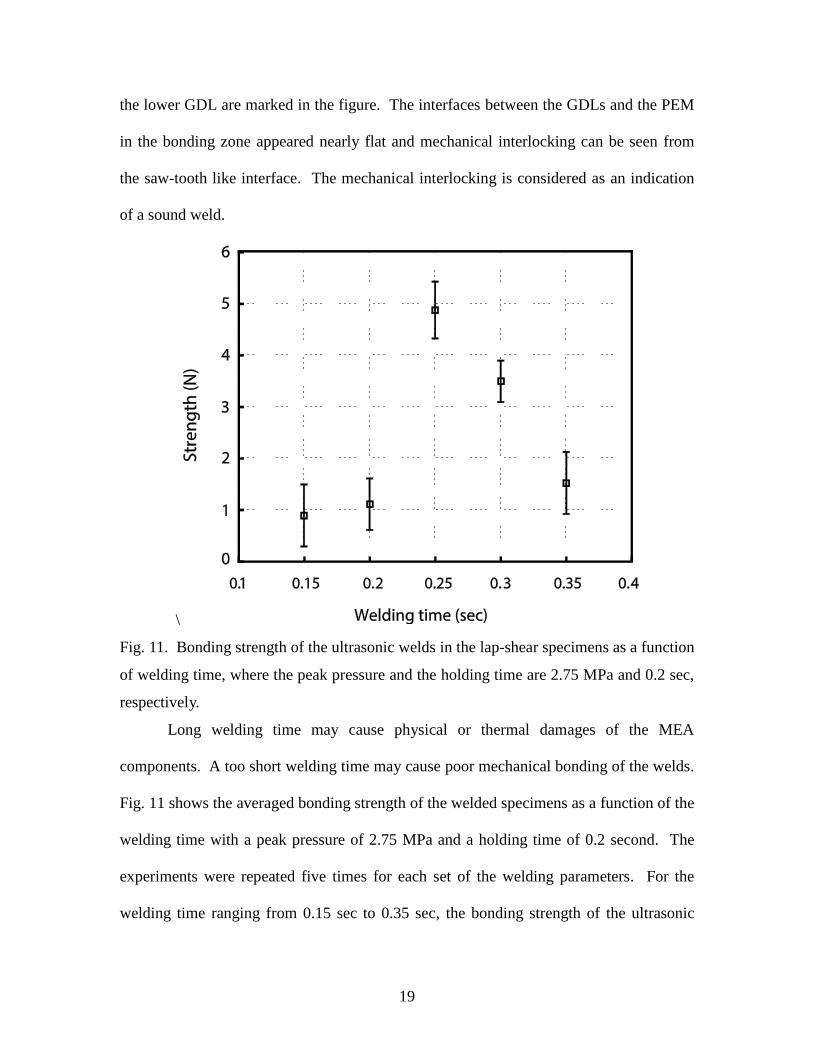
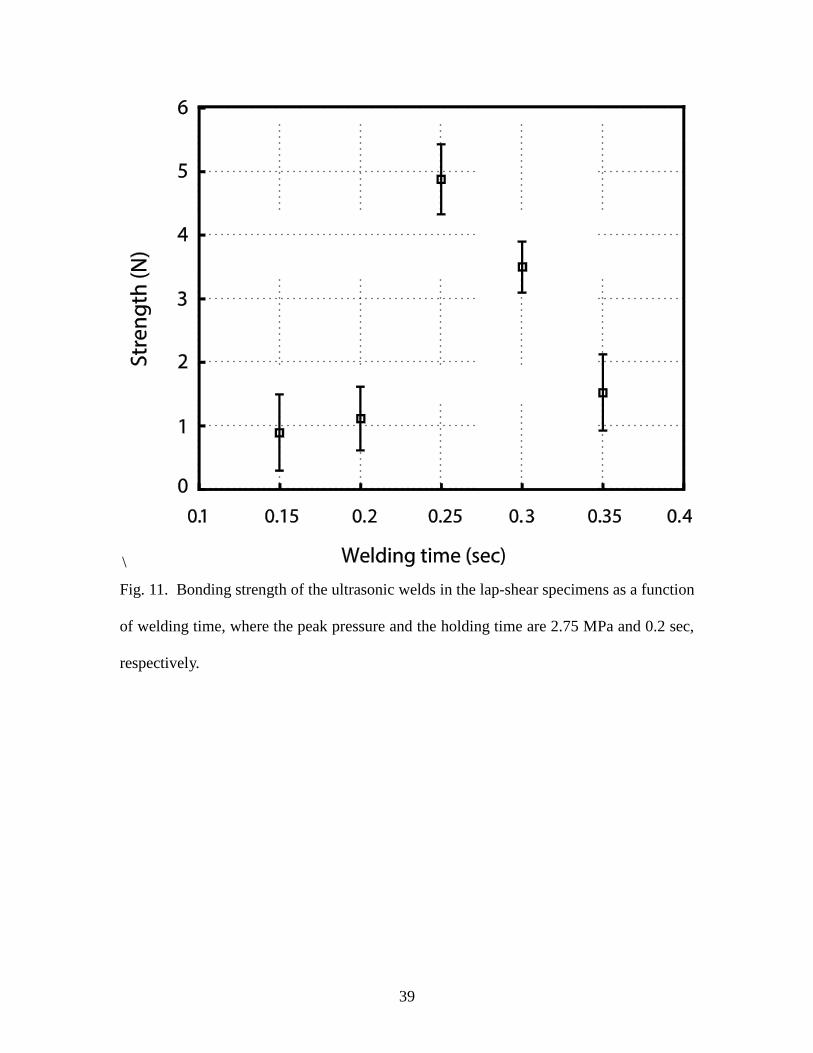
Fig. 11. Bonding strength of the ultrasonic welds in the lap-shear specimens as a function
of welding time, where the peak pressure and the holding time are 2.75 MPa and 0.2 sec,
respectively.
Long welding time may cause physical or thermal damages of the MEA
components. A too short welding time may cause poor mechanical bonding of the welds.
Fig. 11 shows the averaged bonding strength of the welded specimens as a function of the
welding time with a peak pressure of 2.75 MPa and a holding time of 0.2 second. The
experiments were repeated five times for each set of the welding parameters. For the
welding time ranging from 0.15 sec to 0.35 sec, the bonding strength of the ultrasonic
20
welds increases initially, reaches the maximum bonding strength, and then decreases.
The optimum welding times is 0.25 sec under the peak pressure of 2.75 MPa and the
holding time of 0.2 second.
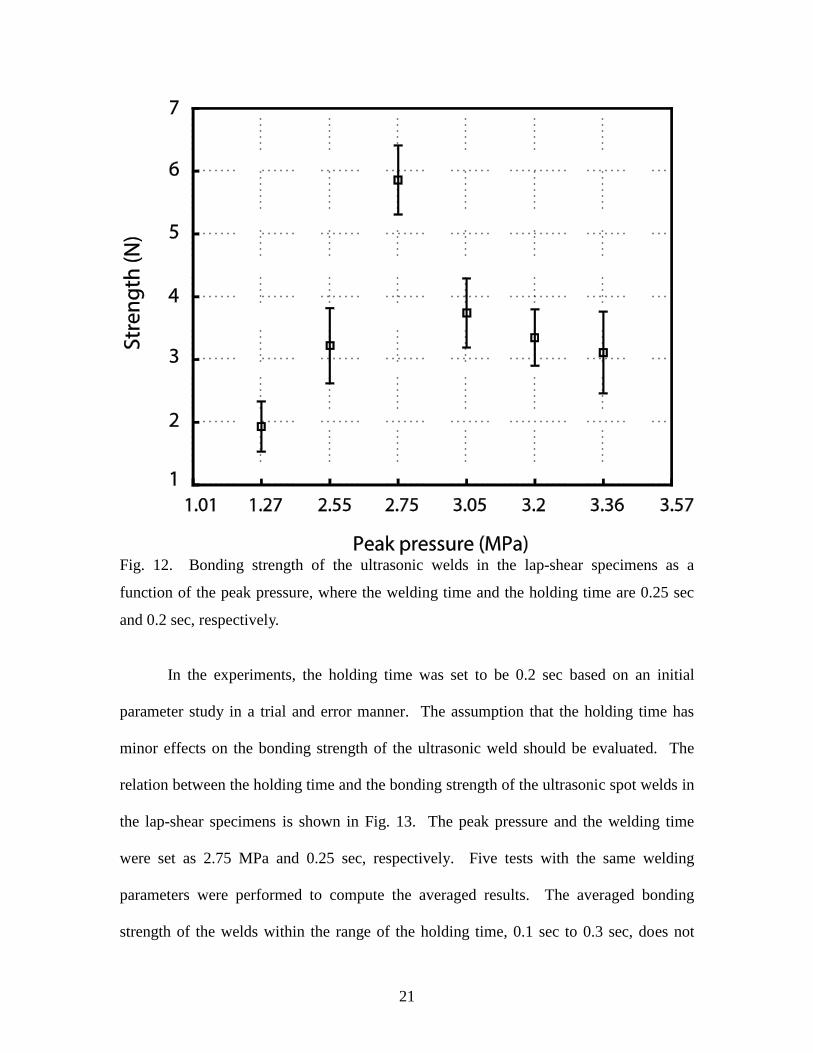
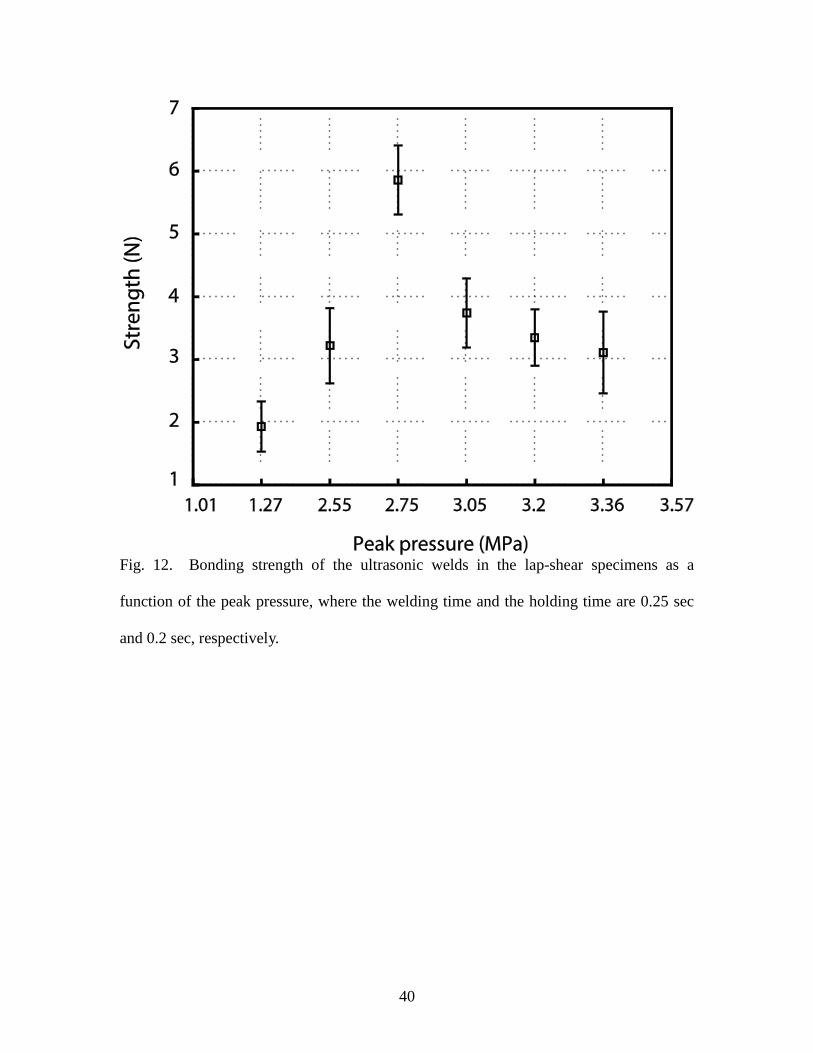
Liang et al. ( 2007) reported that bonding strength between MEA components
depends on the applied pressure. Large deformation of the electrodes occurs under high
pressure and therefore induces porosity loss and large oxygen transfer resistance in the
cathode catalyst layer. Mathur et al. (2007) pointed out that functioning of fuel cells
requires the GDLs to be porous, electronically and ionically conducting, and
electrochemically active. It is critical to investigate the effects of the pressure on the
ultrasonic welded specimens. Fig. 12 shows the bonding strength of the welds as a
function of the peak pressure ranging from 1.27 MPa to 3.36 MPa with a welding time of
0.25 sec and a holding time of 0.2 sec. The value was obtained by averaging the bonding
strengths of five welding tests with the same welding parameters. The optimum peak
pressure is found to be 2.75 MPa. The pressure selected in this investigation is well
below the sealing pressure 4.5 MPa used by Beck et al. (2012) in their ultrasonic bonding
of MEAs.
21
Fig. 12. Bonding strength of the ultrasonic welds in the lap-shear specimens as a
function of the peak pressure, where the welding time and the holding time are 0.25 sec
and 0.2 sec, respectively.
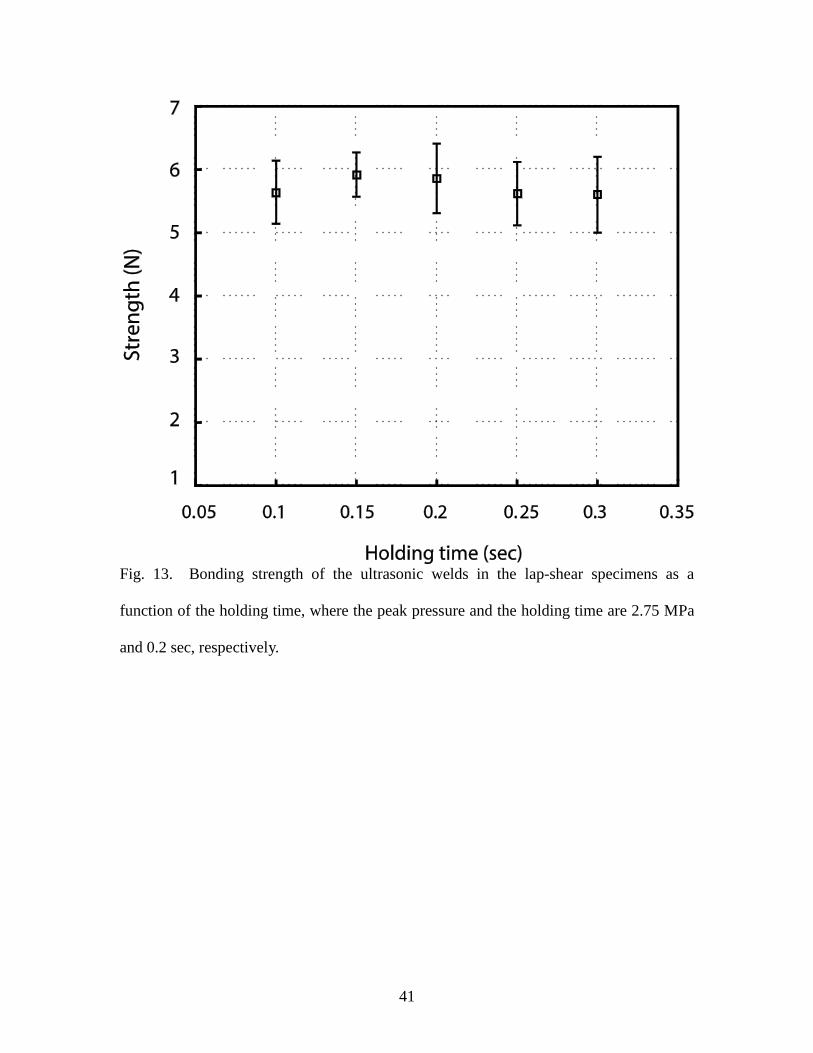
In the experiments, the holding time was set to be 0.2 sec based on an initial
parameter study in a trial and error manner. The assumption that the holding time has
minor effects on the bonding strength of the ultrasonic weld should be evaluated. The
relation between the holding time and the bonding strength of the ultrasonic spot welds in
the lap-shear specimens is shown in Fig. 13. The peak pressure and the welding time
were set as 2.75 MPa and 0.25 sec, respectively. Five tests with the same welding
parameters were performed to compute the averaged results. The averaged bonding
strength of the welds within the range of the holding time, 0.1 sec to 0.3 sec, does not

22
vary to any significant extent. The influence of the holding time on the bonding strength
is minor. The 0.2 sec holding time seems to be a reasonable selection. Holding time
was intended to be long enough for the weld to cool and harden. Given the low
temperature of the specimen during the welding, the holding time was conceived to be a
less significant factor.
Fig. 13. Bonding strength of the ultrasonic welds in the lap-shear specimens as a
function of the holding time, where the peak pressure and the holding time are 2.75 MPa
and 0.2 sec, respectively.
Ram et al. (2007) reported that ultrasonic bonding is generally attributed to one or
more of the following mechanisms: mechanical interlocking, interfacial melting,
23
interfacial atomic forces, and interfacial chemical reactions. In the content of the
ultrasonic welds of the polymeric materials, GDLs and PEMs, mechanical interlocking is
believed to be responsible for the excellent bonding of the GDLs and PEMs. Interfacial
melting due to friction heat generation between the dissimilar materials may not be the
major contributor of the bonding with the low bonding temperature observed in the
experiments (see the infrared image shown in Fig. 8(b), where the maximum temperature
at the surface of the specimen near the horn tip is 50 oC, well below the typical glass
transition temperature of Nafion materials, 100°C. Hazlett and Ambekar (1970) reported
that interfacial atomic forces (nascent bonding) is evidenced in the bonds in which the
interface disappeared. Disappearance of interface is not observed in the specimens and
therefore the interfacial atomic forces were not considered as the cause of the bonding
mechanism in this particular study. The presence of the interfacial chemical reaction is
indicated by diffusion with a full range of phases (Hazlett and Ambekar, 1970). It
appeared that diffusion did not occur across the interface in the specimens. It may be
concluded that the ultrasonic bonding between the particular GDL and PEM was not
caused by interfacial chemical reactions.
Based on the parametric study, the optimum values of the peak pressure and the
welding time were 2.75 MPa and 0.25 sec, respectively. With the aid of the ultrasonic
vibration of 35 kHz, short welding time and low power consumption for bonding GDLs
to PEMs were achieved. The mechanical bond was examined by SEM images. These
electron micrographic studies indicate that, for the particular GDL and PEM, there was
limited evidence of melting across the bond interface and there was mechanical
interlocking of the GDL and the PEM achieved by the short welding time.
24
5. Conclusions
Two important processing parameters in determining ultrasonic weld quality of a
carbon paper and a proton exchange membrane of fuel cells as determined by the tensile
test are the welding time and the pressure.
Using the ultrasonic welding system in this investigation, the optimum welding time
and the peak pressure are 0.25 sec and 2.75 MPa, respectively. The holding time has no
significant effect on the bonding strength of the welds in the lap-shear specimens and the
holding time 0.2 sec seems to be a reasonable selection.
Base on observations from the SEM image of the weld, mechanical interlocking is
conceived as a major contributing factor of the ultrasonic bonding.
Acknowledgement
This work is supported by a grant from Ministry of Science and Technology,
Taiwan, ROC, under Grant: MOST 105-2221-E-005-060. The assistance from the
National Center for High-Performance Computing (NCHC), Taiwan is appreciated.
25
References
Beck, J., Walczyk, D., Buelte, S., and Hoffman, C., 2013. Comparison of performance
losses between ultrasonic and thermal bonding of membrane electrode assemblies in
proton exchange membrane fuel cells. J. Fuel Cell Sci. Technol. ASME 10, 041004.
Beck, J., Walczyk, D., Hoffman, C., and Buelte, S., 2012. Ultrasonic bonding of
membrane electrode assemblies for low temperature proton exchange membrane
FCs. J. Fuel Cell Sci. Technol. ASME 9 , 051005.
Fuel Cells Bulletin, 2017. Toshiba 100 kW fuel cell will use hydrogen from plastics
recycling. Fuel Cells Bulletin 6, 6.
Hack, J., Heenan, T.M.M., Iacoviello, F., Mansor, N., Meyer, Q., Shearing, P., Brandon,
N., and Brett, D.J.L., 2018. A Structure and Durability Comparison of Membrane
Electrode Assembly Fabrication Methods: Self-Assembled Versus Hot-Pressed.
Journal of The Electrochemical Society 165, F3045-F3052.
Hazlett, T.H. and Ambekar, S.M., 1970. Additional studies on interface temperatures and
bonding mechanisms of ultrasonic welds. Welding Journal, May 1970, 196s-200s.
Jung, H.Y. and Kim, J.W., 2012. Role of the glass transition temperature of Nafion 117
membrane in the preparation of the membrane electrode assembly in a direct
methanol fuel cell (DMFC). Int. J. Hydrogen Energy 37, 12580 – 12585.
Kelly, G.S., Just Jr., M.S., Advani, S.G. and Gillespie Jr., J.W., 2014. Energy and bond
strength development during ultrasonic consolidation. J. Mater. Process. Technol.
214, 1665-1672.
Kim, K.H., Lee, K.Y., Kim, H.J., Cho, E.A., Lee, S.Y., and Lim, T.H., 2010. The effects
of Nafion ionomer content in PEMFC MEAs prepared by a catalyst-coated
membrane (CCM) spraying method. Int. J. Hydrogen Energy 35, 2119-2126.
Kusoglu, A., Karlsson, A.M., Santare, M.H., Cleghorn, S. and Johnson, W.B., 2007.
Mechanical behavior of fuel cell membranes under humidity cycles and effect of
swelling anisotropy on the fatigue stresses. J. Power Sources 170, 345–358.
Liang, Z.X., Zhao, T.A., Xu, C. and Xu, J.B., 2007. Microscopic characterizations of
membrane electrode assemblies prepared under different hot-pressing conditions.
Electrochim. Acta 53, 894-902.
Lin, J.C., Lai, C.M., Ting, F.P., Chyou, S.D. and Huseh, K.L., 2009. Influence of hot-
26
pressing temperature on the performance of PEMFC and catalytic activity. J. Appl.
Electrochem. 39, 1067-1073.
Litster, S. and McLean, G., 2004. PEM fuel cell electrodes. J. Power Sources 130, 61–76.
Mathur, R.B., Maheshwari, P.H., Dhami, T.L. and Tandon, R.P., 2007. Characteristics of
the carbon paper heat-treated to different temperatures and its influence on the
performance of PEM fuel cell. Electrochim. Acta 52, 4809-4817.
Meyer Q., Mansor, N., Iacoviello, F., Cullen, P.L., Jervis, R., Finegan, D., Tan, C., Bailey,
J., Shearing, P.R. and Brett, D.J.L., 2017. Investigation of hot pressed polymer
electrolyte fuel cell assemblies via X-ray computed tomography. Electrochimica
Acta 242, 125-136.
Nguyen, H.T., Nguyen, H.D., Uan, J.Y. and Wang, D.A., 2014. A nonrational B-spline
profiled horn with high displacement amplification for ultrasonic welding.
Ultrasonics 54, 2063-2071.
Osborn, S.J., Hassan, M.K., Divoux, G.M., Rhoades, D.W., Mauritz, K.A. and Moore,
R.B., 2007. Glass Transition Temperature of Perfluorosulfonic Acid Ionomers.
Macromolecules 40, 3886-3890.
Owens, B. and McGuinness, J., 2015. GE-fuel cells: The power of tomorrow.
Ecomagination 2015. General Electric Company.
Ram, G.D.J., Yang, Y., Nylander, C., Aydelotte, B., Stucker, B.E. and Adams, B.L., 2007.
Interface microstructures and bond formation in ultrasonic consolidation.
Proceedings of the 17th Annual International Solid Freeform Fabrication
Symposium, Austin, TX, Aug. 6-8, 2007, pp. 266-283.
Rani, M.R. and Rudramoorthy, R., 2013. Computational modeling and experimental
studies of the dynamic performance of ultrasonic horn profiles used in plastic
welding. Ultrasonics 53, 763-772.
Romdhane, J. and Louahlia-Gualous, H., 2018. Energy assessment of PEMFC based
MCCHP with absorption chiller for small scale French residential application,
International Journal of Hydrogen Energy, https://doi.org/10.1016/
j.ijhydene.2018.08.132.
Satyapal, S., 2018. U.S. Department of Energy Hydrogen and Fuel Cell Technology
Overview. Presented at The 14th International Hydrogen and Fuel Cell Expo (FC
27
EXPO 2018), Tokyo, Japan, February 28 - March 2, 2018.
Tang, Y., Kusoglu, A., Karlsson, A.M., Santare, M.H., Cleghorn, S. and Johnson, W.B.,
2008. Mechanical properties of a reinforced composite polymer electrolyte
membrane and its simulated performance in PEM fuel cells. J. Power Sources 175,
817–825.
Towne, S., Viswanathan, V., Holbery, J. and Rieke, P., 2007. Fabrication of polymer
electrolyte membrane fuel cell MEAs utilizing inkjet print technology. J. Power
Sources 171, 575–584.
Truckenmuller, R., Ahrens, R., Cheng, Y., Fischer, G. and Saile, V., 2006. An ultrasonic
welding based process for building up a new class of inert fluidic microsensors and
actuators from polymers. Sens. Actuators A Phys. 132, 385-392.
Yazdanpour, M., Esmaeilifar, A. and Rowshanzamir, S., 2012. Effects of hot pressing
conditions on the performance of Nafion membranes coated by ink-jet printing of
Pt/MWCNTs electrocatalyst for PEMFCs. Int. J. Hydrogen Energy 37, 11290-11298.
Yoshida, T. and Kojima, K., 2015. Toyota MIRAI Fuel Cell Vehicle and Progress Toward
a Future Hydrogen Society. The Electrochemical Society Interface, Summer 2015,
45-49.
28
List of figures
Fig. 1 Schematic of an ultrasonic welding system.
Fig. 2 A close up view of a horn and a specimen.
Fig. 3 Three step operation of the ultrasonic spot welding.
Fig. 4. A schematic of a lap-shear specimen and the applied force P shown as the bold
arrows.
Fig. 5. Process parameters.
Fig. 6. (a) Dimensions of an ultrasonic horn. (b) A cross sectional view of an ultrasonic
weld. The bonded region is represented by the thick lines at the interfaces between the
PEM and the GDLs.
Fig. 7. (a) A schematic of experimental setup for ultrasonic spot welding. (b) A photo
of the experimental setup.
Fig. 8. (a) A photo of a horn and a specimen. (b) An infrared image of the horn and the
specimen.
Fig. 9. Micrographs of the cross sections of an ultrasonic spot weld in a lap-shear
specimen before (a) and after (b) tensile testing.
Fig. 10. A SEM image of a cross section parallel to welding direction of a lap-shear
specimen.
Fig. 11. Bonding strength of the ultrasonic welds in the lap-shear specimens as a function
of welding time, where the peak pressure and the holding time are 2.75 MPa and 0.2 sec,
respectively.
Fig. 12. Bonding strength of the ultrasonic welds in the lap-shear specimens as a function
of the peak pressure, where the welding time and the holding time are 0.25 sec and 0.2
sec, respectively.
Fig. 13. Bonding strength of the ultrasonic welds in the lap-shear specimens as a function
of the holding time, where the peak pressure and the holding time are 2.75 MPa and 0.2
sec, respectively.
29
Fig. 1. Schematic of an ultrasonic welding system.
30
Fig. 2. A close up view of a horn and a specimen.
31
Fig. 3. Three step operation of the ultrasonic spot welding.
32
Fig. 4. A schematic of a lap-shear specimen and the applied force P shown as the bold
arrows.
33
Fig. 5. Process parameters.
34
Fig. 6. (a) Dimensions of an ultrasonic horn. (b) A cross sectional view of an ultrasonic
weld. The bonded region is represented by the thick lines at the interfaces between the
PEM and the GDLs.
35
Fig. 7 (a) A schematic of experimental setup for ultrasonic spot welding. (b) A photo of
the experimental setup.
36
Fig. 8. (a) A photo of a horn and a specimen. (b) An infrared image of the horn and the
specimen.
37
Fig. 9. Micrographs of the cross sections of an ultrasonic spot weld in a lap-shear
specimen before (a) and after (b) tensile testing.
38
Fig. 10 A SEM image of a cross section parallel to welding direction of a lap-shear
specimen.
39
\
Fig. 11. Bonding strength of the ultrasonic welds in the lap-shear specimens as a function
of welding time, where the peak pressure and the holding time are 2.75 MPa and 0.2 sec,
respectively.
40
Fig. 12. Bonding strength of the ultrasonic welds in the lap-shear specimens as a
function of the peak pressure, where the welding time and the holding time are 0.25 sec
and 0.2 sec, respectively.
41
Fig. 13. Bonding strength of the ultrasonic welds in the lap-shear specimens as a
function of the holding time, where the peak pressure and the holding time are 2.75 MPa
and 0.2 sec, respectively.