Embed Size (px)
Citation preview
Ultrasonic refining of chemical pulp fibres
Master of Science Thesis in Innovative and Sustainable Chemical
Engineering
ANNA JOSEFSSON
Department of Chemical and Biological Engineering
Forest Products and Chemical Engineering
CHALMERS UNIVERSITY OF TECHNOLOGY
Göteborg, Sweden, 2010
Ultrasonic refining of chemical pulp fibres
ANNA JOSEFSSON
© ANNA JOSEFSSON, 2010
Department of Chemical and Biological Engineering
Chalmers University of Technology
SE-412 96 Göteborg
Sweden
Telephone + 46 (0)31-772 1000
The master thesis was performed in cooperation with Södra Innovation, Väröbacka
Sweden.
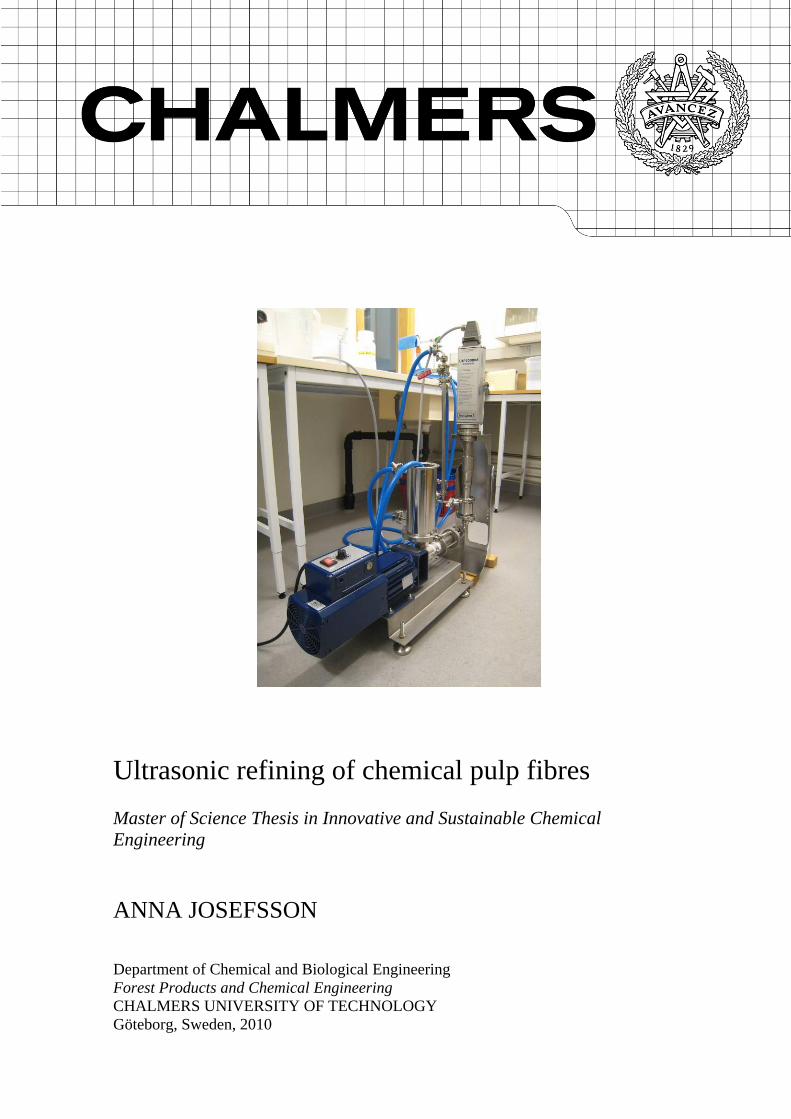
Cover:
The picture shows the ultrasonic equipment which was used in the experiments of this
thesis, see pages 5 and 6 for information. Photographed by Anna Josefsson.
The Department of Chemical and Biological Engineering
Chalmers University of Technology
Göteborg, Sweden 2010
Ultrasonic refining of chemical pulp fibres
ANNA JOSEFSSON
Department of Chemical and Biological Engineering
Chalmers University of Technology
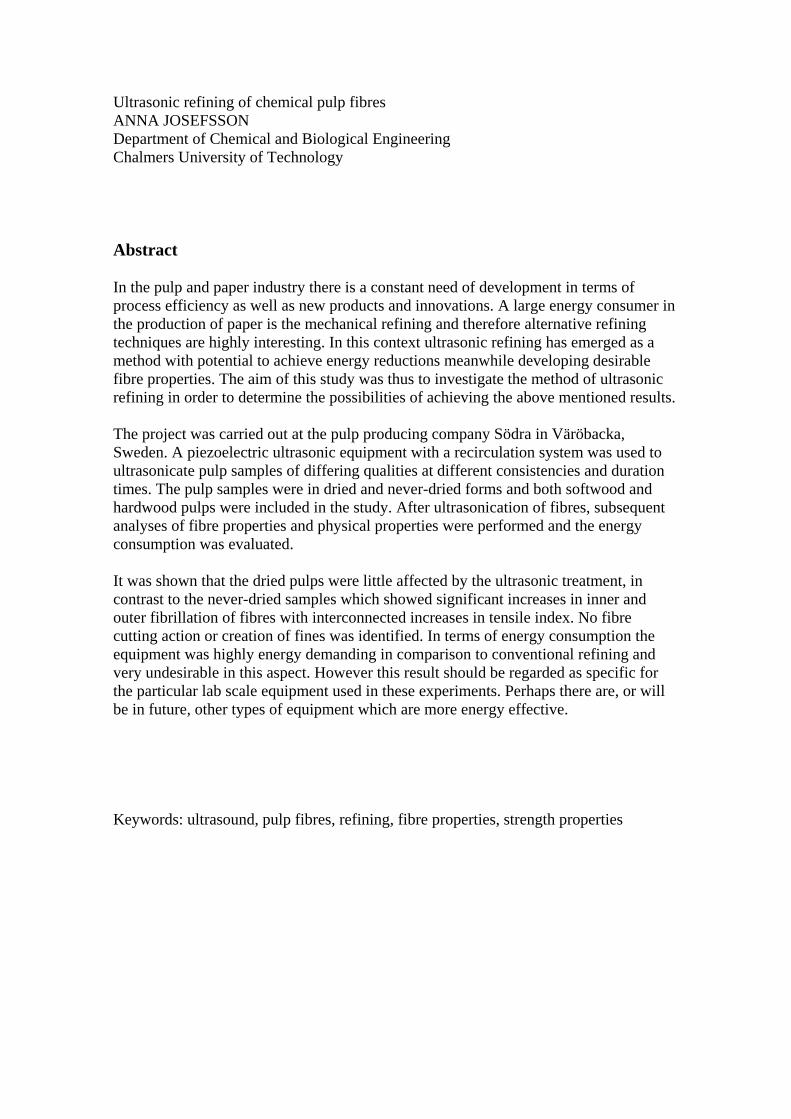
Abstract
In the pulp and paper industry there is a constant need of development in terms of
process efficiency as well as new products and innovations. A large energy consumer in
the production of paper is the mechanical refining and therefore alternative refining
techniques are highly interesting. In this context ultrasonic refining has emerged as a
method with potential to achieve energy reductions meanwhile developing desirable
fibre properties. The aim of this study was thus to investigate the method of ultrasonic
refining in order to determine the possibilities of achieving the above mentioned results.
The project was carried out at the pulp producing company Södra in Väröbacka,
Sweden. A piezoelectric ultrasonic equipment with a recirculation system was used to
ultrasonicate pulp samples of differing qualities at different consistencies and duration
times. The pulp samples were in dried and never-dried forms and both softwood and
hardwood pulps were included in the study. After ultrasonication of fibres, subsequent
analyses of fibre properties and physical properties were performed and the energy
consumption was evaluated.
It was shown that the dried pulps were little affected by the ultrasonic treatment, in
contrast to the never-dried samples which showed significant increases in inner and
outer fibrillation of fibres with interconnected increases in tensile index. No fibre
cutting action or creation of fines was identified. In terms of energy consumption the
equipment was highly energy demanding in comparison to conventional refining and
very undesirable in this aspect. However this result should be regarded as specific for
the particular lab scale equipment used in these experiments. Perhaps there are, or will
be in future, other types of equipment which are more energy effective.
Keywords: ultrasound, pulp fibres, refining, fibre properties, strength properties

Preface
This master thesis was performed in the spring 2010 at the pulp producing company
Södra´s unit for research and development, Södra Innovation, in Väröbacka Sweden.
The supervisors for the project were Karin Sjöström and Jon Tore Eriksen at Södra
Innovation and Harald Brelid at Chalmers Forest Products and Chemical Engineering.
First of all I would like to thank Södra and the people there who accepted me as a
master thesis worker in the company. I really enjoyed my time at Södra and it was a
very instructive experience to get in touch with the world outside university. The work
with ultrasonic refining of pulp fibres was sometimes a big challenge but even though
difficulties occurred it was always interesting and exciting to be within the project and
its open-ended nature was highly stimulating.
I am very thankful to all of my supervisors who helped me to complete this project and
contributed with their expertise. Especially Karin Sjöström, main supervisor at Södra,
who always had time for my questions and discussion of results, owes to be thanked a
lot. I would also like to thank all the people at the Södra Innovation pulp lab who helped
me with various matters and kindly responded to my questions.
I am grateful to Malgorzata at the Innovation pulp lab, who taught me how to perform
the different analyses on pulp fibres, and the mechanics Mats and Sten-Gunnar, whom
helped me with questions related to the ultrasonic equipment. In addition I would also
like to thank Fredrik at Chalmers Forest Products and Chemical Engineering, who
taught me how to use electron microscopy.
Table of contents
1. Introduction ................................................................................................................ 1
2. Theoretical background ............................................................................................. 2
2.1. Refining of pulp ................................................................................................... 2
2.2. Ultrasound ............................................................................................................ 3
2.2.1. Principles ........................................................................................................ 3
2.2.2. Characteristics ................................................................................................ 3
2.2.3. Cavitation ....................................................................................................... 4
2.2.4. Factors affecting cavitation ............................................................................ 4
2.2.5. Equipment ....................................................................................................... 5
2.3. Analyses ................................................................................................................ 6
2.3.1. Water retention value...................................................................................... 7
2.3.2. Schopper-Riegler number ............................................................................... 7
2.3.3. Tensile index .................................................................................................. 7
2.3.4. Fibre properties ............................................................................................... 8
2.3.5. Scanning electron microscopy ........................................................................ 8
2.4. Literature study ................................................................................................... 8
3. Experimental ............................................................................................................. 11
3.1. Pulp qualities ...................................................................................................... 11
3.2. Experiment 1 ...................................................................................................... 11
3.3. Experiment 2 ...................................................................................................... 12
3.4. Analysis ............................................................................................................... 13
3.4.1. Physical testing ............................................................................................. 13
3.4.2. Fibre properties ............................................................................................. 14
3.4.3. SEM .............................................................................................................. 14
3.5. Energy aspects ................................................................................................... 14
4. Results and discussion .............................................................................................. 15
4.1 Physical properties ............................................................................................. 15
4.1.1. WRV ............................................................................................................. 15
4.1.2. Tensile index ................................................................................................ 16
4.1.3. Schopper-Riegler number ............................................................................. 19
4.2. Fibre properties ................................................................................................. 20
4.3. SEM microphotographs .................................................................................... 24
4.4. Energy consumption .......................................................................................... 31
5. Conclusion ................................................................................................................. 33
6. Suggestions for future work .................................................................................... 34
References ..................................................................................................................... 35
Appendices .................................................................................................................... 37
1
1. Introduction
Paper is an important product in the industrial society and it is used every day in many
different applications. Ever since the first paper was produced in China, in 100 AD, the
paper has come to increase its importance in our lives and world overall paper usage is
still increasing. To exemplify, the most widely used wrapping and packaging material is
paper and paper also has an invaluable role in terms of information handling. [1]
Paper is made from pulp, which is usually of vegetable origin in the form of wood. [1]
In Sweden, the forest resource is of major importance in many aspects and it has both
ecological and economical values. Focusing on the industrial use of the forest resource,
wood can be used in many different applications among which the pulp and paper
industry is a large consumer.
One actor in the Swedish forest market is Södra Skogsägarna, an economical
association for forest owners in the south of Sweden. In addition to forest resources, the
association owns a group of companies producing forest products within four different
business areas. The business areas are sawn and planed timber goods, interior products,
paper pulp and biofuel. Besides the forest products Södra is also a producer of green
electricity. [2]
The production of pulp and paper is a large energy consumer. One energy consuming
step in the production of paper is the refining, which is used to develop desirable fibre
properties in pulp before it is used in the paper machine for production of paper.
Methods for achievement of either energy reductions in the refining process or
development of suitable fibre properties are therefore highly interesting. Due to this
fact, Södra Innovation, which is the division for research and development within the
Södra group, are interested in investigation of alternatives to conventional refining.
An alternative to conventional refining is ultrasonic refining, which is a method not yet
taken into use in industry. The technique has showed potential in the refining process as
the ultra waves are relatively gentle to the fibres and do result in increased fibrillation
without fibre cutting action [e.g. 3]. However, even though promising results have been
recorded, previous research studies are non-consistent, showing mixed results on pulp
properties after ultrasonication. In addition, inefficient usage of energy and the
method’s uncommonness has so far contributed to the absence of success for ultrasonics
in industrial refining. [4] Therefore many questions about ultrasonic refining are still
without answer and further research studies are of interest.
This master thesis was run in cooperation with Södra Innovation in Väröbacka, Sweden.
The overall purpose of the thesis was to investigate the method of ultrasonic refining to
give the possibility of providing pulp customers with up to date information in the
refining area. The project consisted of a literature study as well as experimental trials on
sonication of pulp with lab scale ultrasonic equipment.
2
2. Theoretical background
To give a fundamental understanding of the method of ultrasonic refining the basic
principles of ultrasound technology and equipment were studied. The aim of
conventional refining and its effects on the cellulosic fibres was also studied. Another
important part of the project was a literature study which aimed to give an overview of
what has been done in previous research studies on ultrasonic refining of pulp fibres.
The literature study provided an opportunity to evaluate and support the results obtained
in this project in a proper way.
2.1. Refining of pulp
The main target of refining of pulp is to improve the bonding ability of fibres. The
reason why this is desirable is that an improved bonding ability between fibres results in
a paper product with a good strength, smooth surface and good printing properties.
Another aim of refining, depending on the specific type of product to be produced from
the pulp, can sometimes be to shorten the fibres through fibre cutting. But even though
short fibres are suitable in some applications fibre cutting is not always desirable. [5]
Mechanical refining usually takes place at a consistency of about 3-5%. The refining
action is achieved in the gap between a stator and a rotor with bars and grooves. More
specifically the refining takes place at the so called leading edges of the refiner where
fibre flocs, to a large extent consisting of water, are assembled. When the leading edge
of the rotor approaches the leading edge of the stator the fibre flocs are compressed and
water is pressed out of them. What happens then is that the shorter fibres will flow into
the grooves between the bars and the longer fibres will get refined by the metallic bars.
After refining the fibres have collapsed and are made more flexible, having an improved
bonding ability. However not all fibres will be subjected to the refining action. In
addition it should be noted that in the context of refining action the exact procedure of
the refining process is still until this day unknown. [5]
The most important effects of refining on the fibre are as follows [5]:
- Cutting and shortening of fibres
- Fines production, complete removal of parts from fibre walls
- External fibrillation, partial removal of fibre wall
- Internal changes in fibre wall structure (fibrillation, swelling…)
- Curling or straightening of fibres
- Creation of nodes, kinks, slip planes, microcompressions
- Dissolving/leaching of colloidal material
- Redistribution of hemicelluloses
- Abrasion of fibre surface at molecular level
The effect of refining on paper properties are as follows [5]:
- Increased drainage resistance
- Increased tensile strength, tensile stiffness, burst strength, internal bonding strength
and fracture toughness
- Tear strength softwood: slightly improved first, then decreased
- Tear strength hardwood: significantly improved first, then decreased
- Air permeability, bulk, absorbency, opacity, light scattering decreases
- Brightness slightly decreases
3
2.2. Ultrasound
Ultrasound has a broad range of applications and is used in several businesses and
sectors. Perhaps one of the most widely recognized applications is that of ultrasonic
imaging in medicine. Another well known application is in the echo technique SONAR.
[6] Other applications are for example in the food industry for emulsification and
disinfection and in inks and paints production for particle size reduction and dispersion
[7]. Ultrasound has also showed potential for utilisation in various applications in the
pulp and paper industry, for example in the refining of pulp fibres [4].
2.2.1. Principles
Ultrasound is defined as sound of a higher frequency than that to which the human ear
can respond. The range of human hearing is restricted from 20 Hz to 20 kHz, which
implies that ultrasound is sound of a frequency higher than 20 kHz. The upper limit of
ultrasound is not sharply defined but it is often taken as 5 MHz for gases and 500 MHz
in liquids and solids respectively. [8]
To further define the range of ultrasonic frequencies, ultrasound can be divided into two
different categories; diagnostic ultrasound and power ultrasound. Diagnostic ultrasound
is sound of the lower power and higher frequency, 2-10 MHz, which is the non-
destructive form of ultrasound. The diagnostic ultrasound is used in for example
ultrasonic imaging. The other category of ultrasound, power ultrasound, is sound of
higher energy or lower frequency, constricted to the interval 20-100 kHz. Power
ultrasound is used in applications such as cleaning, plastic welding and sonochemistry
and it is this kind of ultrasound that is used in the experiments of this study. [9]
2.2.2. Characteristics
Ultrasound has the properties of a wave. It is transmitted through all media possessing
elastic properties by setting molecules into motion, making them vibrate around their
original position. The sound wave propagates through the medium as the vibratory
motion is transferred from one molecule to another adjacent molecule. When a molecule
has transferred its kinetic energy to another molecule it will return to the original
position. [10]
In liquids and gases the propagation of sound waves takes place only in the longitudinal
direction, in contrast to solids where transversal waves can emerge due to shear
elasticity. When a sound wave is followed by another sound wave this will result in an
oscillation, which means that the molecules of the medium move forwards and
backwards around their original position. This phenomenon gives rise to alternating
regions of compression and rarefaction in the medium. In one moment there will be an
excess (compression) of particles in a specific region meanwhile in another moment
there is a deficiency (rarefaction) in the same place due to oscillation. As a result of
these effects the pressure varies with time over the sound wave propagation area; in
compression areas the pressure is higher than normal and in the rarefaction regions it is
lower than normal. These regions of alternating pressures give rise to a phenomenon
called cavitation, which is taken advantage of in many industrial applications of
ultrasound. [10]
4
2.2.3. Cavitation
Cavitation is a phenomenon created by high intensity sound waves in liquids when the
attractive forces of liquid molecules are overcome. The phenomenon takes place in
regions of rarefaction, where low pressure emerges. At sufficiently high intensities of
the sound wave the pressure in rarefaction regions is low enough to overcome the
attractive forces of the liquid molecules and formation of gas-filled cavities takes place.
[11]
Depending on the purity of the liquid the magnitude of the low pressure needed to
overcome the attractive forces of the liquid and form cavities varies. It is claimed that in
a completely pure liquid it is impossible to achieve cavitation with the transducers
available today. However real liquids are not completely pure and therefore cavitation
takes place more easily. This is due to existing impurities in a real liquid, e.g. dissolved
gas and impurities, which act as weak spots and starting points for bubble formation.
[11]
When a cavity is formed it will absorb energy from the oscillation cycles, resulting in
contraction and growing of the bubble. Some cavities are stable and last for many cycles
meanwhile they oscillate in size; other cavities are referred to as transient and grow in
size for each compression cycle until they finally implode. Implosion takes place at very
high temperatures, around 5500 K, and pressures, about 1000 atm, which result in the
generation of a jet stream moving at a velocity of 400 km/hr. The implosion proceeds in
a spherical, symmetrical, way in liquids if it does not take place close to a surface.
When a cavitation is imploding close to a surface it will in contrast be directed at the
surface, which is the reason why ultrasound is very powerful in applications such as
cleaning surfaces. [11] This is also a property which gives potential for ultrasound in the
refining of pulp fibres.
2.2.4. Factors affecting cavitation
The factors affecting the cavitation process are physical properties of the cavitating
medium and the ultrasonic field [11].
The properties of the medium exposed to ultrasonication affects cavitation in several
different ways. An important property is the viscosity of the medium, which is
preferably low to simplify cavitation. Another parameter which should be kept at a low
level to promote cavitation is the surface tension. This is due to the fact that low surface
tension means lower cohesive forces, which is positive for bubble formation. Other
properties of interest are vapour pressure and the presence of impurities in the liquid.
Due to the fact that cavities consist of gas and that impurities act as nuclei for
cavitation, it is positive to have a relatively high liquid pressure and concentration of
impurities in the medium. To mention one last important property of the liquid medium,
increasing the temperature corresponds to a reduction in cavitation intensity. This
implication originates from the increasing cushioning effect of reduced bubble collapse
upon increase in temperature, even though the increasing vapour pressure of cavities
should suggest an increased cavitation intensity that is not the overall result. [11]
Considering the ultrasonic field its frequency and amplitude are affecting the cavitation
formation. Altering the frequency means that the time intervals between compressions
and rarefactions will be either shorter or longer. If the frequency is increased it will be
harder to pull the molecules apart before they are compressed again. Consequently the
5
generation of cavities is reduced with an increasing frequency until the range of MHz is
reached, then there will be no bubble formation at all. For the amplitude the effect is the
opposite, meaning that an increasing amplitude increases cavitation. But this is only true
until a certain level, depending on the equipment design, is reached. Another effect of
an increase in amplitude is the increase in number of bubbles, something that results in a
possible coalesce of bubbles with associated reduction in bubble collapse. [11]
2.2.5. Equipment
In the experiments of this thesis a piezoelectric transducer was used to create sound
waves of ultrasonic frequency in the medium. A piezoelectric transducer consists of a
piezoelectric material, which functions based on the piezoelectric effect. The
piezoelectric effect implies two different things:
1. The direct effect: If a mechanical pressure is applied to a piezoelectric material, this
will give rise to electrical charges on both sides of the plate. Opposite charges, equal in
size, are generated on the sides and if tension is applied the polarity will be reversed.
[12]
2. The inverse effect: A piezoelectric material under influence of an electric field will
respond to this by deformation of the material. The material will contract or expand
depending on the polarity of the applied charge. [12]
The inverse piezoelectric effect has the consequence that an alternating voltage across
the material results in fluctuations in material dimensions. This effect is taken advantage
of in the transfer of ultrasound by piezoelectric transducers. The transducer will vibrate
at a specific frequency, resulting in formation/transfer of ultrasound through the
medium applied to. Depending on the size of the transducer crystal it will have its own
specific optimal performance frequency (its natural resonance frequency). Therefore
piezoelectric transducers are designed for a specific frequency generation and that is
why studies of ultrasonication at differing frequencies can not be performed using the
same transducer equipment. [11]
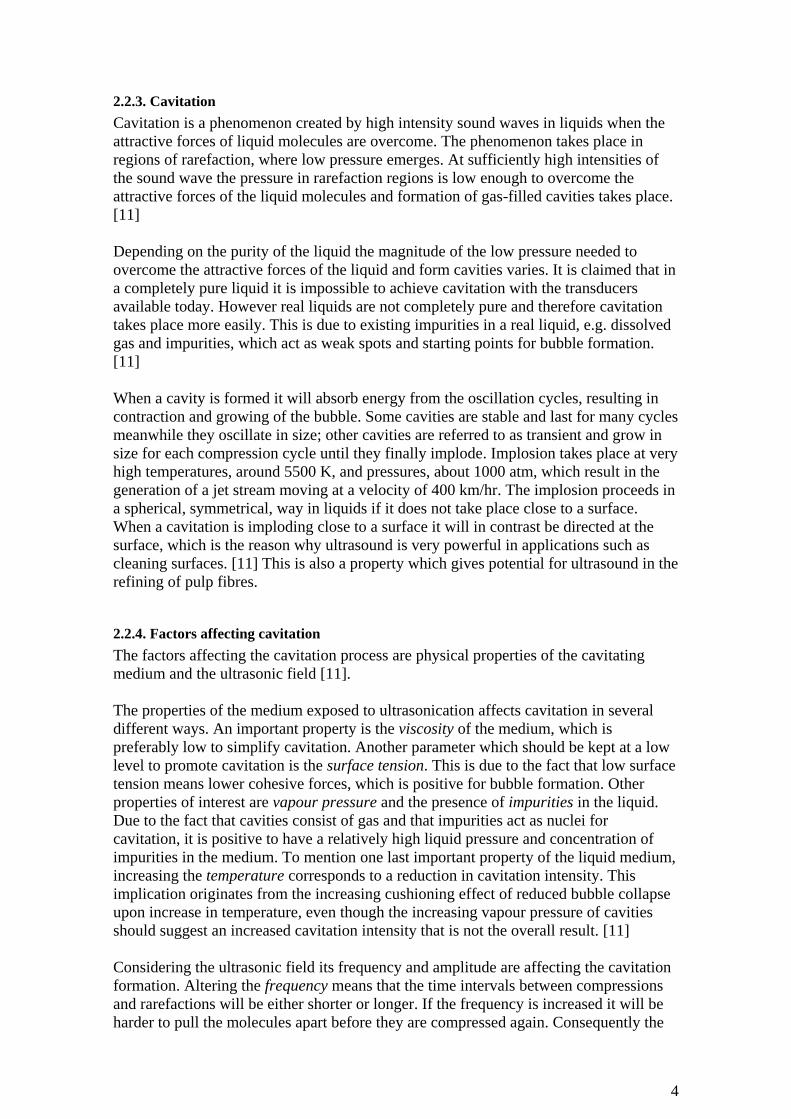
In addition to the piezoelectric transducer an ultrasonic system consists of a generator
which is needed to supply power to the transducer where it is converted into mechanical
energy. Another part of the equipment is the booster which is mounted onto the
transducer. Depending on the direction of the booster it reduces or increases the
amplitude of the ultrasound. In direct connection to the booster is the sonotrode which
transfers the mechanical oscillations into the medium to be sonicated in the flow cell.
The pulp suspension is added to the sample container and recirculated in the system by
a pump. See figures 1 and 2 for pictures of the ultrasonic equipment used in the
experiments of this project.
6
Figure 1. The ultrasonic equipment, UIP1000hd, which was used in the experiments
[13].
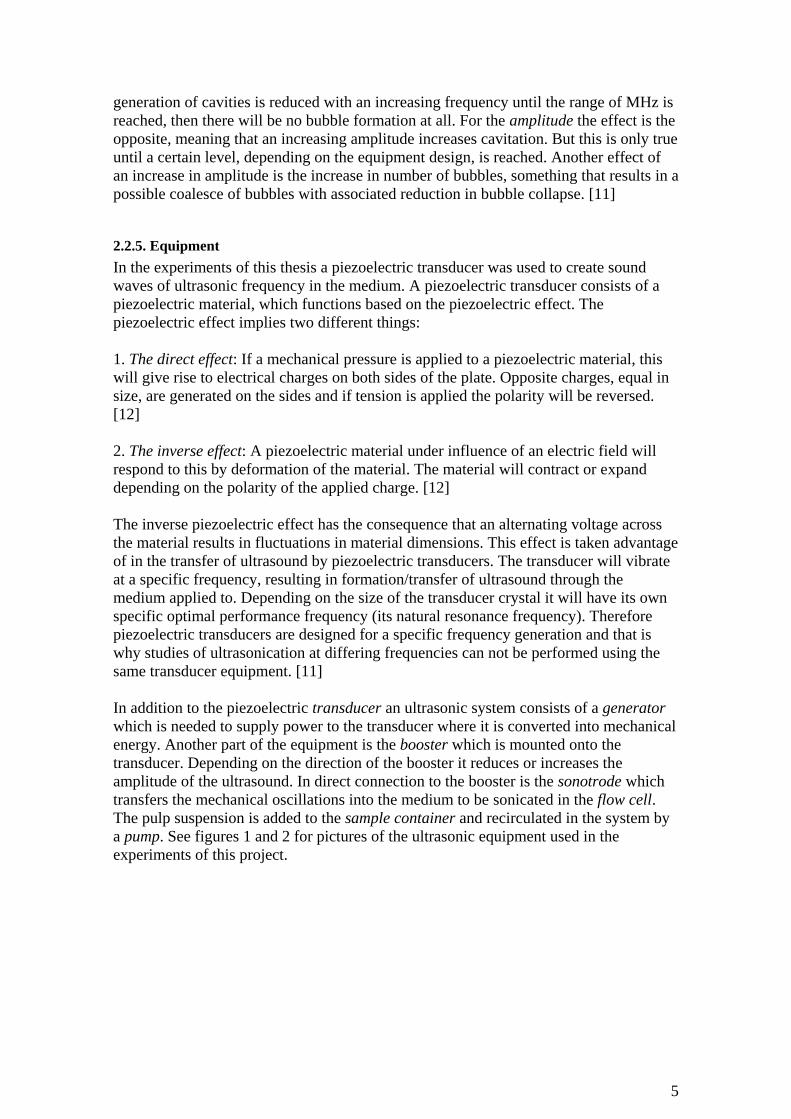
Figure 2. The ultrasonic generator used in the experiments [14].
2.3. Analyses
In order to determine the properties of fibres subjected to ultrasonic treatment a number
of different analysing methods were used. For characterisation of physical pulp
properties the water retention value, Schopper-Riegler number and tensile index were
measured. Furthermore fibre properties were analysed in a FiberMaster equipment and
scanning electron microscopy was applied for imaging of pulp samples.
Transducer
Booster
Sonotrode
Flow cell
Sample
container
Pump
Connection
to generator
7
2.3.1. Water retention value
Water retention value (WRV) is a measure of how much water a fibre is able to hold
under certain, standardised, conditions. Normally WRV increases with increased
beating as a result of the creation of deformations in the fibre wall, which increase the
capacity of water uptake. [15] For analysis of WRV a specific amount of fibres
suspended in water are filtered and put into a centrifuge for a certain duration time. The
centrifuged fibre samples are weighed (m1) and left overnight for drying in a cabinet
drier. Afterwards the dried pulp sample is weighed once again (m2) and the WRV,
measured in g H2O/g dry fibres, can be calculated from eq. 1, see below. [16]
12
1
m
mWRV (eq. 1)
2.3.2. Schopper-Riegler number
An analysis of the Schopper-Riegler number of a pulp sample gives an indication of the
de-watering properties. Schopper-Riegler is measured in terms of °SR and depends on
some different properties of the fibres, such as the amount of fines and fibre flexibility.
The degree of fibrillation also affects the de-watering properties. For measuring of the
Schopper-Riegler number a specific volume of pulp, in suspension, is dewatered on a
mesh in the testing equipment. When the pulp sample is poured into the testing
equipment a fibre web will be created on the mesh. Some of the sample water will go
through this fibre web and is collected for weighing meanwhile some water leaves the
equipment in a side effluent. If the pulp is hard to dewater a smaller part will pass the
fibre web and be collected in the beaker, resulting in a high °SR. After weighing the
collected water the volume is correlated to a specific Schopper-Riegler number at
standardised conditions. [17]
Sometimes the de-watering properties of a pulp sample are specified in terms of
freeness with a Canadian Standard Freeness (CSF) value. The experimental procedure
for determination of the CSF value is identical to the method for measuring of the
Schopper-Riegler number. The difference between the CSF value and the Schopper-
Riegler number lies in the scales for specification of the de-watering property, which are
oppositely graded. Basically this implies that a high Schopper-Riegler number
corresponds to a low CSF value.
2.3.3. Tensile index
One important paper property is the tensile strength, which is a measure of the greatest
stress a piece of paper can withstand before it breaks. The property depends on fibre
length and strength as well as specific bonding strength and bonded area. [18] To
compare between laboratory sheets of differing surface weights a tensile index can be
calculated. The tensile index of a pulp is analysed in laboratory handsheets produced at
standardised conditions. The sheets are being pressed and conditioned before testing can
take place. After completed conditioning the sheets are weighed and divided into slips
of specific width. The sheet thickness is tested to give possibility for later tensile index
determination. Then the paper slips are put into the tensile tester which locks the slip
with clamps at two places whereupon the clamps are pulled apart until the strain results
in a break. [19]
8
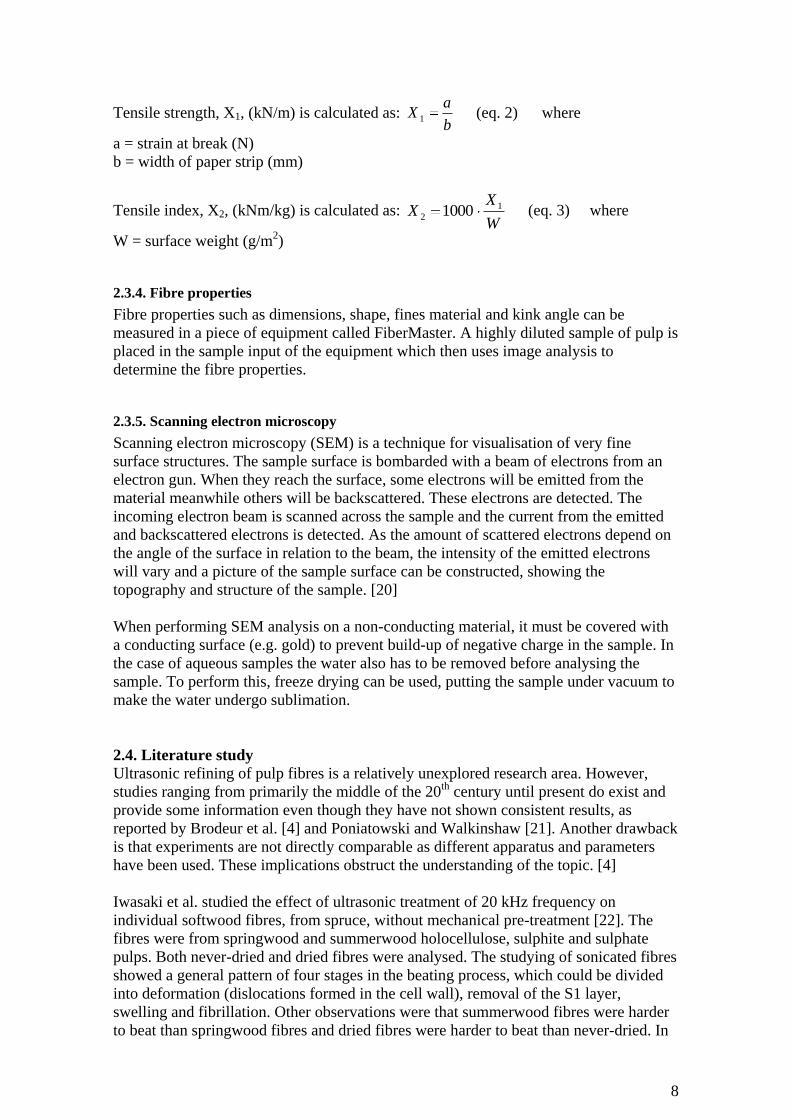
Tensile strength, X1, (kN/m) is calculated as: b
aX 1 (eq. 2) where
a = strain at break (N)
b = width of paper strip (mm)
Tensile index, X2, (kNm/kg) is calculated as: W
XX 1
2 1000 (eq. 3) where
W = surface weight (g/m2)
2.3.4. Fibre properties
Fibre properties such as dimensions, shape, fines material and kink angle can be
measured in a piece of equipment called FiberMaster. A highly diluted sample of pulp is
placed in the sample input of the equipment which then uses image analysis to
determine the fibre properties.
2.3.5. Scanning electron microscopy
Scanning electron microscopy (SEM) is a technique for visualisation of very fine
surface structures. The sample surface is bombarded with a beam of electrons from an
electron gun. When they reach the surface, some electrons will be emitted from the
material meanwhile others will be backscattered. These electrons are detected. The
incoming electron beam is scanned across the sample and the current from the emitted
and backscattered electrons is detected. As the amount of scattered electrons depend on
the angle of the surface in relation to the beam, the intensity of the emitted electrons
will vary and a picture of the sample surface can be constructed, showing the
topography and structure of the sample. [20]
When performing SEM analysis on a non-conducting material, it must be covered with
a conducting surface (e.g. gold) to prevent build-up of negative charge in the sample. In
the case of aqueous samples the water also has to be removed before analysing the
sample. To perform this, freeze drying can be used, putting the sample under vacuum to
make the water undergo sublimation.
2.4. Literature study
Ultrasonic refining of pulp fibres is a relatively unexplored research area. However,
studies ranging from primarily the middle of the 20th
century until present do exist and
provide some information even though they have not shown consistent results, as
reported by Brodeur et al. [4] and Poniatowski and Walkinshaw [21]. Another drawback
is that experiments are not directly comparable as different apparatus and parameters
have been used. These implications obstruct the understanding of the topic. [4]
Iwasaki et al. studied the effect of ultrasonic treatment of 20 kHz frequency on
individual softwood fibres, from spruce, without mechanical pre-treatment [22]. The
fibres were from springwood and summerwood holocellulose, sulphite and sulphate
pulps. Both never-dried and dried fibres were analysed. The studying of sonicated fibres
showed a general pattern of four stages in the beating process, which could be divided
into deformation (dislocations formed in the cell wall), removal of the S1 layer,
swelling and fibrillation. Other observations were that summerwood fibres were harder
to beat than springwood fibres and dried fibres were harder to beat than never-dried. In
9
the case of never-dried holocellulose and sulphite springwood fibres no fibrillation was
obtained.
In a study by Manning and Thompson [3] it was concluded that no fibre cutting action
occurred in the case of previously unrefined as well as previously mechanically refined
ultrasonicated fibres. Both chemical hardwood and softwood Kraft fibres were included
in this study, in which sonication took place at 20 kHz frequency. It was noted that the
pulps which were not previously refined upon sonication did not fibrillate, this was true
for the hardwood as well as the softwood pulps. When the pulp was mechanically
refined before sonication, a significant decrease in CSF values could be noted and an
increase in fibrillation was also verified. In this case the decrease in CSF value was
somewhat more pronounced for the hardwood pulp than for the softwood. In a
comparison of strength values for the softwood pulps the burst index was not altered in
the unrefined sonicated pulp meanwhile the pre-treated pulps showed an increase in
burst index in the interval of medium degree of refining.
In accordance with the results from Manning and Thompson, Poniatowski and
Walkinshaw [21] also observed that ultrasonic treatment without mechanical pre-
treatment has no significant effect on fibrillation. This study used an ultrasonic
equipment of 31 to 35 kHz frequency and bleached softwood Kraft fibres. Besides the
results on fibrillation it was shown that ultrasonic treatment resulted in smaller
reductions in CSF values for ultrasonically refined recycled pulp than for mechanically
refined. Another observation was that the breaking length of the ultrasonically recycled
pulp was lower than for refiner recycled pulp.
In a study on hardwood Kraft fibres, Poniatowski and Walkinshaw [23] looked into
ultrasonication in the recycling of pulp fibres. They used the same frequency of
ultrasound as in the previous mentioned study on softwood fibres, 31 to 35 kHz. It was
observed that the CSF values were lower for ultrasonically refined pulp than for refiner
recycled pulp. Another observation was that the fibrillation was greater in ultrasonicated
recycled fibres than in refiner recycled pulp. However, they also noted that if the pulp
was not mechanically pre-treated, there was little or no effect on fibrillation by
sonication. Considering the breaking length, it was only little affected in recycled-
refined and recycled-sonicated pulp but both of these pulps showed better strength than
recycled-untreated pulp.
Mohlin [24] studied cellulose fibre bonding in sulphite and Kraft pulps of different
yields. All the samples were treated ultrasonically at 20 kHz for the same sonication
duration times and compared to unbeaten and PFI-beaten fibres respectively. Depending
on the type of pulp and the yield the mean bond strength of fibres varied.
It was observed that the ultrasonically refined fibres had lower mean bond strengths
than the unbeaten and PFI-refined pulps in the Kraft pulp tested. In the case of sulphite
pulp two pulps of different yields were tested. It was shown that the pulp of the higher
yield had a lower mean bond strength for ultrasonically refined fibres than the PFI-
beaten (which had a lower mean bond strength than the unbeaten pulp). However, in the
case of the lower yield sulphite pulp the PFI-refined and ultrasonically refined fibres
had relatively similar mean bond strengths, both of them higher than for the unbeaten
pulp. These results show that the chemical composition of a pulp is important to mean
bond strength. Mohlin points out that the mechanism behind mean bond strength values
is the creation of new surfaces by beating and these surfaces bonding ability.
10
The surface modification of lignocellulosic fibres with ultrasound was studied by Gadhe
et al. [25]. They used TMP from pine and sonicated the fibres at 610 kHz. The
experiments showed an increase in non-conjugated carbonyl groups, which was
explained by the assumption that phenolic hydroxyl groups in lignin are oxidised. It was
also shown that the surface energy of fibres increased when they were sonicated,
probably due to that the sonicated fibres are more active than unsonicated fibres.
Another result was the finding that the extent of surface oxidation increases linearly
with an increase in ultrasonic power but it is not significantly affected by an increase in
sonication time.
The effects on fibre structure by ultrasonication were studied by Laine and Goring [26],
who sonicated dried sulphate pulp fibres from spruce at 23 kHz. They noted a marked
effect on fibre surfaces (ruptures in the S1 layer) and showed that the porous structure
was altered and that the fibre saturation point increased. The median pore width
increased and so did overall water uptake too. As the volume of smaller pores decreased
with a simultaneous increase in the volume of larger pores, it was concluded that
ultrasonication results in a transformation of smaller pores into larger pores.
Another conclusion from the experiments by Laine and Goring was that the
carbohydrate composition does not change by ultrasonic treatment and neither does the
cellulose molecular weight. Therefore, the increase in porosity may be due to disruptive
effects of the ultrasonic waves rather than removal of material from the fibre wall. It
was also shown that the crystalline structure does not change by ultrasonication.
Regarding chemical composition, it was noted that the amount of carboxyl groups in
fibres did not change by ultrasonication meanwhile the carbonyl groups increased.
Laine and Goring suggest that this is due to the production of H2O2 in water by
ultrasound. H2O2 can then react with the carbohydrates, which causes oxidation. Finally
it was noted that sonication has the most pronounced effect at lower consistencies and
longer duration times.
A study on the effect of ultrasonication on recycled pulp fibres was performed by
Tatsumi et al. [27]. In addition to the recycled fibres, samples of a virgin bleached
softwood Kraft pulp were also included in the study which was performed at a
sonication frequency of 20 kHz. For the virgin fibres it was observed that the initial
sedimentation rate decreased with increasing sonication time, something that indicates
an increase in specific surface area. The results imply that fibres are made bulky and
flexible by the ultrasonic treatment. In accordance with many other studies on
ultrasonication of pulp fibres it was also reported that the sonication caused increased
fibrillation of the fibres. This conclusion originated from SEM pictures taken of
ultrasonically treated and untreated recycled fibres, which showed an increased external
fibrillation on the fibres subjected to ultrasound.
According to Tatsumi et al. the WRVs could be significantly increased by the ultrasonic
treatment, i.e. it was higher than for the untreated fibres compared with. As
microphotographs showed that few fines were produced from ultrasonic treatment, the
increase in WRV could not be due to the formation of fines. It was also observed that
ultrasonic treatment results in decreased CSF values. Finally, considering strength
properties, the ultrasonic treatment improved the strength of recycled paper which
means that the tensile index was higher in ultrasonically treated recycled fibres than in
untreated recycled fibres.
11
3. Experimental
The experiments in this project involved both softwood and hardwood fibres, in never-
dried or dried form. Among the dried samples some received mechanical pretreatment
prior to exposure to ultrasound, in contrast to the never-dried pulps which did not
receive any pretreatment except defibration. After ultrasonication the samples were
analysed in terms of different analyses regarding fibre properties and the energy aspects
of the sonication were evaluated. To distinguish between all the experiments performed
and simplify for the reader they are divided into Experiment 1 and Experiment 2.
3.1. Pulp qualities
In the experiments performed in this project four different pulp qualities were used. The
pulps were industrially produced softwood and hardwood pulps in dried or never-dried
form. The never-dried pulps were withdrawn in the end of the bleaching process, where
a large sample of each pulp quality was collected at a specific occasion to ensure that
there would be enough pulp for all experiments. The pulp was thereafter stored in a
cooling room. All different pulp qualities used in the experiments are described below.
Softwood 1 (SW1): softwood pulp (spruce and pine), produced from a mixture of
pulpwood logs and sawmill chips, TCF, mid-length (2.15-2.35 mm) and medium-coarse
fibres
Softwood 2 (SW2): softwood pulp (mostly spruce), produced from 75-100% pulpwood
and wood from thinnings, TCF, short (2.05-2.25 mm) and thin-walled fibres
Softwood 3 (SW3): softwood pulp (spruce and pine) produced from 75-100% sawmill
chips, TCF, long (2.35-2.65 mm) and coarse fibres
Hardwood 1 (HW): hardwood pulp (birch), TCF, very short fibres (ca 0.9 mm) [28]
3.2. Experiment 1
The first experiments (hereafter referred to as Experiment 1) were performed in Teltow,
Berlin at the company Hielscher [29] which is a supplier of ultrasonic devices. Four
different samples of SW1 pulp were treated ultrasonically. One sample consisted of
never-dried defibrated pulp and the others were dried pulps among which one was
defibrated at 0 kWh/t and the others were mechanically refined at 50 kWh/t and 100
kWh/t respectively prior to ultrasonication. The pre-treated dried pulps were refined in a
laboratory refining equipment, Voith LR40. See table 1 below for a summary of
experiments.
12
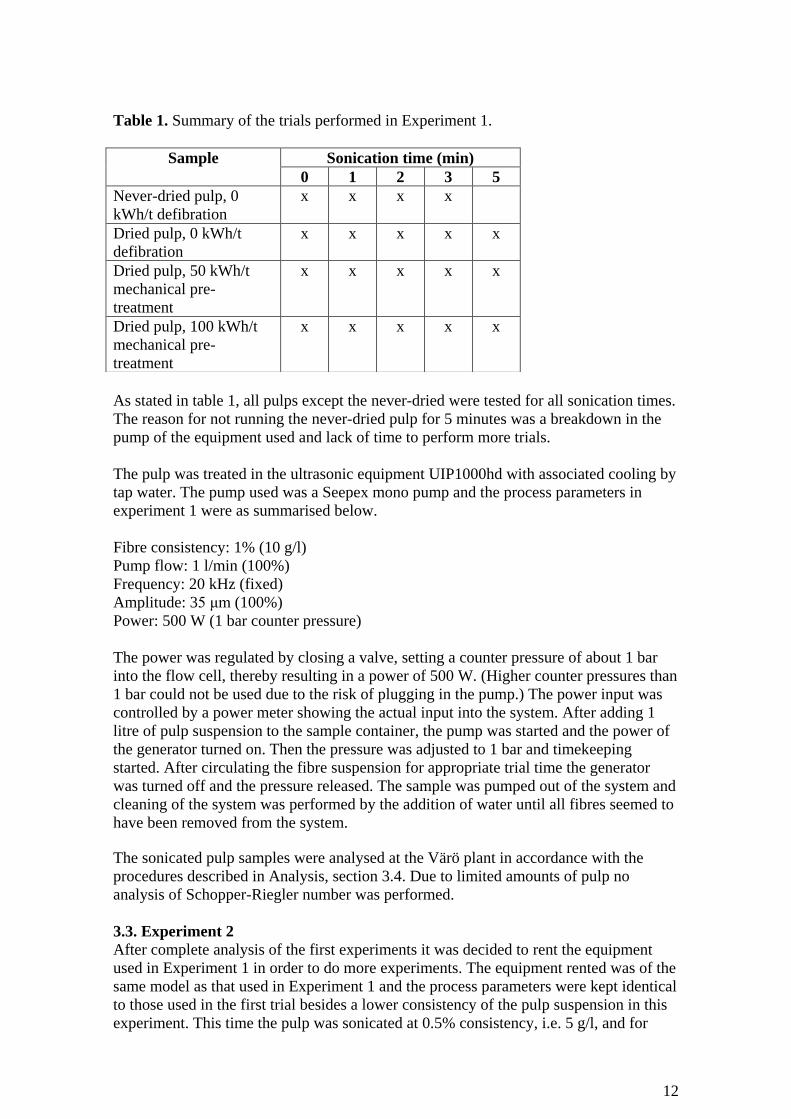
Table 1. Summary of the trials performed in Experiment 1.
As stated in table 1, all pulps except the never-dried were tested for all sonication times.
The reason for not running the never-dried pulp for 5 minutes was a breakdown in the
pump of the equipment used and lack of time to perform more trials.
The pulp was treated in the ultrasonic equipment UIP1000hd with associated cooling by
tap water. The pump used was a Seepex mono pump and the process parameters in
experiment 1 were as summarised below.
Fibre consistency: 1% (10 g/l)
Pump flow: 1 l/min (100%)
Frequency: 20 kHz (fixed)
Amplitude: 35 μm (100%)
Power: 500 W (1 bar counter pressure)
The power was regulated by closing a valve, setting a counter pressure of about 1 bar
into the flow cell, thereby resulting in a power of 500 W. (Higher counter pressures than
1 bar could not be used due to the risk of plugging in the pump.) The power input was
controlled by a power meter showing the actual input into the system. After adding 1
litre of pulp suspension to the sample container, the pump was started and the power of
the generator turned on. Then the pressure was adjusted to 1 bar and timekeeping
started. After circulating the fibre suspension for appropriate trial time the generator
was turned off and the pressure released. The sample was pumped out of the system and
cleaning of the system was performed by the addition of water until all fibres seemed to
have been removed from the system.
The sonicated pulp samples were analysed at the Värö plant in accordance with the
procedures described in Analysis, section 3.4. Due to limited amounts of pulp no
analysis of Schopper-Riegler number was performed.
3.3. Experiment 2
After complete analysis of the first experiments it was decided to rent the equipment
used in Experiment 1 in order to do more experiments. The equipment rented was of the
same model as that used in Experiment 1 and the process parameters were kept identical
to those used in the first trial besides a lower consistency of the pulp suspension in this
experiment. This time the pulp was sonicated at 0.5% consistency, i.e. 5 g/l, and for
Sample Sonication time (min)
0 1 2 3 5
Never-dried pulp, 0
kWh/t defibration
x x x x
Dried pulp, 0 kWh/t
defibration
x x x x x
Dried pulp, 50 kWh/t
mechanical pre-
treatment
x x x x x
Dried pulp, 100 kWh/t
mechanical pre-
treatment
x x x x x
13
longer duration times. The reason for the choice of larger energy input was a lack of
significant results when using the same consistency and sonication times as in
Experiment 1.
Four different qualities of never-dried pulp fibres were used in these trials; three
softwood pulps and one hardwood (see section 3.1, Pulp qualities, for information). The
pulps did not receive any mechanical treatment prior to sonication, they were only
defibrated. The trials performed in Experiment 2 are summarised below in table 2.
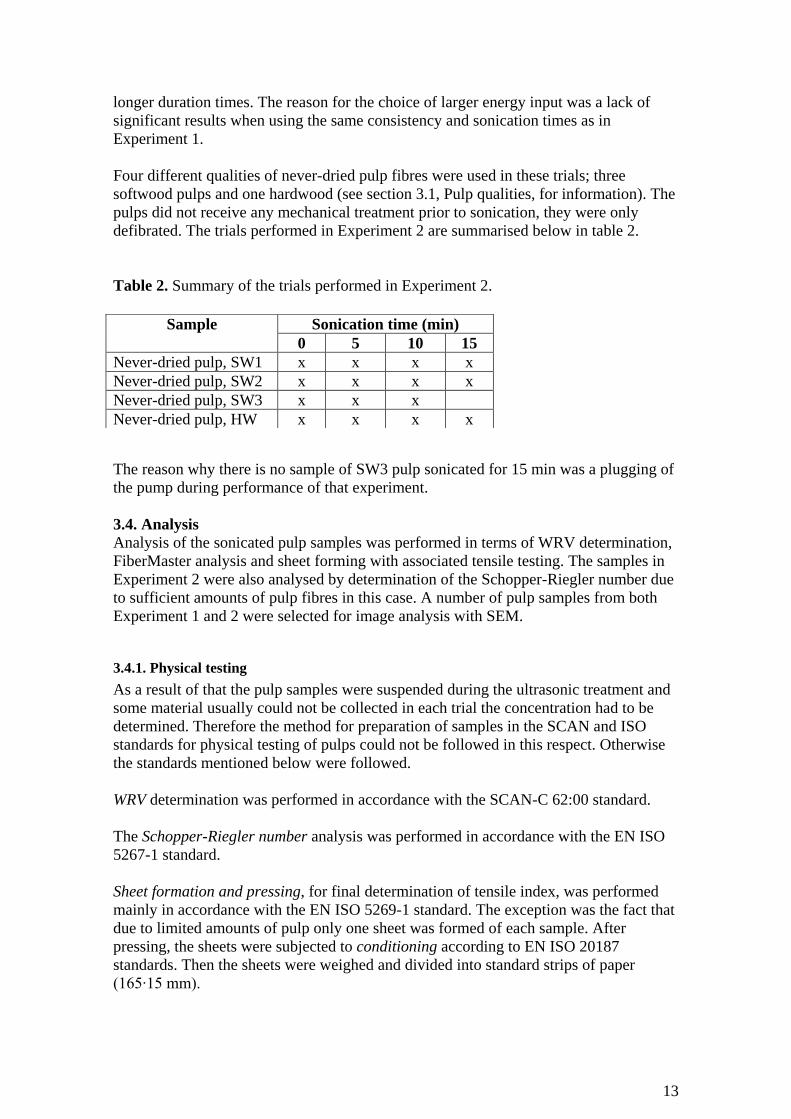
Table 2. Summary of the trials performed in Experiment 2.
The reason why there is no sample of SW3 pulp sonicated for 15 min was a plugging of
the pump during performance of that experiment.
3.4. Analysis
Analysis of the sonicated pulp samples was performed in terms of WRV determination,
FiberMaster analysis and sheet forming with associated tensile testing. The samples in
Experiment 2 were also analysed by determination of the Schopper-Riegler number due
to sufficient amounts of pulp fibres in this case. A number of pulp samples from both
Experiment 1 and 2 were selected for image analysis with SEM.
3.4.1. Physical testing
As a result of that the pulp samples were suspended during the ultrasonic treatment and
some material usually could not be collected in each trial the concentration had to be
determined. Therefore the method for preparation of samples in the SCAN and ISO
standards for physical testing of pulps could not be followed in this respect. Otherwise
the standards mentioned below were followed.
WRV determination was performed in accordance with the SCAN-C 62:00 standard.
The Schopper-Riegler number analysis was performed in accordance with the EN ISO
5267-1 standard.
Sheet formation and pressing, for final determination of tensile index, was performed
mainly in accordance with the EN ISO 5269-1 standard. The exception was the fact that
due to limited amounts of pulp only one sheet was formed of each sample. After
pressing, the sheets were subjected to conditioning according to EN ISO 20187
standards. Then the sheets were weighed and divided into standard strips of paper
(165∙15 mm).
Sample Sonication time (min)
0 5 10 15
Never-dried pulp, SW1 x x x x
Never-dried pulp, SW2 x x x x
Never-dried pulp, SW3 x x x
Never-dried pulp, HW x x x x
14
Testing of sheet thickness was performed according to EN 20534 standards in a L&W
Micrometer with one exception. Instead of measuring the thickness of four sheets, one
standard paper strip was divided into four parts and the thickness of these was
measured.
The tensile index analysis was performed in accordance with the ISO 1924-3 standard
but with the exception that seven or eight strips of paper were tested instead of ten as
normally used in the standard. This was due to the only sheet available. The tensile
tester was a L&W Tensile Tester with Fracture Toughness.
3.4.2. Fibre properties
The fibre properties analysis was performed in a L&W STFI FiberMaster (FM)
equipment. The pulp samples from Experiment 1 were analysed in a process FM
equipment in the Värö Mill meanwhile the samples from Experiment 2 were analysed in
an equipment at the Innovation pulp lab. The reason why two different equipments were
used was a breakdown in the FM at lab at the time for analysis of Experiment 1.
3.4.3. SEM
Before analysing the fibres in an electron microscope the samples needed some
preparation. Some millilitres of the aqueous fibre samples, all of a concentration about 2
g/l, were poured into a beaker and freeze-dried overnight until the water had
disappeared. A small piece of the freeze-dried fibre web was attached to a “stub” with
the help of silver glue. The stub was put into an ion sputter for coating with gold atoms.
Finally the prepared samples were examined in a scanning electron microscope, model
JEOL JSM-820 at 60 μA. Pictures of the fibre web were taken at some different
magnification levels ranging from 50x to 1000x. The pictures taken of the sample
surface were handled in the computer software SemAfore.
As a consequence of limitations in available time for analysis, only some of the total
amount of samples were being analysed with SEM. For Experiment 1 one sample of
each type of fibres was analysed meanwhile in Experiment 2 it was chosen to only
analyse the HW pulp in order to see the effect on hardwood fibres. Softwood fibres hade
in comparison already been analysed in Experiment 1.
3.5. Energy aspects
The energy output of the ultrasonic equipment was calculated for both experiments. To
give values comparable to those of conventional refining, energy consumption was
defined in kWh/t pulp. For a comparison in the opposite direction, from mechanical
refining to ultrasonic refining, the equivalent sonication times for some different
conventional refining degrees were also calculated.
15
1
1.1
1.2
1.3
1.4
1.5
1.6
1.7
1.8
1.9
0 1 2 3 4 5 6
Sonication time (min)
WR
V (
g H
2O
/g f
ibre
s)
never-dried
dried, 0 kWh/t
dried, 50 kWh/t
dried, 100 kWh/t
1
1.2
1.4
1.6
1.8
2
2.2
2.4
2.6
2.8
0 5 10 15 20
Sonication time (min)
WR
V (
g H
2O
/g f
ibre
s)
SW1
SW2
SW3
HW
4. Results and discussion
4.1 Physical properties
To determine the physical properties of the sonicated fibres, pulp samples were
analysed in terms of WRV, tensile index and Schopper-Riegler number. The results are
visualised in the following sections and all experimental values are also summarised in
tables in Appendix A1.
4.1.1. WRV
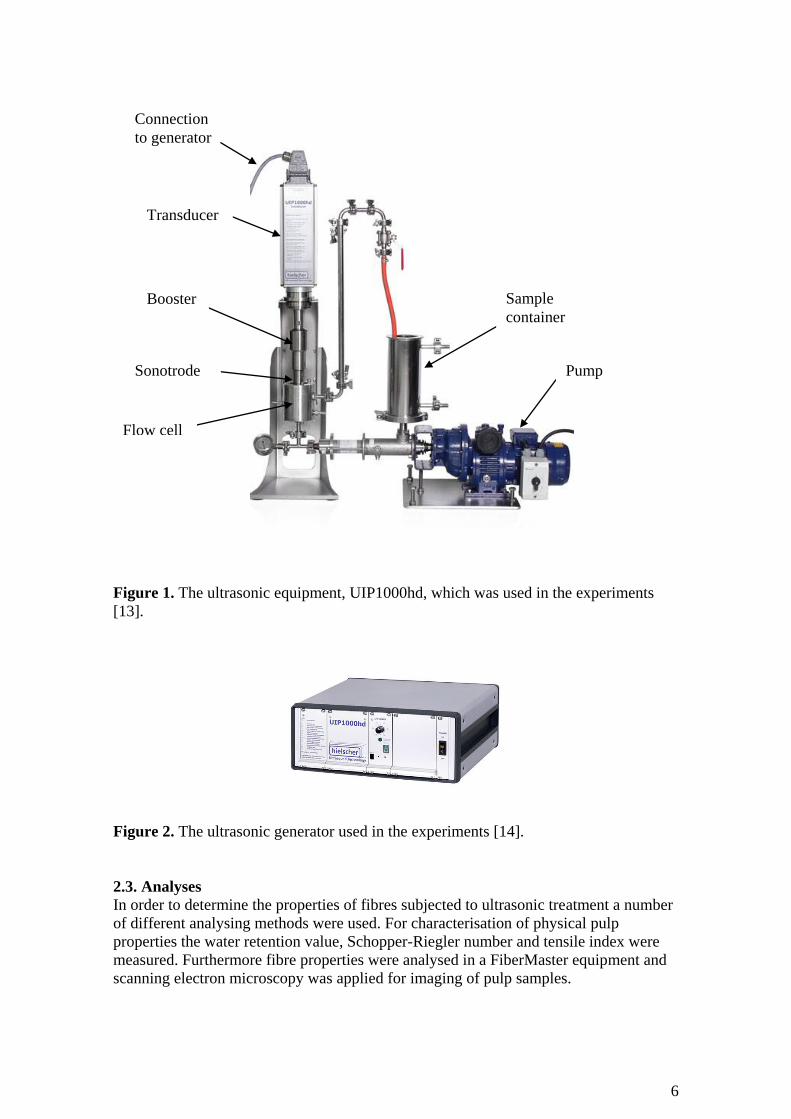
The results obtained from the analysis of WRVs in Experiment 1 and 2 are shown
below in figure 3 and 4 respectively.
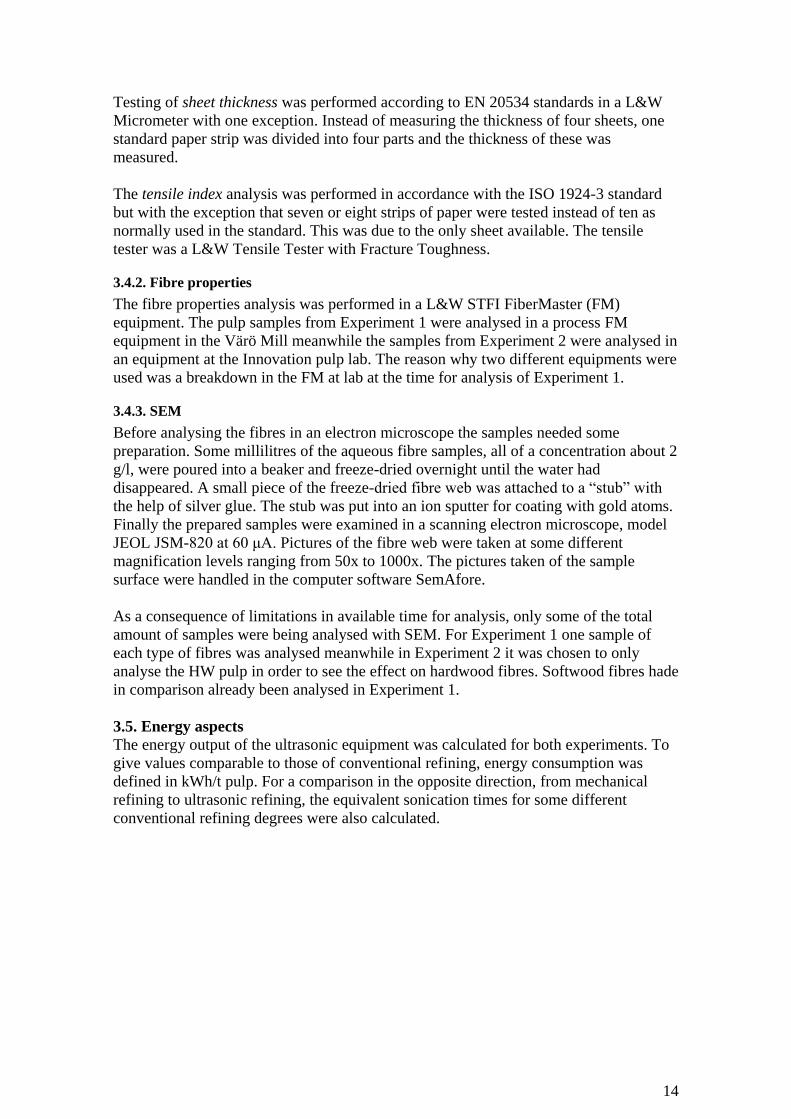
Figure 3. WRV as a function of sonication time for samples of SW1 pulp,
ultrasonicated at 1% consistency in Experiment 1, without and with preceding
mechanical refining at different energy levels.
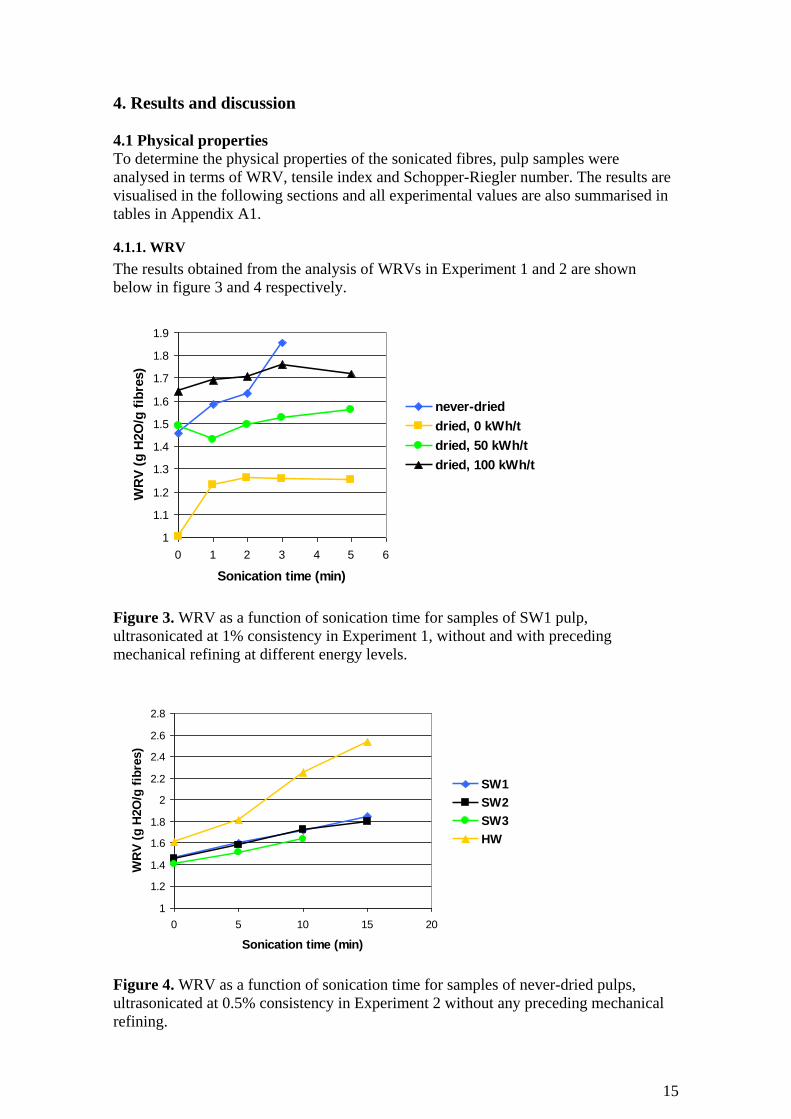
Figure 4. WRV as a function of sonication time for samples of never-dried pulps,
ultrasonicated at 0.5% consistency in Experiment 2 without any preceding mechanical
refining.
16
From the results of Experiment 1, visualised in figure 3, it can be noted that the never-
dried SW1 pulp was more easily ultrasonically refined than the dried pulps. This is in
accordance with the observations by e.g. Iwasaki et al. [22]. Most of the previous lab
scale studies of ultrasonic refining had shown that samples of dried pulp, which had not
been refined prior to sonication did not fibrillate or undergo any changes when
sonicated. It is therefore strange that the dried pulp which is only defibrated (0 kWh/t)
prior to sonication shows an increase in WRV. However there is no increase for
different sonication times, only from reference to sonication for 1 min. It could
therefore be suspected that the increase in WRV in some way has to do with different
treatments of the reference and sonicated pulps.
Considering the results from Experiment 2, shown in figure 4, it can be concluded that
there is an increase in swelling for all pulp qualities sonicated at 0.5% consistency. The
results also show evidence that the hardwood pulp, HW, is more easily beaten than the
other pulps as this is undergoing the largest change in WRV. Among the softwood pulps
the SW2 and SW1 qualities show identical evolutions of WRVs, a significant
improvement in water retention, even though not at the same magnitude as that of the
hardwood pulp. The SW3 quality shows the same trend as the other pulps but is slightly
less easily beaten than the other softwood qualities. Probably this is due to the fact that
this pulp consists of coarser fibres which are harder to beat.
According to the results on WRVs it seems reasonable to assume an increased inner
fibrillation of the never-dried fibres subjected to ultrasonic treatment. The results on
never-dried fibres obtained in Experiment 1 and 2 are in accordance with each others as
well as with the ones stated in literature studies on WRV (e.g. Tatsumi et al. [27]).
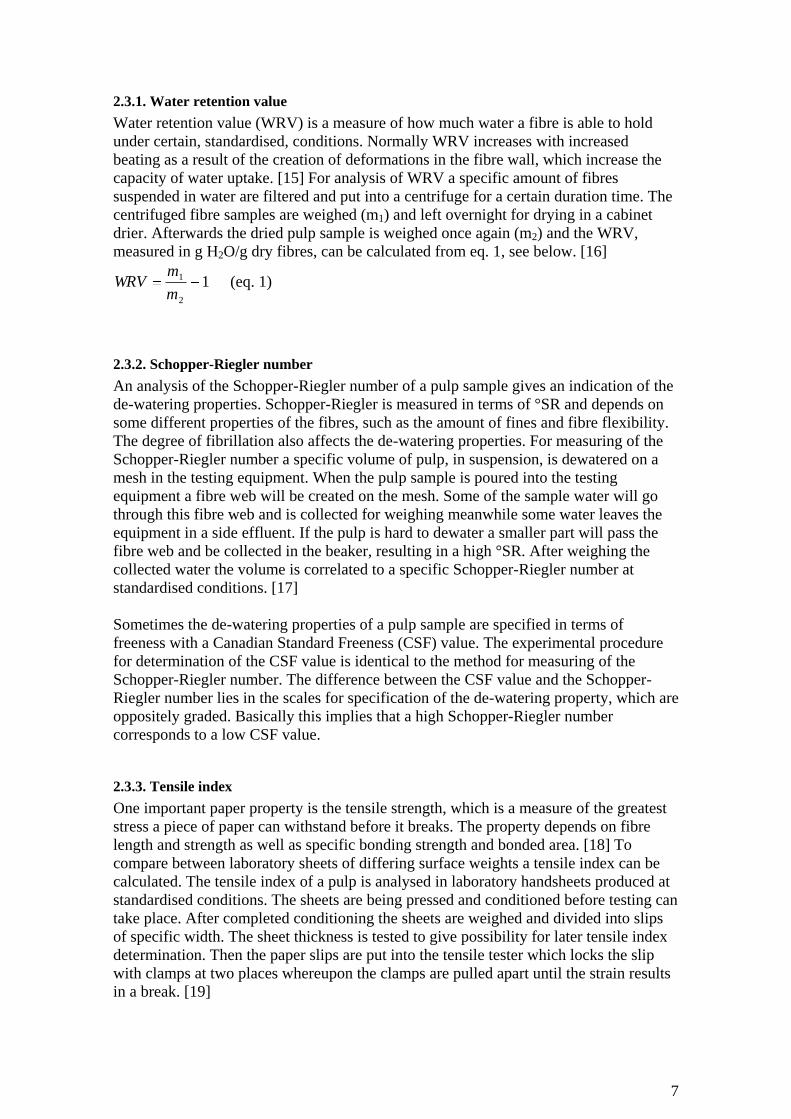
4.1.2. Tensile index
The results obtained from the analysis of tensile index in Experiment 1 and 2 are
visualised below in figures 5 to 8. In figures 5 and 6 the results on tensile index are
shown as a function of the duration time of ultrasonic treatment meanwhile in figures 7
and 8 it is shown as a function of the sheet density.
17
0
10
20
30
40
50
60
70
80
90
0 1 2 3 4 5 6
Sonication time (min)
Ten
sil
e i
nd
ex (
kN
m/k
g)
never-dried
dried, 0 kWh/t
dried, 50 kWh/t
dried, 100 kWh/t
0
10
20
30
40
50
60
70
0 5 10 15 20
Sonication time (min)
Ten
sil
e i
nd
ex (
kN
m/k
g)
SW1
SW2
SW3
HW
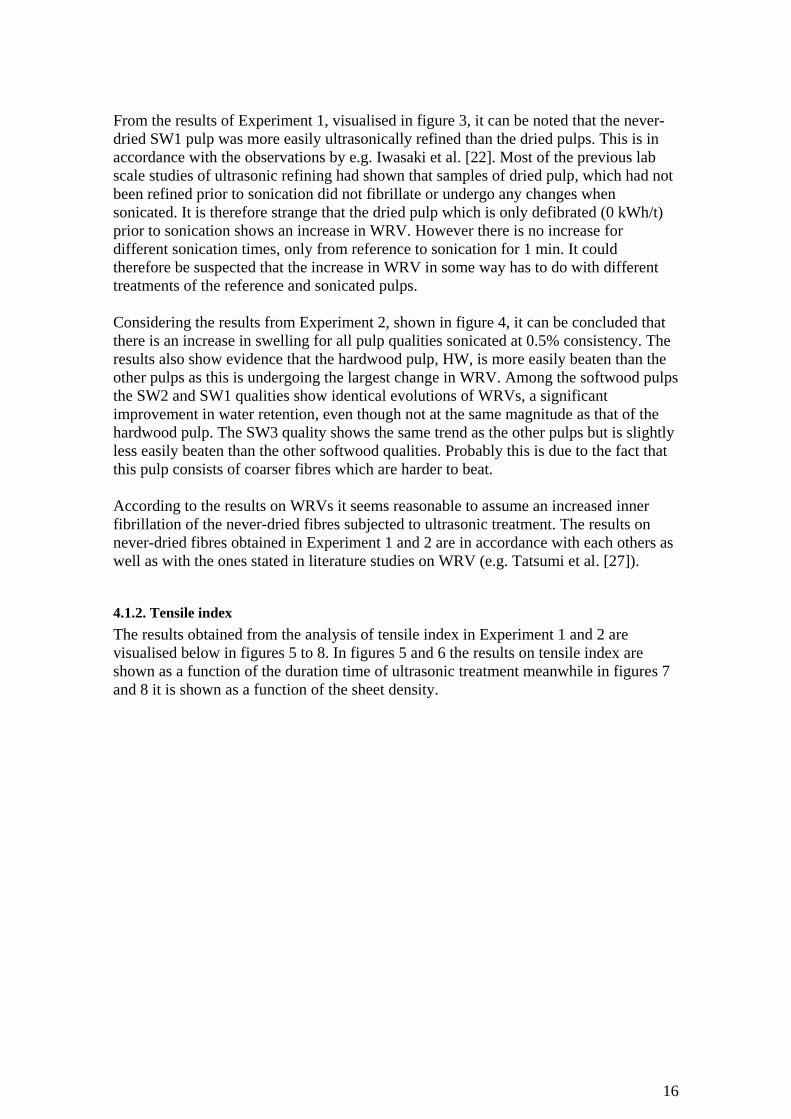
Figure 5. Tensile index as a function of sonication time for handsheets produced from
samples of SW1, ultrasonicated at 1% consistency in Experiment 1, without and with
preceding mechanical refining at different energy levels.
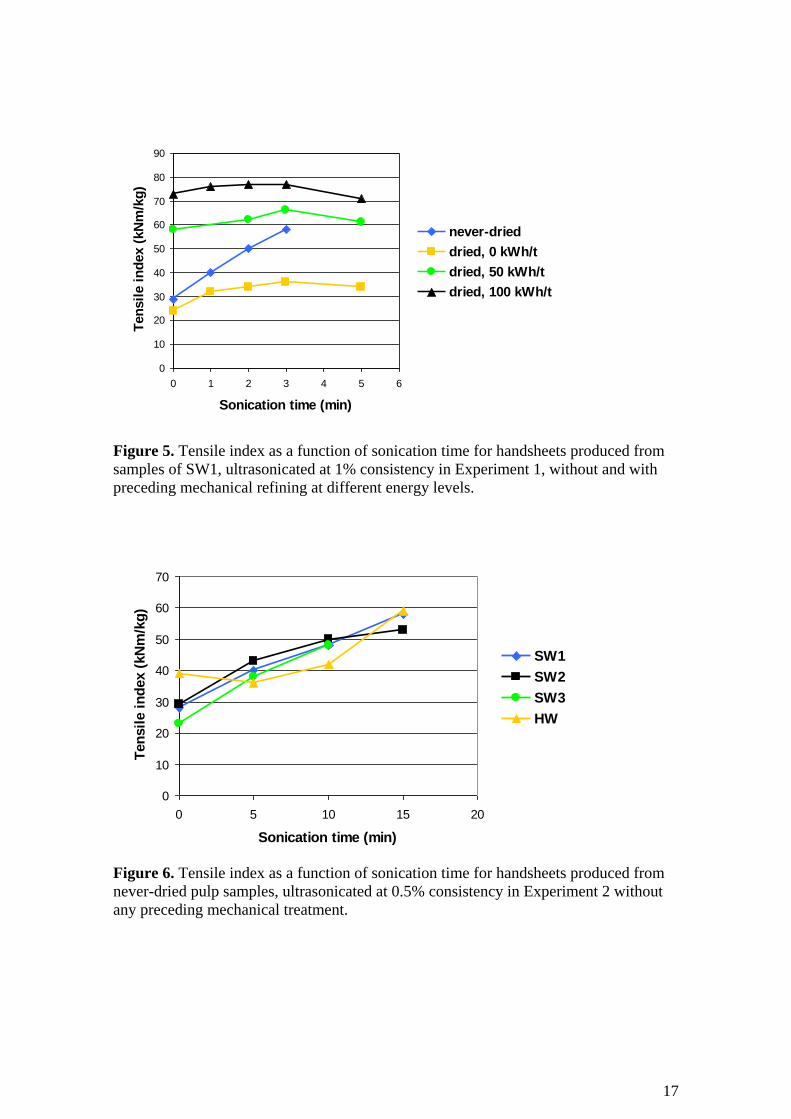
Figure 6. Tensile index as a function of sonication time for handsheets produced from
never-dried pulp samples, ultrasonicated at 0.5% consistency in Experiment 2 without
any preceding mechanical treatment.
18
0
10
20
30
40
50
60
70
80
90
550 600 650 700 750 800
Sheet density (kg/m3)
Ten
sil
e i
nd
ex (
kN
m/k
g)
never-dried
dried, 0 kWh/t
dried, 50 kWh/t
dried, 100 kWh/t
without
sonication
ultrasonic
without
sonication
0
10
20
30
40
50
60
70
500 600 700 800 900
Sheet density (kg/m3)
Ten
sil
e i
nd
ex (
kN
m/k
g)
SW1
SW2
SW3
HWwithout
sonication
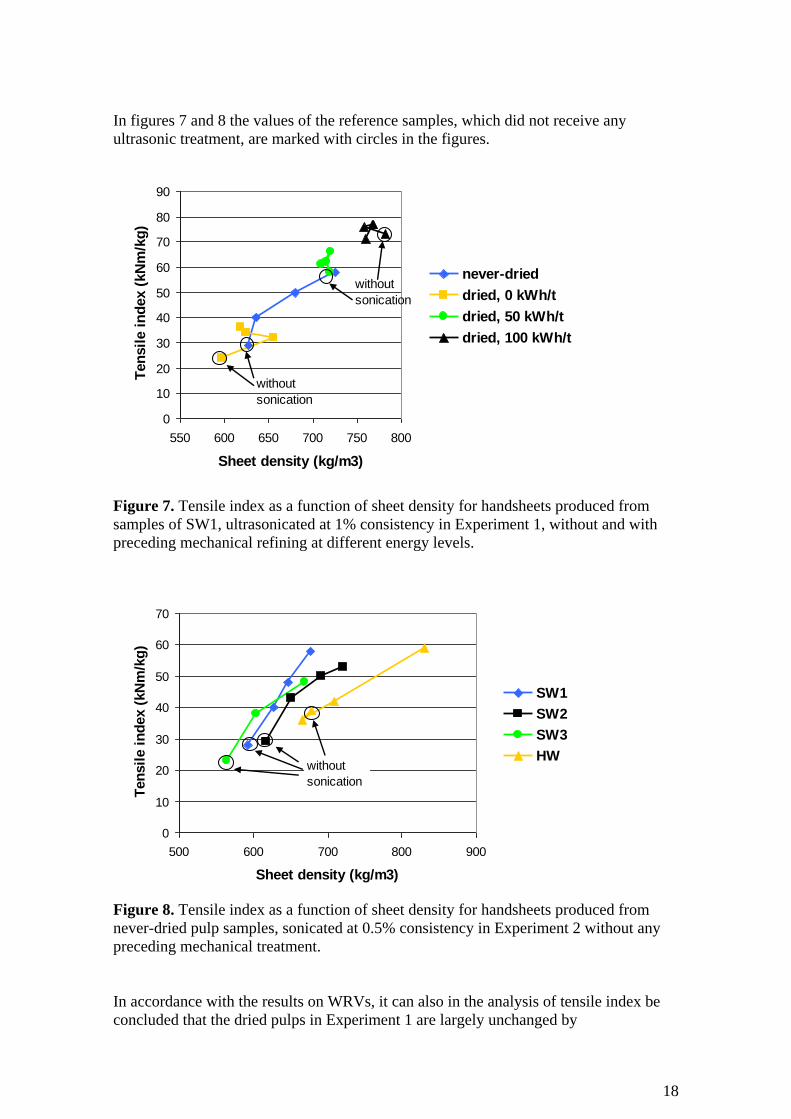
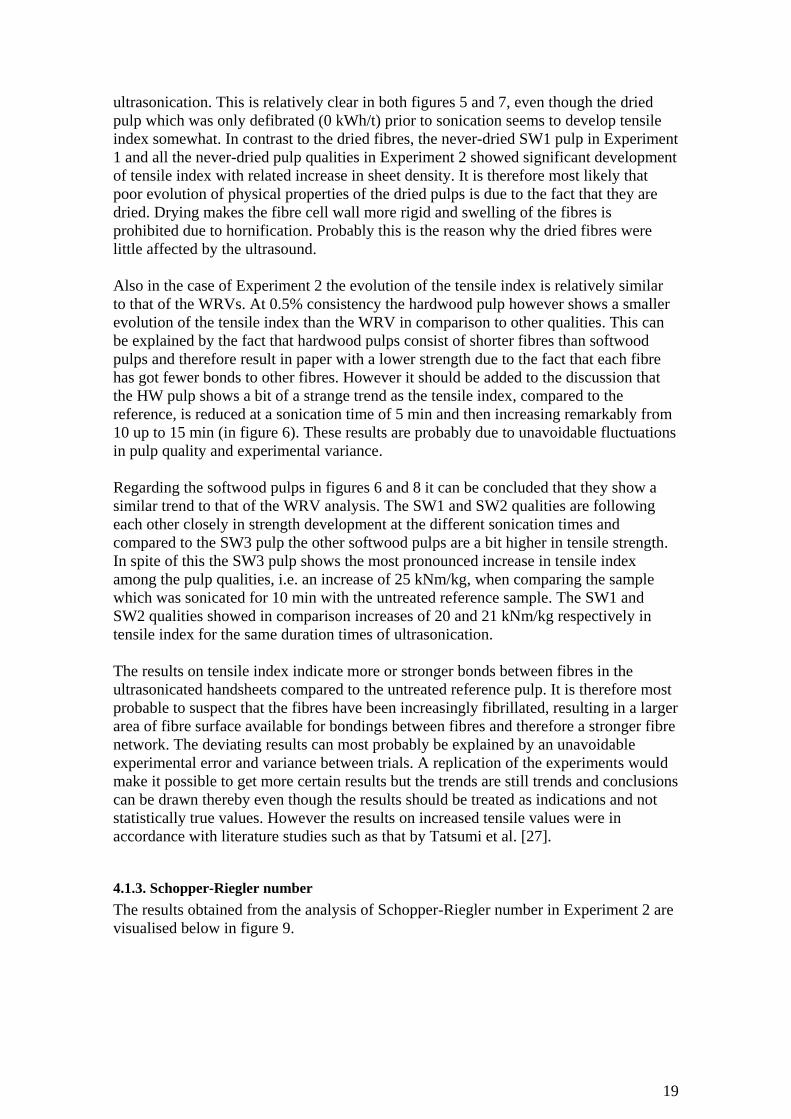
In figures 7 and 8 the values of the reference samples, which did not receive any
ultrasonic treatment, are marked with circles in the figures.
Figure 7. Tensile index as a function of sheet density for handsheets produced from
samples of SW1, ultrasonicated at 1% consistency in Experiment 1, without and with
preceding mechanical refining at different energy levels.
Figure 8. Tensile index as a function of sheet density for handsheets produced from
never-dried pulp samples, sonicated at 0.5% consistency in Experiment 2 without any
preceding mechanical treatment.
In accordance with the results on WRVs, it can also in the analysis of tensile index be
concluded that the dried pulps in Experiment 1 are largely unchanged by
19
ultrasonication. This is relatively clear in both figures 5 and 7, even though the dried
pulp which was only defibrated (0 kWh/t) prior to sonication seems to develop tensile
index somewhat. In contrast to the dried fibres, the never-dried SW1 pulp in Experiment
1 and all the never-dried pulp qualities in Experiment 2 showed significant development
of tensile index with related increase in sheet density. It is therefore most likely that
poor evolution of physical properties of the dried pulps is due to the fact that they are
dried. Drying makes the fibre cell wall more rigid and swelling of the fibres is
prohibited due to hornification. Probably this is the reason why the dried fibres were
little affected by the ultrasound.
Also in the case of Experiment 2 the evolution of the tensile index is relatively similar
to that of the WRVs. At 0.5% consistency the hardwood pulp however shows a smaller
evolution of the tensile index than the WRV in comparison to other qualities. This can
be explained by the fact that hardwood pulps consist of shorter fibres than softwood
pulps and therefore result in paper with a lower strength due to the fact that each fibre
has got fewer bonds to other fibres. However it should be added to the discussion that
the HW pulp shows a bit of a strange trend as the tensile index, compared to the
reference, is reduced at a sonication time of 5 min and then increasing remarkably from
10 up to 15 min (in figure 6). These results are probably due to unavoidable fluctuations
in pulp quality and experimental variance.
Regarding the softwood pulps in figures 6 and 8 it can be concluded that they show a
similar trend to that of the WRV analysis. The SW1 and SW2 qualities are following
each other closely in strength development at the different sonication times and
compared to the SW3 pulp the other softwood pulps are a bit higher in tensile strength.
In spite of this the SW3 pulp shows the most pronounced increase in tensile index
among the pulp qualities, i.e. an increase of 25 kNm/kg, when comparing the sample
which was sonicated for 10 min with the untreated reference sample. The SW1 and
SW2 qualities showed in comparison increases of 20 and 21 kNm/kg respectively in
tensile index for the same duration times of ultrasonication.
The results on tensile index indicate more or stronger bonds between fibres in the
ultrasonicated handsheets compared to the untreated reference pulp. It is therefore most
probable to suspect that the fibres have been increasingly fibrillated, resulting in a larger
area of fibre surface available for bondings between fibres and therefore a stronger fibre
network. The deviating results can most probably be explained by an unavoidable
experimental error and variance between trials. A replication of the experiments would
make it possible to get more certain results but the trends are still trends and conclusions
can be drawn thereby even though the results should be treated as indications and not
statistically true values. However the results on increased tensile values were in
accordance with literature studies such as that by Tatsumi et al. [27].
4.1.3. Schopper-Riegler number
The results obtained from the analysis of Schopper-Riegler number in Experiment 2 are
visualised below in figure 9.
20
0
10
20
30
40
50
60
0 5 10 15 20
Sonication time (min)
°SR
SW1
SW2
SW3
HW
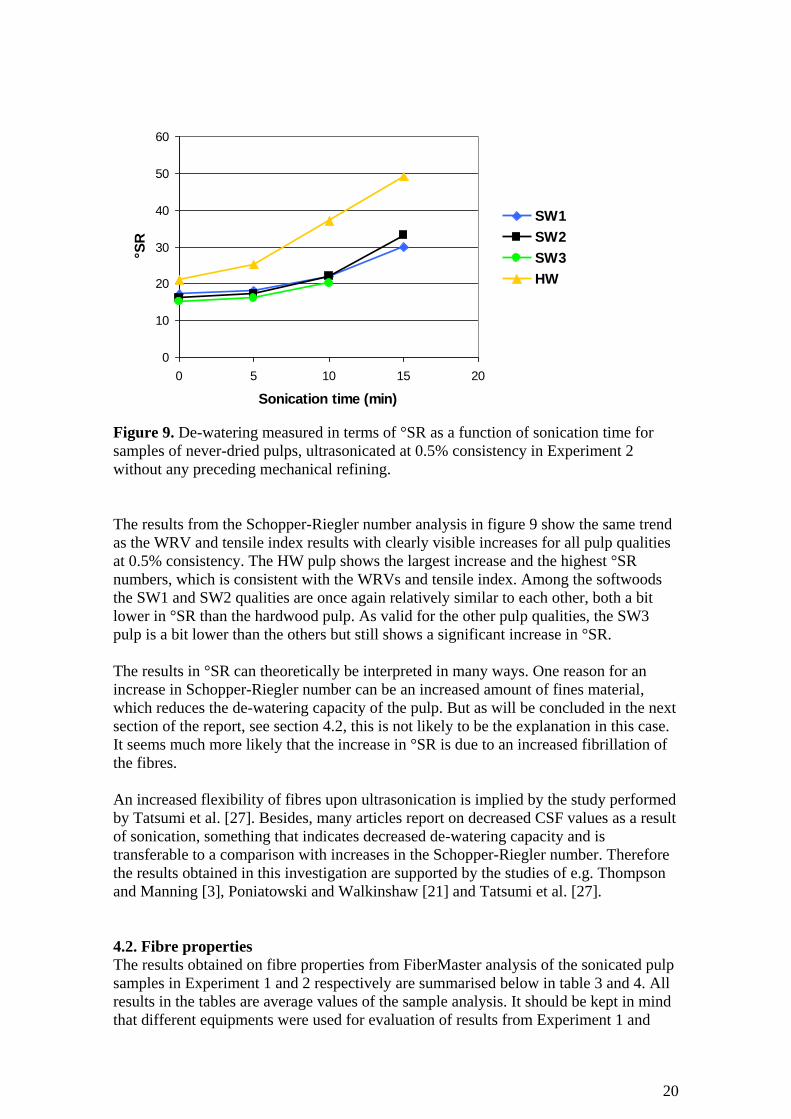
Figure 9. De-watering measured in terms of °SR as a function of sonication time for
samples of never-dried pulps, ultrasonicated at 0.5% consistency in Experiment 2
without any preceding mechanical refining.
The results from the Schopper-Riegler number analysis in figure 9 show the same trend
as the WRV and tensile index results with clearly visible increases for all pulp qualities
at 0.5% consistency. The HW pulp shows the largest increase and the highest °SR
numbers, which is consistent with the WRVs and tensile index. Among the softwoods
the SW1 and SW2 qualities are once again relatively similar to each other, both a bit
lower in °SR than the hardwood pulp. As valid for the other pulp qualities, the SW3
pulp is a bit lower than the others but still shows a significant increase in °SR.
The results in °SR can theoretically be interpreted in many ways. One reason for an
increase in Schopper-Riegler number can be an increased amount of fines material,
which reduces the de-watering capacity of the pulp. But as will be concluded in the next
section of the report, see section 4.2, this is not likely to be the explanation in this case.
It seems much more likely that the increase in °SR is due to an increased fibrillation of
the fibres.
An increased flexibility of fibres upon ultrasonication is implied by the study performed
by Tatsumi et al. [27]. Besides, many articles report on decreased CSF values as a result
of sonication, something that indicates decreased de-watering capacity and is
transferable to a comparison with increases in the Schopper-Riegler number. Therefore
the results obtained in this investigation are supported by the studies of e.g. Thompson
and Manning [3], Poniatowski and Walkinshaw [21] and Tatsumi et al. [27].
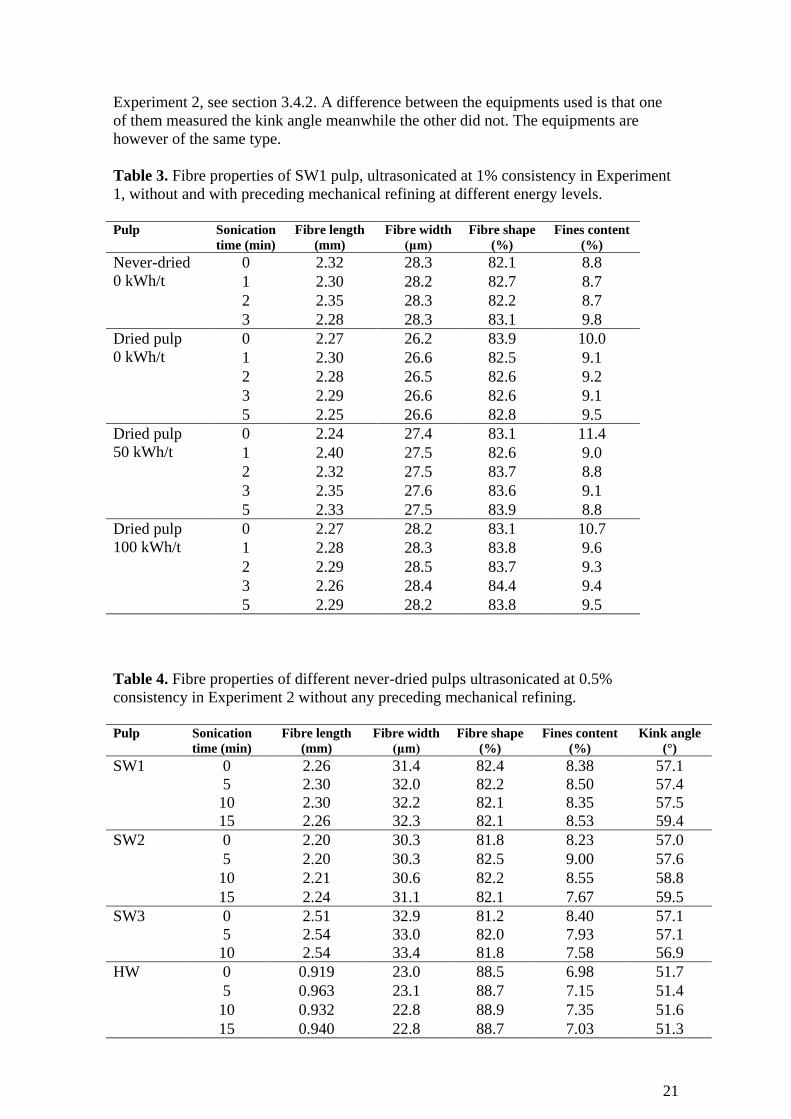
4.2. Fibre properties
The results obtained on fibre properties from FiberMaster analysis of the sonicated pulp
samples in Experiment 1 and 2 respectively are summarised below in table 3 and 4. All
results in the tables are average values of the sample analysis. It should be kept in mind
that different equipments were used for evaluation of results from Experiment 1 and
21
Experiment 2, see section 3.4.2. A difference between the equipments used is that one
of them measured the kink angle meanwhile the other did not. The equipments are
however of the same type.
Table 3. Fibre properties of SW1 pulp, ultrasonicated at 1% consistency in Experiment
1, without and with preceding mechanical refining at different energy levels.
Pulp Sonication
time (min)
Fibre length
(mm)
Fibre width
(μm)
Fibre shape
(%)
Fines content
(%)
Never-dried
0 kWh/t
0 2.32 28.3 82.1 8.8
1 2.30 28.2 82.7 8.7
2 2.35 28.3 82.2 8.7
3 2.28 28.3 83.1 9.8
Dried pulp
0 kWh/t
0 2.27 26.2 83.9 10.0
1 2.30 26.6 82.5 9.1
2 2.28 26.5 82.6 9.2
3 2.29 26.6 82.6 9.1
5 2.25 26.6 82.8 9.5
Dried pulp
50 kWh/t
0 2.24 27.4 83.1 11.4
1 2.40 27.5 82.6 9.0
2 2.32 27.5 83.7 8.8
3 2.35 27.6 83.6 9.1
5 2.33 27.5 83.9 8.8
Dried pulp
100 kWh/t
0 2.27 28.2 83.1 10.7
1 2.28 28.3 83.8 9.6
2 2.29 28.5 83.7 9.3
3 2.26 28.4 84.4 9.4
5 2.29 28.2 83.8 9.5
Table 4. Fibre properties of different never-dried pulps ultrasonicated at 0.5%
consistency in Experiment 2 without any preceding mechanical refining.
Pulp Sonication
time (min)
Fibre length
(mm)
Fibre width
(μm)
Fibre shape
(%)
Fines content
(%)
Kink angle
(°)
SW1 0 2.26 31.4 82.4 8.38 57.1
5 2.30 32.0 82.2 8.50 57.4
10 2.30 32.2 82.1 8.35 57.5
15 2.26 32.3 82.1 8.53 59.4
SW2 0 2.20 30.3 81.8 8.23 57.0
5 2.20 30.3 82.5 9.00 57.6
10 2.21 30.6 82.2 8.55 58.8
15 2.24 31.1 82.1 7.67 59.5
SW3 0 2.51 32.9 81.2 8.40 57.1
5 2.54 33.0 82.0 7.93 57.1
10 2.54 33.4 81.8 7.58 56.9
HW 0 0.919 23.0 88.5 6.98 51.7
5 0.963 23.1 88.7 7.15 51.4
10 0.932 22.8 88.9 7.35 51.6
15 0.940 22.8 88.7 7.03 51.3
22
Fibre length
According to tables 3 and 4 it seems likely that sonication does not affect the fibre
length, i.e. there is no cutting of fibres. In the case of Experiment 1 there are some
fluctuations in values but these can be due to statistical variance and it does not at all
seem probable that there is any shortening of the fibres. For the different pulps tested in
Experiment 2 the fibre length also keeps relatively constant. These results are supported
by the literature study e.g. Manning and Thompson [3].
Fibre width
For the samples sonicated in Experiment 1, it is hard to conclude if there is an increase
or a decrease in fibre width from the results in table 3. The average fibre width seems to
keep relatively constant for all different samples tested even though the results could
also be interpreted as if there is a small increase in fibre width for the dried pulps which
were defibrated at 0 kWh/t and mechanically pre-treated before sonication at 50 kWh/t
respectively. The softwood pulps in Experiment 2, see table 4, show indications on a
small increase in fibre width but it is difficult to tell if there really is an increase without
any replications of experiment. However it seems likely that there is an increase in fibre
width as this would be consistent with the identification of increased
swelling/fibrillation of fibres, which should result in an increased fibre width.
Fibre shape
The pulps of different refining degrees in Experiment 1, table 3, show relatively
inconsistent trends in fibre shape. The dried pulps which were previously refined at 50
and 100 kWh/t respectively before sonication seem to have been straightened by the
ultrasonic treatment. This is also the trend identified for the never-dried pulp despite one
confusing/non-consistent value. In contrast, the sample of dried pulp defibrated at 0
kWh/t showed what could be identified as a decrease in fibre shape, i.e. the fibre was
more curled than before the treatment. This is probably due to the fact that the reference
sample was defibrated in another piece of equipment than the sonicated pulp.
In the case of never-dried pulps in Experiment 2, table 4, it is most easily to interpret the
results as that there is no effect of ultrasonic treatment on the fibre shape. There is little
evidence that the fibres are neither straightened nor curled upon sonication even though
a replication of experiments would be needed to get more actual evidence for the
conclusion that fibres are unaffected in the sense of shape.
It seems therefore like there is more fibre straightening effect in conventional
mechanical refining but perhaps the results from ultrasonic refining could show more of
a straightening effect under other conditions than the ones used here. What is not known
in this case is if the pump in the sonication equipment has any effect on the fibre shape
for example. See Appendices, section A2, for a small investigation of possible pump
refining action. Perhaps other flow conditions would be able to straighten the fibres i.e.
it is not possible to say if it is the pump that curls the fibres or the ultrasonic treatment,
if they are curled at all.
Fines content
According to table 3 and 4 respectively it seems most likely that the fines content is not
increasing due to ultrasonic treatment. This is also in accordance with the observation of
constant fibre length. The results are strange in the sense that the fines amount is
decreasing in several cases in Experiment 1 as well as in Experiment 2. This is perhaps
23
due to that only a part of the total pulp amount from sonication was brought back to the
Värö plant for analysis in Experiment 1 and therefore some fines probably were lost. In
Experiment 2 the differences are probably due to experimental variance/lack of
replication of experiments (even though the values are averages from duplicates) and
the fact that it was not possible to get ideal mixing of the samples before taking out
samples for FM analysis. However the results on no fines formation imply that
ultrasonic refining is much gentler to the fibres than conventional mechanical refining.
These results are supported by Tatsumi et al. [27] and Manning and Thompson [3] for
example.
Kink angle
According to table 4 the average fibre kink angle is increased for some pulp qualities
meanwhile others remain unaffected. The hardwood pulp HW is not increasing its
average kink angle, which could be related to the fact that these fibres are shorter than
the softwood fibres. Among the softwoods the SW3 pulp, which consists of fibres with
higher coarseness than the other softwood pulps, remains at constant kink angle. This is
perhaps because of the coarser structure which makes the fibres more resistant to the
ultrasonic treatment. In contrast, both other softwood pulps; SW1 and SW2 reach larger
average kink angles with increased duration times of ultrasonic treatment. Perhaps this
is a result of the flow properties of the pulp in the recirculation system and pump. At
longer circulation times the pulp fibres showed an increasing tendency to plug the
system and the fibres still circulated in the system can have been affected by this.
Probably the flow of the hardwood pulp in the system was more ideal and less affected
by fibre flocculation and this fact can be the explanation to the constant kink angle for
these fibres.
24
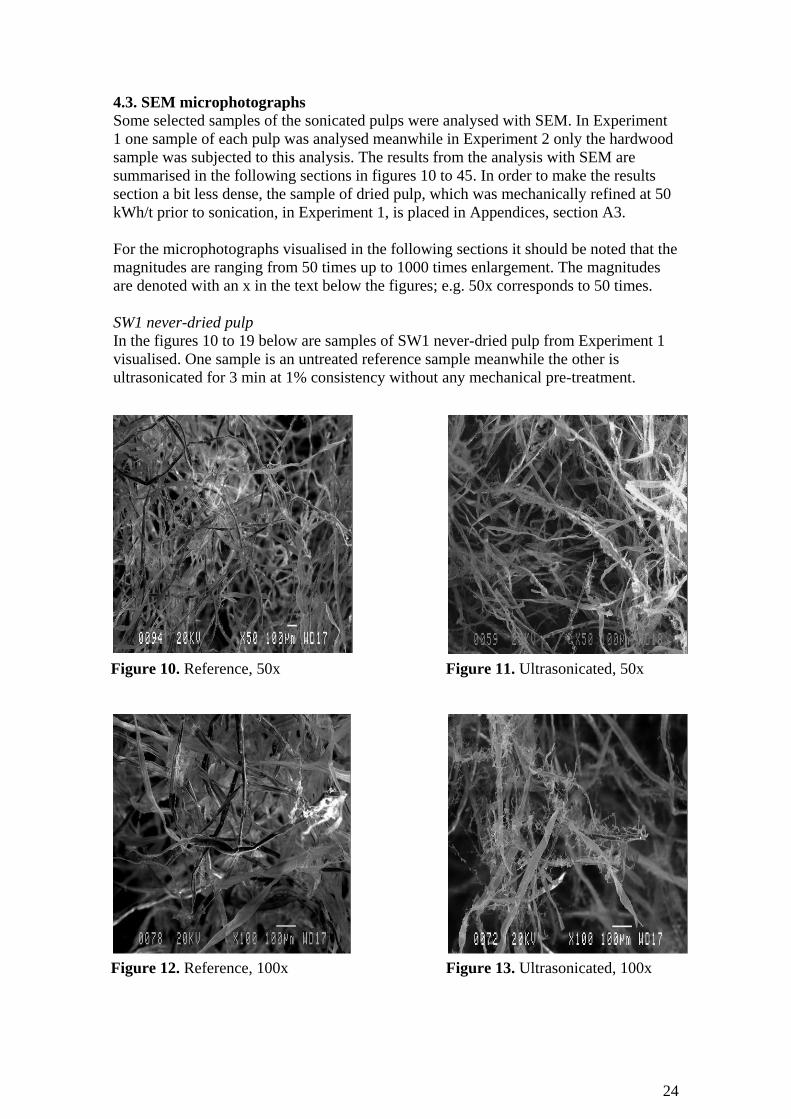
4.3. SEM microphotographs
Some selected samples of the sonicated pulps were analysed with SEM. In Experiment
1 one sample of each pulp was analysed meanwhile in Experiment 2 only the hardwood
sample was subjected to this analysis. The results from the analysis with SEM are
summarised in the following sections in figures 10 to 45. In order to make the results
section a bit less dense, the sample of dried pulp, which was mechanically refined at 50
kWh/t prior to sonication, in Experiment 1, is placed in Appendices, section A3.
For the microphotographs visualised in the following sections it should be noted that the
magnitudes are ranging from 50 times up to 1000 times enlargement. The magnitudes
are denoted with an x in the text below the figures; e.g. 50x corresponds to 50 times.
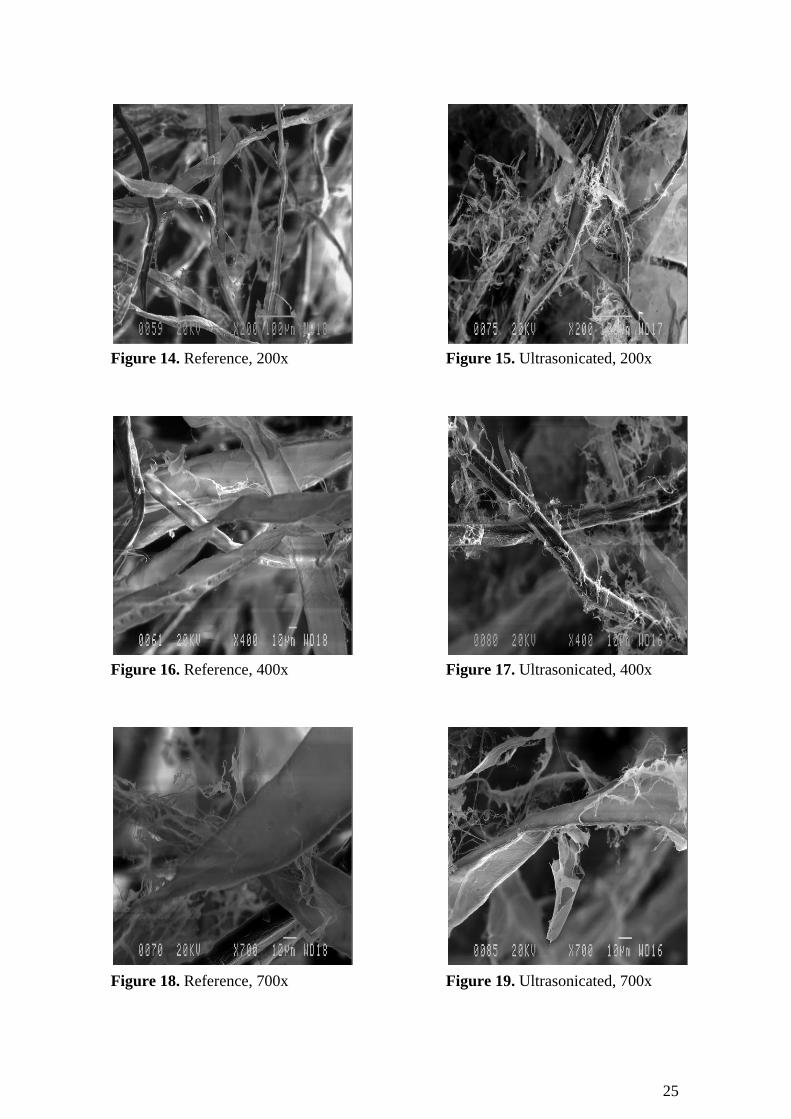
SW1 never-dried pulp
In the figures 10 to 19 below are samples of SW1 never-dried pulp from Experiment 1
visualised. One sample is an untreated reference sample meanwhile the other is
ultrasonicated for 3 min at 1% consistency without any mechanical pre-treatment.
Figure 10. Reference, 50x
Figure 11. Ultrasonicated, 50x
Figure 12. Reference, 100x
Figure 13. Ultrasonicated, 100x
25
Figure 15. Ultrasonicated, 200x
Figure 14. Reference, 200x
Figure 16. Reference, 400x
Figure 17. Ultrasonicated, 400x
Figure 18. Reference, 700x
Figure 19. Ultrasonicated, 700x
26
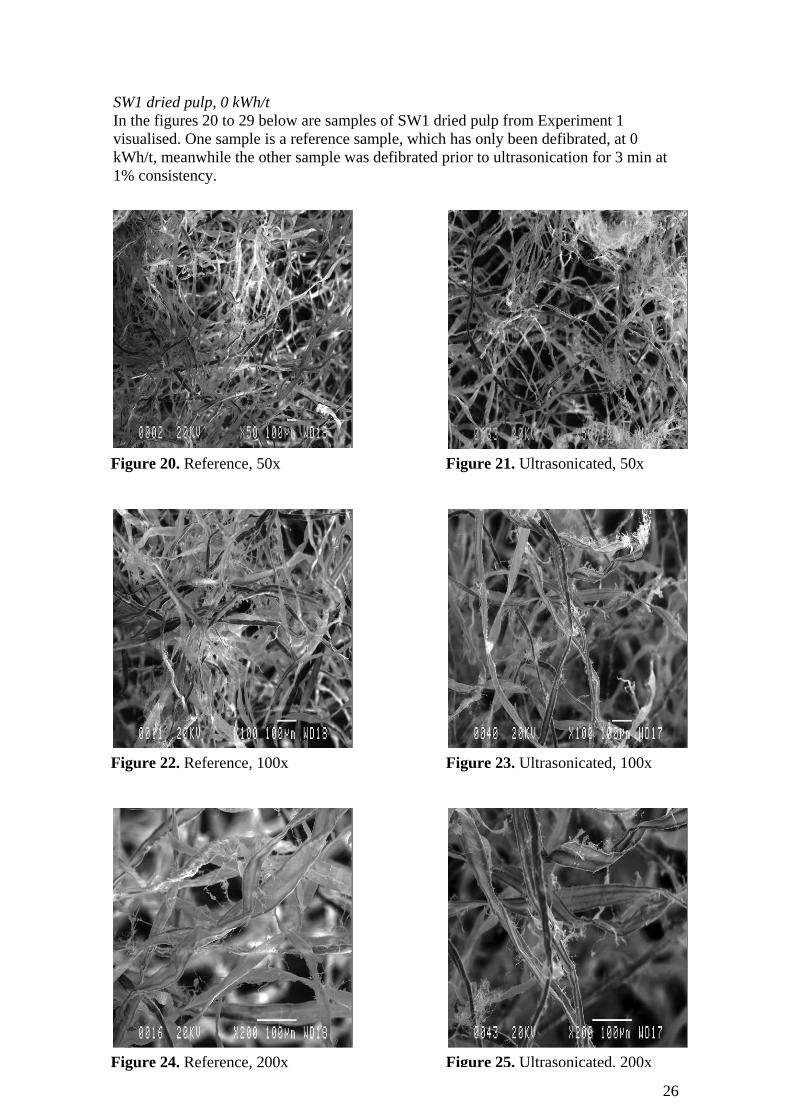
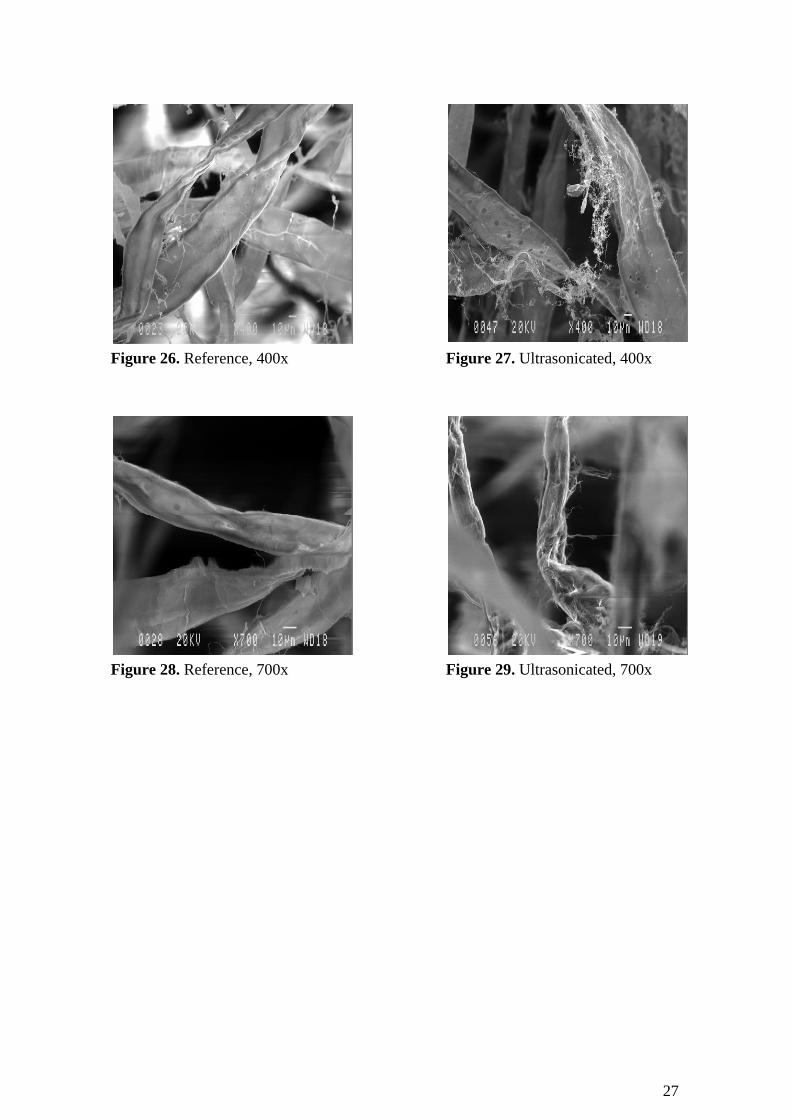
SW1 dried pulp, 0 kWh/t
In the figures 20 to 29 below are samples of SW1 dried pulp from Experiment 1
visualised. One sample is a reference sample, which has only been defibrated, at 0
kWh/t, meanwhile the other sample was defibrated prior to ultrasonication for 3 min at
1% consistency.
Figure 20. Reference, 50x
Figure 21. Ultrasonicated, 50x
Figure 22. Reference, 100x
Figure 23. Ultrasonicated, 100x
Figure 24. Reference, 200x
Figure 25. Ultrasonicated, 200x
27
Figure 26. Reference, 400x
Figure 27. Ultrasonicated, 400x
Figure 28. Reference, 700x
Figure 29. Ultrasonicated, 700x
28
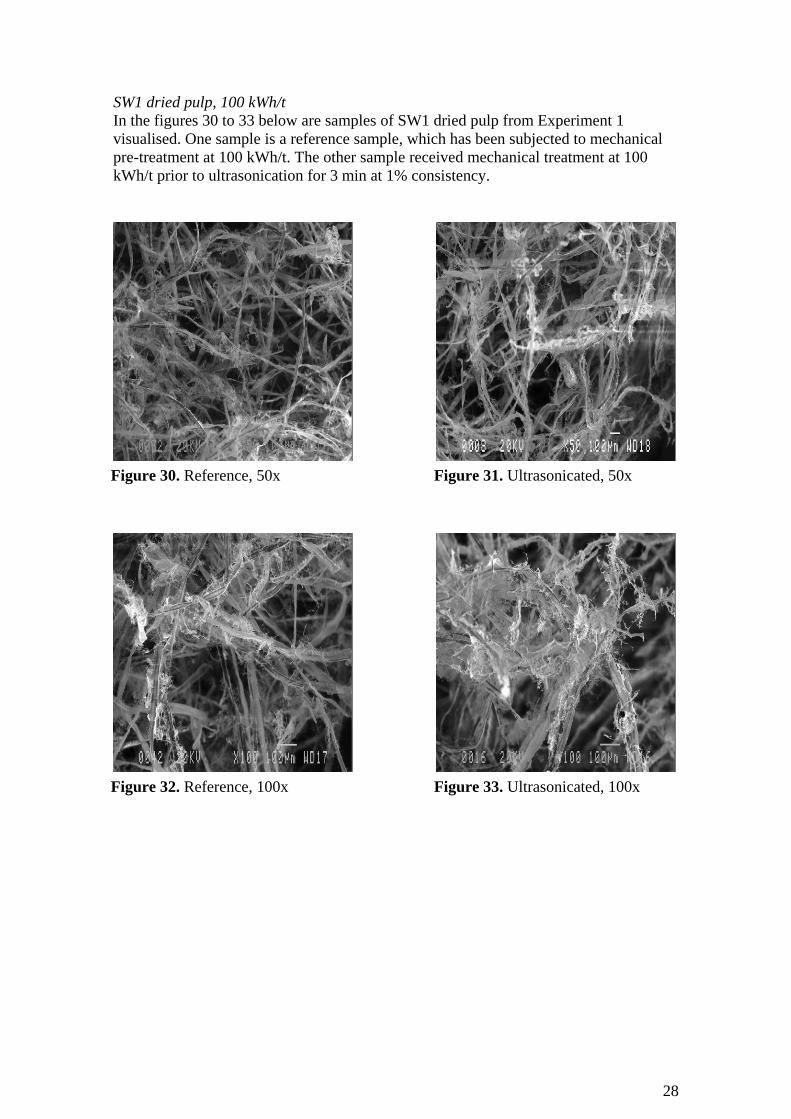
SW1 dried pulp, 100 kWh/t
In the figures 30 to 33 below are samples of SW1 dried pulp from Experiment 1
visualised. One sample is a reference sample, which has been subjected to mechanical
pre-treatment at 100 kWh/t. The other sample received mechanical treatment at 100
kWh/t prior to ultrasonication for 3 min at 1% consistency.
Figure 32. Reference, 100x
Figure 33. Ultrasonicated, 100x
Figure 30. Reference, 50x
Figure 31. Ultrasonicated, 50x
29
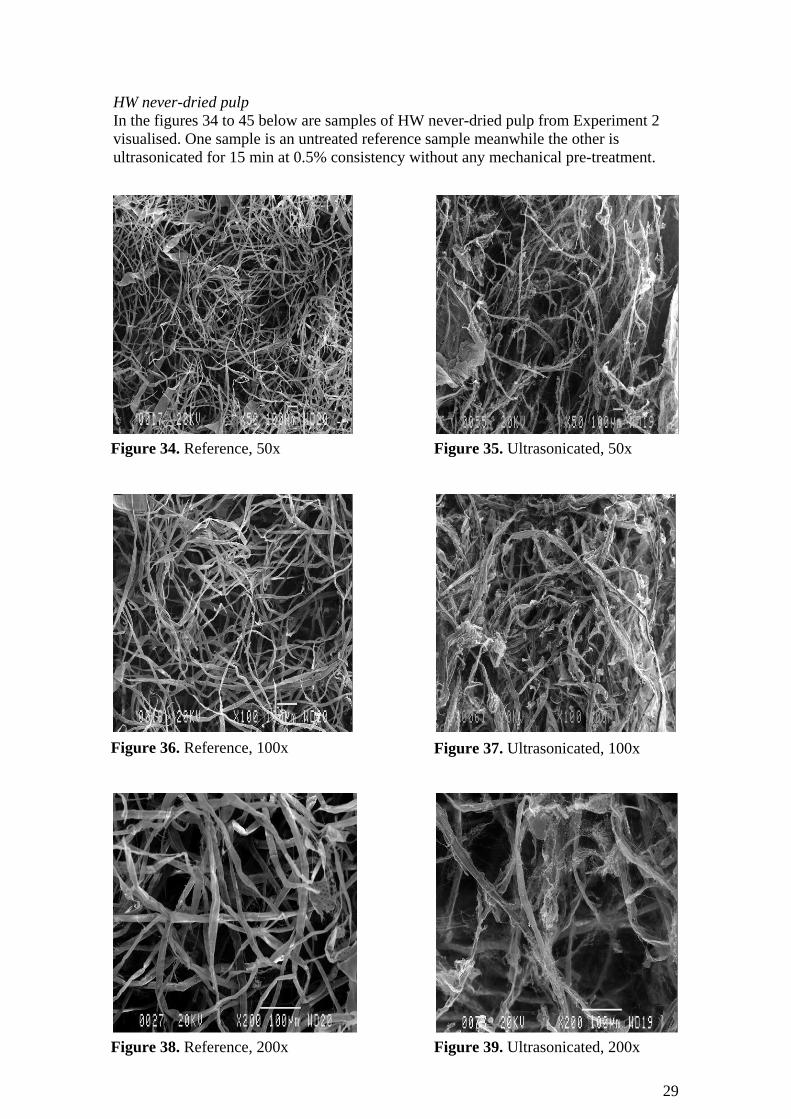
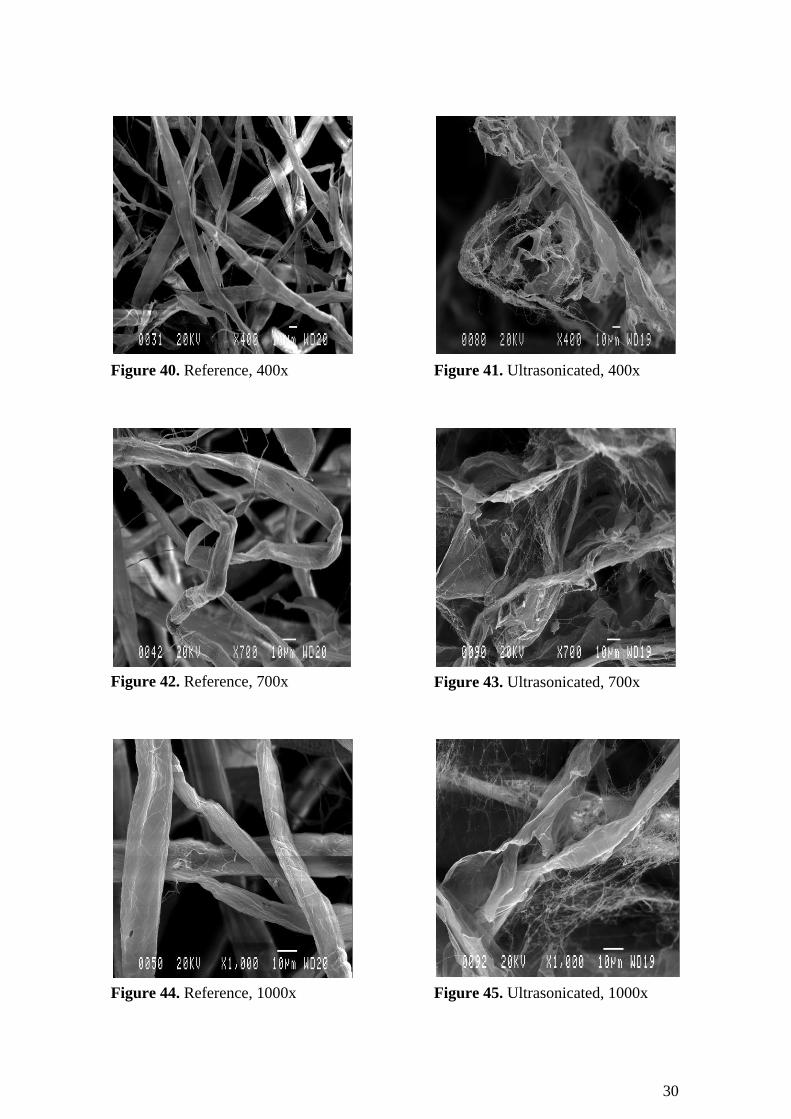
HW never-dried pulp
In the figures 34 to 45 below are samples of HW never-dried pulp from Experiment 2
visualised. One sample is an untreated reference sample meanwhile the other is
ultrasonicated for 15 min at 0.5% consistency without any mechanical pre-treatment.
Figure 34. Reference, 50x
Figure 35. Ultrasonicated, 50x
Figure 36. Reference, 100x
Figure 37. Ultrasonicated, 100x
Figure 38. Reference, 200x
Figure 39. Ultrasonicated, 200x
30
Figure 40. Reference, 400x
Figure 41. Ultrasonicated, 400x
Figure 42. Reference, 700x
Figure 43. Ultrasonicated, 700x
Figure 44. Reference, 1000x
Figure 45. Ultrasonicated, 1000x
31
According to the microphotographs in figures 10 to 45 it can be concluded that there in
some cases is an increase in external fibrillation of fibre surfaces, especially in the
never-dried samples this effect is clearly evident. In some other cases it is hard to tell
whether or not there really is an increase in fibrillation.
In the case of dried pulps in Experiment 1, which received mechanical pre-treatment in
a laboratory refiner before being sonicated, it is hard to tell whether there has been an
increase in fibrillation or not. However it is in accordance with the other results on the
dried pulp samples in Experiment 1 that there is only a slight (or no) increase in
fibrillation as a result of sonication. For example the tensile index was little affected by
the sonication. Considering the dried pulp in Experiment 1, which had been defibrated
without any mechanical treatment prior to sonication, it seems likely that there is a
small effect on fibrillation in the sample even though it is not very clear. In contrast it is
very evident that there is an increase in fibrillation in the two never-dried samples, for
the SW1 softwood pulp as well as for the HW hardwood pulp the effect is clearly
visible.
From the microphotographs it can, besides the increased outer fibrillation, be concluded
that there does not seem to be any fibre cutting or visible kink formation. The results are
all in accordance with results from the other analyses performed in this project and can
as well be supported by other research studies, see e.g. Manning and Thompson [3] and
Tatsumi et al. [27].
In the discussion about SEM analysis results it should be added that all pictures taken of
the samples are randomly selected and there is a possibility that the fibres look different
in other parts of the sample. However large parts of the sample were being scanned in
the SEM analysis and a lot of microphotographs were taken to ensure reliable results.
The microphotographs presented in this report were considered representative for their
respective sample.
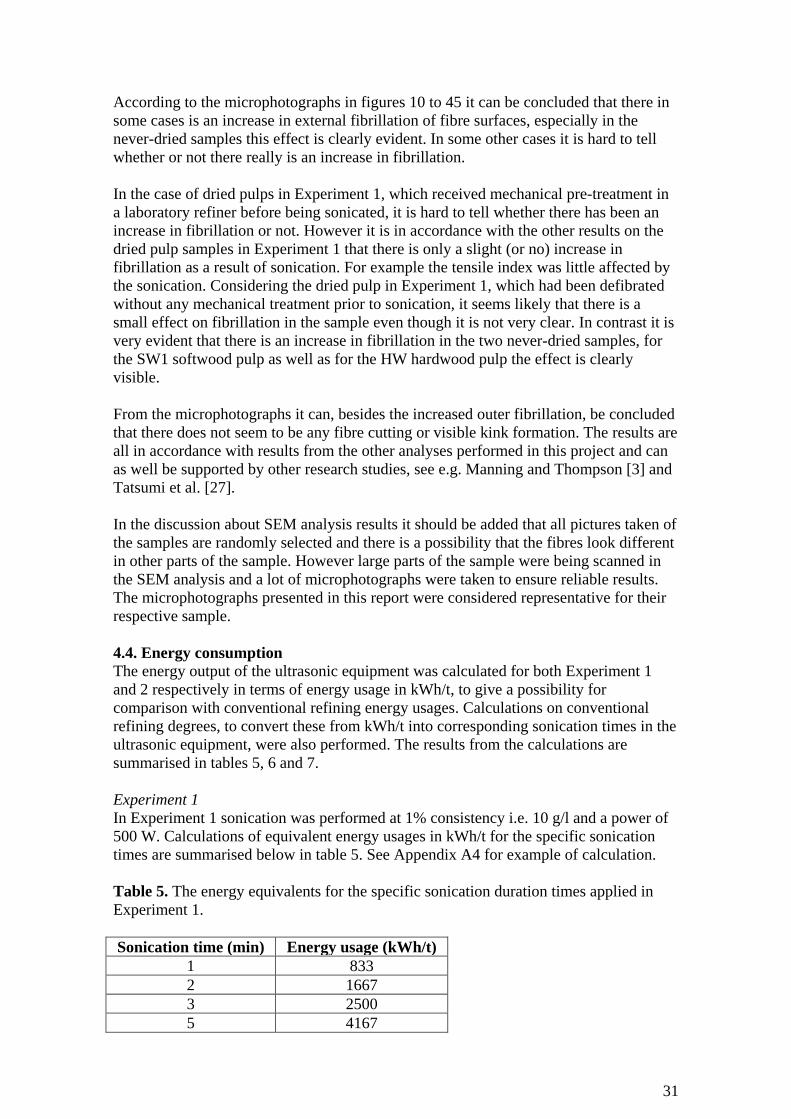
4.4. Energy consumption
The energy output of the ultrasonic equipment was calculated for both Experiment 1
and 2 respectively in terms of energy usage in kWh/t, to give a possibility for
comparison with conventional refining energy usages. Calculations on conventional
refining degrees, to convert these from kWh/t into corresponding sonication times in the
ultrasonic equipment, were also performed. The results from the calculations are
summarised in tables 5, 6 and 7.
Experiment 1
In Experiment 1 sonication was performed at 1% consistency i.e. 10 g/l and a power of
500 W. Calculations of equivalent energy usages in kWh/t for the specific sonication
times are summarised below in table 5. See Appendix A4 for example of calculation.
Table 5. The energy equivalents for the specific sonication duration times applied in
Experiment 1.
Sonication time (min) Energy usage (kWh/t)
1 833
2 1667
3 2500
5 4167
32
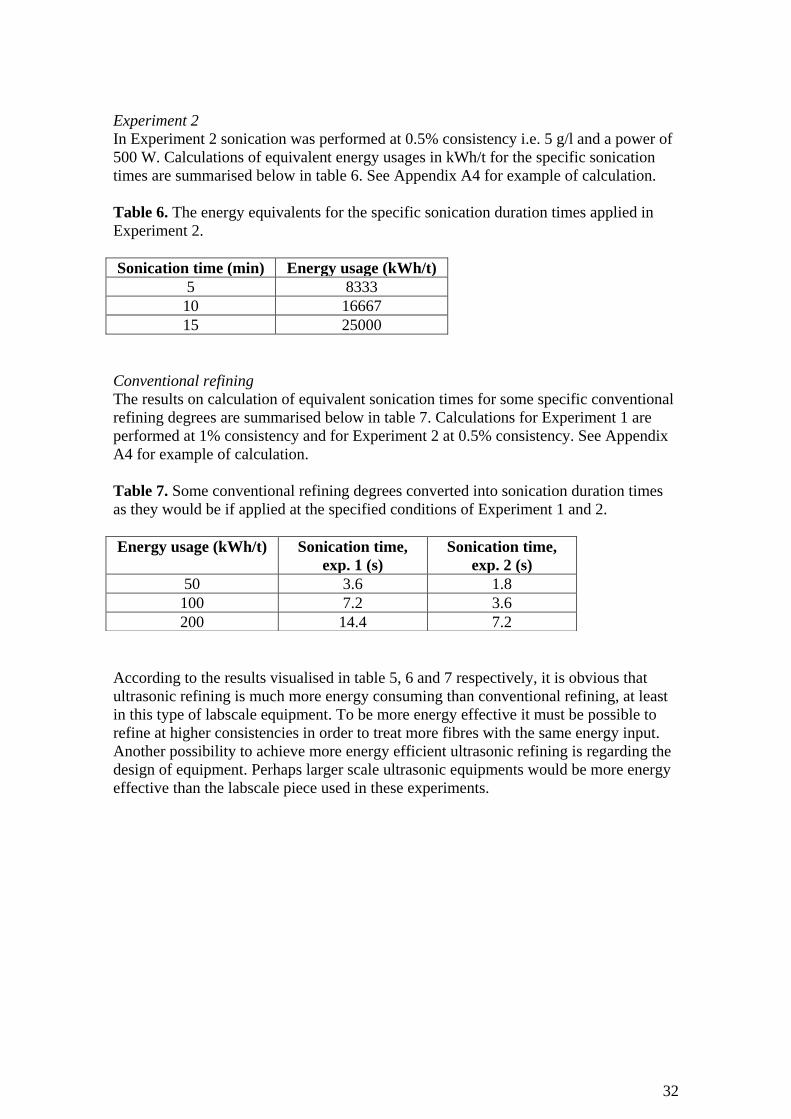
Experiment 2
In Experiment 2 sonication was performed at 0.5% consistency i.e. 5 g/l and a power of
500 W. Calculations of equivalent energy usages in kWh/t for the specific sonication
times are summarised below in table 6. See Appendix A4 for example of calculation.
Table 6. The energy equivalents for the specific sonication duration times applied in
Experiment 2.
Sonication time (min) Energy usage (kWh/t)
5 8333
10 16667
15 25000
Conventional refining
The results on calculation of equivalent sonication times for some specific conventional
refining degrees are summarised below in table 7. Calculations for Experiment 1 are
performed at 1% consistency and for Experiment 2 at 0.5% consistency. See Appendix
A4 for example of calculation.
Table 7. Some conventional refining degrees converted into sonication duration times
as they would be if applied at the specified conditions of Experiment 1 and 2.
According to the results visualised in table 5, 6 and 7 respectively, it is obvious that
ultrasonic refining is much more energy consuming than conventional refining, at least
in this type of labscale equipment. To be more energy effective it must be possible to
refine at higher consistencies in order to treat more fibres with the same energy input.
Another possibility to achieve more energy efficient ultrasonic refining is regarding the
design of equipment. Perhaps larger scale ultrasonic equipments would be more energy
effective than the labscale piece used in these experiments.
Energy usage (kWh/t) Sonication time,
exp. 1 (s)
Sonication time,
exp. 2 (s)
50 3.6 1.8
100 7.2 3.6
200 14.4 7.2
33
5. Conclusion
In this investigation two types of results were of interest; the effect of ultrasound on the
pulp fibres and the energy consumption of the ultrasonic equipment. Regarding pulp
properties it was found out that fibre modifications are obtained when exposing pulp
samples to ultrasound. In the case of dried pulps, with or without mechanical pre-
treatment, the effects of sonication were small if any at all. Probably this is a result of
hornification of fibres during the drying operation, which makes the fibres less prone to
swelling and fibrillation of the fibre wall when exposed to ultrasound. However it was
shown that the never-dried pulps, in the case of softwood as well as hardwood, were
refined by the ultrasonic waves.
Analyses of the never-dried pulps showed an increase in inner and outer fibrillation of
fibres. These conclusions were drawn from significant increases in WRVs, Schopper-
Riegler number and tensile index. The increase in outer fibrillation could also be
identified on SEM microphotographs taken of one of the softwood pulps and the
hardwood pulp. Another important result on fibre level is the fact that there does not
seem to be any fibre cutting or creation of fines material. All the results obtained in the
experiments could be more or less supported by each others and the literature study
included in the project.
Concerning the energy aspects of sonication in this equipment, the results on energy
consumption implies that this technique is not an alternative to conventional refining as
it is many times more energy consuming. The values on energy consumption should be
considered specific for the particular lab scale equipment used in this project and does
not automatically imply that ultrasonic refining always is a waste of energy. Other
equipments of a different design may be more efficient and there is also a possibility
that ultrasonic refining can be less energy consuming when implemented in larger scale.
Perhaps future innovations can make ultrasonic refining beneficial in terms of energy
consumption.
34
6. Suggestions for future work
For further investigation of the method of ultrasonic refining it is above all of interest to
evaluate if there are ways to achieve more energy efficient refining than what was the
case in this study. It could therefore be of interest to investigate other types of
equipment in order to evaluate the energy efficiency of these. Other types of ultrasonic
systems and other types of pumps could perhaps be more efficient and suitable for
ultrasonic refining of pulp fibres.
As the mono pump used in this project was not very suitable for pulp fibres and had a
tendency to plug when coarser softwood fibres were circulated in the system, this could
have had a negative impact on the flow properties of the pulp suspension. In this way it
may also have resulted in a less efficient ultrasonication process in the flow cell. It is
not known whether the larger ultrasonic effect on hardwood fibres, in comparison to the
softwood pulps, to some extent had to do with the flow properties of these shorter
fibres. It would therefore be of interest to investigate if other equipments with more
suitable pump design could result in better flow properties and larger effect on softwood
fibres.
Besides it is also of interest to investigate if there are possibilities to pump fibres at
higher consistencies. This could be a way to achieve a more energy efficient
ultrasonication process. Finally, regarding the physical properties of pulp fibres it could
be of interest to investigate if the developed physical fibre properties, which resulted
from the ultrasonic treatment, would remain after drying of the pulp.
35
References
1. Smook, G. A. Handbook for pulp & paper technologists, 2nd
ed; Angus Wilde
Publications Inc.: Vancouver, 1994; pp 1-2
2. Södra Skogsägarna Ekonomisk Förening website. Available:
http://www.sodra.com/en/About-Sodra/ [retrieved: 2010-02-09]
3. Manning, A.; Thompson, R., The influence of ultrasound on virgin paper fibers.
Progress in Paper Recycling. 2002, 11(4):6-12
4. Brodeur, P. H.; Gerhardstein, J. P., Overview of Applications of Ultrasonics in the
Pulp and Paper Industry. Proceedings of IEEE International Ultrasonics Symposium,
Sendai, Japan, October 1998
5. Lumiainen, J. Chapter 4, Refining of chemical pulp. In Papermaking science and
technology 8. Papermaking. Part 1, stock preparation and wet end; Paulapuro, H.;
Fapet Oy; Helsinki, 2000; pp 86-122
6. Mason, T. J.; Lorimer, J. P. Applied sonochemistry: uses of power ultrasound in
chemistry and processing, Wiley-VCH Verlag GmbH: Weinheim, 2002; p 5
7. Hielscher Ultrasonics website. Available:
http://www.hielscher.com/ultrasonics/industries.htm [retrieved: 2010-08-11]
8. Mason, T. J.; Lorimer, J. P. Applied sonochemistry: uses of power ultrasound in
chemistry and processing, Wiley-VCH Verlag GmbH: Weinheim, 2002; p 4
9. Mason, T. J.; Lorimer, J. P. Applied sonochemistry: uses of power ultrasound in
chemistry and processing, Wiley-VCH Verlag GmbH: Weinheim, 2002; p 20
10. Mason, T. J.; Lorimer, J. P. Applied sonochemistry: uses of power ultrasound in
chemistry and processing, Wiley-VCH Verlag GmbH: Weinheim, 2002; p 25
11. Manning, A.; Thompson, R., A review of ultrasound and its applications in
papermaking. Progress in Paper Recycling. 2005, 14(2):26-40
12. Mason, T. J.; Lorimer, J. P. Applied sonochemistry: uses of power ultrasound in
chemistry and processing, Wiley-VCH Verlag GmbH: Weinheim, 2002; p 270-271
13. Hielscher Ultrasonics website. Available:
http://www.hielscher.com/image/uip1000_set_pump_2_p0500.jpg [retrieved: 2010-06-
20]
14. Hielscher Ultrasonics website. Available:
http://www.hielscher.com/image/uip1000hd_generator_p0500.jpg [retrieved: 2010-06-
20]
15. Brännvall, E. Chapter 13, Pulp characterisation. In The Ljungberg textbook 2005,
Fibre and Polymer Technology KTH; Stockholm, 2004; p 14
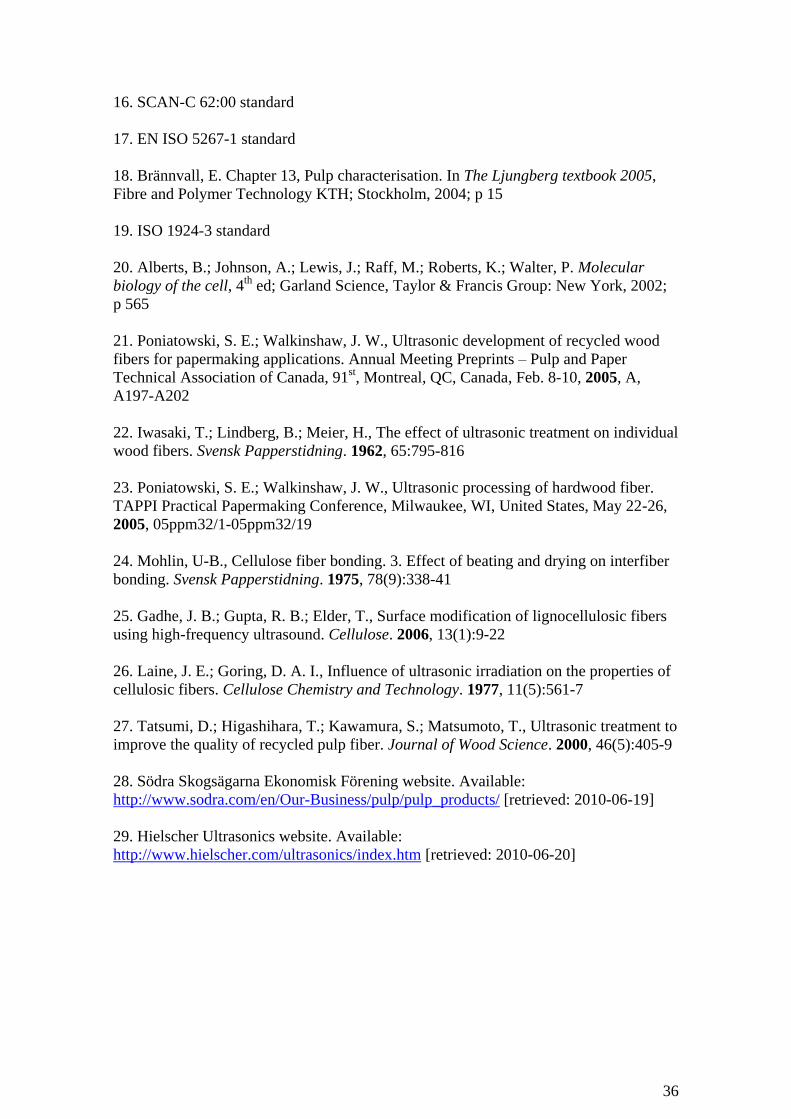
36
16. SCAN-C 62:00 standard
17. EN ISO 5267-1 standard
18. Brännvall, E. Chapter 13, Pulp characterisation. In The Ljungberg textbook 2005,
Fibre and Polymer Technology KTH; Stockholm, 2004; p 15
19. ISO 1924-3 standard
20. Alberts, B.; Johnson, A.; Lewis, J.; Raff, M.; Roberts, K.; Walter, P. Molecular
biology of the cell, 4th
ed; Garland Science, Taylor & Francis Group: New York, 2002;
p 565
21. Poniatowski, S. E.; Walkinshaw, J. W., Ultrasonic development of recycled wood
fibers for papermaking applications. Annual Meeting Preprints – Pulp and Paper
Technical Association of Canada, 91st, Montreal, QC, Canada, Feb. 8-10, 2005, A,
A197-A202
22. Iwasaki, T.; Lindberg, B.; Meier, H., The effect of ultrasonic treatment on individual
wood fibers. Svensk Papperstidning. 1962, 65:795-816
23. Poniatowski, S. E.; Walkinshaw, J. W., Ultrasonic processing of hardwood fiber.
TAPPI Practical Papermaking Conference, Milwaukee, WI, United States, May 22-26,
2005, 05ppm32/1-05ppm32/19
24. Mohlin, U-B., Cellulose fiber bonding. 3. Effect of beating and drying on interfiber
bonding. Svensk Papperstidning. 1975, 78(9):338-41
25. Gadhe, J. B.; Gupta, R. B.; Elder, T., Surface modification of lignocellulosic fibers
using high-frequency ultrasound. Cellulose. 2006, 13(1):9-22
26. Laine, J. E.; Goring, D. A. I., Influence of ultrasonic irradiation on the properties of
cellulosic fibers. Cellulose Chemistry and Technology. 1977, 11(5):561-7
27. Tatsumi, D.; Higashihara, T.; Kawamura, S.; Matsumoto, T., Ultrasonic treatment to
improve the quality of recycled pulp fiber. Journal of Wood Science. 2000, 46(5):405-9
28. Södra Skogsägarna Ekonomisk Förening website. Available:
http://www.sodra.com/en/Our-Business/pulp/pulp_products/ [retrieved: 2010-06-19]
29. Hielscher Ultrasonics website. Available:
http://www.hielscher.com/ultrasonics/index.htm [retrieved: 2010-06-20]

37
Appendices
Appendix A1 Experimental values
Appendix A2 Investigation of pump refining action on pulp
Appendix A3 Complementary SEM microphotographs
Appendix A4 Energy calculations
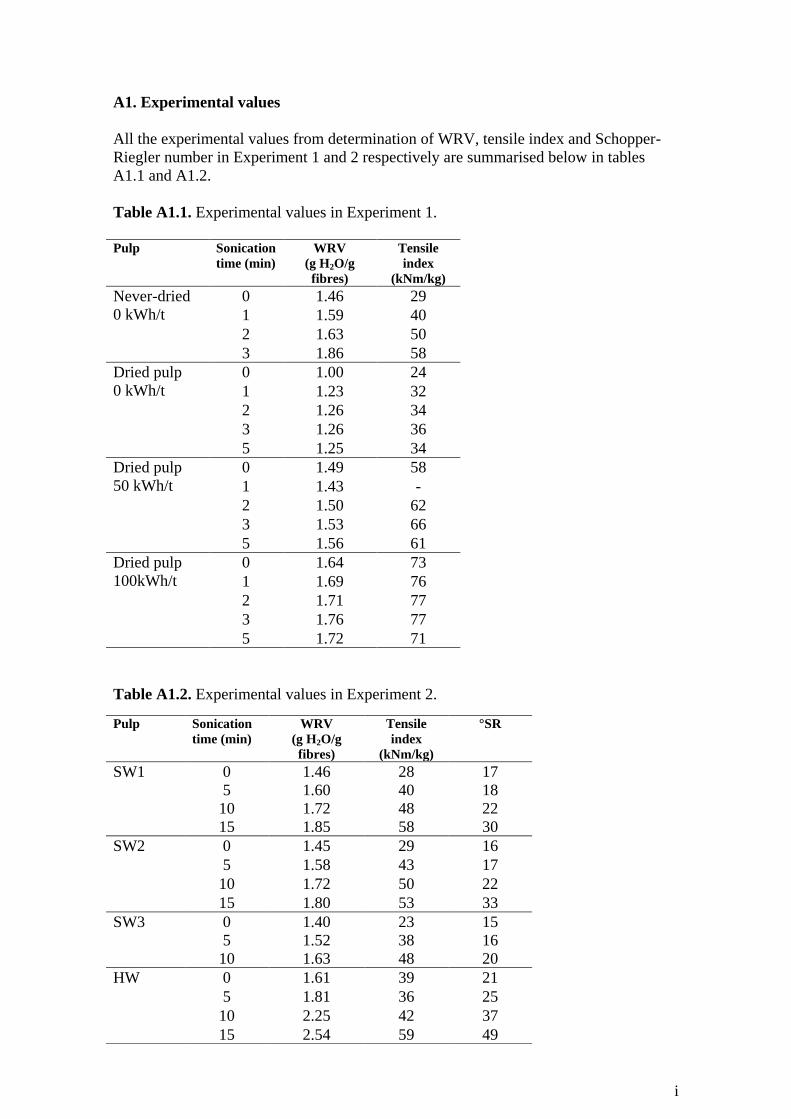
i
A1. Experimental values
All the experimental values from determination of WRV, tensile index and Schopper-
Riegler number in Experiment 1 and 2 respectively are summarised below in tables
A1.1 and A1.2.
Table A1.1. Experimental values in Experiment 1.
Pulp Sonication
time (min)
WRV
(g H2O/g
fibres)
Tensile
index
(kNm/kg)
Never-dried
0 kWh/t
0 1.46 29
1 1.59 40
2 1.63 50
3 1.86 58
Dried pulp
0 kWh/t
0 1.00 24
1 1.23 32
2 1.26 34
3 1.26 36
5 1.25 34
Dried pulp
50 kWh/t
0 1.49 58
1 1.43 -
2 1.50 62
3 1.53 66
5 1.56 61
Dried pulp
100kWh/t
0 1.64 73
1 1.69 76
2 1.71 77
3 1.76 77
5 1.72 71
Table A1.2. Experimental values in Experiment 2.
Pulp Sonication
time (min)
WRV
(g H2O/g
fibres)
Tensile
index
(kNm/kg)
°SR
SW1 0 1.46 28 17
5 1.60 40 18
10 1.72 48 22
15 1.85 58 30
SW2 0 1.45 29 16
5 1.58 43 17
10 1.72 50 22
15 1.80 53 33
SW3 0 1.40 23 15
5 1.52 38 16
10 1.63 48 20
HW 0 1.61 39 21
5 1.81 36 25
10 2.25 42 37
15 2.54 59 49
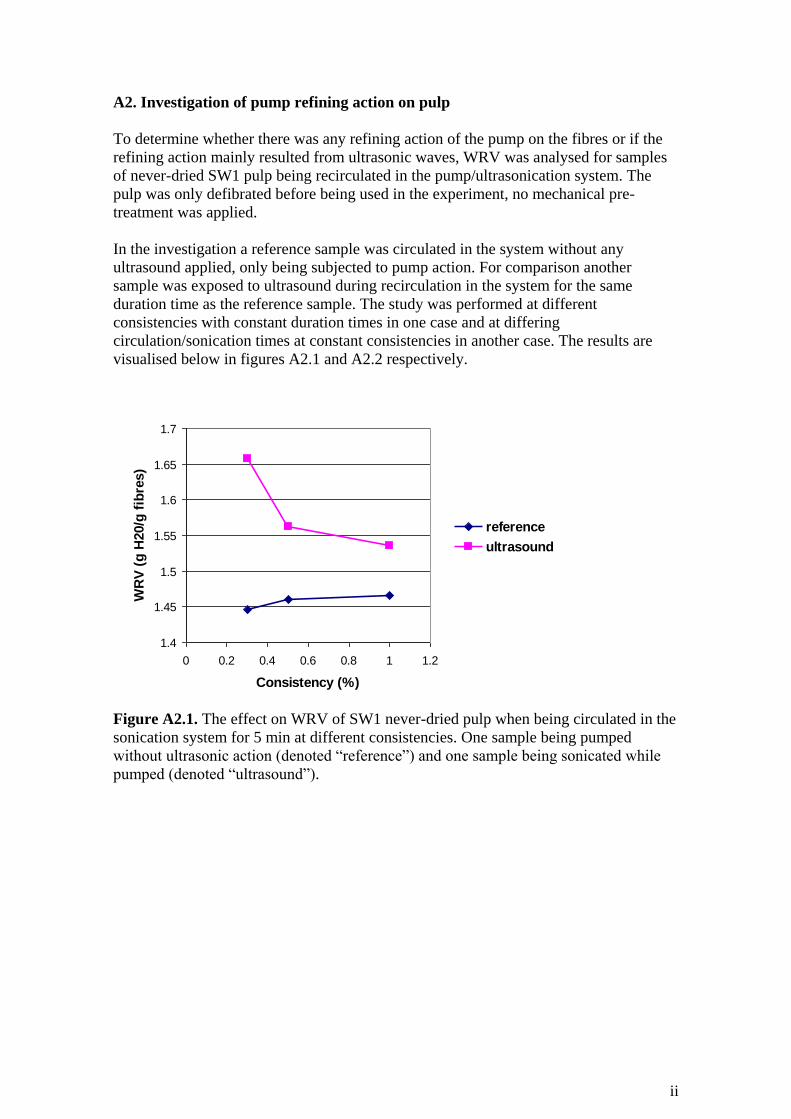
ii
A2. Investigation of pump refining action on pulp
To determine whether there was any refining action of the pump on the fibres or if the
refining action mainly resulted from ultrasonic waves, WRV was analysed for samples
of never-dried SW1 pulp being recirculated in the pump/ultrasonication system. The
pulp was only defibrated before being used in the experiment, no mechanical pre-
treatment was applied.
In the investigation a reference sample was circulated in the system without any
ultrasound applied, only being subjected to pump action. For comparison another
sample was exposed to ultrasound during recirculation in the system for the same
duration time as the reference sample. The study was performed at different
consistencies with constant duration times in one case and at differing
circulation/sonication times at constant consistencies in another case. The results are
visualised below in figures A2.1 and A2.2 respectively.
1.4
1.45
1.5
1.55
1.6
1.65
1.7
0 0.2 0.4 0.6 0.8 1 1.2
Consistency (%)
WR
V (
g H
20/g
fib
res)
reference
ultrasound
Figure A2.1. The effect on WRV of SW1 never-dried pulp when being circulated in the
sonication system for 5 min at different consistencies. One sample being pumped
without ultrasonic action (denoted “reference”) and one sample being sonicated while
pumped (denoted “ultrasound”).
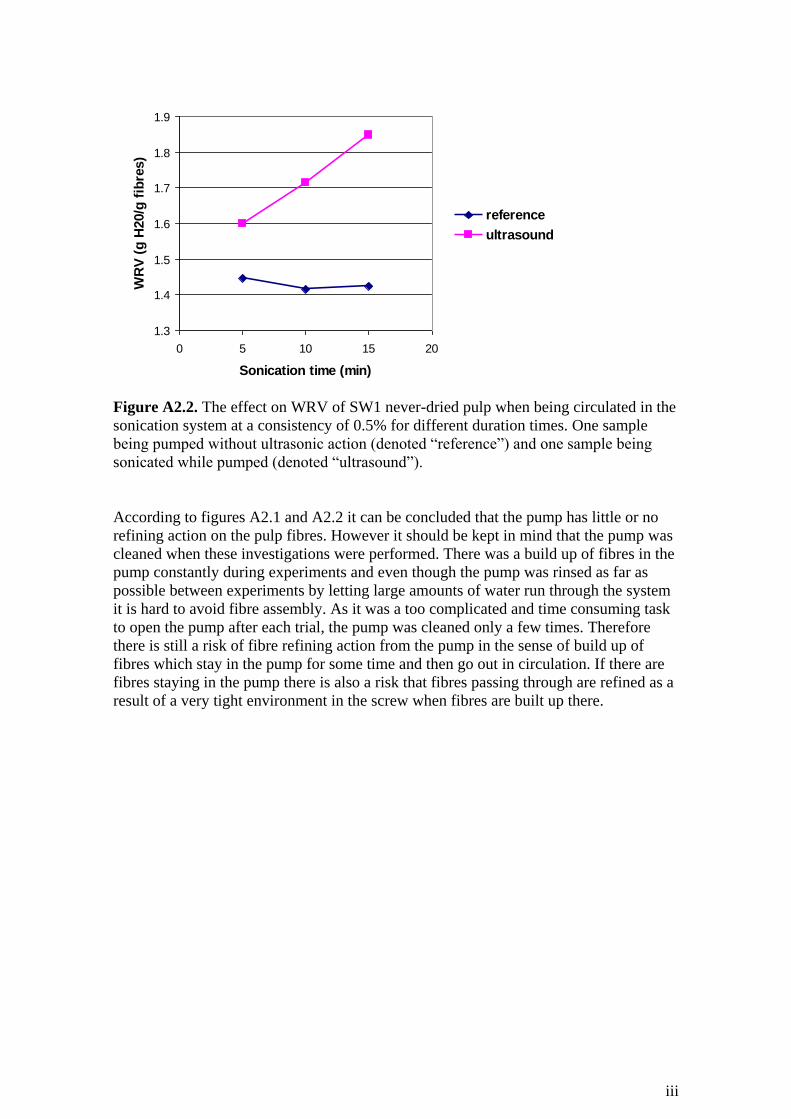
iii
1.3
1.4
1.5
1.6
1.7
1.8
1.9
0 5 10 15 20
Sonication time (min)
WR
V (
g H
20/g
fib
res)
reference
ultrasound
Figure A2.2. The effect on WRV of SW1 never-dried pulp when being circulated in the
sonication system at a consistency of 0.5% for different duration times. One sample
being pumped without ultrasonic action (denoted “reference”) and one sample being
sonicated while pumped (denoted “ultrasound”).
According to figures A2.1 and A2.2 it can be concluded that the pump has little or no
refining action on the pulp fibres. However it should be kept in mind that the pump was
cleaned when these investigations were performed. There was a build up of fibres in the
pump constantly during experiments and even though the pump was rinsed as far as
possible between experiments by letting large amounts of water run through the system
it is hard to avoid fibre assembly. As it was a too complicated and time consuming task
to open the pump after each trial, the pump was cleaned only a few times. Therefore
there is still a risk of fibre refining action from the pump in the sense of build up of
fibres which stay in the pump for some time and then go out in circulation. If there are
fibres staying in the pump there is also a risk that fibres passing through are refined as a
result of a very tight environment in the screw when fibres are built up there.
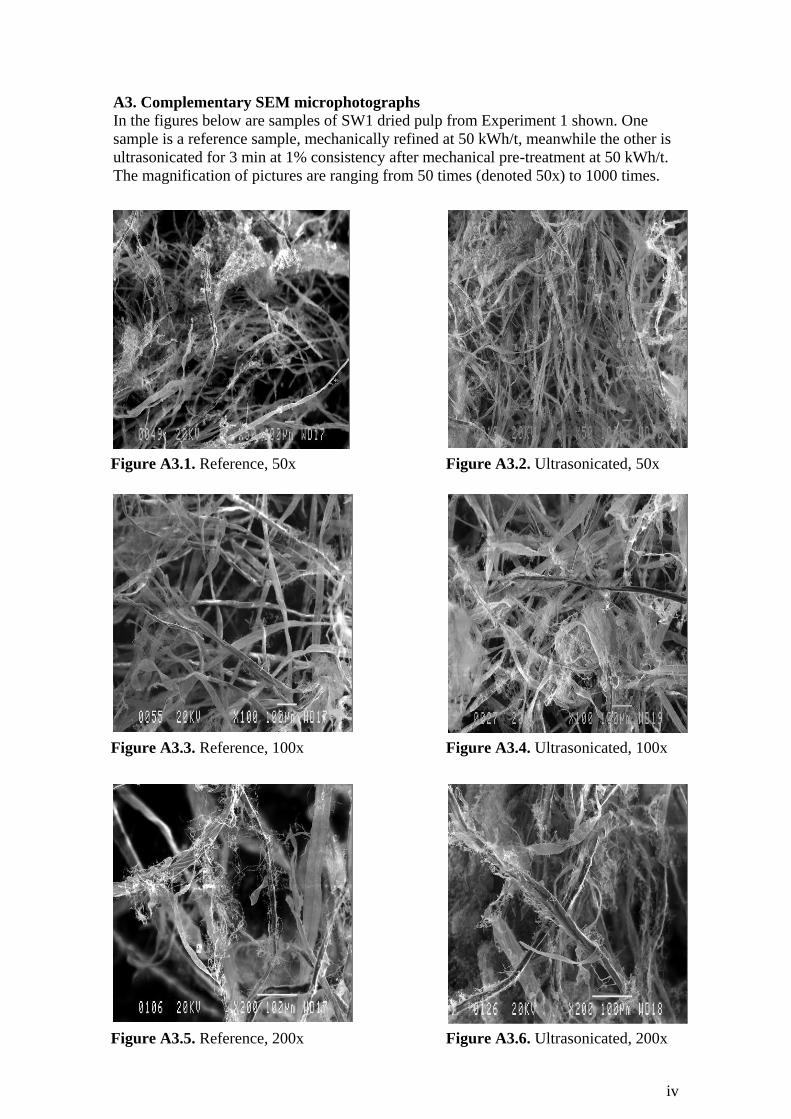
iv
A3. Complementary SEM microphotographs
In the figures below are samples of SW1 dried pulp from Experiment 1 shown. One
sample is a reference sample, mechanically refined at 50 kWh/t, meanwhile the other is
ultrasonicated for 3 min at 1% consistency after mechanical pre-treatment at 50 kWh/t.
The magnification of pictures are ranging from 50 times (denoted 50x) to 1000 times.
Figure A3.1. Reference, 50x
Figure A3.2. Ultrasonicated, 50x
Figure A3.3. Reference, 100x
Figure A3.4. Ultrasonicated, 100x
Figure A3.5. Reference, 200x
Figure A3.6. Ultrasonicated, 200x
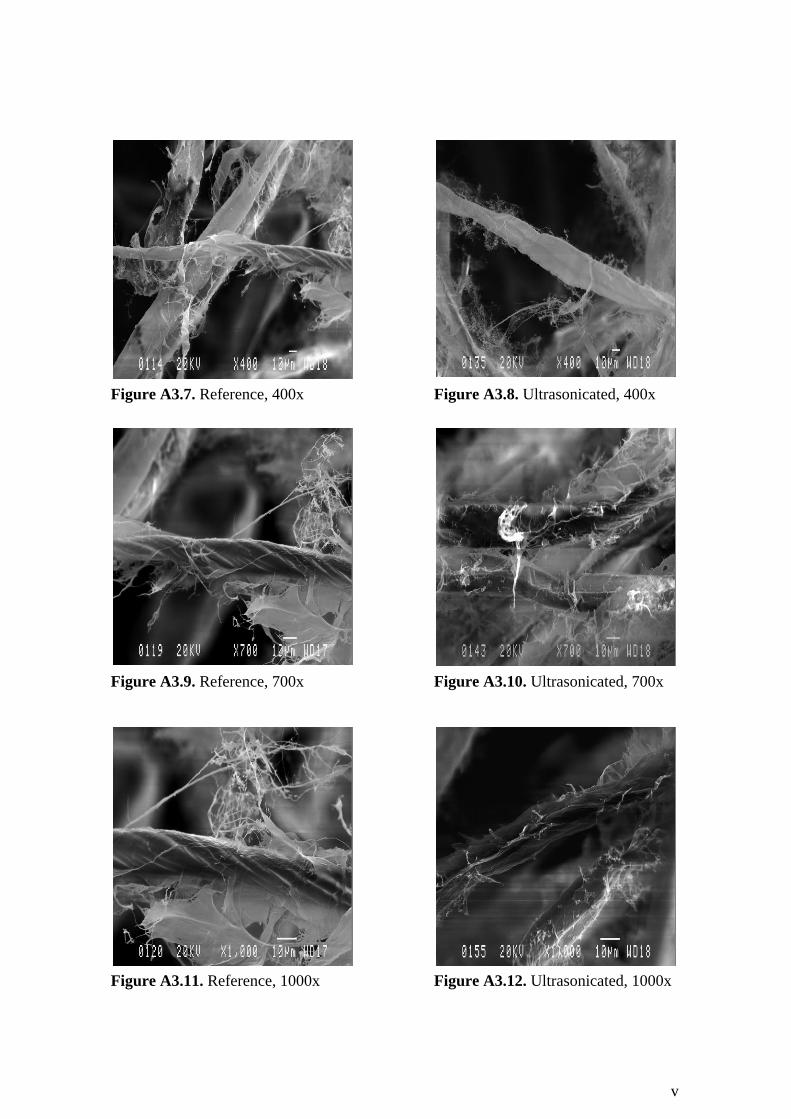
v
Figure A3.7. Reference, 400x
Figure A3.8. Ultrasonicated, 400x
Figure A3.9. Reference, 700x
Figure A3.10. Ultrasonicated, 700x
Figure A3.11. Reference, 1000x
Figure A3.12. Ultrasonicated, 1000x
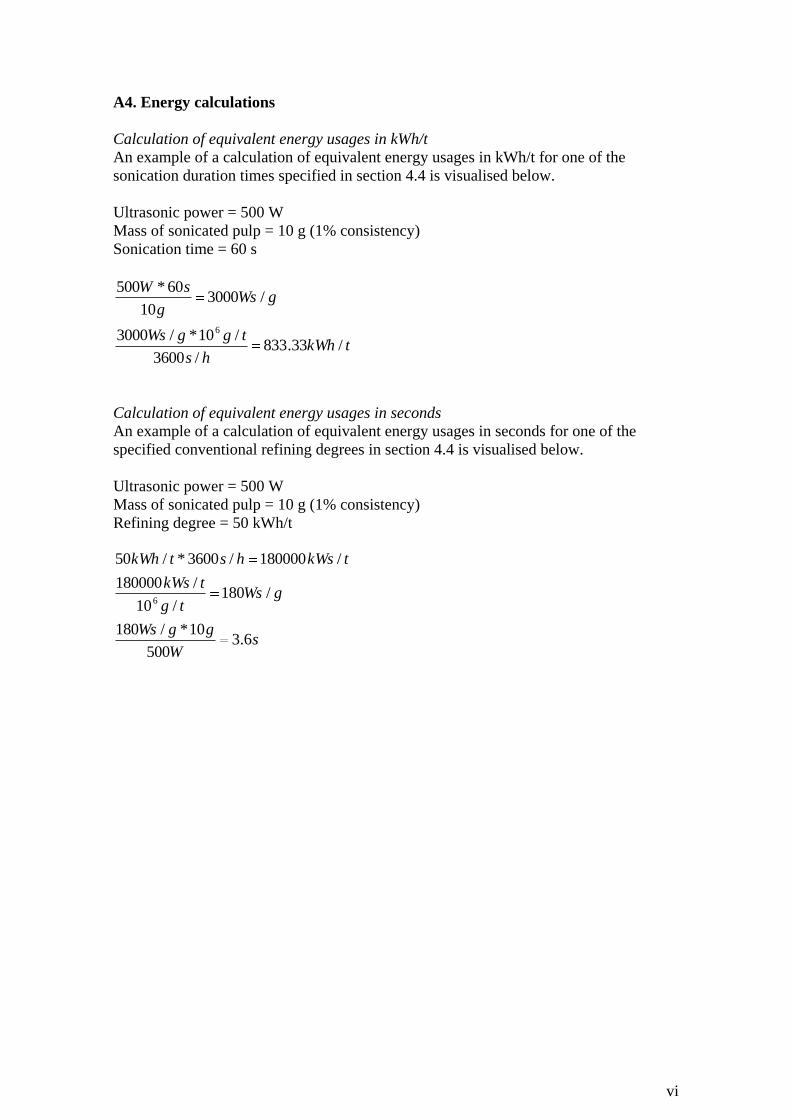
vi
A4. Energy calculations
Calculation of equivalent energy usages in kWh/t
An example of a calculation of equivalent energy usages in kWh/t for one of the
sonication duration times specified in section 4.4 is visualised below.
Ultrasonic power = 500 W
Mass of sonicated pulp = 10 g (1% consistency)
Sonication time = 60 s
tkWhhs
tggWs
gWsg
sW
/33.833/3600
/10*/3000
/300010
60*500
6
Calculation of equivalent energy usages in seconds
An example of a calculation of equivalent energy usages in seconds for one of the
specified conventional refining degrees in section 4.4 is visualised below.
Ultrasonic power = 500 W
Mass of sonicated pulp = 10 g (1% consistency)
Refining degree = 50 kWh/t
sW
ggWs
gWstg
tkWs
tkWshstkWh
6.3500
10*/180
/180/10
/180000
/180000/3600*/50
6


![PEER-REVIEWED ARTICLE bioresources..., [kWh/ton of dry matter] (3) where P net is the effective (net) refining power [kW], q m is the pulp flow through refining zone [m3/h], c F is](https://img.pdfslide.us/doc/110x75/5ed64c8a78712e3cdc0fd311/peer-reviewed-article-bioresources-kwhton-of-dry-matter-3-where-p-net.jpg)