Embed Size (px)
Citation preview

Ultrasonic Characterization of Microstructures in Inertia Friction Welds on SiC-Reinforced
8009 Aluminum
Ultrasonic techniques allowed rapid determination of the patterns of flow lines in the welds as well as the dimensions of the various weld zones
as functions of position
BY T. J. LIENERT, P. B. NAGY A N D W. A. BAESLACK III
ABSTRACT. The microstructures of iner- tia-friction welds (IFRWs) on an alu- minum metal matrix composite have been investigated using several ultra- sonic examination (UE) techniques as well as standard characterization meth- ods. This study represents one of the first efforts to utilize UE methods for mi- crostructural characterization of welds. The flow line patterns and dimensions of the different weld zones in IFR welds on a SiC-reinforced 8009 aluminum com- posite (8009/SIC/1 lp) have been deter- mined using optical microscopy (OM) and scanning-electron microscopy (SEM) as well as the following UE methods: 1) acoustic microscopy, 2) C-scan imaging, 3) axial backscattering, and 4) radial backscattering. The UE techniques ex- ploited the variations in ultrasonic scat- tering produced by changes in the distri- bution of the SiC particles.
The ultrasonic procedures allowed rapid determination of microstructural features in the IFR welds. The acoustic microscopy technique provided detailed pictures of the flow lines in longitudinal sections of the welds, as well as the di- mensions of the different weld zones as
T. J. LIENERT is with the Department of Mate- rials Science and Engineering and W. A. BAES- LACK III is with the College of Engineering, The Ohio State University, Columbus, Ohio. P. B. NAGY is with the Department of Aerospace Engineering and Engineering Mechanics, Uni- versity of Cincinnati, Cincinnati, Ohio.
Paper presented at the 77th Annual AWS Meeting, held April 21-25, 1996, Chicago, IlL
functions of radial position. Ultrasonic C- scan imaging determined the flow line patterns in thin disks centered at different axial distances from the weld centerline. The C-scan imaging technique also re- vealed the presence of purposely in- duced defects that resulted from lack of bonding near the axial centerline of one of the welds. Axial ultrasonic backscat- tering measurements were used to deter- mine the widths of the various weld zones as functions of radial position. Fi- nally, radial ultrasonic backscattering measurements provided the overall widths of the entire weld zone at a fixed radial position.
The results of this study were self-con- sistent in that weld microstructures and dimensions determined with one UE technique correlated closely with those found with other UE techniques, as well as with OM and SEM. The ultrasonic methods complement OM and SEM by
KEY WORDS
Ultrasonic Examination SiC Reinforced MMC Composites Aluminum Friction Weld Microstructure Inertia-Friction
providing similar microstructural infor- mation over the size scales examined. The UE techniques described in this study may also be employed to study IFR welds on similar materials and can likely be adapted to other processes involving metal matrix composites (MMCs) and comparable materials.
The information determined from this study also contributes to an improved un- derstanding of process/structure/property relations for IFR welds on 8009/SIC/1 lp as well as plastic flow resulting from the IFRW process. The SiC particles in the as- received extrusion were distributed into alternate SiC-rich and SiC-depleted bands oriented parallel to the extrusion direction. The flow lines of SiC-rich and SiC-depleted bands followed spiral- shaped paths in the IFR welds. Lower val- ues for strain to failure and elastic modu- lus (relative to the base material) in subscale tensile samples from these welds tested in previous studies are at- tributed to the realignment of the bands during IFRW. Results confirm that flow in the IFR welds took place with compo- nents in the axial, radial and tangential directions. Moreover, the strength or dominance of the components of flow varied with axial and radial position for a constant weld axial force. The strength of the various f low components also changed with the axial force used for welding. The information on the final patterns of flow lines and weld dimen- sions may be useful in corroborating the final results of computational process models for IFRW.
14-s I JANUARY 1998

Introduction
Advances in materials science over the last few decades have driven the commercial development of several classes of novel materials with mi- crostructures and properties that are tai- lored to specific applications. Aluminum metal matrix composites (AI MMCs) rep- resent one of the many classes of engi- neered materials. AI MMCs combine the ductility and toughness of an AI alloy ma- trix with the stiffness of a low-density ce- ramic reinforcement. Due to their high specific strength and modulus relative to monolithic AI products, AI-MMCs are candidates for structural applications in the aerospace and automotive industries.
Both wrought and cast precipitation- hardenable aluminum alloys are used as the matrix, as well as the newer rapidly solidified/powder metallurgy (RS/PM) al- loys. Typical reinforcement materials in- clude boron (B), graphite (C), silicon car- bide (SIC), and aluminum oxide (AI203), and the reinforcement may take the form of whiskers, particles, or chopped or con- tinuous fibers. While much of the early research on AI-MMCs concentrated on continuous fiber materials, recent inves- tigations have focused on discontinu- ously (i.e., particle, whisker or chopped fiber) reinforced aluminum (DRA) alloy MMCs. The growing interest in DRAs is primarily due to their lower cost of pro- duction and their relatively isotropic properties.
High-temperature DRAs (HTDRAs) have been commercially produced by blending crushed ribbons of RS AA 8009 with 3 pm SiC particulate followed by hot pressing and extruding to size (Ref. 1). The 8009 aluminum alloy matrix (AI-8.5 Fe-1.7 Si-1.3 V, wt-%) is strengthened by a uniform distribution of fine intermetal- lic dispersoids that form during the RS process and subsequent consolidation and thermomechanical processing (TMP) operations (Refs. 2-4). These dispersoids are stable to temperatures approaching 375°C and have very low coarsening rates at working temperatures. The fine dispersoids, as well as a small c~-alu- minum grain size resulting from RS pro- cessing, give the 8009 alloy superior high-temperature mechanical properties relative to conventional AI alloys (Ref. 5). The addition of 11 vol-% SiC particles (SiCp) to the 8009 matrix alloy results in an MMC (8009/SIC/1 lp) with increased specific strength and stiffness at elevated temperatures (Refs. 6, 7). Potential appli- cations for 8009/SIC/11 p include aircraft wing skins, missile bodies and other aerospace structures that are heated aerodynamically or that reside in close proximity to the engines.
A
Z
A
\ORIOR/
L__ B
Transducer
Delay Line & Lens
Coupling Fluid
r
\ I / Leaky Rayleigh Wave . . . . . . . . . . . . . . . . . . . . . . . . . . . . . . . . . . . . . . . . . . . . . . . . . . . . . . . . . . . . . . . . . . . . . . ~ . . . . . . . . . . . . . . . . . . . . . . . . . . . . . . . . . . . . . . . . . . . . . . . . . . . . . . . . . . . . . . . . . . . . . .
B Axial & Radial Scanning
Microscope Transducer (50 ~n-lz)
Base Base Material Weld Material
Fig. 1 - - A - - Geometrical configuration o f reflection type acoustic microscope; B - - sample and scanning geometry for acoustic microscopy.
Effective use of the 8009/SiC/11p MMC will often depend upon its ability to be joined both to itself and to dissimi- lar materials. Since the properties of this composite derive from its unique mi- crostructure, welding processes must be chosen that limit grain and dispersoid coarsening, as well as avoid chemical reactions between the SiC particles and the matrix. Solid-state welding processes, such as inertia friction weld- ing (IFRW), appear to offer greater con- trol over microstructures during welding of RS AI alloys (Ref. 8) and AI-MMCs (Ref. 9) than fusion welding processes.
Friction welding (FRW) produces welds between parts held in compression that move relative to one another. The process is largely solid-state in nature.
The heat of welding originates from di- rect conversion of the mechanical energy of the moving part(s) to thermal energy and strain energy (Reg. 10, 11). More than 90% of the energy consumed in plastic deformation is transformed into heat, although a small fraction of the en- ergy is stored in the material as strain en- ergy (Ref. 12). Application of an axial compressive force maintains intimate contact of the parts and promotes plastic deformation of the material at the faying surfaces during welding.
There are two major process varia- tions for FRW: direct-drive welding and inertia welding (Ref. 13). The distinction between the two variations lies in the method of energy delivery to the weld. In direct-drive FRW, the moving part is con-
WELDING RESEARCH SUPPLEMENT I 15-s

Focused URrasonic Trs~lucer (2s ~-iz)
U
Base Material
Weld
B ~ Material
X-Y Scanning ~ ~ - x . ~
J
Fig. 2 - - Sample and scanning geometry for ultrasonic C-scan imaging.
Material
~.~ ~ W~d
Material
I Spatial Averaging ;
by Rotation I
Focused Ultrasonic Transducer (25 Mm)
Scanning
I
Fig. 3 - - Sample and scanning geometry for axial backscattering measurements.
Focused Ultrasonic Transducer (25 MHz)
Axial Scanning
Base Base Material Weld Material
Fig. 4 - - Sample and scanning geometry for backscattering measurements from the radial di- rection.
tinuously driven by a motor at a constant speed. A brake is applied to terminate the process after a preset time, and the axial pressure is then typically increased to aid in consolidation of the joint. Inertia FRW (IFRW) employs the stored energy of a decelerating flywheel attached to the ro-
tating part to effect the weld. IFRW is nor- mally performed with a constant axial force. The thermal cycle for most IFR welds is typically much shorter (- 1 to 2 seconds) than that for direct-drive welds (~ 10 to 20 seconds) (Ref. 14).
The rapid thermal cycle and solid-
state nature of IFRW are well suited for the joining of advanced materials. IFRW has been employed to successfully join several high-temperature AI-Fe alloys strengthened by intermetallic dispersoids (Refs. 15-18), as well as MMCs with con- ventional AI alloy matrices (Refs. 19-23) and oxide dispersion strengthened (ODS) materials (Refs. 24, 25). However, a greater understanding of process/mi- crostructure/property relations is needed for successful IFR welding of AI-MMCs with minimal loss of properties.
The microstructural changes that take place during IFRW are similar to those that occur during hot working and forg- ing. In fact, IFRW is often classified as a forge welding process. Displacement of material during working results in the de- velopment of microstructural features, referred to as flow lines, that are aligned with the working direction. The fracture resistance of forged products is known to improve when the flow lines are oriented parallel to major stress trajectories and perpendicular to potential crack paths (Ref. 26). Knowledge of the patterns of the plastic flow lines in IFR welds is im- portant in view of this relationship be- tween weld microstructures and result- ing properties.
Microstructural characterization of welds typically employs optical mi- croscopy (OM) and scanning electron mi- croscopy (SEM) as well as X-ray diffraction (XRD) and transmission electron mi- croscopy (TEM) on occasion. While most previous ultrasonic examination (UE) of welds has concentrated on flaw detection (Reg. 27, 28), UE of various weld zones has been recently shown to yield useful in- formation on similar and dissimilar metal IFR welds in aluminum, steel and copper (Refs. 29, 30). UE methods have also been successfully employed to examine mi- crostructural features of IFR welds in 8009/SIC/1 lp (Ref. 31).
Ultrasonic examination employs piezoelectric transducers that deliver high-frequency (ultrasonic) elastic waves into the material being inspected and sense their return (Refs. 27, 28). These elastic waves induce mechanical vibra- tions in the material as they propagate. A couplant such as water, alcohol, glyc- erin, or oil is normally used to enhance transmission of the ultrasonic waves be- tween the transducer and test material. Ultrasonic examination is very sensitive to local changes in elastic modulus (stiff- ness) and density, and can be used to de- tect gross changes in these properties caused by the presence of defects or a second phase.
The two major objectives of this study are 1) to demonstrate the utility of UE techniques as tools for microstructural characterization of IFR welds in
16-S I JANUARY 1998

Fig. 5 - - Micrographs of 8009/SIC/1 lp extruded base material: A, B - - optical micrographs from longitudinal section; C - - optical micrograph from transverse section; D - - SEM micrograph in SE mode. Horizontal arrows in A and B indicate extrusion direction. Several very large SiC par- ticles are visible in A. FR in B indicates featureless region. Arrow in D indicates SiC particle.
8009/SIC/1 lp and 2) to determine the patterns of plastic flow lines and the di- mensions of the different weld zones in the same IFR welds. The microstructures of the IFR welds are examined with OM, SEM and several UE methods. The ad- vantages and applications of the UE tech- niques are discussed, as well as the process implications of this study and process/structure/property relations for IFR welding of 8009/SIC/11 p.
Experimental Procedure
A 3.6-in. (9-cm) diameter experimen- tal extrusion of 8009/SIC/1 lp material was supplied by AlliedSignal, Inc. (Mor- ristown, N.J.). Cylindrical samples, 1 in. (2.5 cm) in diameter and 2.5 in. (6.3 cm) in length, were machined from the extru- sion with the 2.5-in. dimension parallel to the extrusion direction. Joining was performed with an MTI model 120B in- ertia welding system.
The welding parameters were identi- cal to those used in previous work on
monolithic AI-Fe-Si-V alloys (Refs. 17, 18) except that higher axial forces were used for the 8009/SIC/1 lp MMC. The samples were IFR welded at 5000 rpm (524 rad/s) using a moment of inertia (wk 2) of 3.93 Ib ft 2 (0.17 kg m2). These parameters gave an initial flywheel en- ergy of 16.7 x 103 ft Ib (22.9 kJ). Welds were produced at two different levels of axial force: 24.8 x 10 g Ib (111.6 kN) and 34.7 x 10 g Ib (156.2 kN). The welds are hereafter referred to as the low axial force (LAF) welds and the high axial force (HAF) welds, respectively. Welding time for both levels of axial force was less than two seconds.
The microstructures of the welded samples were initially characterized using optical microscopy (OM) and scan- ning electron microscopy (SEM). Metal- Iographic specimens were prepared from each weld using standard practice. Final polishing was performed using a col- loidal silica suspension. Specimens for optical microscopy were not etched. Se- lected specimens were also carbon-
coated and examined using SEM. Separate HAF and LAF weld speci-
mens were also studied using four ultra- sonic techniques: 1) acoustic mi- croscopy, 2) C-scan imaging, 3) axial backscattering and 4) radial backscatter- ing. Details of each of the ultrasonic tech- niques are presented in the following paragraphs. Further information on the techniques can be found in Refs. 27-32. Two sets of samples were prepared for UE. One set was used for acoustic mi- croscopy, while the second set was used for C-scan imaging and the two backscat- tering techniques. The samples examined with acoustic microscopy were prepared and welded exactly as described above.
The radial backscattering technique required removal of the weld flash but was completely nondestructive since no sectioning or machining of the weld re- gion was performed. C-scan imaging and axial backscattering measurements were performed on the same samples used for radial backscattering, although removal of the weld flash was not required for
WELDING RESEARCH SUPPLEMENT I 17-s

~Z
J
Fig. 6 Optical macrograph. A HAF weld; B -- LAF weld. The dashed lines denote the location of the axial centerline. Arrows indicate the weld centefline.
B :~.i~g; " ,
Fig. 7 m Opt ical micrographs from longi tudinal sections. A - - A HAF weld near the axial centerl ine; B - - HAF weld near the widest part o f the IHDZ; C - - A LAF weld near the axial centerline; D - - LAF weld near the widest part o f the IHDZ.
these two methods. Samples for C-scan imaging and backscattering measure- ments were prepared and welded exactly as described above with one exception. In an attempt to introduce small defects, a small turning center (60-deg cone angle, - 0.03 in. deep) was left on the face of one of the pieces used to produce a LAF weld. Turning centers facilitate easy machining of the cylinders on a lathe and are normally removed before welding with a facing operation.
Of the currently available ultrasonic inspection methods, scanning acoustic microscopy is the closest to optical mi- croscopy in terms of resolution, limited penetration depth and sample prepara-
tion. While commercial high-frequency acoustic microscopes can attain lateral resolutions of a few microns, the 50 MHz low-frequency version used in this study offered approximately 200 iJm lateral res- olution at a penetration depth of 50 IJm.
Figure 1A shows the geometrical con- figuration of a reflection-type scanning acoustic microscope. The acoustic mi- croscopy technique described here was not entirely nondestructive, since the sample was sectioned in half longitudi- nally for examination, as shown in Figure 1B. Polishing and etching of the section was not required for inspection. The main acoustic contrast with this tech- nique originated from those rays (such as
B in Figure 1A) that meet the interface at a special angle called the Rayleigh angle (O R) and generate "leaky" Rayleigh waves running along the surface of the sample (Ref. 32). As the Rayleigh waves propa- gate along the surface, a small amount of the wave energy is lost as it "leaks" back across the interface resulting in attenua- tion of the surface waves. A special wide- angle (60-deg angle of convergence) spherical ultrasonic transducer was fo- cused slightly below the surface to mea- sure the reflection coefficient (R) as a function of position as the transducer was scanned axially and radially across the sectioned sample - - Fig. 1 B. Broadband surface wave detection was used in this
18-s [JANUARY 1998

Fig. 8 - - Opt ical micrographs from a transverse section o f a LAF weld. A - - IHDZ; B - - OHDZ. A very large SiC part icle is visi- ble in the center o f A.
Fig. 9 - - SEM micrographs o f a HAF weld. A - - O H D Z ; B - - IHDZ. Arrows indicate cracked SiC particles.
experiment to optimize contrast. Ethyl al- cohol was employed as a couplant. The micrographs were formed by directly mapping the amplitude of the surface waves, which was strongly attenuated by inhomogeneities in the near-surface re- gion of the specimen.
Figure 2 shows the experimental con- figuration used for ultrasonic C-scan imaging. A 25-MHz, 25-mm (1 -in.) focal length immersion transducer was used to map the ultrasonic backscattering inten- sity from different depths as the trans- ducer was rastered across the end of the sample. This transducer provided a lat- eral resolution of approximately 500 lam. At each location, the total backscattered signal was first gated to separate compo- nents originating from the desired depth from those of the rest of the signal. The depth of the selected layer was varied by changing the delay of the gating signal. A gating time of 0.1 ps was used, corre- sponding to a layer approximately 0.36 mm (0.014 in.) thick. The ultrasonic image was constructed from the ampli- tude of the ultrasonic signal within the gate, which was a function of the extent of local inhomogeneity of the material in the layer.
Figure 3 shows the configuration used for axial ultrasonic backscattering mea- surements. The transducer and frequency used for this technique were the same as used for C-scan imaging. With this tech- nique, the transducer was scanned radi- ally across the end of the sample. The backscattered ultrasonic signal was es- sentially a random function of time with zero mean (dc component) and higher variance (ac component) at times corre- sponding to the depth of more inhomo- geneous layers. At each radial position, the backscattered signal was first squared to obtain the ultrasonic intensity as a function of depth. The backscattered in- tensity was then averaged for points of identical radial distance from the axis by rotating the specimen.
Figure 4 is a schematic diagram for the ultrasonic backscattering measurements from the radial direction. A 25-MHz, 25- mm focal length immersion transducer was used to measure the ultrasonic backscattering from a 3-mm (0.12-in.) wide region ata depth of 4 mm (0.16 in.) below the surface. The transducer was scanned parallel to the axis over a length of approximately 70 mm (2.8 in.) as the specimen was slowly rotated. Rotating
the specimen allowed averaging of the backscattered intensity for points at the same radial distance from the axial cen- terline.
Results
Optical and Electron Microscopy
Base Material
Optical micrographs of the 8009/SIC/11 p base material are shown in Fig. 5A-C. Figures 5A and B were taken on a longitudinal section (i.e., parallel to the extrusion direction) of the base mate- rial, while Fig. 5C was taken on a trans- verse section. Figure 5A depicts a cluster of fairly large (-15 IJm) SiC particles dis- tributed in the RS matrix. Pieces of the crushed RS ribbon of 8009 were elon- gated during extrusion resulting in a banded or striated microstructure. Indi- vidual bands of the base material ex- tending several hundred microns in length were also discernible in Fig. 5A. Small featureless ~gions were occasion- ally observed in the base material - - Fig. 5B. The bands displayed an irregular cross section and measured 30 to 50 [Jm
WELDING RESEARCH SUPPLEMENT I 19-S

Fig. 10 - - A c o u s t i c m i c r o g r a p h s . A - - H A F w e l d ; B - - L A F w e l d .
across on average, as shown in Fig. 5C. Examination of the base material at
higher magnifications using the SEM re- vealed that most of the SiC particles were clustered in bands running parallel to the extrusion direction - - Fig. 5D. Some areas contained a high volume fraction of SiC, while adjacent areas were nearly de- void of SiC. The nonuniform distribution of SiC was probably due to insufficient ki- netic blending during primary produc- tion. The majority of the SiC particles were approximately 0.5 to 3 pm in size, although particles as large as 20 pm were observed. Some of the larger SiC particles appeared to be cracked.
Weld Zone
Optical macrographs from longitudi- nal sections of typical HAF and LAF weld samples are shown in Fig. 6. Note that a longitudinal weld section in this case is defined as that perpendicular to the orig- inal faying surfaces. The dashed lines in Fig. 6A and B indicate the approximate location of the axial centerline (i.e., the rotation axis during welding) of each weld. Additionally, the arrows indicate the weld centerline. No defects were ob- served in any of these welds. A symmet- rically uniform flash or upset collar was formed around the circumference of each sample during welding. The extent of the upset for the HAF welds was larger than for the LAF welds. The total axial displacement of welding averaged 0.16 in. (0.4 cm) for the LAF welds and 0.35 in. (0.9 cm) for the HAF welds.
Inspection of the longitudinal sections
of the welds with OM using higher mag- nifications revealed the presence of two distinct regions of the weld heat-and-de- formation-affected zone (HDZ)- - Fig. 7. An inner HDZ (IHDZ) of uniform contrast was visible along the weld centerline. The IHDZ of the welds exhibited a ho- mogeneous microstructure with a rela- tively uniform distribution of SiC result- ing from the extensive intermixing experienced during welding. In these cross sections, the IHDZs appeared nar- row near the axial centerline and near the periphery, and wider in between. The outer HDZ (OHDZ) of the welds experi- enced less deformation and lower peak temperatures, and evidence of realign- ment of the individual bands was appar- ent. The OHDZ of the welds widened with increasing radial distance from the axial centerline. The rows of microhard- hess indentations visible in Fig. 7A and C are coincident with the axial centerline. Results of the microhardness and tensile testing of the IFR welds have been pre- sented elsewhere (Ref. 33).
The IHDZ for the HAF welds varied in width from approximately 0.05 mm (50 ym) at the axial centerline to about 0.65 mm at a position near the 3/4 radius. The overall width of the HDZ was approxi- mately 0.1 mm at the centerline and 8 mm near the periphery. The width of the IHDZs of the LAF welds varied from about 0.05 mm (50 ym) at the axial centerline to approximately 0.25 mm near the 1/2 radius position. The OHDZs of the LAF welds widened from about 0.06mm (60 lam) near the axial centerline to approxi- mately 8 mm near the periphery. The width of the OHDZ for the HAF welds in-
creased more rapidly with radial distance than the OHDZ of the LAF welds.
The optical micrographs in Fig. 8 were taken from transverse sections of a weld sample (transverse sections are defined here as those parallel to the original sur- faces). A uniform distribution of SiC is again seen in the IHDZ of the welds Fig. 8A. A large SiC particle is visible at the center of Fig. 8A. Reorientation or redirection of individual bands in the OHDZ in the radial and tangential direc- tions was also evident - - Fig. 8B.
Observations made using optical mi- croscopy were confirmed by SEM. Figure 9A is an SEM micrograph of the OHDZ of a HAF weld, while Fig. 9B is an SEM micrograph of the IHDZ of the same weld. The SiC particles were distributed uniformly throughout the IHDZ, while banding of the reinforcement was ob- served in the OHDZ. As in the base ma- terial, some of the larger SiC particles in the HDZs appeared cracked. Crushing of reinforcement particles during hot defor- mation of MMCs at high strains has been reported by several researchers (Refs. 34-36) and was not totally unexpected during IFRW. However, it is not clear whether these particles cracked during production of the composite or during IFRW. Nonetheless, no significant differ- ences in the SiC size distribution was noted between the base material and the weld HDZs. Similar observations were made during SEM examination of the LAF welds. Results of additional microstruc- tural characterization of the welds with optical microscopy and SEM have been presented elsewhere (Ref. 33).
20-s I JANUARY 1998

Ultrasonic Evaluation
The UE techniques used in this work exploited the variations in ultrasonic scattering provided by the alignment and distribution of SiC particles. The SiC par- ticles in the as-received extrusion were distributed into alternate SiC-rich and SiC-depleted bands oriented parallel to the extrusion direction. The banding of SiC in the base material provided an ex- cellent contrast mechanism for ultrasonic mapping. The higher stiffness of the SiC particles (approximately four times that of the aluminum alloy matrix) together with a slightly higher density assured strong ultrasonic scattering from the SiC- rich bands. Conversely, weaker ultra- sonic scattering was associated with the SiC-depleted bands. Determination of the spatial variation of scattering allowed distinction of individual layers. Note that individual SiC particles were not re- solved with these techniques.
Plastic flow in the OHDZ during welding resulted in realignment of the bands, while mechanical mixing of the material in the IHDZ produced a uniform distribution of SiC particles. The UE methods allowed distinction between the regions with different microstructural characteristics. The variations in ultra- sonic scattering from the three different regions enabled the determination of the sizes of the weld zones and provided in- formation about the flow patterns at dif- ferent positions in the OHDZ.
Acoustic Microscopy
The acoustic microscopy technique provided detailed images of the f low lines in longitudinal sections of the welds, as well as the widths of the inner and outer HDZs as functions of radial po- sition. The acoustic micrographs for the HAF and LAF welds are shown in Fig. 10. These images clearly show the size and shape of the inner and outer HDZs. The dimensions of the inner and outer HDZs appeared slightly larger in the acoustic micrographs than in the optical micro- graphs shown previously due partially to the lower resolution of acoustic mi- croscopy. The dark bands in the base material correspond to the SiC-rich lay- ers, while the lighter bands delineate areas that contain little or no SiC. As shown previously in the optical micro- graphs of Fig. 7, the plastic flow in the OHDZ of this cross section occurred in the radial and axial directions as a result of welding. The characteristic arrange- ment of flow lines was found to vary with axial force. Specifically, the flow lines were more strongly angled in the radial direction near the periphery of the HAF
HAF weld z " -540 lain
t _ _
Z " -180 lain Z ~ +180 lain z " +540 lain
rZl~- . ~ ! ~ ~.~;~ .+:~ .- ~
+ , i ra ~ + , + + \ +
I I I
, : . - ~ +" 5= 2 ++ +.;. + +,:.+
LAF weld ,~ - -540 t t m z " -180 p m z " + i S 0 ~ t m z - +540 t t m
Fig. 11 - - C-scan images of HAF weld (upper row) and LAF weld (lower row) at different axial distances above (+) and below (-) the weld centerline.
welds relative to the LAF welds, just as in Fig. 7. The uniform gray contrast of the IHDZ was consistent with the uniform distribution of SiC in this region, as shown in Figs. 7-9.
C-Scan Imaging
Ultrasonic C-scan imaging deter- mined the patterns of flow lines in thin disks oriented parallel to the weld center- line. Figure 11 shows the ultrasonic C- scan images of the flow patterns at differ- ent axial distances above (+) and below (-) the weld centerline for the HAF and LAF welds. The positive side of the weld refers to the side where the transducer was placed. The distances shown in Fig. 11 correspond to the distance from the weld centerline to the center plane of a disk 0.36 mm (0.014 in.) thick. Hence, the information depicted in two dimen- sions in each ultrasonic image was actu- ally collected from a thin disk. The pattern of flow lines in these sections indicated flow with both radial and tangential com- ponents. Note that the rotation direction of the flow lines above the weld center- line (+) was opposite to that below the weld centerline (-). Comparison of the flow line patterns at a given distance above and below the weld centerline for a given weld indicates that flow was sym- metric about the weld centerline.
Figure 12 provides a comparison of C- scan images of the flow line patterns atthe weld centerline and at various positive axial distances from the weld centerline for both welds. The thickness of the ho- mogenized IHDZ layer could not be fully
resolved at the frequency used and frag- ments of the nearby flow lines from both above and below the thin homogenized IHDZ were apparent. At axial distances farther from the weld centerline, flow lines were observed only near the periph- ery of the weld since the HDZ width was much greater there than near the axial centerline. The C-scan imaging technique also revealed the presence of small de- fects near the axial centerline of the LAF weld. The ultrasonic C-scan image from the weld centerline of the LAF weld (0 [am position in Fig. 12) exhibits at least three small defects (dark circles indicated by the arrows) near the axial centerline. The defects were also seen in the C-scan im- ages from disks centered at +180 [am from the weld centerline - - Figs. 11, 12. These defects resulted from the presence of the turning center as discussed earlier. Addi- tional examination of the defects using OM showed them to be flat planar defects that apparently resulted from a lack of bonding.
As in Figs. 7 and 10, the flow line pat- terns were found to vary with axial force. A comparison of the patterns for the two welds obtained at an axial distance of +180 [am is given in Fig. 13A. The spiral- shaped pattern of the LAF weld suggests that plastic f low occurred with large components in both the radial and tan- gential directions across the entire radial dimension. A similar pattern of flow was observed near the axial centerline of the HAF weld. However, at positions near 2/3 radius of the HAF weld, the tangen- tial component decreased greatly and flow near the periphery of the HAF weld
I I - . I z l U J I S l a . I O I - I I I,I,,I I > +
WELDING RESEARCH SUPPLEMENT I 21-s

I 1 A F weld z " 0 p m z - 4-180 p m g - * 5 4 0 Jim z - 4 , 1 0 8 0 I ~ m
LAF weM z - 0 ~ m z " + 1 8 0 ~ m ~ - 4 ~ 4 0 ~ m z " + g Q 0 pm
Fig. 12 - - C-scan images of HAF weld (upper row) and LAF weld (lower row) at var- ious positive axial distances above the weld centefline. Arrows in section at 0 pm of the LAF weld indicate induced defects.
Fig. 13 - - C-scan images for LAF and HAF welds at (A) 180 and (B) 540 pm above the weld cen- terline.
proceeded mainly in the radial direction. Evidence of flow reversal in the form of boomerang-shaped features near the 2/3 radius positions was also observed in the sections of the HAF weld obtained at axial distances of -180 IJm - - Fig. 11.
A comparison of flow line patterns ob- tained at axial distances of +540 IJm from the weld centerline is shown in Fig. 13B. Again, a spiraled arrangement of flow lines was evident in the LAF weld, but the tangential components at each radial po- sition appeared smaller than those at the respective positions in the section ob- tained at 180 IJm. For the HAF weld, the location of the transition from spiral flow to mainly radial flow in the section ob- tained at 540 ism was shifted inward to positions near 1/2 radius. No evidence of flow reversal was noted in the HAF weld sections obtained at 540 iJm.
Axial Ultrasonic Backscatterin~
The ultrasonic C-scan imaging tech- nique described above provided detailed maps of the distribution of the flow pat- tern in different cross sections of the HDZ at various distances from the weld cen- terline. The corresponding axial distribu- tions at varying radial distances from the axial centerline also contain valuable in- formation on the HDZ structure. The axial distribution can be more easily measured by considering the average backscattered intensity from a small vol- ume rather than resolving individual flow lines within that region.
Axial ultrasonic backscattering mea- surements were used to determine the widths of the inner and outer HDZs as functions of radial position. Figure 14 shows the averaged axial backscattering
profiles from the HAF weld at four differ- ent radial distances from the axial cen- terline. The amplitude of the backscat- tered signal is given in arbitrary units. Note that direct comparison of the am- plitudes between (A), (B), (C) and (D) of Fig. 13 is not possible because different gain settings were used to record the backscattered signals at each different ra- dial position. This result is inconsequen- tial since the most useful information de- rives from the shapes of the profiles, not from the different relative amplitudes.
The amplitude of the backscattered signal was very sensitive to the orienta- tion of the SiC-rich bands. For example, consider the profile obtained at a radial distance of 1.27 mm (0.051 in.) from the axial centerl ine-- Fig. 14A. At axial dis- tances greater than approximately 0.75 mm (0.03 in.) from the weld centerline, where the bands or striations of the base material were oriented parallel to the in- cident ultrasonic beam, the amplitude of the backscattered signal was low. At axial distances between 0.75 and 0.25 mm (0.03 and 0.01 in.), the amplitude of the backscattered signal increased with in- creasing radial components of plastic flow of the bands in the OHDZ. At axial distances less than approximately 0.25 mm (0.01 in.), the amplitude of the backscattered signal fell somewhat due to the homogenous distribution of the SiC particles in the IHDZ. This trend suggests that the average total width of the OHDZ at this radial position was approximately 1.5 mm (0.06 in.), while the average width of the IHDZ was approximately 0.5 mm (0.02 in.).
Similar trends were evident in the other profiles of Fig. 14 B, C and D. In each case, the axial position where the slope deviated from the baseline pro- duced by the base material may be inter- preted as the outer edge of the OHDZ, while the positions of the two symmetri- cally disposed maxima may be consid- ered as the approximate boundary be- tween the inner and outer HDZ.
The width of the inner and outer HDZs increased with increasing radial distance over the range shown. Since ro- tation of the specimen did not involve any motion at the axial centerline, an av- erage profile could not be obtained ex- actly at the center. Close to the axial cen- terline the entire HDZ was very narrow, and the homogenized IHDZ was not fully resolved. Farther away from the axial centerline the HDZ became wider and the weakly scattering homogenized IHDZ was more clearly discernible. The average width of the IHDZ increased from approximately 0.4 mm (0.016 in.) at a radial distance of 1.27 mm (Fig. 14A) to about 0.9 mm (0.035 in.) at a distance of
22-S I JANUARY 1998

8.89 mm from the axial centerl ine-- Fig. 14D. The average width of the OHDZ in- creased from about 1.7 mm (0.065 in.) to greater than 3.7 mm (0.15 in.) over the same span of radial distance. The exact width of the OHDZ at 8.89 mm from the axial centerline could not be determined from the axial backscattering data since the amplitude of the backscattered signal did not reach a baseline over the dis- tances studied. Note that these dimen- sions are consistent with those of the op- tical micrographs in Fig. 7 and the acoustic micrograph in Fig.10A.
Radial Ultrasonic Backscatterin~
Radial ultrasonic backscattering mea- surements provided the overall widths of the HDZ at a fixed radial position (at 4 mm from the outer surface or at 8.7 mm from the axial centerline). Figure 15 shows the average radial backscattering profiles for the LAF and HAF welds. As shown in Figs. 6, 7 and 10, the bands of the base material microstructure were preferentially oriented in the axial direc- tion as a result of the original extrusion processing. Consequently, radial ultra- sonic waves were strongly scattered by the base material. In the OHDZ, the flow lines turned in the radial direction and produced much weaker scattering, while the homogenized IHDZ caused lit- tle scattering from any inspection direc- tion. As a result, the entire HDZ ap- peared as a weakly scattering region surrounded by the strongly scattering base material. Because of misalignments during welding, the local thickness of the HDZ can change as much as 10% between the thinnest and thickest points separated by 180 deg. The average total width of the OHDZ at a distance of 4 mm (0.01 in.) from the periphery (i.e., at a radial distance of 8.7 mm [0.35 in.] from the axial centerline) was found to be approximately 4 mm (0.16 in.) for both the LAF and HAF welds. These di- mensions are consistent with corre- sponding dimensions obtained from Figs. 7, 10A and 14D.
Discussion
Advantages and Limitations of the UE Techniques
As mentioned previously, microstruc- tural characterization of welds normally relies on the use of OM and SEM. In this study, the flow line patterns and weld di- mensions were determined throughout the entire volume of the IFR welds using OM and SEM by repeated sectioning, grinding and polishing of the samples. However, this course of action was time
"g
<
1.27 mm
-2 -1 0 1 2
Axial Distance [mm]
-8
E
3.81 mm B
-2 -1 0 1
Axial Distance [nun]
<
8.89 mm D
-2 -1 0 1 2 -2 -1 0 1
Axial Distance [mm] Axial Distance [mm]
Fig. 14 - - Averaged axial backscattering profiles from HAF weld at four different radial distances from the axial centerline.
consuming, and the measurement accu- racy was limited by the precision of sam- ple preparation. Attempts were made to maintain transverse metallographic speci- mens (such as those in Fig. 8) parallel to the weld centerline. Determination of the position of the final transverse surface with respect to some reference position was also required. Additionally, care was taken to ensure that longitudinal sections (such as those in Figs. 6 and 7) coincided as closely as possible with the prime merid- ian of the joined cylinders. Nonetheless, some amount of measurement error was introduced during sample preparation. These problems were further com- pounded by the misalignment of the two cylindrical samples that introduced slight spatial variations in weld dimensions.
The use of ultrasonic methods for the detection of weld flaws such as cracks, porosity and incomplete penetration is well established (Reg. 27, 28). This study represents one of the first efforts to utilize ultrasonic methods for microstructural characterization of welds. The problems associated with measurement errors due to sample preparation discussed above were largely avoided with the UE tech- niques used in this study. The penetrating nature of the ultrasonic waves largely eliminated the need for sectioning and surface preparation and allowed for non- destructive evaluation (with the excep- tion of the acoustic microscopy tech- nique). Computer automation of the UE procedures provided rapid identification
of microstructural features throughout the weld volume, and problems with variations in weld dimensions due to misalignment were overcome by rotating the sample or gating the signal to provide an averaged response.
The ultrasonic techniques were self- consistent in that microstructures and di- mensions of the weld zones found with one technique matched those ascer- tained using the other UE techniques. More importantly, the microstructural featur: and weld dimensions deter- mined with the UE techniques closely correlated with those found using OM and SEM. Comparison of the capabilities of the UE procedures to those of OM and SEM reveals advantages and limitations inherent to each method. The advantages accrued by the UE procedures via elimi- nation of sample preparation are offset by their lower resolution. Conversely, the greater accuracy of measurement af- forded by the increased resolution of OM is limited by the problems associated with misalignment and preparation dis- cussed above. Of course, the even greater resolution of the SEM provides still better accuracy of measurement. An exact comparison of the dimensions de- termined using OM and UE is not war- ranted owing to the use of different sam- ples, to the different physical mechanisms associated with creating the images (optical vs. acoustic) and to the inaccuracies inherent to each method. Nonetheless, the UE methods comple-
WELDING RESEARCH SUPPLEMENT [ 23-s

ment OM and SEM by providing similar microstructural information over the size scales examined in this study.
Applications of the UE Methods
The C-scan images and ultrasonic mi- crographs provided data on the final pat- terns of flow lines from two orthogonal perspectives. The information obtained with the two techniques from a single sample can be computer integrated to provide a 3-D map of the final pattern of flow lines throughout the OHDZ. The flow patterns in the OHDZs of the IFR welds varied with time from the original configuration in the base material to the final conditions reflecting the integrated displacement history of the OHDZs dur- ing the weld cycle. Equations for the dis- placements (Ref. 37) and strain rates (Refs. 22, 38) during the forge phase of direct drive friction welding have been derived, but details of the plastic flow of material arising from I FR welding are cur- rently not well known. Unfortunately, the tangents to the flow lines are not neces- sarily parallel to the vectors of the dis- placement field for plastic flow. Hence, the final flow line patterns shown in this paper cannot be used to accurately de- termine time resolved data concerning displacement, strain or strain rate. How- ever, they can be used to corroborate the final results of various computational process models for IFRW (Reg. 21-23, 39, 40).
Ultrasonic evaluation of"declutched" or interrupted IFR welds (Refs. 41, 42) can provide even more useful informa- tion on microstructural development in the joint area at discrete times during the welding process. In principle, plastic strains can be determined as functions of position in the OHDZ from the 3-D maps of a series of interrupted welds and com- pared for welds made with different pa- rameters. The time resolved strain data may also prove useful in confirming the results of computational models for IFRW. In addition, the temporal develop- ment of the IHDZ can be studied with in- terrupted welds.
As discussed previously, the tech- niques employed in this study exploited the differences in ultrasonic scattering due to variations in the spatial distribu- tion and alignment of the reinforcement. With minor modifications, the UF proce- dures described here may be used to study IFR welds on other materials con- taining two (or more) banded phases that differ in stiffness and/or density. Exam- ples of such materials include other banded MMCs, low-carbon steels that exhibit ferrite/pearlite banding, and free machining steels with sulfide stringers aligned parallel to the rolling direction.
60
~-~ 40
cd
30
20
10
0
w - ° ° l • ° • " ~ ' o e i ° - ~ a w " l
HDZ
~ H A F . . . . L A F
i I I | |
0 4 8 12 16 20
Distance [mm]
24
Fig. 15 - - Averaged radial backscattering profiles for HAF and LAF welds.
In addition, the presence of martensite in welds in steels can be discerned due to its high stiffness relative to ferrite.
Continuous banding may not be re- quired to produce appreciable variations in ultrasonic scattering in IFR welds of some materials. The UE techniques may also be adapted to materials with discrete "aligned" second phases such as borated stainless steels as well as whisker and short fiber reinforced MMCs that are extruded to align the long dimension of the rein- forcement with the extrusion direction.
Finally, the UE procedures may also be adapted to other processes involving MMCs and similar materials. For in- stance, they can be utilized to examine fusion welds of MMCs, oxide dispersion strengthened (ODS) materials and hard- facing alloys where agglomeration and/or segregation of the reinforcement have been reported. Similarly, these methods might be used to characterize reinforcement redistribution in castings of MMCs and to investigate reinforce- ment loading along the bondline during brazing and diffusion bonding of MMCs.
Flow Line Distributions
Information concerning the final arrangement of flow lines in the OHDZ of the IFR welds gathered from previous figures can be summarized in a schematic drawing of a cylinder of radius R. Figure 16 is an exploded view
schematic that depicts the paths of flow lines originating from three different ra- dial locations in the cylinder: R1, R 2 and R 3 (where R>RI>R2>R3). The cylinder shown in Fig. 16 is one of the two used to produce the weld. The IHDZ and the second cylinder are omitted in this figure for clarity. Axial, radial and tangential di- rections are defined by the axes shown in the figure.
The three shaded surfaces represent horn-shaped vortices of different sizes that increase in radius from R i to R i' (where i = 1,2 or 3) with decreasing dis- tance from the weld centerline. The flow lines follow paths along the surfaces of the vortices as indicated by the spiraling arrows. Note that the dimensions of the arrows are not meant to indicate the mag- nitude. Moreover, recall that the arrows represent the paths of the final flow lines and are not necessarily parallel to the dis- placement or strain vectors of plastic flow. For greater ease of illustration, the three vortices are separated in this ex- ploded view. In reality, the vortices fit to- gether concentrically as shown in the inset. The boundary between the OHDZ and IHDZ is indicated by the surface marked A in the inset.
Consider the path of the flow lines origin311y located at R 1 . Far from the weld centerline, the flow lines from the origi- nal extrusion processing are parallel to the axial centerline as indicated by the straight arrow. At the outer edge of the
24-s I JANUARY 1998
.%
/ Radial
;Zlrt'
Fig. 16 - - Exploded view schematic of flow lines in the OHDZ of an IFR weld. Arrows show paths for flow lines originating at three different radial positions. For a given startine radial po- sition, the flow lines follow spiraling paths on the surface of the different shaded vortices. Inset shows side view (not exploded). See text for further details.
OHDZ (position B), the flow lines turn gradually and follow spiraling paths with continually increasing radius on the sur- face of the shaded vortex. Near the IHDZ/OHDZ boundary at R 1' on surface A, the paths of the flow lines lie entirely in a plane parallel to the weld centerline, and for the HAF weld, the path is almost entirely in the radial direction. Flow lines originating at B', also located at R 1 but tangentially displaced from B, follow similar paths that parallel those from B.
Flow lines originating at R 2 (position C) follow slightly different spiral paths on a second vortex of smaller radius. The flow line paths proceeding from R 2 (on the second vortex) have a weaker radial component relative to those at greater ra- dial distances (on the first vortex) as sug- gested by the C-scan images in Figs. 11-13. Similarly, the paths of the flow lines originating at Rg (position D) have an even smaller radial component than those originating at R 2 (position C).
Process/Structure/Property Relations
As discussed in the Introduction sec- tion of this paper, the fracture resistance of forgings and IFR welds depends on the ori- entation of the flow lines with respect to the applied stress field. Microstructural analysis has shown that extrusion of the base material duri~.g primary production resulted in the development of flow lines in the form of alternating SiC-rich and SiC-
depleted bands oriented parallel to the ex- trusion direction. Moreover, plastic flow in the OHDZ during welding has been shown to produce realignment or reorien- tation of the bands. Knowledge of the pat- terns of flow lines in IFR welds can be use- ful in designing and producing welds with minimal loss in toughness. This knowl- edge is even more important for IFR ~ elds in 8009/SIC/11 p since MMCs typically ex- hibit lower strains to failure and fracture toughness relative to their monolithic counterparts (Refs. 43, 44).
The fracture resistance of IFR welds in 8009/SIC/1 l p is determined by several microstructural features including the grain size and the orientation of the flow lines (the SiC-rich and SiC-depleted bands) as well as the volume fraction, size and distribution of the intermetallic dispersoids and the SiC reinforcement. Despite cracking of some of the larger SiC particles, little change in the SiC size distribution (relative to the base material) was observed in the HDZs of either the HAF or LAF welds produced in this in- vestigation. Additionally, IFRW pro- duced a homogenous IHDZ with a uni- form distribution of SiC. Previous studies on the same welds using transmission electron microscopy (TEM) revealed no significant differences in the grain size or the volume fraction, size and distribution of the dispersoids between the basP ma- terial and the weld regions (Ref. 45). Hence, the major microstructural change
involved the redistribution of SiC in the IHDZ and reorientation of the flow lines in the OHDZ. Consequently, lower strains to failure (relative to the base ma- terial) in subscale tensile samples ma- chined from these IFR welds (Refs. 33, 45) may be attributed mainly to the re- alignment of the bands since all of the weld tensile samples failed in the OHDZ through regions where the flow lines were aligned with the maximum re- solved shear stress at 45 deg to the ten- sile axis.
Lower measured values of elastic modulus (Ref. 45) for the same weld ten- sile samples (with respect to the base ma- terial) may also be ascribed to the re- alignment of the bands. For the sake of discussion, the material may be consid- ered as a composite of alternating stiff SiC-rich bands and compliant SiC-de- pleted bands. In the base material tensile samples, the tensile axis was parallel to the extrusion direction and the alternate SiC-rich/SiC-lean bands were loaded in an isostrain condition (Ref. 46), resulting in a high composite modulus. In contrast, the bands in the OHDZs of the weld ten- sile samples reoriented perpendicular to the tensile axis were loaded in a condi- tion similar to an isostress condition (Ref. 46). Hence, the higher stiffness of the SiC-rich bands was not exploited in this orientation, and lower values of elastic modulus were found for the weld tensile samples. The patterns of microstructural banding may also affect the creep and fa- tigue properties of the welds.
Process Implications
The information provided by the UE methods in this study also contributes to an improved understanding of plastic flow resulting from the IFRW process. While the final flow line patterns cannot be used to determine quantitative infor- mation concerning the displacement or flow fields for material during welding, they can be used to make qualitative in- ferences with respect to the directions of displacement late in the weld cycle. The findings of this study confirm that the ma- terial in the OHDZs of IFR welds was dis- placed in the axial, radial and tangential directions during welding. Moreover, the strength or dominance of the compo- nents of flow evidently varied with axial and radial position for a constant weld axial force. For example, the axial com- ponents of displacement seemed to di- minish with decreasing distance from the weld centerline for both the LAF and HAF welds. Hence, plastic flow near the inner edge of the OHDZ appeared to be largely restricted to planes parallel to the weld centerline.
The differences in the flow line pat- terns in the OHDZs of the HAF and LAF
WELDING RFSEARCH SUPPLEMENT I 25-s

Pmax
r Vl
Pmax
?0
I - Ir r l
A B
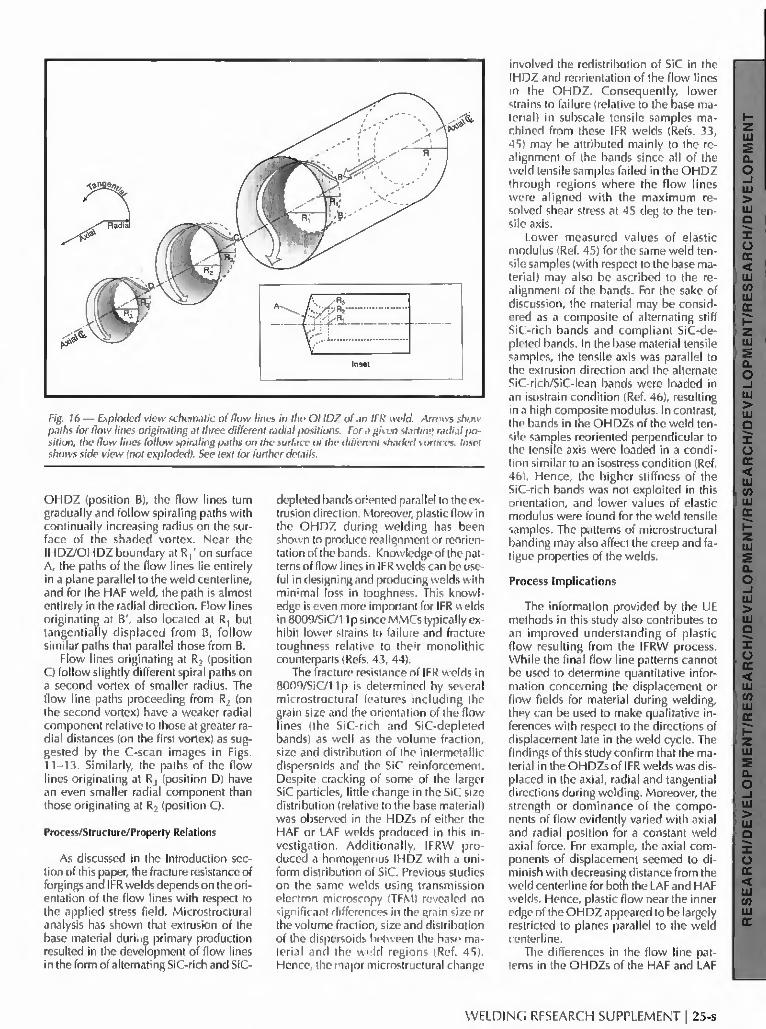
Fig. 17 - - Schematic representations of friction hills for (A) sliding friction and (B) sticking friction (adapted from Ref. 49). The axial pressure falls from a maximum at the axial centefline to the yield stress (cso) at the periphery.
welds suggest that the strength of the dif- ferent flow components also varied with the axial force used for welding (i.e., the flow fields varied with axial force). Specifically, the radial components of displacement in the OHDZ of the HAF welds appeared larger than those at the same positions in the LAF welds. In fact, plastic flow near the periphery of the HAF welds seemed to occur almost en- tirely in the radial direction. This obser- vation suggests that the material at shorter radial distances from the axial centerline was constrained from moving radially by the surrounding material. Conversely, material near the periphery was less constrained and was evidently freer to move in the radial direction.
One possible explanation for the al- terations in flow direction with radial dis- tance for the HAF welds involves a vari- ation in normal pressure (i.e., axial stress) during welding. While several re- searchers assume the normal pressure to be uniform across the faying surfaces for calculations of temperature (Refs. 14, 22, 47), the pressure during IFRW likely varies with radial distance in a manner similar to that found for axisymmetric compressive forging of a flat circular disk under plane strain conditions (Refs. 48-50).
The normal pressure across a flat disk under plane strain conditions in com- pression can be shown to decrease from a maximum at the centerline to a value equal to the yield stress at the periphery (Refs. 48, 49). Depending on the bound- ary conditions used in the derivation, the pressure across the interface can vary ei-
ther linearly (assuming conditions of sticking friction) or exponentially (as- suming conditions of sliding or lubri- cated friction) with radial distance. While the equations that result from these derivations represent idealized ex- tremes in behavior, they have been shown to adequately describe the situa- tion as similar trends have been found through experimentation (Ref. 50). A plot of normal pressure against radial dis- tance for this application is often termed the friction hill. Schematic friction hills for sticking and sliding friction condi- tions are shown in Fig. 17 (Refs. 48, 49).
While the conditions found during IFRW are not identical to those for forg- ing of a flat disk (there is no rotational motion in forging for example), it is not unreasonable to suggest that the radial pressure variations are similar in nature. The interfacial friction conditions and hence the variations in axial pressure conditions presumably change with time for IFRW. Very early in the weld cycle, sliding friction occurs at the interface be- fore any bonding takes place. Shortly thereafter, seizure takes place at points along the interface, and conditions of sticking friction prevail. Bonding ensues during this period and the IHDZ begins to develop and spread across the entire interface (Ref. 42). Finally, a condition of lubricated sliding friction may ensue as the fully developed IHDZ acts as a vis- coplastic layer of lubricant between the opposing sides of the relatively stiff OHDZ. Regardless of the friction condi- tions, the lower normal pressures near the periphery appear to provide less lat-
eral constraint on the material in the OHDZ and allows greater ease of radial flow, which gives rise to the flow patterns observed in the HAF welds.
A second rationalization for the varia- tions in flow patterns with radial distance for the HAF welds allows for the possi- bility of continued deformation of the material of the OHDZ at the end of the weld cycle. The higher axial force may be sufficient to produce further deformation of the material in the OHDZ (that re- mains heated) after the rotating part stops, similar to that which occurs in the forging phase of direct-drive friction welding. As a consequence, predomi- nantly radial plastic flow is expected to occur, as in direct-drive friction welding, since no rotational component of motion remains. Regardless of the cause of the variations of flow patterns, further work aimed at discerning the evolution of flow with time during IFRW is required, and the UE procedures may prove useful in this regard.
Conclusions
1 ) This study represents one of the first efforts to utilize ultrasonic methods for microstructural characterization of welds. The SiC particles in the as-re- ceived extrusion were distributed into al- ternate SiC-rich and SiC-depleted bands oriented parallel to the extrusion direc- tion. IFR welding resulted in a homoge- neous distribution of SiC particles in the IHDZ and realignment of the alternate SiC-rich and SiC-depleted bands in the
26-S [JANUARY 1998

OHDZ. The ultrasonic procedures de- scribed in this study exploited the varia- tions in ultrasonic scattering provided by changes in the spatial distribution of the SiC particles.
2) The ultrasonic techniques allowed rapid determination of the patterns of plas- tic f low lines in IFR welds on 8009/SIC/1 lp, as well as the dimensions of the inner and outer HDZs as functions of position. The information on the final patterns of f low lines and weld dimen- sions can be used to corroborate the final results of computational process models for IFRW. The ultrasonic methods de- scribed in this study may also be em- ployed to study IFR welds on similar banded or aligned materials and can likely be adapted to other processes involving MMCs and comparable materials.
3) The ultrasonic techniques were self-consistent in that weld microstruc- tures and dimensions determined with one procedure matched those found with the other UE techniques. More impor- tantly, the microstructural features and sizes of the weld zones determined with the UE methods closely correlated with those observed using OM and SEM. The UE methods complement OM and SEM by providing similar microstructural in- formation over the size scales examined in this study.
4) Results of this study also contribute to a greater understanding of process/structure/property relations in IFR welds on 8009/SIC/1 lp . The f low lines of SiC-rich and SiC-depleted bands fo l lowed spiral-shaped paths in the OHDZ of the IFR welds. Lower values for strain to failure and elastic modulus (rel- ative to the base material) in subscale tensile samples from these welds tested in previous studies were attributed to re- al ignment of the SiC-rich and SiC-de- pleted bands in the OHDZ.
5) Results confirm that the material in the O H D Z of the IFR welds was dis- placed in the axial, radial and tangential directions. The strength or dominance of the components of displacement or f low varied with axial and radial positions for a constant weld axial force. The compo- nents of f low also varied with the axial force used for welding.
Acknowledgments
The authors wish to thank AlliedSig- nal, Inc., of Morristown, N.J., for supply- ing the material used in this study. The authors also wish to acknowledge Dave Brewer of Ohio State University (OSU) for assistance in machining of samples, Tim Stotler of Edison Welding Institute for help in producing the IFR welds, Bil l Hartlieb of OSU for assistance with Fig. 16, as well as Dr. R. J. Grylls and Dr. J. M
Wiezorek of OSU for their careful review of this manuscript. The authors addition- al ly thank the Army Research Off ice under contract number DAAL03-92-G- 0148 for partial funding of this project. Finally, Mr. Lienert would like to express his appreciation to the American Weld- ing Society for its cont inued support through an AWS Foundation Fellowship.
References
1. Zedalis, M. S., Bryant, J. D., Gilman, P. S., and Das, S. K. 1991. High-temperature dis- continuously reinforced aluminum. JOM 43(8): 29-31.
2. Skinner, D. J. 1988. The physical metal- lurgy of dispersion strengthened AI-Fe-V-Si al- loys. Dispersion Strengthened Aluminum Al- loys, eds. Y. W. Kim and W. M. Griffith, pp. 181-197, Warrendale, Pa., The Minerals, Met- als & Materials Society.
3. Raybould, D. 1988. Forming of rapidly solidified elevated temperature aluminum al- loys produced by planar flow casting. Disper- sion Strengthened Aluminum Alloys, eds. Y. W. Kim and W. M. Griffith, pp. 199-215, War- rendale, Pa., The Minerals, Metals & Materials Society.
4. Bye, R. L., Kim, N. J., Skinner, D. J., Ray- bould, D., and Brown, A. M. 1986. Rapidly so- lidified powder metallurgy aluminum alloys prepared from melt spun ribbons. Proceedings of Processing of Structural Metals by Rapid So- lidification, eds. F. H. Froes and S. J. Savage, pp. 283-289, Materials Park, Ohio, ASM In- ternational.
5. McKimpson, M. G., Pohlenz, E. L., and Thompson, S. R. 1993. Evaluating the me- chanical properties of commercial DRA. JOM 45(1 ): 26-29.
6. Zedalis, M. S., and Skinner, D. J. 1989. Young's moduli of AI-Fe-X-Si alloys and AI-Fe- V-Si base metal matrix composites. Light- Weigh t AIloys for A erospa ce Applications, ed s. E. W. Lee et. al., pp. 335-344, Warrendale, Pa., The Minerals, Metals & Materials Society.
7. Zedalis, M. S., Peltier, J. M., and Gilman, P. S. 1989. High temperature AI-Fe-V-Si base matrix composites: mechanical properties a.nd microstructure. Light-Weight Alloys for Aero- space Applications, eds. E. W. Lee et. al., pp. 323-334, Warrendale, Pa., The Minerals, Met- als & Materials Society.
8. Sampath, K., and Baeslack III, W. A. 1993. Selection and weldability of dispersion- strengthened aluminum alloys. ASM Hand- book Vol. 6 - - Welding, Brazing and Solder- ing. p. 541, Materials Park, Ohio, ASM International.
9. Lienert, T. J., Lane, C. I., and Gould, J. E. 1993. Selection and weldability of alu- minum metal-matrix composites. ASM Hand- book Vol. 6 - - WeldingT, Brazing and Solder- ing, p. 554, Materials Park, Ohio, ASM International.
10. Duffin, F. D., Dickson G. R., and Bahrani, A. S. 1972. Research friction-welding with hydrostatic drive. Metal Construction and British Welding Journal 4(5): 161-166.
11. Elmer, J. W., and Kautz, D. D. 1993. Fundamentals of friction welding.ASM Hand- book Vol. 6 - - Welding, Brazing and Solder- ing. p. 150, Materials Park, Ohio, ASM Inter- national.
12. Dieter, G.E., 1986. Mechanical Metal-
lurgy, p 303, New York, N.Y., McGraw-Hill. 13. R. L. O'Brien, ed. 1991. Welding
Handbook Vol. 2, 8th ed., p. 740, Miami, Fla., American Welding Society.
14. Wang, K. K., and Nagappan, P. 1970. Transient temperature distribution in inertia welding of steels. Welding Journal 49(9): 419- s to 426-s.
15. Baeslack l i t W. A., and Hagey, K. S. 1988. Inertia friction welding of rapidly solid- ified powder metallurgy aluminum. Welding Journal 67:139-s to 149-s.
16. Hou, K. H., and Baeslack III , W. A. 1990. Electron microscopy of inertia-friction weldments in a rapidly solidified AI-Fe-Mo-V alloy. Journal of Materials Science 25: 2642-2653.
17. Koo, H. H., Krishnaswamy, S., and Baeslack III, W. A. 1991. Characterization of inertia-friction welds in a high-temperature RS/PM AI-8.5Fe-1.3V-1.7Si Alloy (AA-8009). Materials Characterization 26:123-136.
18. Koo, H. H., and Baeslack Ill, W. A. 1992. Friction welding of a rapidly solidified AI-Fe-V-Si alloy. Welding Journal 71 (5): 147-s to 169-s.
19. Cola, M. J. 1992. Inertia-friction weld- ing of particulate-reinforced aluminum matrix composites, M.S. dissertation, Columbus, Ohio, The Ohio State University.
20. Cola, M. J., and Albright, C. E. 1992. Inertia-friction welding of particulate-rein- forced aluminum composites - - initial stud- ies. Proceedings of the 3rd International Con- ference on Trends in Welding Research. eds, S. A. David and J. M. Vitek, pp. 1139-1146, Materials Park, Ohio, ASM International.
21. Midling, O. T., and Grong, O. 1992. Continuous drive friction welding of SiC par- ticulate reinforced aluminium composites. Proceedings of the 3rd International Confer- ence on Trends in Welding Research, eds. S. A. David and J. M. Vitek, pp.1147-1151, Ma- terials Park, Ohio, ASM International.
22. Midling, O. T., and Grong, 0. 1994. A process model for friction welding of AI-Mg- Si alloys and AI-SiC metal matrix composites I. HAZ temperature and strain rate distribu- tion. Acta Metallurgica et Materialia 42(5): 1595-1609.
23. Midling, O. T., and Grong, 0. 1994. A process model for friction welding of AI-Mg- Si alloys and AI-SiC metal matrix composites II. HAZ microstructure and strength evolution. Acta Metallurgica et Materialia 42(5): 1611-1622.
24. Shoemaker, L. E. 1986. Joining tech- niques for a ferritic oxide dispersion strength- ened alloy. Proceedings of the International Conference on Trends in Welding Research, ed. S. A. David, pp. 371-377, Materials Park, Ohio, ASM International.
25. Ambroziak, A., and Lison, R. 1993. Welding and brazing ODS materials. Welding Research Abroad 12:10-15.
26. Hertzberg, R. W. 1989. Deformation and Fracture Mechanics of Engineering Mate- rials, p. 357, New York, N.Y., Wiley.
27. ASM Committe on Ultrasonic Inspec- tion. 1976. Ultrasonic inspection. ASM Metals Handbook Vol. I 1, 8th ed., eds. H. E. Boyer and W. J. Carnes, pp. 161-198, Materials Park, Ohio, ASM International.
28. Bray, D. E., and Stanley, R. K. 1989. Nondestructive Evaluation. p. 47, New York, N.Y., McGraw-Hill.
29. Nagy, P. B., and Adler, L. 1992. Ultra-
W E L D I N G RESEARCH SUPPLEMENT [ 27-s

sonic evaluation of solid-state bonds. Materi- als Evaluation 12:1328- 1337.
30. Nagy, P. B., and Adler, L. 1988. Ultra- sonic NDE of solid-state bonds: Inertia and friction welding. Journal of Nondestructive Evaluation 7(3): 199-215.
31. Nagy, P. B., Lienert, T. J., Adler, L., and Baeslack Ill, W. A. 1995. Novel nondestructive evaluation techniques for inertia-friction welds in a SiC-reinforced high-temperature aluminum alloy. Review of Progress in Quan- titative Nondestructive Evaluation, Vol. 14, eds. D. O. Thompson and D. E. Chimenti, pp. 1545-1552, Plenum Press.
32. Briggs, A. 1992. Acoustic Microscopy. New York, N.Y., Oxford Press.
33. Lienert. T. J., Baeslack III, W. A., Ring- nalda, J., and Fraser, H. L. 1996. Inertia-fric- tion welding of SiC-reinforced 8009 alu- minum. Journal of Materials Science 31: 2149-2157.
34. Yang, J., Cady, C., Hu, M. S., Zok, F., Mehrabian, R., and Evans, A. G. 1990. Effects of damage on the flow strength and ductility of a ductile AI alloy reinforced with SiC par- ticulates. Acta Metallurgica et Materialia 38(12): 2613-2619.
35. Bao, G. 1992. Damage due to fracture of brittle reinforcements in a ductile matrix. Acta Metallurgica et Materialia 40(10): 2547-2555.
36. Brechet, Y., Newell, J., Tao, S., and Em- bury, J. D. 1993. A note on particle comminu- tion at large plastic strains in AI-SiC compos- ites. Scripta Metallurgica et Materialia 28: 47-51.
37. Rich, T., and Roberts, R. 1971. The forge phase of friction welding. Welding Jour- nal51(3): 137-s to 145-s.
38. Rakhimov, A. E., Li, Z., and North, T. H. 1996. Theoretical modeling of MMC base material friction joining. Canadian Metallurgi- cal Quarterly 35(3): 285-289.
39. Nied, H. A. 1992. Finite element sim- ulation of inertia welding. Abstracts of the 73rd AWS Annual Meeting, pp. 187-188, Miami, Fla., American Welding Society.
40. Soucail, M., Moal, A., Nazi, L., Mas- soni, E., Levaillant, C., and Bienvenu, Y. 1992. Microstructural study and numerical simula- tion of inertia friction welding of Astroloy. Su- peralloys 1992, eds. S. A. Antolovich et. al., pp. 847-856, Warrendale, Pa., The Minerals, Metals & Materials Society.
41. Johnson, P. C., Stein, B. A., and Davis, R. S. 1966. Report on inertia welding to the Caterpillar Tractor Company, Cambridge, Mass., Arthur D. Little, Inc.
42. Rao, M., and Hazlett, T. H. 1970. A study of the mechanisms involved in friction welding of aluminum alloys. Welding Journal 50(4): 181 -s to 188-s.
43. Mortensen, A. 1990. A review of the fracture toughness of particle reinforced alu- minum alloys. Fabrication of Particulate Rein- forced Metal Matrix Composites, eds. J. Ma- sounave and F. G. Hamel, pp. 217-233, Materials Park, Ohio, ASM International.
44. Hunt, W. H., Osman, T. M., and Lewandowski, J. J. 1993. Micro- and mi- crostructural factors in DRA fracture resis- tance. JOM 45(1 )" 30-35.
45. Lienert, T. J. 1995. Characterization of inertia-friction welds in SiC-reinforced 8009 aluminum. M.S. thesis, Columbus, Ohio., The Ohio State University.
46. Courtney, T. H. 1990. Mechanical Be- havior of Materials, p. 223, New York, N.Y., McGraw-Hill.
47. Viii, V. I. 1962. Friction Welding of Metals, pp. 23-28, New York, N.Y., Reinhold Publishing.
48. Hosford, W. F., and Caddell, R. M. 1983. Metal Forming: Mechanics and Metal- lurgy, pp. 120-128, Englewood Hills, N.J., Prentice-Hall.
49. Dieter, G. E. 1986. Mechanical Metal- lurgy, pp. 539-549, New York, N.Y., McGraw- Hill.
50. van Rooyen, G. T., and Backofen, W. A. 1960. A study of interface friction in plastic compression. International Journal of Me- chanical Science 1 (1): 1-27.
28-S [ J A N U A R Y 1998