Embed Size (px)
Citation preview
ULTRAPETROL ULTRAPETROL (Bahamas) Limited(Bahamas) Limited
Smart Rivers 2011
Presentation
New Orleans, LA
September 15, 2011
“Long-term prospects of the Hidrovia Region
in South America”
Our disclosure and analysis in this presentation concerning our operations, cash flows and financial position, including, in particular, the likelihood of our success in developing and expanding our business, include forward-looking statements. Statements that are predictive in nature, that depend upon or refer to future events or conditions, or that include words such as ‘‘expects,’’ ‘‘anticipates,’’ ‘‘intends,’’ ‘‘plans,’’ ‘‘believes,’’ ‘‘estimates,’’ ‘‘projects,’’ ‘‘forecasts,’’ ‘‘will,’’ ‘‘may,’’ ‘‘should,’’ and similar expressions are forward-looking statements. Although these statements are based upon assumptions we believe to be reasonable based upon available information, including projections of revenues, operating margins, earnings, cash flow, working capital, and capital expenditures, they are subject to risks and uncertainties. These forward-looking statements represent our estimates and assumptions only as of the date of this presentation and are not intended to give any assurance as to future results. As a result, you should not place undue reliance on any forward-looking statements. We assume no obligation to update any forward-looking statements to reflect actual results, changes in assumptions or changes in other factors, except as required by applicable securities laws.
Factors that might cause future results to differ include, but are not limited to, the following:– unexpected future operating or financial results– delays or increased costs in pending or recent acquisitions, deviations from our business strategy or unexpected increases in
capital spending or operating expenses, including drydocking and insurance costs– changes in general market conditions and trends, including charter rates, vessel values, and factors affecting vessel supply and
demand– our ability to obtain additional financing– changes in our financial condition and liquidity, including our ability to obtain financing in the future to fund capital
expenditures, acquisitions and other general corporate activities
Forward Looking Statements & EBITDA
2
expenditures, acquisitions and other general corporate activities– deviations from our expectations about the availability of vessels to purchase, the time that it may take to construct new vessels, or
vessels’ useful lives– delays or defaults by our contract counter-parties in performing their obligations to us– loss of one or more key members of our management team– changes in governmental rules and regulations or actions taken by regulatory authorities– adverse weather conditions that can affect production of the goods we transport and navigability of the river system– the highly competitive nature of the oceangoing transportation industry– the loss of one or more key customers– unexpected fluctuations in foreign exchange rates and devaluations– liabilities from future litigation– other factors discussed in the section titled ‘‘Risk factors” in our annual report on form 20-F for the year ended December 31, 2010– Adjusted EBITDA consists of net income (loss) prior to deductions for interest expense and other financial gains and losses related
to the financing of the Company, income taxes, depreciation of vessels and equipment and amortization of drydock expense, intangible assets, financial gain (loss) on extinguishment of debt and a premium paid for redemption of preferred shares. We have provided Adjusted EBITDA in this report because we use it to, and believe it provides useful information to investors toevaluate our ability to incur and service indebtedness. We do not intend for Adjusted EBITDA to represent cash flows from operations, as defined by GAAP (on the date of calculation) and it should not be considered as an alternative to measure our liquidity. This definition of Adjusted EBITDA may not be comparable to similarly titled measures disclosed by other companies. Generally, funds represented by Adjusted EBITDA are available for management’s discretionary use. Adjusted EBITDA has limitations as an analytical tool, and should not be considered in isolation, or as a substitute for analysis of our results as reported.
Hidrovia Waterway System – Navigation
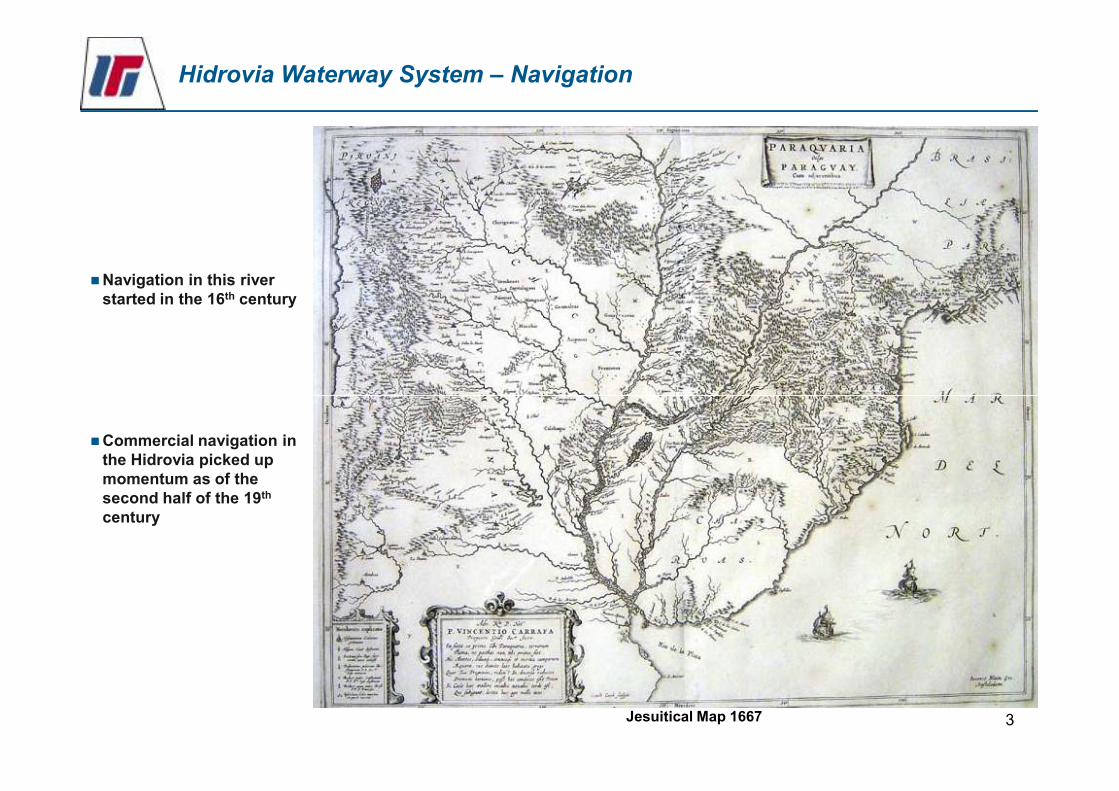
�Navigation in this river started in the 16th century
3
�Commercial navigation in the Hidrovia picked up momentum as of the second half of the 19th
century
Jesuitical Map 1667
Hidrovia Waterway System – Geography
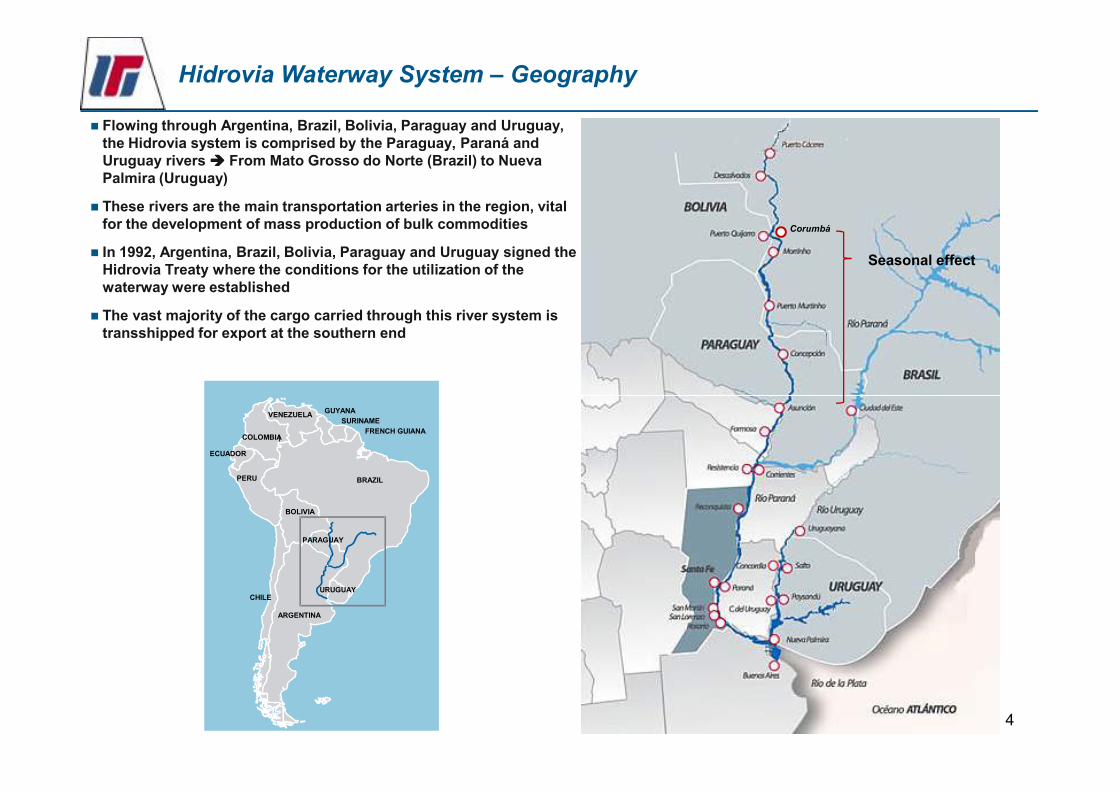
� Flowing through Argentina, Brazil, Bolivia, Paraguay and Uruguay, the Hidrovia system is comprised by the Paraguay, Paraná and Uruguay rivers ���� From Mato Grosso do Norte (Brazil) to Nueva Palmira (Uruguay)
� These rivers are the main transportation arteries in the region, vital for the development of mass production of bulk commodities
� In 1992, Argentina, Brazil, Bolivia, Paraguay and Uruguay signed the Hidrovia Treaty where the conditions for the utilization of the waterway were established
� The vast majority of the cargo carried through this river system is transshipped for export at the southern end
Corumbá
Seasonal effect
4
PARAGUAY
BRAZIL
SURINAME
GUYANAVENEZUELA
ARGENTINA
ECUADOR
FRENCH GUIANACOLOMBIA
PERU
BOLIVIA
CHILEURUGUAY
Hidrovia Waterway System – Navigation (cont’d)
1,00
2,00
3,00
4,00
5,00
6,00
1998 1999
2000 2001
2002 2003
2004 2005
Mediana 2006
2007 2008
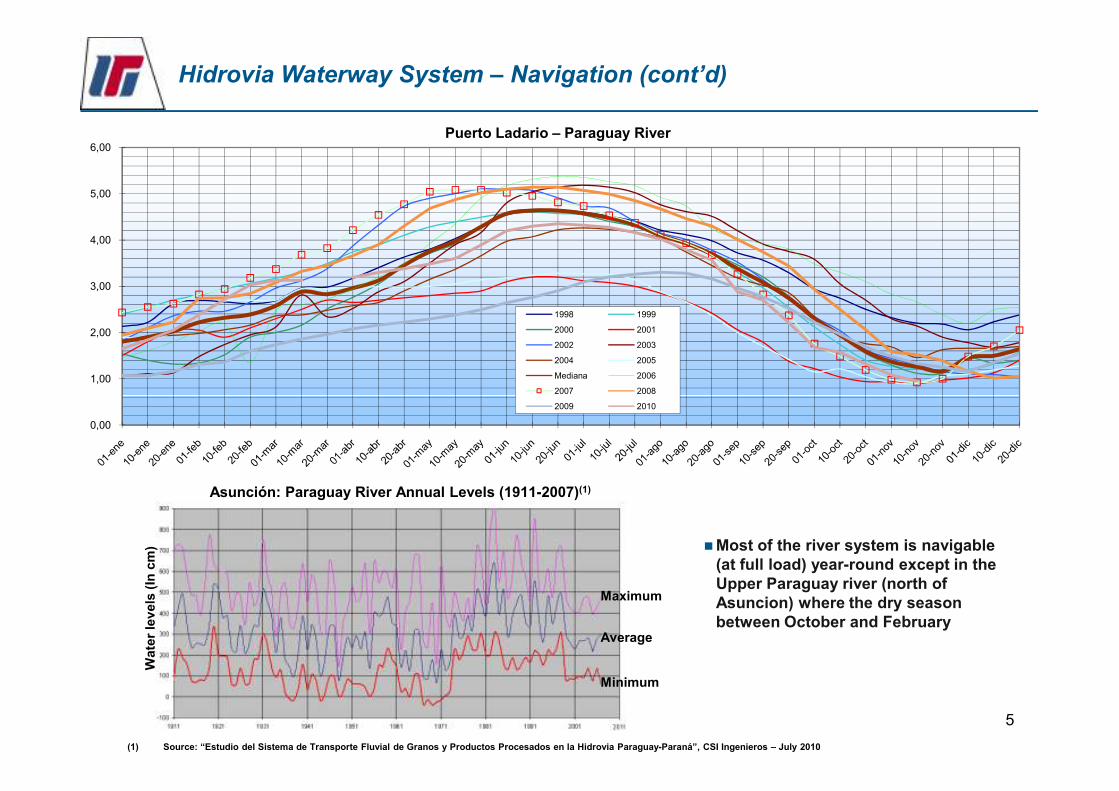
Puerto Ladario – Paraguay River
5
�Most of the river system is navigable (at full load) year-round except in the Upper Paraguay river (north of Asuncion) where the dry season between October and February
Asunción: Paraguay River Annual Levels (1911-2007)(1)
(1) Source: “Estudio del Sistema de Transporte Fluvial de Granos y Productos Procesados en la Hidrovia Paraguay-Paraná”, CSI Ingenieros – July 2010
Wate
r le
vels
(In
cm
)
Maximum
Average
Minimum
0,00
2007 2008
2009 2010
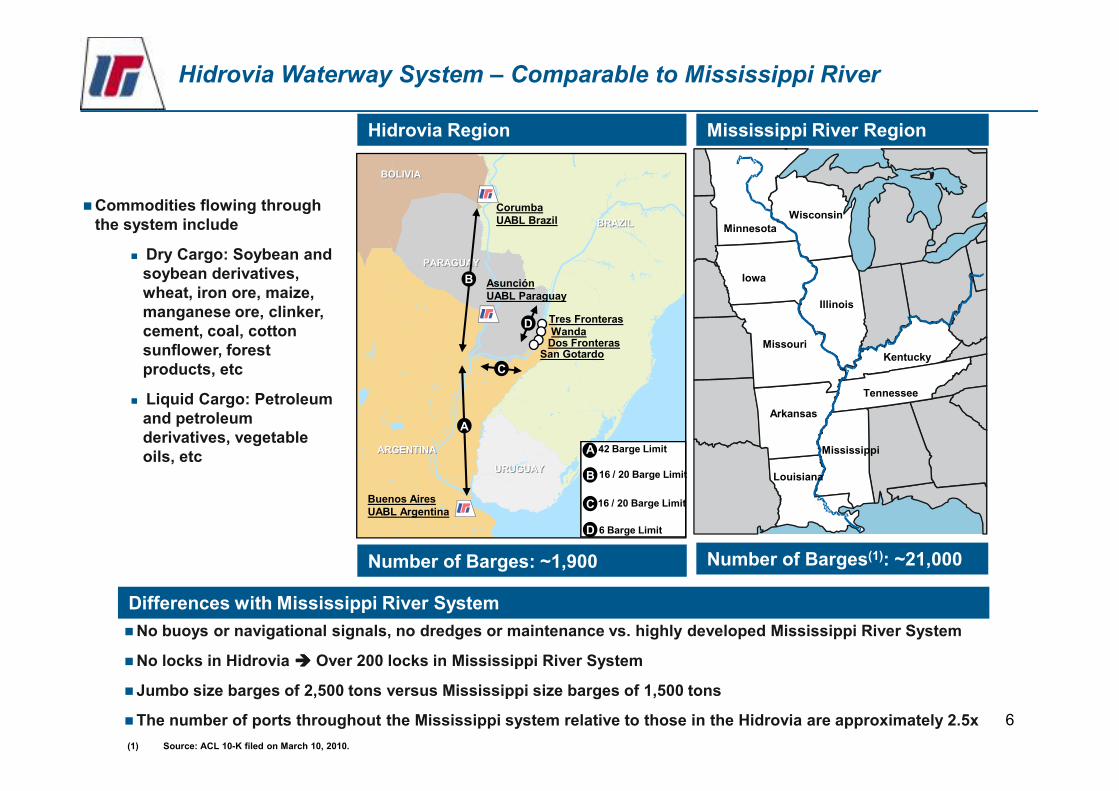
Hidrovia Waterway System – Comparable to Mississippi River
Hidrovia Region Mississippi River Region
Illinois
Kentucky
Tennessee
Missouri
Iowa
Minnesota
Wisconsin�Commodities flowing through
the system include
� Dry Cargo: Soybean and soybean derivatives, wheat, iron ore, maize, manganese ore, clinker, cement, coal, cotton sunflower, forest products, etc
Liquid Cargo: Petroleum
BRAZILBRAZIL
PARAGUAYPARAGUAY
BOLIVIABOLIVIA
CorumbaUABL Brazil
Tres FronterasWanda
Dos FronterasSan Gotardo
AsunciónUABL Paraguay
B
C
D
6
Number of Barges: ~1,900 Number of Barges(1): ~21,000
(1) Source: ACL 10-K filed on March 10, 2010.
Tennessee
Mississippi
Louisiana
Arkansas
�No buoys or navigational signals, no dredges or maintenance vs. highly developed Mississippi River System
�No locks in Hidrovia ���� Over 200 locks in Mississippi River System
�Jumbo size barges of 2,500 tons versus Mississippi size barges of 1,500 tons
�The number of ports throughout the Mississippi system relative to those in the Hidrovia are approximately 2.5x
� Liquid Cargo: Petroleum and petroleum derivatives, vegetable oils, etc
URUGUAYURUGUAY
ARGENTINAARGENTINA
Buenos AiresUABL Argentina
A
A
B
C
D
42 Barge Limit
16 / 20 Barge Limit
16 / 20 Barge Limit
6 Barge Limit
Differences with Mississippi River System
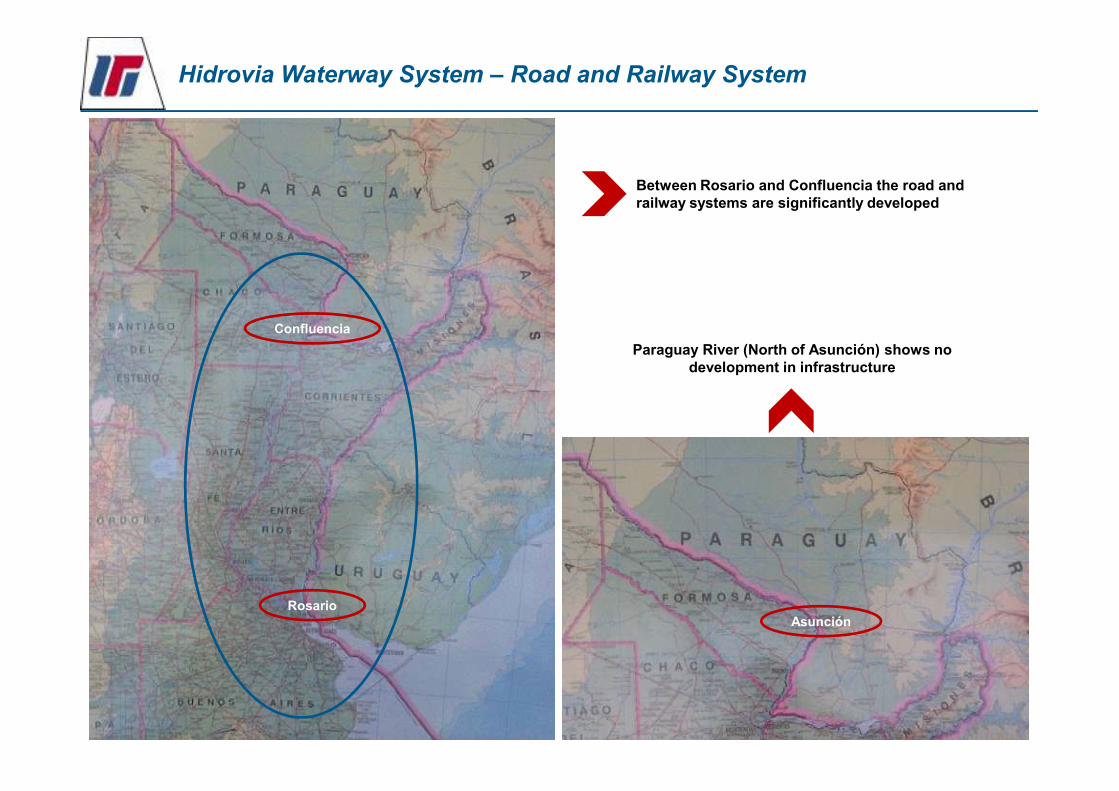
Hidrovia Waterway System – Road and Railway System
Between Rosario and Confluencia the road and railway systems are significantly developed
Confluencia
Paraguay River (North of Asunción) shows no development in infrastructure
7
RosarioAsunción
0,4 0,61,0 1,1 1,1 1,0 1,1 1,2 1,2 1,2 1,4 1,4 1,6
1,9 2,02,4 2,4 2,7 2,6 2,7 2,8
0,61,0
1,6 1,82,2 2,4
2,8 3,0 3,0 2,93,5 3,5
4,53,9 4,0
3,6
5,9
6,9
4,0
7,2
8,3
0
1
2
3
4
5
6
7
8
9
Millio
n H
ecta
res &
To
ns
Seeded Area Production
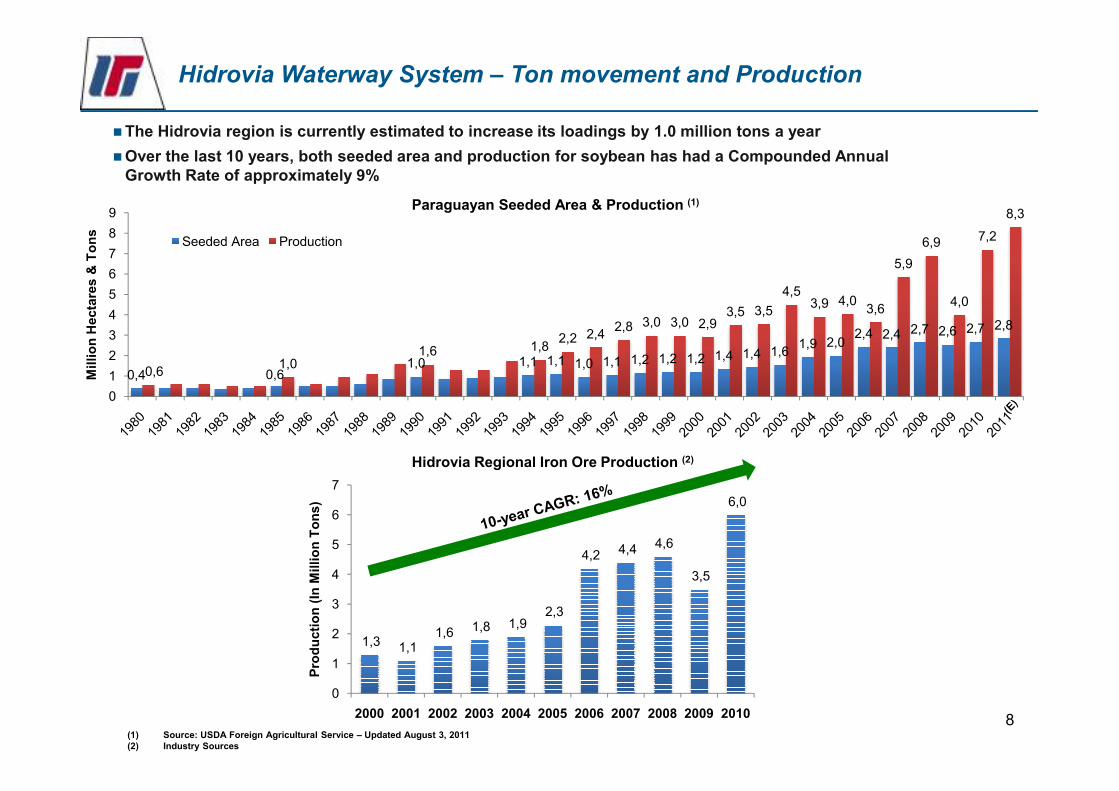
Hidrovia Waterway System – Ton movement and Production
�The Hidrovia region is currently estimated to increase its loadings by 1.0 million tons a year
Paraguayan Seeded Area & Production (1)
�Over the last 10 years, both seeded area and production for soybean has had a Compounded Annual Growth Rate of approximately 9%
8
0
1,3 1,1 1,6 1,8 1,9
2,3
4,2 4,4 4,6
3,5
6,0
0
1
2
3
4
5
6
7
2000 2001 2002 2003 2004 2005 2006 2007 2008 2009 2010
Pro
du
cti
on
(In
Millio
n T
on
s)
(1) Source: USDA Foreign Agricultural Service – Updated August 3, 2011(2) Industry Sources
Hidrovia Regional Iron Ore Production (2)
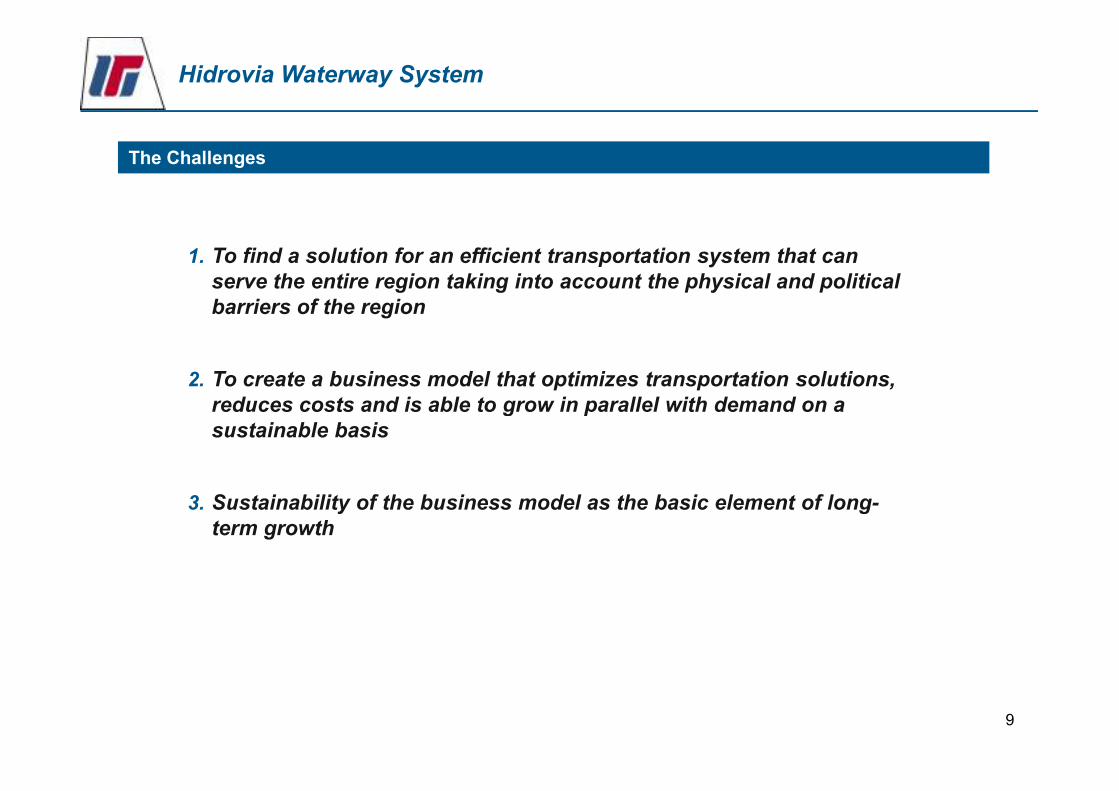
Hidrovia Waterway System
1. To find a solution for an efficient transportation system that can
serve the entire region taking into account the physical and political
barriers of the region
2. To create a business model that optimizes transportation solutions,
reduces costs and is able to grow in parallel with demand on a
The Challenges
9
reduces costs and is able to grow in parallel with demand on a
sustainable basis
3. Sustainability of the business model as the basic element of long-
term growth
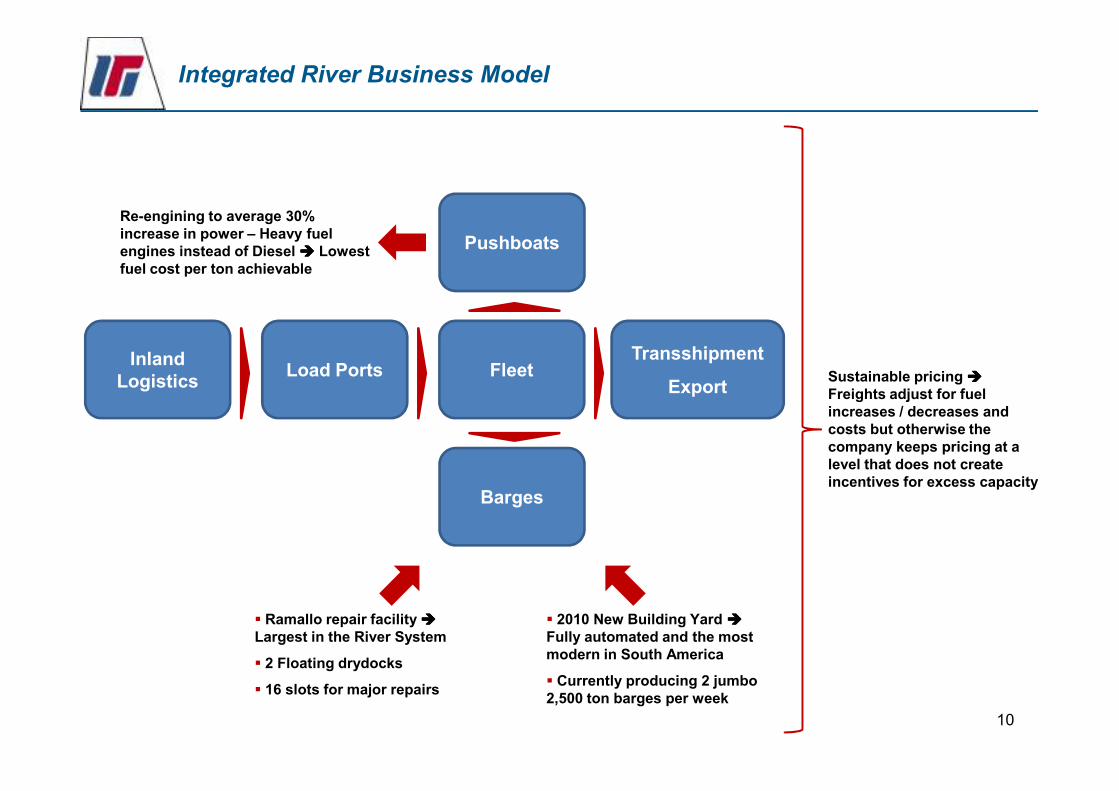
Integrated River Business Model
Fleet
Pushboats
Transshipment
ExportLoad Ports
Inland Logistics
Re-engining to average 30% increase in power – Heavy fuel engines instead of Diesel ���� Lowest fuel cost per ton achievable
Sustainable pricing ����Freights adjust for fuel
10
Export
Barges
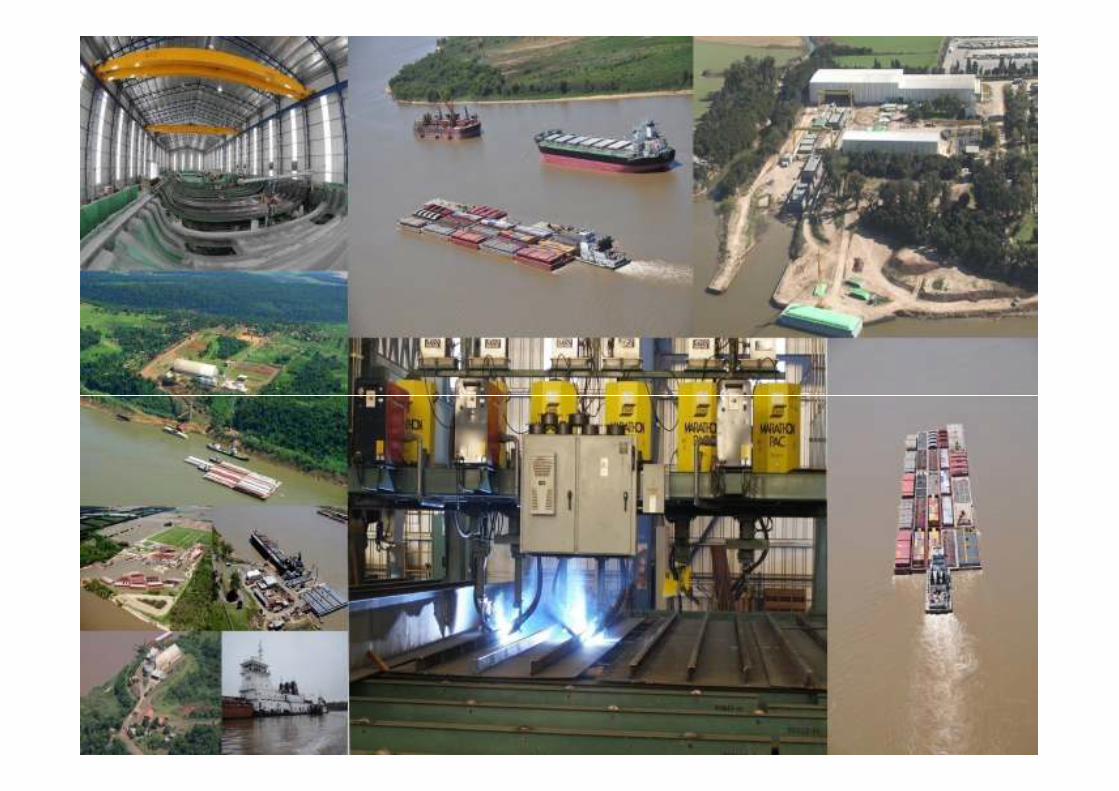
� Ramallo repair facility ����Largest in the River System
� 2 Floating drydocks
� 16 slots for major repairs
� 2010 New Building Yard ����Fully automated and the most modern in South America
� Currently producing 2 jumbo 2,500 ton barges per week
Freights adjust for fuel increases / decreases and costs but otherwise the company keeps pricing at a level that does not create incentives for excess capacity
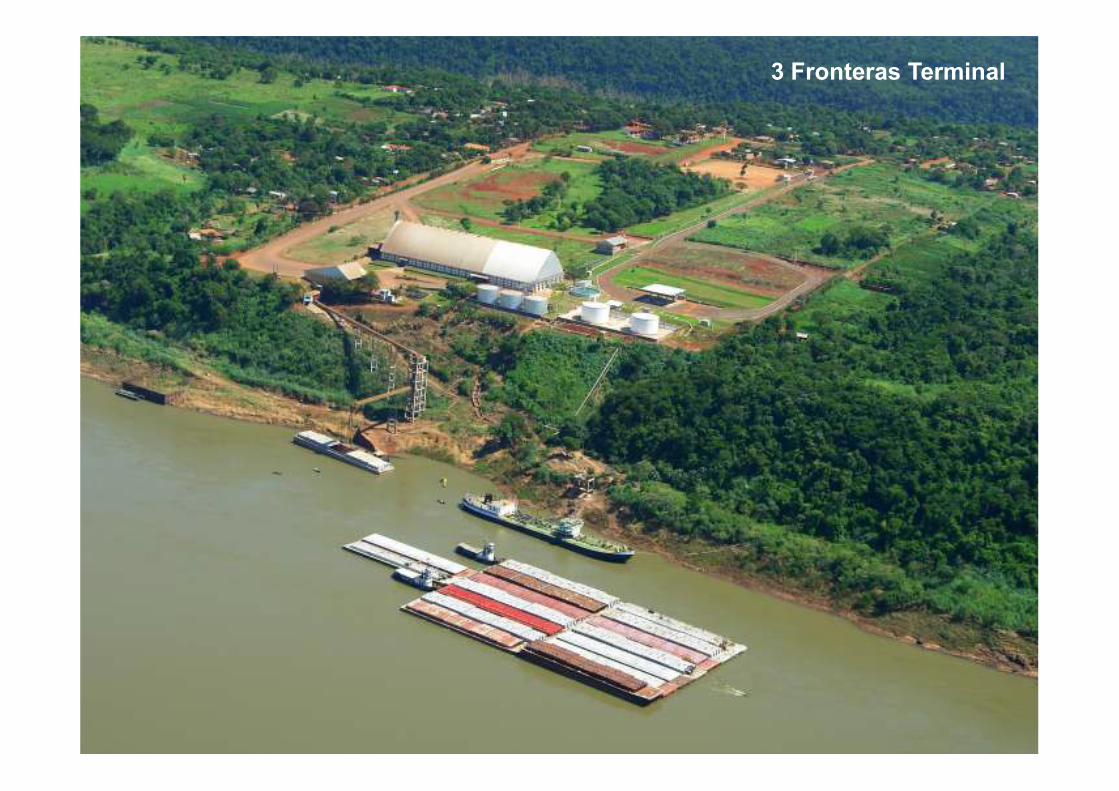
3 Fronteras Terminal
11
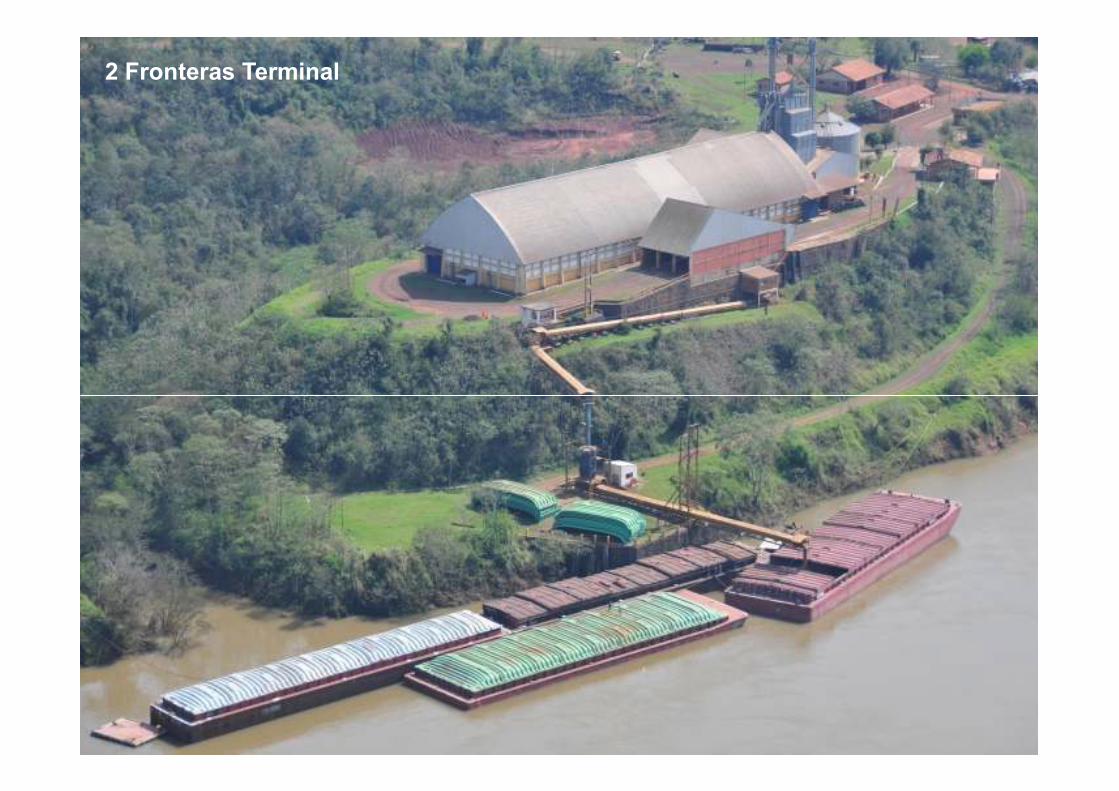
2 Fronteras Terminal
12
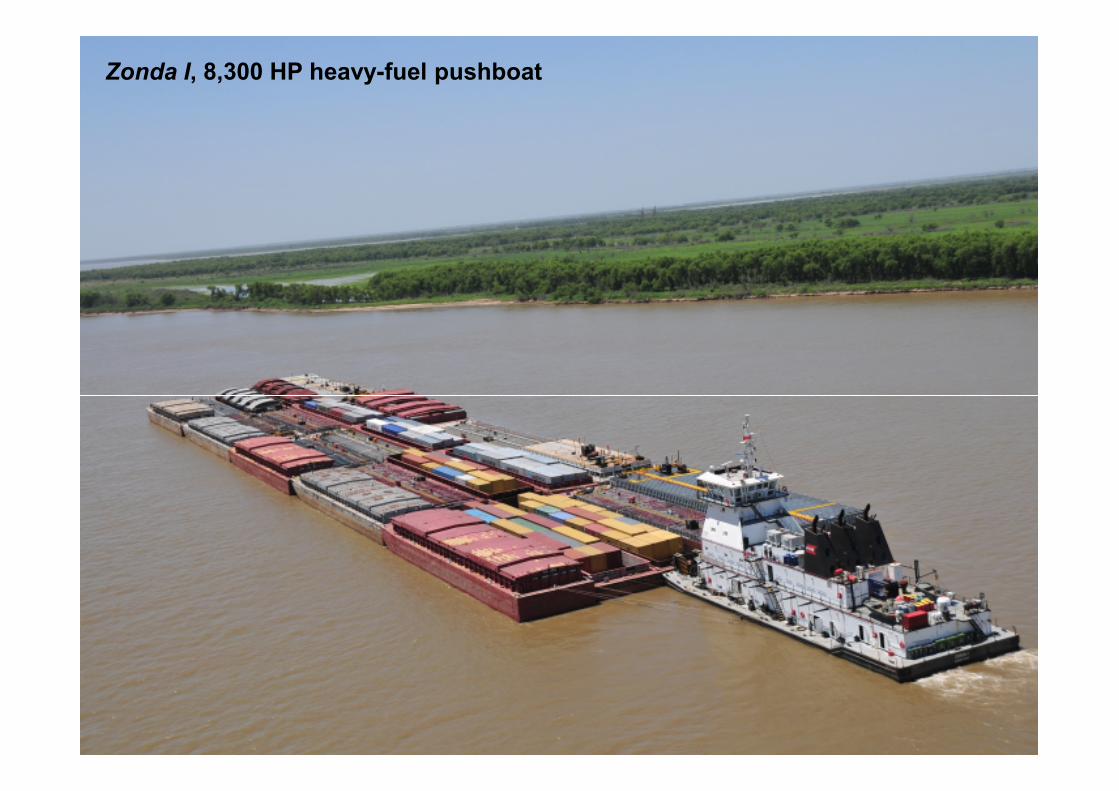
Zonda I, 8,300 HP heavy-fuel pushboat
13
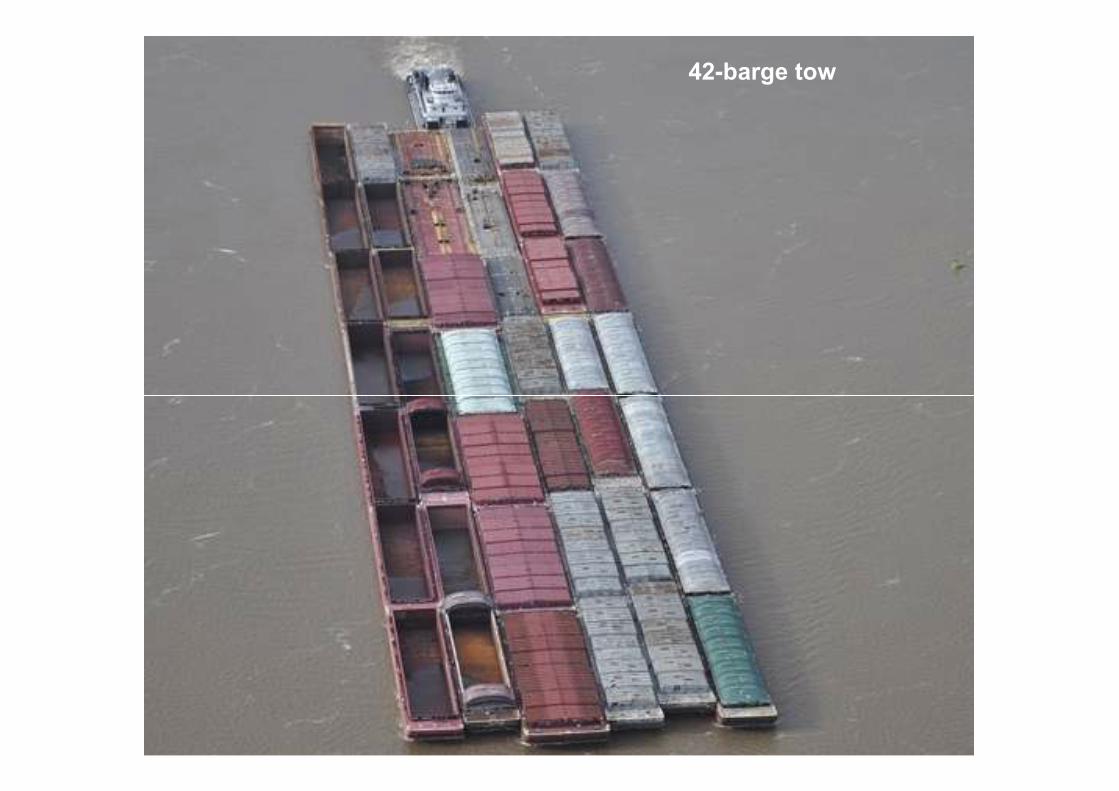
42-barge tow
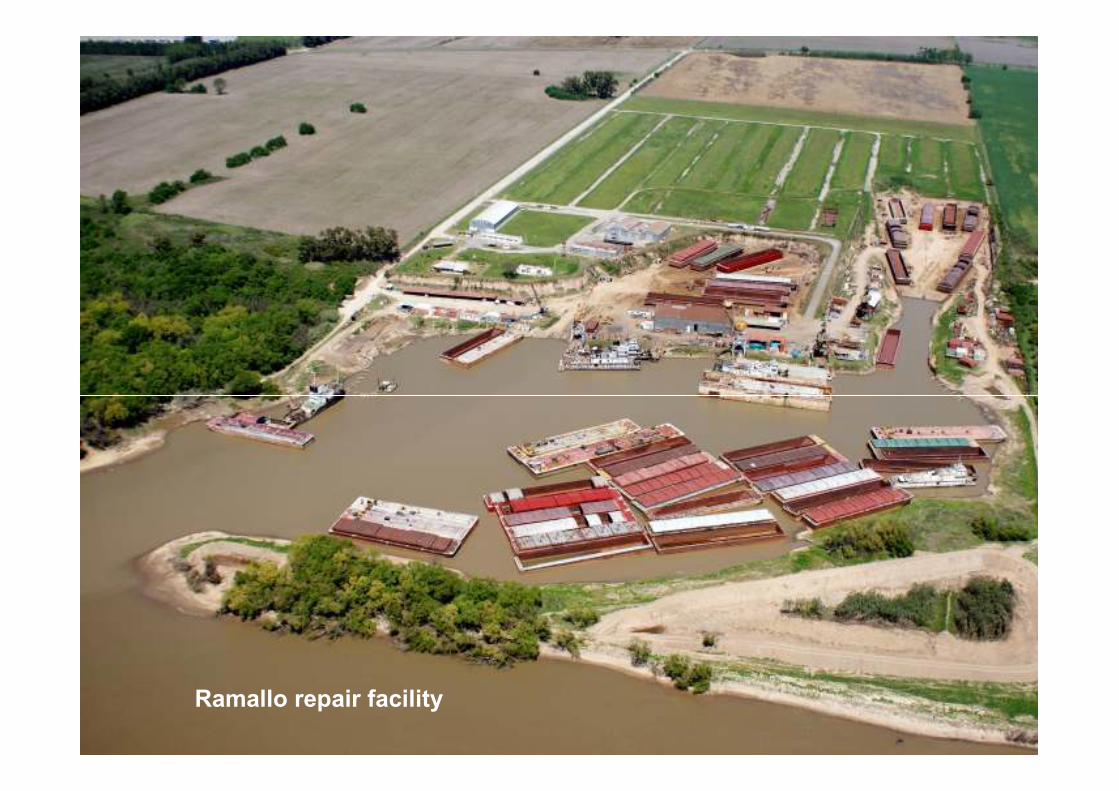
Ramallo repair facility
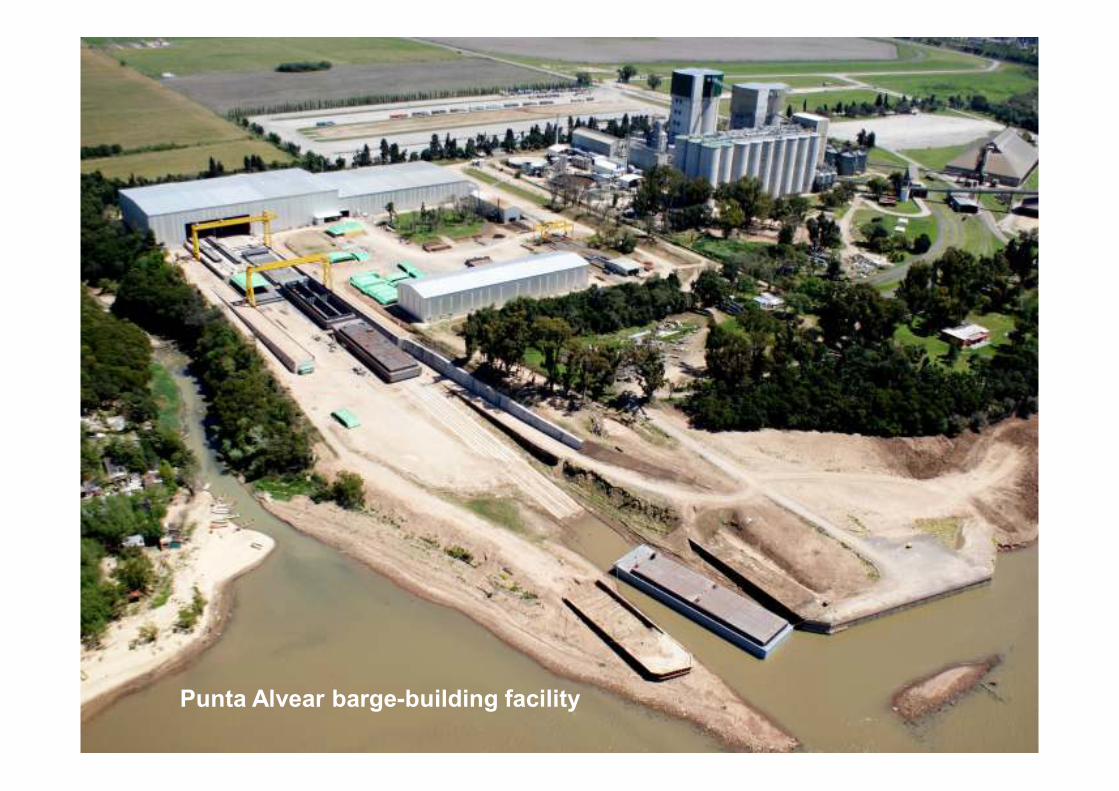
Punta Alvear barge-building facility
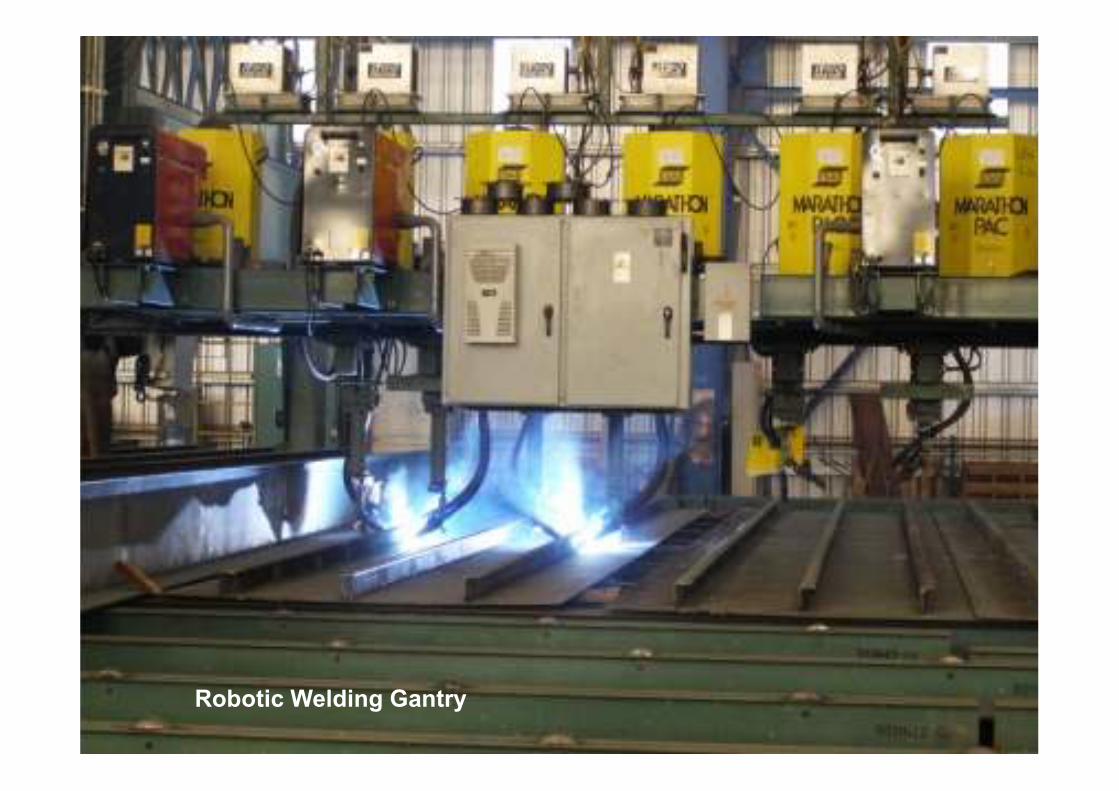
Robotic Welding Gantry
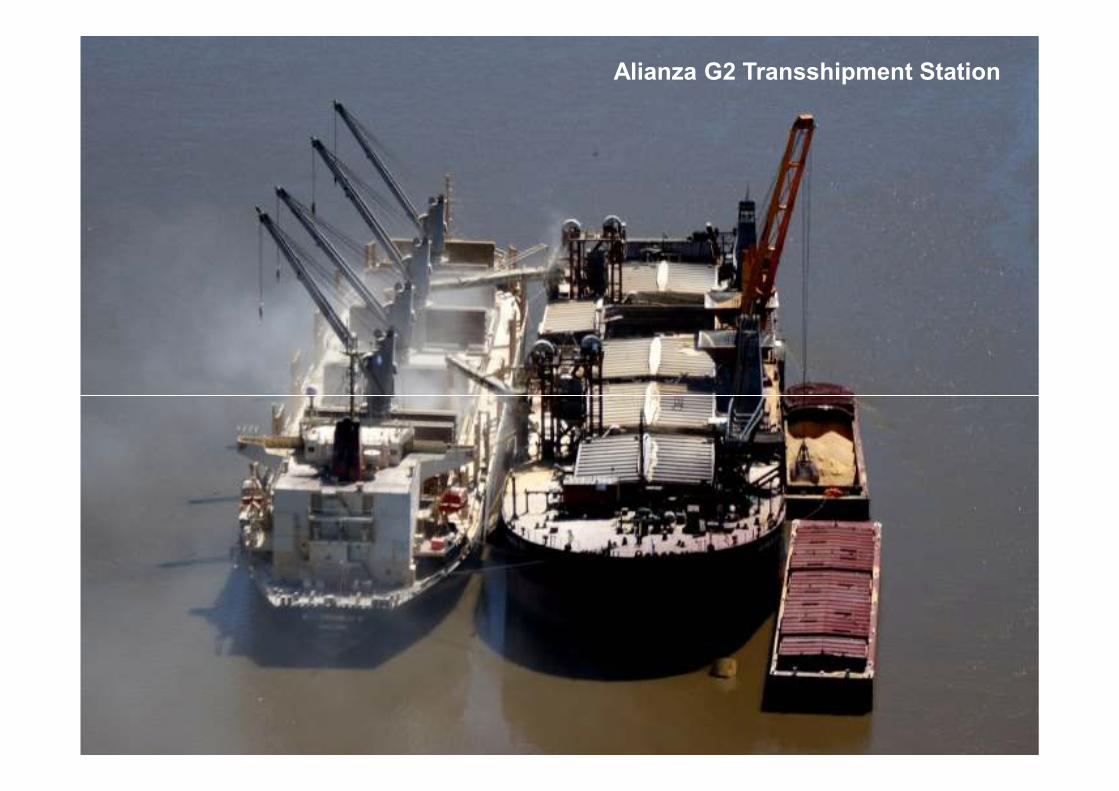
Alianza G2 Transshipment Station
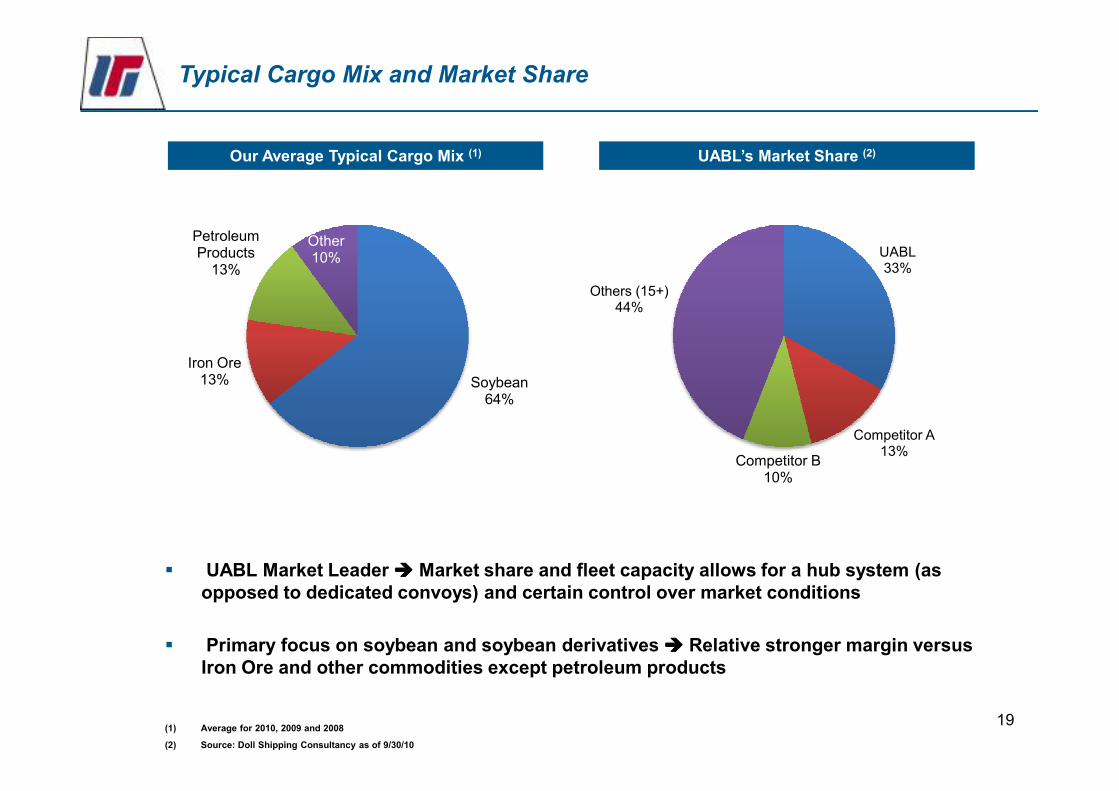
Our Average Typical Cargo Mix (1) UABL’s Market Share (2)
Soybean64%
Iron Ore13%
Petroleum Products13%
Other10% UABL
33%
Others (15+)44%
Typical Cargo Mix and Market Share
19(1) Average for 2010, 2009 and 2008
(2) Source: Doll Shipping Consultancy as of 9/30/10
� UABL Market Leader ���� Market share and fleet capacity allows for a hub system (as opposed to dedicated convoys) and certain control over market conditions
� Primary focus on soybean and soybean derivatives ���� Relative stronger margin versus Iron Ore and other commodities except petroleum products
64%
Competitor A13%
Competitor B10%
2.867.032 3.000.000
3.500.000
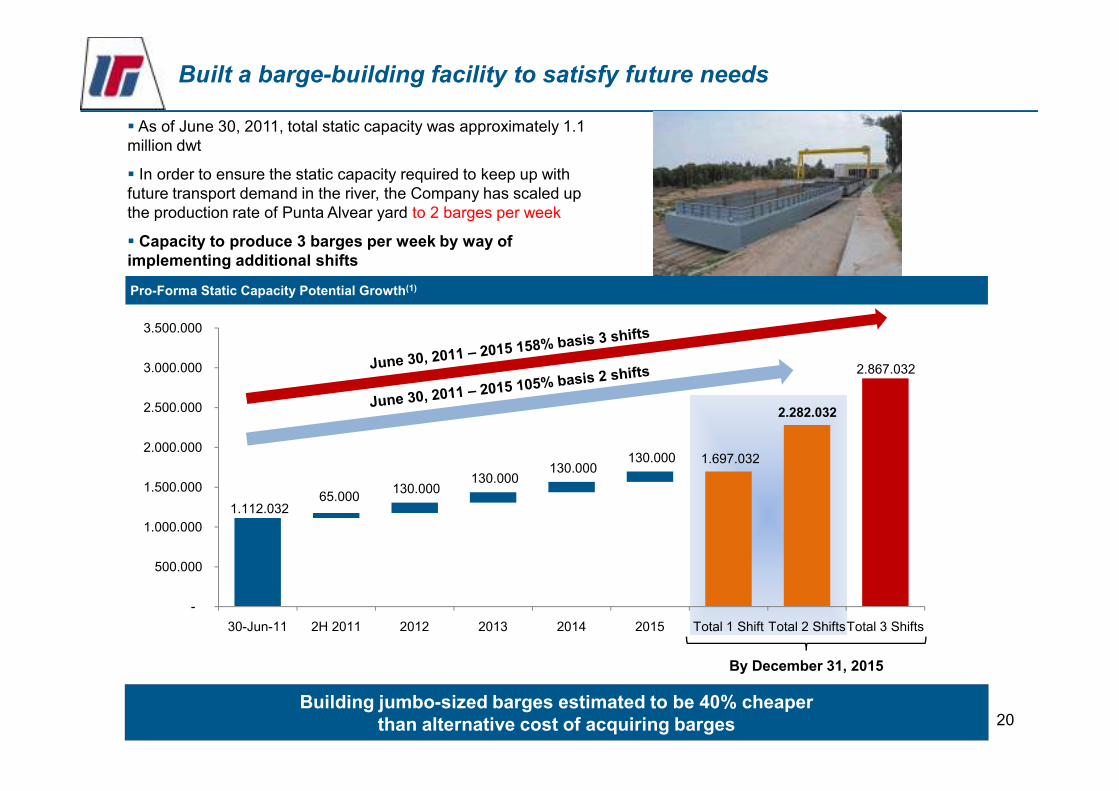
Pro-Forma Static Capacity Potential Growth(1)
Built a barge-building facility to satisfy future needs
� As of June 30, 2011, total static capacity was approximately 1.1 million dwt
� In order to ensure the static capacity required to keep up with future transport demand in the river, the Company has scaled up the production rate of Punta Alvear yard to 2 barges per week
� Capacity to produce 3 barges per week by way of implementing additional shifts
20
1.112.032 65.000
130.000 130.000
130.000 130.000 1.697.032
2.282.032
-
500.000
1.000.000
1.500.000
2.000.000
2.500.000
30-Jun-11 2H 2011 2012 2013 2014 2015 Total 1 Shift Total 2 ShiftsTotal 3 Shifts
Building jumbo-sized barges estimated to be 40% cheaperthan alternative cost of acquiring barges
By December 31, 2015
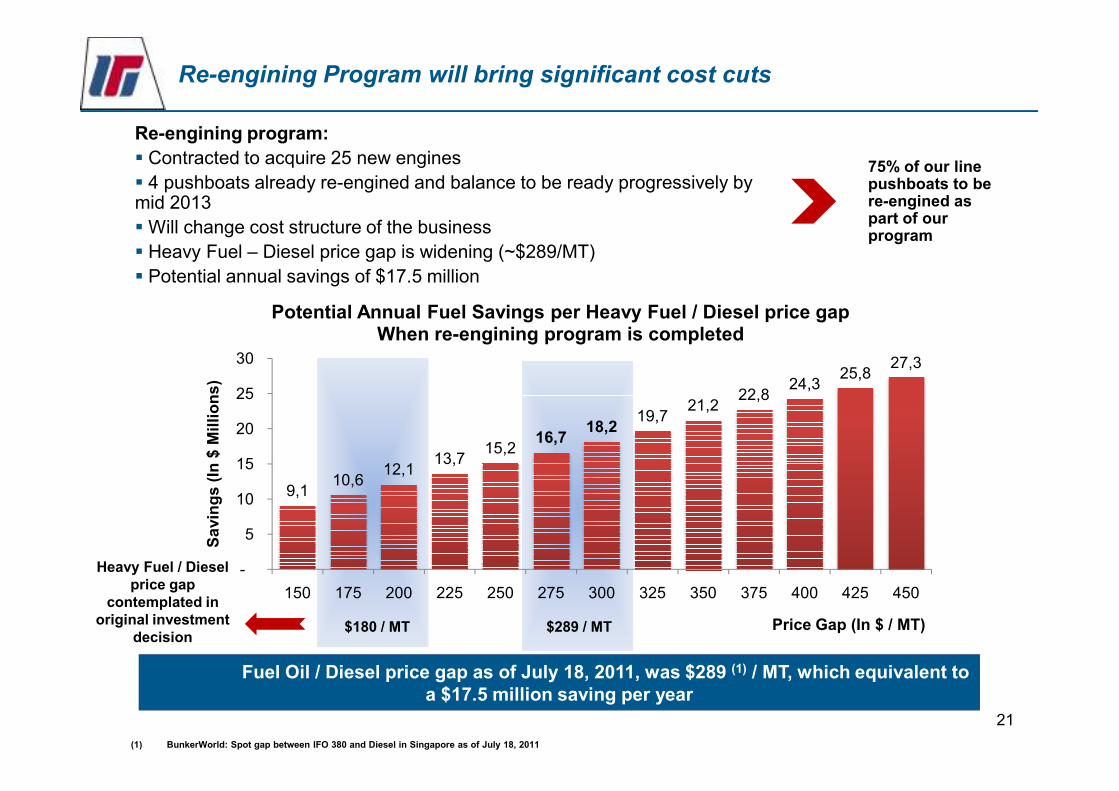
Re-engining Program will bring significant cost cuts
75% of our line pushboats to be re-engined as part of our program
22,824,3
25,827,3
25
30
Sa
vin
gs
(In
$ M
illi
on
s)
Potential Annual Fuel Savings per Heavy Fuel / Diesel price gap When re-engining program is completed
Re-engining program:
� Contracted to acquire 25 new engines
� 4 pushboats already re-engined and balance to be ready progressively by mid 2013
�Will change cost structure of the business
� Heavy Fuel – Diesel price gap is widening (~$289/MT)
� Potential annual savings of $17.5 million
21
Fuel Oil / Diesel price gap as of July 18, 2011, was $289 (1) / MT, which equivalent to a $17.5 million saving per year
$289 / MT$180 / MT
Heavy Fuel / Diesel price gap
contemplated in original investment
decision
(1) BunkerWorld: Spot gap between IFO 380 and Diesel in Singapore as of July 18, 2011
9,110,6
12,113,7
15,216,7
18,219,7
21,222,8
-
5
10
15
20
25
150 175 200 225 250 275 300 325 350 375 400 425 450
Sa
vin
gs
(In
$ M
illi
on
s)
Price Gap (In $ / MT)
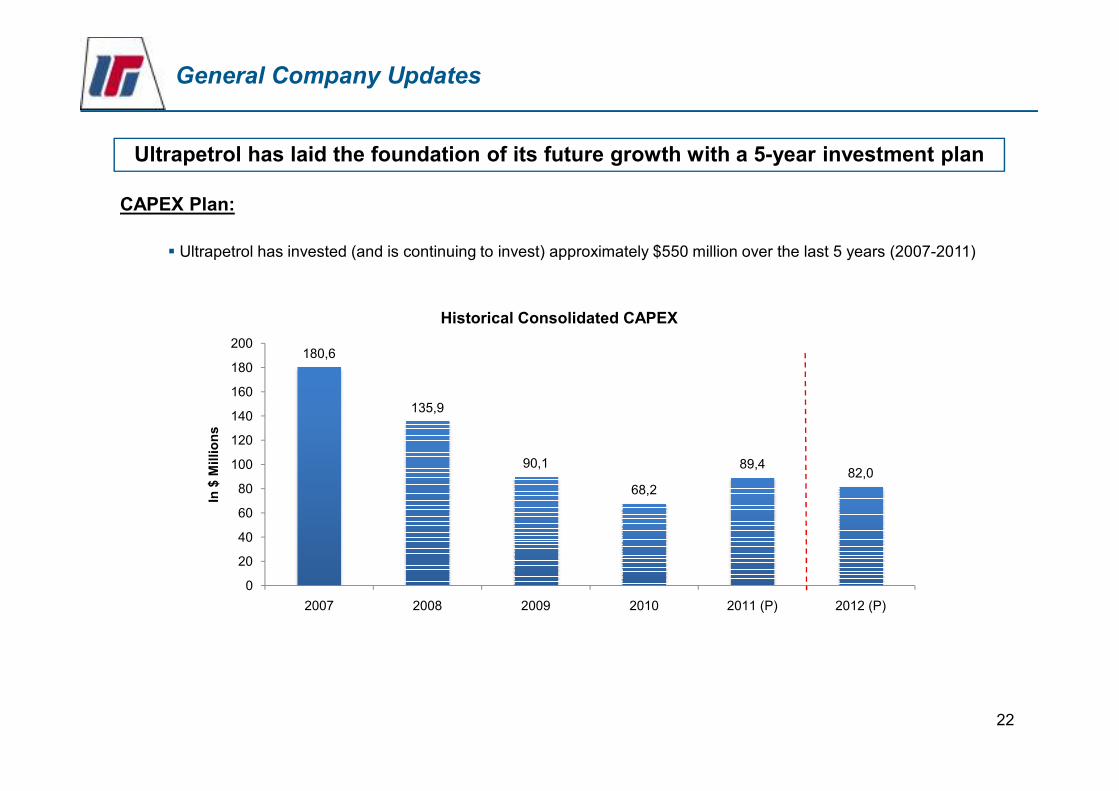
180,6
160
180
200
Historical Consolidated CAPEX
General Company Updates
CAPEX Plan:
� Ultrapetrol has invested (and is continuing to invest) approximately $550 million over the last 5 years (2007-2011)
Ultrapetrol has laid the foundation of its future growth with a 5-year investment plan
22
135,9
90,1
68,2
89,482,0
0
20
40
60
80
100
120
140
160
2007 2008 2009 2010 2011 (P) 2012 (P)
In $
Millio
ns
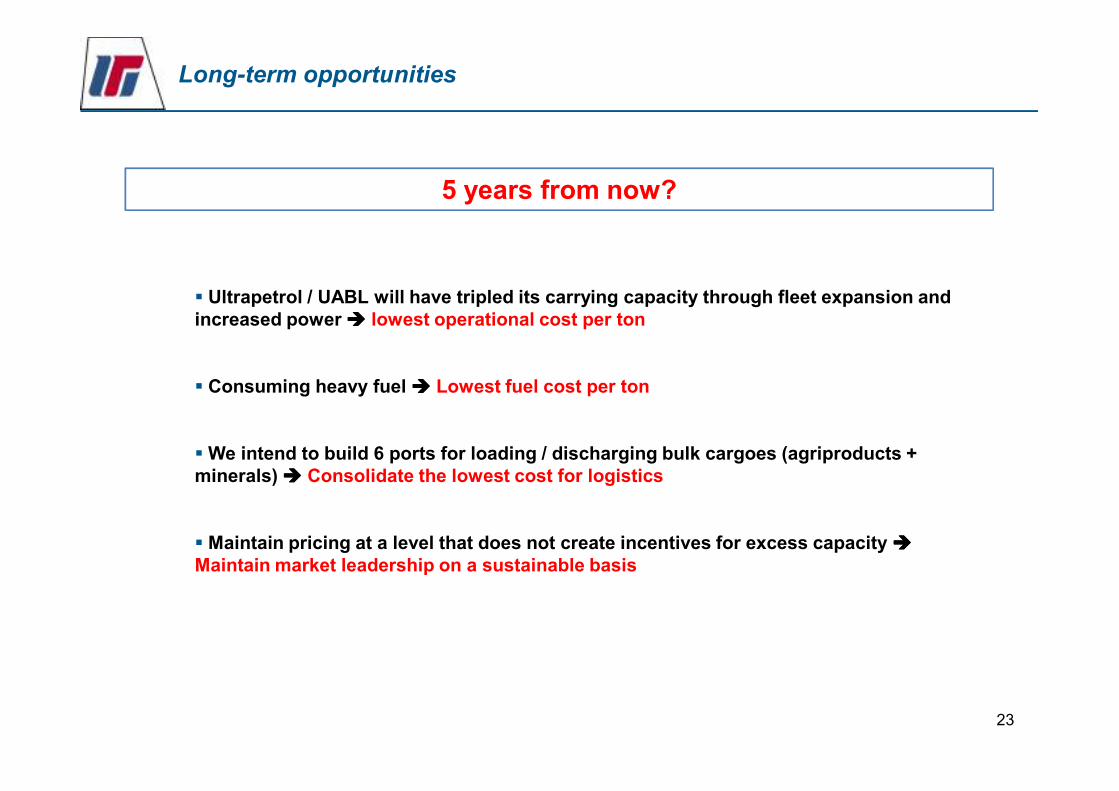
Long-term opportunities
5 years from now?
� Ultrapetrol / UABL will have tripled its carrying capacity through fleet expansion and increased power ���� lowest operational cost per ton
� Consuming heavy fuel ���� Lowest fuel cost per ton
23
� Consuming heavy fuel ���� Lowest fuel cost per ton
� We intend to build 6 ports for loading / discharging bulk cargoes (agriproducts + minerals) ���� Consolidate the lowest cost for logistics
� Maintain pricing at a level that does not create incentives for excess capacity ����Maintain market leadership on a sustainable basis
24