Embed Size (px)
Citation preview

ULTRAHIGH RESOLUTION OPTICAL SPECTROSCOPY
OF LIQUID MICRODROPLETS USING TAPERED
OPTICAL FIBER WAVEGUIDES
by
Yasin Karadag
A Thesis Submitted to the
Graduate School of Sciences and Engineering
in Partial Fulfillment of the Requirements for
the Degree of
Doctor of Philosophy
in
Physics
Koc University
October, 2013

Koc University
Graduate School of Sciences and Engineering
This is to certify that I have examined this copy of a doctoral dissertation by
Yasin Karadag
and have found that it is complete and satisfactory in all respects,
and that any and all revisions required by the final
examining committee have been made.
Committee Members:
Alper Kiraz, Ph. D.(Advisor)
Metin Muradoglu, Ph. D.
Kaan Guven, Ph. D.
Alexandr Jonas, Ph. D.
Selcuk Akturk, Ph. D.
Date:

ABSTRACT
Optofluidics is a new research field that exploits unique properties of fluids for creating
optical components and systems. Optofluidic devices combined with accurate control of
liquids on small spatial scale via microfluidic technologies pave way for improved chemi-
cal and biological functionality in lab-on-a-chip analytical and preparative systems. Main
advantages of such integrated systems are their compactness and direct compatibility with
biological specimens. Examples of applications of integrated optofluidics include optical
communication components, organic dye-based laser light sources, or biological sensing.
Microdroplets, with their spherical gemetry and exceptionally smooth surfaces are ideally
suited for applications in optofluidics. It is well known that spherical dielectric microob-
jects can act as optical resonators hosting so-called whispering gallery modes (WGMs) -
optical resonances that possess very high quality factors while being confined to relatively
small volumes near the microobject’s rim. Consequently, very high optical field density can
be achieved in microdroplets that can have already found many applications in quantum
and nonlinear optics. Fundamental studies in cavity quantum electrodynamics have led
to the demonstration of manipulation of the spontaneous emission rate of dye molecules.
Dye lasing, stimulated Raman scattering, and Raman lasing in microdroplets have also
been demonstrated at low pump threshold powers. Apart from their significance for the
fundamental physics research, microdroplets are well suited to another important line of
applications that benefit from the sensitivity of the WGMs to the microdroplet size as well
as the refractive indices of the inner liquid and the outer medium. These properties naturally
make microdroplets very attractive in biological and chemical sensing, and in developing
optical devices that necessitate a tunable optical microcavity, e.g. tunable optical switches
or light sources.
In order to utilize microdroplets in optofluidic applications, one must be able to stabilize
their position in a controlled way. In this thesis, superhydrophobic surfaces were used to
stabilize droplet position. Surface-supported microdroplets can host high-quality WGMs
iii

and thus, they represent an ideal model system for studying fundamental optical properties
and applications of liquid-based optical resonant cavities. The thesis is organized as follows..
In the first part, we introduce a novel method for the microscopic contact angle measure-
ment that is based on the analysis of mechanical resonances of individual micrometer-sized
liquid droplets supported by a vibrated superhydrophobic surface. Fluorescence spectra
of the dye-doped droplets excited by laser light feature whispering gallery modes (WGMs)
whose spectral widths depend on the droplet vibration amplitude, thus enabling precise
measurements of the droplet mechanical resonant frequency. Following droplet size deter-
mination by WGM mode-matching, we calculate the contact angles from the dependence of
the measured mechanical resonant frequency on the droplet size for two surfaces with differ-
ent superhydrophobicity levels, and a good correlation with the values measured by direct
imaging of millimeter-sized droplets is found. In addition to that oscillatory deformations
of micrometer-sized NaCl-water droplets by an AC electric field are used for contact angle
measurements on superhydrophobic surfaces.
In the second part, tapered optical fiber waveguide coupling is used instead of free-space
coupling of light into the surface-supported droplets. Fiber tapers allow selective phase-
matched excitation of individual WGMs with a spectral resolution limited only by the
linewidth of the laser used. We measured ultrahigh quality factors (Q-factors) of the optical
whispering-gallery modes excited via a tapered optical-fiber waveguide in single glycerol-
water microdroplets standing on a superhydrophobic surface in air. Owing to the high
contact angle of glycerol-water mixture on the superhydrophobic surface (> 155◦), droplets
with the geometry of a truncated sphere minimally distorted by gravity and contact line
pinning effects could be generated. Q-factors up to 2.3×10⁶ were observed for such droplets
with radii of 100−200µm exposed to the ambient atmosphere in a closed chamber with con-
trolled relative humidity. Placement of microdroplets in a constant humidity environment
permitted prolonged characterization of Q-factors of individual microdroplets. We found
that the Q-factors of liquid droplets in air were stable over more than an hour and their
measured values were limited mostly by the thermally-induced droplet shape fluctuations.
In the last part, we demonstrate long-term stabilization of the size of liquid optical mi-
crocavities based on surface-supported salt-water microdroplets surrounded by air. Single

tapered optical fibers were used to couple the light from independent heating and probe
lasers into individual microdroplets that were kept on a superhydrophobic surface in a high-
humidity chamber. Size stabilization of microdroplets resulted from competition between
resonant absorption of the infrared heating laser by a microdroplet whispering gallery mode
and water condensation in the sample chamber. Microdroplet size was continuously mon-
itored using the tunable red probe laser. Thanks to the narrow linewidth of the heating
laser, stabilization of the 110 µm radius of a microdroplet with a precision down to 0.54 nm
was achieved for a period of 410 s. Additionally, we demonstrate controllable tuning of size
of self-stabilized surface-supported liquid aerosols using a tunable IR heating laser which
has a very narrow linewidth.

OZETCE
Optofluidik, optik bilesenleri ve sistemleri olusturmak icin akıskanların essiz ozelliklerini
kullanan yeni bir arastırma alanıdır. Optofluidik cihazlar analitik entegre sistemlerin kimyasal
ve biyolojik ozellikleri incelenebilir. Entegre sistemlerin en buyuk ozelligi karmasık ol-
mamaları ve biyolojik orneklerle uyumlu olmalarıdır. Optik iletisim bilesenleri, organik
boya bazlı lazer ısık kaynakları ya da biyolojik algılama entegre opto-akıskan uygulamaların
orneklerindendir. Kuresel simetrileriye ve yuzey puruzsuzlugune sahip mikrodamlalar optoflu-
idik uygulamaları icin uygundur. Mikrodamlacıkların optofluidik uygulamaları icin pozisy-
onlarının kontrollu bir sekilde sabitlenmesi gerekmektedir. Bu tezde damlacıkların pozisyon-
larının sabitlenmesi icin su tutmayan yuzeyler kullanılmıstır. Tezin ilk kısmında, titrestirilen
superhidrofobik bir yuzey uzerinde bulunan mikrometre olcekli bireysel sıvı damlalarının
mekanik rezonanslarının analizine baglı olarak mikroskopik kontak acılarının olcumu icin
yeni bir metot bulunmustur. Bu amacla, bu calısmada, damlacıgın mekanik rezonanslarının
ve buyukluklerinin eszamanlı olarak belirlenebilmesi icin ısıyan boya iceren damlacıkların
lazer ısınıyla uyarılmasıyla elde edilen fısıldayan galeri kiplerinin (FGM) optik spektroskopisi
kullanılmıstır. Damlacıklar, optik mikrokovuk rolu ustlenmislerdir ve damlacıkların ısıma
spektrumu, spektral genislikleri damlacıgın titresim genliklerine baglı olan fısıldayan galeri
kiplerini karakterize eder. Fısıldayan galeri kipinin genisligini, farklı buyukluklu damlaların
altlık titresim frekanslarının bir fonksiyonu olarak izleyerek, damlacıkların maksimal fısıldayan
galeri kiplerinin genislemesinin oldugu frekanslardaki rezonans frekansları belirlenmistir.
Ardından, damlacık buyuklugu, Lorenz-Mie sacılma teorisi kullanılmasıyla fısıldayan galeri
kiplerin kip-eslestirmesi ile belirlenmistir. Verilen bir damlacık icin, kontak acısı, yuzeyde
duran damlacıgın aksisimektrik salınımları icin gelistirilen teori kullanılarak, damlacık mekanik
rezonans frekansının ve buyuklugunun bagımsız olcumlerinden elde edilmistir. Tezin ikinci
kısmında ise inceltilmis optik fiber kullanılmıstır. Inceltilmis optik fiber ile damlacıkların
FGMlerinin kalite faktorleri olculmustur. Daha sonra ikinci bir lazer kullanarak damlacıkların
hacmi sabitlenmis ve FGMleri kontrol edilebilmistir.
vi

ACKNOWLEDGMENTS
First and foremost, I would like to thank my academic advisor, Prof. Alper Kiraz, for
the guidance and support throughout my research topics. He is a great source of inspiration
and patience. His scientific intuition and comprehension have always been very helpful.
I am also grateful to Prof. Alexandr Jonas. I have greatly profited from the experimental
and computational skills that he have taught me. It was a pleasure to work with him.
I would also like to thank my thesis monitoring committee members Prof. Muradoglu
and Prof. Guven, and my thesis defense committee members Prof. Jonas and Prof. Akturk
for the time they spent during evaluating my progress and thesis. It was my pleasure to
collaborate with them, and they provided me great insights into different areas.
I would like to thank my former and present colleagues Mehdi Aas, Mustafa Eryurek,
Ersan Ozelci, Dr. Mehdi Yavuz Yuce, Dr. Nevin Tasaltin, Dr. Michael Mestre, Dr. Ibrahim
Kucukkara, Dr. Necati Vardar in Nano-Optics Research Laboratory.
I also thank Humbet Nasibli and Ugur Sarac from TUBITAK BILGEM for their support
on my research with invaluable advice.
Additionally, I also want to thank Ersen Beyatlı, Ismail Yorulmaz, Erhan Atcı and Sait
Tunc for their endless encouragement.
vii

TABLE OF CONTENTS
List of Tables xi
List of Figures xii
Nomenclature xviii
Chapter 1: Introduction 1
1.1 Thesis Motivation . . . . . . . . . . . . . . . . . . . . . . . . . . . . . . . . . 1
1.2 Thesis Outline . . . . . . . . . . . . . . . . . . . . . . . . . . . . . . . . . . . 5
Chapter 2: Optical Modes of a Microsphere-Whispering Gallery Modes
(WGMs) 6
Chapter 3: Superhydrophobic Surface Preparation and Modelling of Pho-
tothermal Tuning of the Droplet Size 10
3.1 Superhydrophobic Surface Preparation . . . . . . . . . . . . . . . . . . . . . . 10
3.2 Modelling of Photothermal Tuning of Liquid Microdroplets and Qabs Calcu-
lation . . . . . . . . . . . . . . . . . . . . . . . . . . . . . . . . . . . . . . . . 11
3.2.1 Introduction . . . . . . . . . . . . . . . . . . . . . . . . . . . . . . . . 11
3.2.2 Rate Equation Model for a Water-glycerol Microdroplet Standing on
a Superhydrophobic Surface . . . . . . . . . . . . . . . . . . . . . . . . 11
3.2.3 Rate Equation Model for a NaCl-water Microdroplet Standing on a
Superhydrophobic Surface . . . . . . . . . . . . . . . . . . . . . . . . . 15
3.2.4 Generalized Lorentz-Mie Theory . . . . . . . . . . . . . . . . . . . . . 15
3.2.5 Hysteresis Behavior in the Droplet Size Tuning . . . . . . . . . . . . . 19
Chapter 4: Probing of WGMs by Free Space Light Coupling-Applications
in Surface Analysis 22
viii

4.1 Probing Microscopic Wetting Properties of Superhydrophobic Surfaces by
Vibrated Micrometer-Sized Droplets . . . . . . . . . . . . . . . . . . . . . . . 22
4.1.1 Introduction1 . . . . . . . . . . . . . . . . . . . . . . . . . . . . . . . . 22
4.1.2 Experimental Section . . . . . . . . . . . . . . . . . . . . . . . . . . . 25
4.1.3 Results and Discussion . . . . . . . . . . . . . . . . . . . . . . . . . . . 26
4.1.4 Conclusions . . . . . . . . . . . . . . . . . . . . . . . . . . . . . . . . . 32
4.2 Determination of Microdroplet Contact Angles Using Electrically Driven
Droplet Oscillations2 . . . . . . . . . . . . . . . . . . . . . . . . . . . . . . . . 33
4.3 Measuring the Mechanical Resonances of Microdroplets Using a Quadrant
Photodiode(QPD) . . . . . . . . . . . . . . . . . . . . . . . . . . . . . . . . . 39
Chapter 5: Tapered Optical Fiber Fabrication and Custom Microscope
Setups 42
5.1 Introduction . . . . . . . . . . . . . . . . . . . . . . . . . . . . . . . . . . . . . 42
5.2 Fabrication of Tapered Optical Fibers . . . . . . . . . . . . . . . . . . . . . . 43
5.3 Design and Implementation of Custom Inverted Microscope for Optical Spec-
troscopy of Surface-supported Microdroplets Based on the Use of Tapered
Optical Fibers . . . . . . . . . . . . . . . . . . . . . . . . . . . . . . . . . . . . 47
5.4 Whispering Gallery Mode of a Bare Optical Fiber . . . . . . . . . . . . . . . 48
Chapter 6: Probing of Ultrahigh Optical Q-factors of Individual Liquid
Microdroplets in Air Using Tapered Optical Fiber Waveg-
uides 50
6.1 Introduction3 . . . . . . . . . . . . . . . . . . . . . . . . . . . . . . . . . . . . 50
6.2 Experimental Setups and Procedures . . . . . . . . . . . . . . . . . . . . . . . 52
6.3 Results . . . . . . . . . . . . . . . . . . . . . . . . . . . . . . . . . . . . . . . . 53
1This work has been published in ”Probing Microscopic Wetting Properties of Superhydrophobic Surfacesby Vibrated Micrometer-Sized Droplets”, Langmuir 27 (6), 2150-2154 (2011)
2This work has been published in ”Determination of Microdroplet Contact Angles Using ElectricallyDriven Droplet Oscillations”,Appl. Phys. Lett. 98, 194101 (2011)
3This work has been published in ”Probing of ultrahigh optical Q-factors of individual liquid microdropletsin air using tapered optical fiber waveguides”, J. Opt. Soc. Am. B 29 (12), 3240-3247 (2012)
ix

6.3.1 Stability of Droplet Shape and Size . . . . . . . . . . . . . . . . . . . . 53
6.3.2 Lifting of Azimuthal Mode Degeneracy . . . . . . . . . . . . . . . . . . 58
6.3.3 Q-Factor Measurements . . . . . . . . . . . . . . . . . . . . . . . . . . 60
6.4 Experimental Limits on Measured Q-factors . . . . . . . . . . . . . . . . . . . 62
6.4.1 Contributions to Overall Q-Factor of a Resonant Cavity . . . . . . . . 62
6.4.2 Fluctuation of Mode Position Due to Thermally-Induced Droplet Shape
Fluctuations . . . . . . . . . . . . . . . . . . . . . . . . . . . . . . . . 63
6.5 Conclusion . . . . . . . . . . . . . . . . . . . . . . . . . . . . . . . . . . . . . 64
Chapter 7: Size Stabilization of Surface-supported Liquid Aerosols Using
Tapered Optical Fiber Coupling 66
7.1 Introduction4 . . . . . . . . . . . . . . . . . . . . . . . . . . . . . . . . . . . . 66
7.2 Theory of Size-stabilization . . . . . . . . . . . . . . . . . . . . . . . . . . . . 67
7.3 Experimental Setup . . . . . . . . . . . . . . . . . . . . . . . . . . . . . . . . 68
7.4 Results . . . . . . . . . . . . . . . . . . . . . . . . . . . . . . . . . . . . . . . . 69
7.5 Conclusion . . . . . . . . . . . . . . . . . . . . . . . . . . . . . . . . . . . . . 73
Chapter 8: Controlling WGMs of Surface-supported Liquid Aerosols 74
8.1 Introduction . . . . . . . . . . . . . . . . . . . . . . . . . . . . . . . . . . . . . 74
8.2 Experimental Setup . . . . . . . . . . . . . . . . . . . . . . . . . . . . . . . . 74
8.3 Results . . . . . . . . . . . . . . . . . . . . . . . . . . . . . . . . . . . . . . . . 76
8.4 Conclusion . . . . . . . . . . . . . . . . . . . . . . . . . . . . . . . . . . . . . 79
Chapter 9: Conclusion 80
Bibliography 82
VITA 95
4This work has been published in ”Size-stabilization of surface-supported liquid aerosols using taperedoptical fiber coupling”, Opt. Lett. 38 (5), 793-795 (2013)
x

LIST OF TABLES
3.1 Constants . . . . . . . . . . . . . . . . . . . . . . . . . . . . . . . . . . . . . . 13
xi

LIST OF FIGURES
1.1 Top view of water microdroplets standing on a superhydrophobic surface . . . 1
1.2 Illustration of the experimental setup that is used in characterizing ultrahigh
quality WGMs and studying opto-mechanical coupling. . . . . . . . . . . . . . 4
2.1 The ray at glancing angle is fully reflected. When the optical path is equal
to the number of wavelengths, a resonance is formed. . . . . . . . . . . . . . . 7
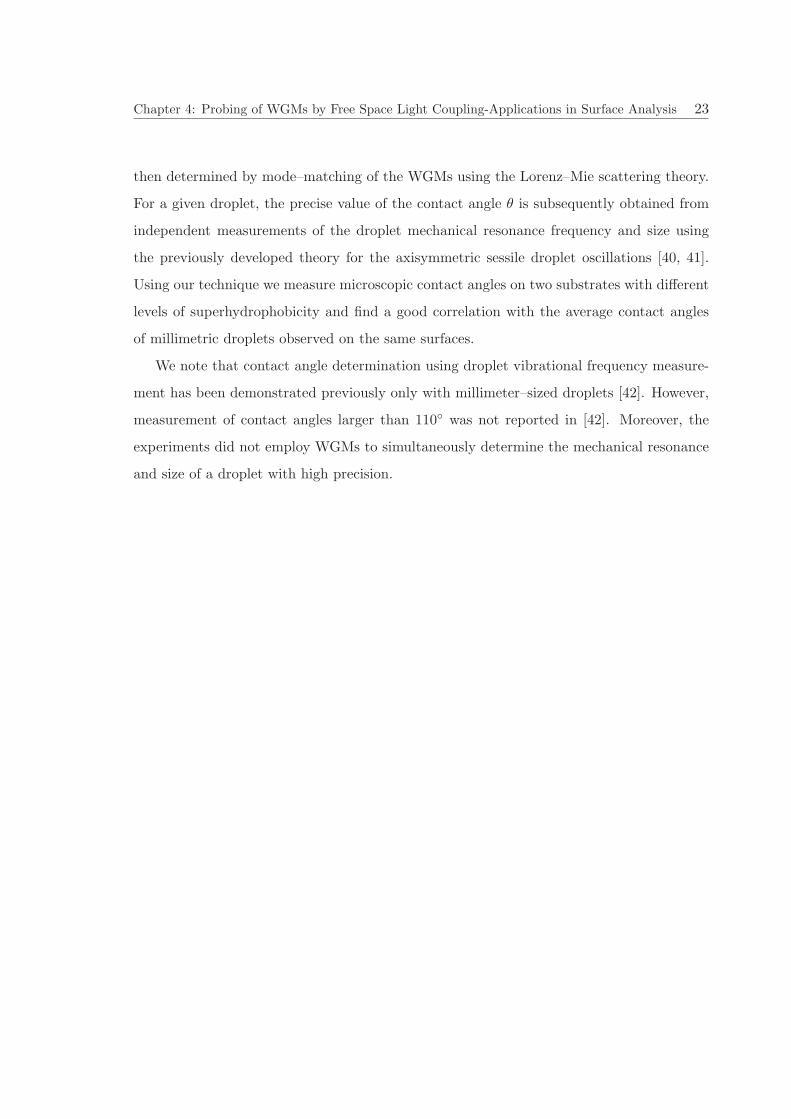
3.1 Wetting states of textured surfaces.(a)Wenzel state, (b)Cassie-Baxter state . 11
3.2 Steady state analysis assuming that glycerol is ideally nonvolatile. (a) Steady
mole fraction of water as a function of relative humidity of water for various
values of microdroplet temperature (Td) assuming the temperature of the
chamber (T∞) to be 299.55 K. Vertical lines indicate the relative humidities
of water used in the experiments. (b) The spectral drift in the WGMs located
at around 590 nm as a function of Td − T∞. . . . . . . . . . . . . . . . . . . . 14
3.3 The modified absorption efficiency (Qabs) as a function of the size parameter
(α). Calculations are made for a sphere suspended in air by using the local-
ized approximation to the beam-shape coefficients in generalized Lorenz-Mie
theory. The laser propagating in z and polarized in x directions is focused
near the vicinity of the rim of the sphere at y=7.5 µm. . . . . . . . . . . . . . 19
xii

3.4 (a) The modified absorption efficiency (Qabs) as a function of the size param-
eter (α). Calculations are made for a sphere suspended in air by using the
localized approximation to the beam-shape coefficients in generalized Lorenz-
Mie theory. The laser propagating in z and polarized in x directions is focused
near the vicinity of the rim of the sphere at y=5.5 µm, exciting first order TE
modes. (b) The computational hysteresis curve as function of the incident
laser power. The dashed line shows the peak position of the TE134 WGM
absorption. Inset shows the sketch of the self-stabilization mechanism. . . . . 20
4.1 Experimental setup used for the microdroplet contact angle measurement.
(a) Illustration of the controlled humidity sample chamber. [left] The fre-
quency response of the mounted substrate to the harmonic PZT driving is
characterized using an auxiliary collimated laser beam and a quadrant photo-
diode (QPD). [right] Actual detection of the microdroplet resonant frequency
is carried out using inverted microscope configuration featuring a spectro-
graph. (b) Laser beam deflection from the substrate as a function of the
driving frequency f . The beam deflection is directly proportional to the
substrate vibration amplitude. . . . . . . . . . . . . . . . . . . . . . . . . . . 24
4.2 Response of surface–supported microdroplets to the harmonic oscillatory
driving. (left) Fluorescence spectra of an oscillating droplet with spherical ra-
dius R = 5.0 µm at three different driving frequencies f . The WGM centered
at 602.3 nm is characterized by its full width at half maximum (FWHM).
(right) FWHM as a function of f . The crosses indicate experimental data
points, the continuous line is the Gaussian fit that gives the droplet resonant
frequency f expres = 141.1 kHz. . . . . . . . . . . . . . . . . . . . . . . . . . . . . 26
xiii

4.3 Dependence of the lowest–mode resonant frequency fres on the droplet size.
The circles and triangles indicate experimental data points obtained for droplets
supported by the LE1/ethanol and LE1/chloroform surfaces, respectively.
The lines show the resonant frequency values calculated from Eq. 4.1 for
the contact angles of 177◦ (lower frequency limit), 160◦ (frequency mid-
range), and 139◦ (upper frequency limit). Other calculation parameters
for the NaCl-water microdroplet: surface tension γ = 74.62 mN/m, density
ρ = 1144.7 kg/m3, and refractive index n = 1.3677. . . . . . . . . . . . . . . . 28
4.4 Contact angle measurements on superhydrophobic (SH) surfaces. Direct
imaging of an NaCl-water droplet on (a) LE1/ethanol-coated and (b) LE1/chloroform-
coated SH surfaces. (c) Histogram of the microscopic contact angles θ for the
LE1/ethanol–coated (70 measurements, θETH = 166.7◦) and LE1/chloroform–
coated (68 measurements, θCHL = 153.8◦) SH surfaces. The contact angles
are calculated from the data presented in Fig.4.3 using Eq. 4.1. . . . . . . . . 29
4.5 SEM images of the studied superhydrophobic surfaces. (a) LE1/ethanol–
coated SH surface (b) LE1/chloroform–coated SH surface. Image insets show
surface details obtained at higher magnification. . . . . . . . . . . . . . . . . 31
4.6 Experimental setup for contact angle measurements using vibrated micro-
droplets. Droplets are sequentially driven by a horizontal AC electric field
and a PZT. . . . . . . . . . . . . . . . . . . . . . . . . . . . . . . . . . . . . . 35
4.7 (a) Fluorescence spectra of a droplet with a spherical radius R = 5.4 µm
excited by a horizontal AC electric field at three different frequencies f . (b)
FWHM of the WGM in (a) as a function of f for horizontal electric field (top
plot) and PZT (bottom plot) driving for the same droplet. Crosses indicate
experimental data points, continuous lines are the Gaussian fits that reveal
droplet resonant frequencies f expres,EF = 119.3 kHz and f expres,PZT = 119.5 kHz,
respectively. . . . . . . . . . . . . . . . . . . . . . . . . . . . . . . . . . . . . . 37
xiv

4.8 (a) Dependence of the measured mechanical resonant frequencies fres on the
droplet spherical radius R. Circles and triangles indicate data points obtained
with horizontal electric field and vertical PZT driving, respectively. Lines
show the values of fres calculated using the Strani-Sabetta theory for contact
angles of 178◦ (lower frequency limit) and 152◦ (upper frequency limit). Other
calculation parameters for the NaCl-water microdroplets: surface tension
γ = 80.1 mN/m, density ρ = 1144.7 kg/m3, and refractive index n = 1.3677.
(b) Contact angles calculated for the resonant frequencies in (a) using the
Strani-Sabetta theory. . . . . . . . . . . . . . . . . . . . . . . . . . . . . . . . 38
4.9 Experimental setup for the measuring the mechanical resonance of micro-
droplet with the use of a quadrant photodiode (QPD). . . . . . . . . . . . . . 40
4.10 Frequency response of a microdroplet at different amplitudes of the sinusoidal
excitation voltage. . . . . . . . . . . . . . . . . . . . . . . . . . . . . . . . . . 41
5.1 Schematic view of WGM resonator coupled to its contact line . . . . . . . . . 42
5.2 Experimental setup for manufacturing tapered optical fibers. . . . . . . . . . 44
5.3 Characterization of produced fiber tapers by direct optical imaging of the
fiber during the fiber pulling (A) - (C) and by SEM imaging of final tapered
fibers (D),(E),(F). . . . . . . . . . . . . . . . . . . . . . . . . . . . . . . . . . 45
5.4 Transmission of the tapered fiber recorded during the taper pulling. . . . . . 46
5.5 (a) 3-D positioning system for adjusting the relative position of the taper
and a selected droplet with sub-micron precision. (b) Detail of a tapered
optical fiber positioned in the vicinity of a surface-supported microdroplet of
water/glycerol mixture. . . . . . . . . . . . . . . . . . . . . . . . . . . . . . . 47
5.6 Measurements of the droplet size stability in the humidity sample chamber
reveal typical shift of the WGM position on the order of 3 nm/hour. This
corresponds to the relative change of the droplet size smaller than 5e-3/hour. 48
5.7 A sketch for the cylindrical solid microresonator excited by a tapered optical
fiber. . . . . . . . . . . . . . . . . . . . . . . . . . . . . . . . . . . . . . . . . . 48
xv

5.8 Experimentally measured WGM spectrum for a 125 µm diameter bare fiber.
The free spectral range is 0.72 nm. . . . . . . . . . . . . . . . . . . . . . . . . 49
6.1 (a) Experimental setup for ultrahigh-Q spectroscopy of surface-supported
liquid microdroplets. PD1 (PD2) – photodetectors monitoring the light power
at the input (output) of the tapered fiber. (b) Image of a surface-supported
glycerol-water microdroplet with a tapered fiber positioned in its equatorial
plane (view along the z-axis). . . . . . . . . . . . . . . . . . . . . . . . . . . . 54
6.2 Images of a glycerol-water microdroplet standing on a superhydrophobic sur-
face (side view along the surface plane). Images were acquired at different
times t elapsed since the droplet generation. . . . . . . . . . . . . . . . . . . . 55
6.3 Low-resolution transmission spectrum of a tapered fiber waveguide coupled
to a glycerol-water droplet in air as a function of the pump laser wavelength.
Spectrum acquisition time was ∼100 s. FSR indicates the free spectral range
of the microdroplet cavity (FSR = 0.414 nm). . . . . . . . . . . . . . . . . . . 56
6.4 High-resolution transmission spectrum of a tapered fiber waveguide coupled
to a glycerol-water droplet in air as a function of the pump laser wavelength
and time. (a) Time series of transmission scans over the whole fine-tuning
range of the laser (spectral interval width ∼ 125 pm). (b) Time series of
transmission scans over the tuning range occupied by a group of WGMs
shown in the left part of spectral map (a) (spectral interval width ∼ 54 pm).
(c) Spectral profile of the tapered fiber transmission along the dashed white
line shown in spectral map (b). Black cross denotes a representative WGM
used for the Q-factor analysis (see graph inset and text). Average droplet
radius was 130µm and rate of the droplet radius change was−0.17 nm/s. . . 57
6.5 Time evolution of the Q-factor of degeneracy-lifted azimuthal WGMs of a
surface-supported microdroplet. Time t = 0 s corresponds to the droplet
deposition on the surface. Crosses represent experimental data, line is the
linear fit of this data. Average droplet radius was 150µm. . . . . . . . . . . . 61
xvi

7.1 Experimental setup for size-stabilization of surface-supported liquid micro-
droplets. PD1 (PD2) – photodetectors monitoring the light power at the
input (output) of the tapered fiber. . . . . . . . . . . . . . . . . . . . . . . . . 68
7.2 (a) 2-D plot of consecutive WGM spectra of a droplet stabilized by IR laser
heating. At time t = 410 s, the heating laser was blocked during 10 spectral
acquisitions and then unblocked again, resulting in a change of the stabilized
droplet size. (b) Details of the droplet WGM spectra along the dash-dotted
and dashed lines shown in (a). Droplet size was 245µm . . . . . . . . . . . . 69
7.3 (a) Low-Q WGM spectrum of a size-locked microdroplet. (b) Time trace of
the taper transmission at a fixed wavelength of the probe laser denoted by
arrow in (a). Gray vertical stripes indicate time intervals during which the
heating laser was blocked. . . . . . . . . . . . . . . . . . . . . . . . . . . . . . 71
7.4 (a) High-Q WGM spectrum of a size-locked microdroplet. (b) Time trace of
the taper transmission at a fixed wavelength of the probe laser denoted by
arrow in (a). Gray vertical stripes indicate time intervals during which the
heating laser was blocked. (c) Detail of the time trace shown in (b). . . . . . 72
8.1 Experimental setup for self-stabilization of surface supported liquid micro-
droplets. PD1 (PD2) - photodetectors monitoring the light power at the
input (output) of the tapered fiber, NDF -neutral density filter. . . . . . . . . 75
8.2 (a) WGM spectrum of a stabilized droplet recorded at a fixed wavelength
of the heating laser. (b) 2D consecutive WGM spectra of the same droplet
recorded for increasing (frames 1 to 50) and decreasing (frames 51 to 95)
wavelength of the heating laser. . . . . . . . . . . . . . . . . . . . . . . . . . 77
8.3 Tapered fiber transmission spectra from a self-stabilized droplet during for-
ward and backward tuning of the heating laser wavelength λH . Probe laser
wavelength was fixed at λprobe = 638 nm. . . . . . . . . . . . . . . . . . . . . 78
xvii

NOMENCLATURE
a microdroplet radius
xA mole fraction of water
xB = (1− xA) mole fraction of glycerol
VA molar volume of water
Vm = xAVA + xBVB molar volume of the microdroplet
R gas constant
∆Hvap,A latent heat of vaporization of water
∆Hvap,B latent heat of vaporization of glycerol
CPA molar heat capacity of water
CPL = xACPA + xBCPB molar heat capacity of the microdroplet
DA gas phase diffusion coefficient of water in air
ka thermal conductivity of air
ks thermal conductivity of the substrate
T∞ temperature of air in the chamber
P 0A(T ) vapor pressure of water at temperature T
P 0B(T ) vapor pressure of glycerol at temperature T
SA saturation ratio of water in air
NA number of moles of water in the microdroplet
N = xANA + xBNB total number of moles in the microdroplet
nA refractive index of water at 1064 nm
Qabs modified absorbtion efficiency
γ surface tension
Sin input signal
Sout output signal
τo intrinsic photon lifetime
∆λ free spectral range
xviii

Chapter 1: Introduction 1
Chapter 1
INTRODUCTION
1.1 Thesis Motivation
Optofluidics is a thrilling new research field that exploits unique properties of fluids for
creating optical components and systems [1]. As fluids provide a great flexibility in shape
and refractive index and enable generation of optically smooth interfaces, they can be used
for designing novel optical devices that cannot be realized with classical solid materials.
In addition to inspiring novel all-optical applications, optofluidic devices combined with
accurate control of liquids on small spatial scale via microfluidic technologies pave way for
improved chemical and biological functionality in lab-on-a-chip analytical and preparative
systems. Main advantages of such integrated systems are their compactness and direct
compatibility with biological specimens. Examples of applications of integrated optofluidics
include optical communication components, organic dye-based laser light sources [2], or
biological sensing.
Figure 1.1: Top view of water microdroplets standing on a superhydrophobic surface

Chapter 1: Introduction 2
Microdroplets, with their spherical geometry and exceptionally smooth surfaces (see
Fig. 1.1), are ideally suited for applications in optofluidics. It is well known that spherical
dielectric microobjects can act as optical resonators hosting so-called whispering gallery
modes (WGMs) - optical resonances that possess very high quality factors while being con-
fined to relatively small volumes near the microobject’s rim. Consequently, very high optical
field density can be achieved in microdroplets that can mediate strong couplings between
light and quantum systems (atoms, molecules, or quantum dots). Such strong couplings
have already found many applications in quantum and nonlinear optics [3]. Fundamental
studies in cavity quantum electrodynamics have led to the demonstration of manipulation of
the spontaneous emission rate of dye molecules. Dye lasing, stimulated Raman scattering,
and Raman lasing in microdroplets have also been demonstrated at low pump threshold
powers. Apart from their significance for the fundamental physics research, microdroplets
are well suited to another important line of applications that benefit from the sensitivity
of the WGMs to the microdroplet size as well as the refractive indices of the inner liquid
and the outer medium. These properties naturally make microdroplets very attractive in
biological and chemical sensing, and in developing optical devices that necessitate a tunable
optical microcavity, e.g. tunable optical switches or light sources [4]. In order to utilize
microdroplets in optofluidic applications, one must be able to stabilize their position in a
controlled way. Efforts to stabilize the position of liquid droplets date back to Millikan’s
famous oil drop experiment where droplets charged with only a few electrons were electri-
cally levitated. For almost thirty years electrodynamic levitation [5], optical levitation [6],
and optical tweezing [7] have been employed to study individual microdroplets over ex-
tended periods of time in optical spectroscopy experiments. Despite allowing many seminal
demonstrations in quantum and nonlinear optics, chemical physics, aerosol science, and
biophysics, these techniques suffered from fragility and did not allow integration with other
optoelectronic components such as fiber optic cables, waveguides, or electrical contacts.
Carefully optimized solid support substrates provide the way for incorporating intriguing
optical properties of microdroplets into optofluidic devices. Microdroplets of water and
other hydrophilic liquids take almost spherical shapes when standing on a superhydropho-
bic surface (see Fig. 1.1). Because of their small size (typical range of diameters between 10
and 100 microns) the shape of the droplets is dominated by surface tension with a negligible

Chapter 1: Introduction 3
influence of gravity-induced shape distortion. With their truncated-sphere geometry, these
surface-supported microdroplets can host high-quality WGMs. For a well-leveled support
substrate, the droplet’s position is stable and its optical properties can be readily analyzed.
In addition to preserving the sphericity of the microdroplets and increasing the robustness
of the experimental configuration, the presence of a superhydrophobic surface also facili-
tates the integration of the liquid microdroplets within novel lab-on-a-chip optoelectronic
devices.
The experimental setup that is used for the characterization of ultrahigh Q optical cavity
whispering gallery modes (WGMs) is shown in Fig. 1.2. A tapered optical fiber is brought
to the vicinity of a microdroplet standing on a superhydrophobic surface kept in a humidity
chamber. Subsequently, the light launched into the fiber can be coupled into the studied
microdroplet, thus exciting WGMs. This experimental configuration is frequently adopted
in characterizing solid microsphere and microtoroid microcavities as well as photonic crystal
defect nanocavities [8].
Q-factor measurements are based on coupling a tunable narrow-linewidth laser to a ta-
pered optical fiber positioned in the vicinity of the microdroplet and monitoring fiber trans-
mission as a function of the laser frequency. At light frequencies resonant with individual
WGMs, optical coupling between the fiber and the microdroplet increases dramatically,
resulting in decreased transmission. The transmission curve recorded as a function of the
laser frequency features dips of finite spectral width localized at resonant frequencies; it
is this spectral width together with the central frequency of the dip that reveal directly
the ultrahigh optical Q-factors of the WGMs. The maximal Q-factor measurable with this
technique is inversely proportional to the bandwidth of the laser. For our case, the central
wavelength of the tunable external cavity diode laser used in the experiments (New Focus
Velocity 6304) will be 635 nm and its typical linewidth 300 kHz. Hence, the maximum
Q-factor that can be measured is found to be ≈ 108. This upper limit is sufficient for our
studies because even for very large microdroplets, the Q-factors are expected to be limited
to ≈ 108 due to the residual absorption of the droplet liquid at the central wavelength
used [9] (water absorption coefficient at 635 nm is ≈ 10−3cm−1. The experimental config-
uration shown in Fig. 1.2 allowed the characterization of the microdroplets with relatively
large diameters (>10 µm). We studied the influence of the droplet size, shape (adjustable

Chapter 1: Introduction 4
Figure 1.2: Illustration of the experimental setup that is used in characterizing ultrahighquality WGMs and studying opto-mechanical coupling.
using the electric field), and refractive index on the attainable optical Q-factors. Compo-
sition of the droplets was adjusted by mixing suitable fluids (e.g. water and glycerol). It
was expected to influence simultaneously both the optical and mechanical properties of the
microdroplets through the variations of the liquid refractive index, viscosity, surface ten-
sion, and mass density. Preparation of tapered optical fibers and achievement of optimal
coupling conditions between tapered fibers and microdroplets were the essential steps of
the experiments. In order to obtain efficient coupling of light from the fiber into the mi-
crodroplet, the diameter of the tapered part of the fiber was appropriately chosen to fulfill
phase-matching conditions of the fiber and droplet optical modes [10]. We adopted the
standard flame technique that relies on heating of a small portion of the target fiber with a
gas flame while pulling simultaneously on both fiber ends [8]. In order to achieve the desired
properties of the taper (length, diameter), the position of the flame relative to the fiber and

Chapter 1: Introduction 5
the pulling speed had to be precisely controlled. During taper fabrication procedure, the
fiber properties was monitored by recording the fiber transmission at the central wavelength
used for optical Q-factor measurements.
1.2 Thesis Outline
In Chapter 2, optical modes and the quality factor (Q) of a microsphere based optical
resonator are discussed.
Chapter 3 explains the superhydrophobic surface preparation and the lumped equa-
tion model for the evaporation and growth of water-glycerol and NaCl-water microdroplets
standing on a superhydrophobic surface due to local heating by a focused infrared laser.
In Chapter 4, we report a contact angles measurement technique of micrometer-sized
NaCl-water droplets on superhydrophobic surfaces by analyzing their lowest-order axisym-
metric vibrational resonances driven by vertical oscillations of the surface
In Chapter 5, we describe the experimental infrastructure for fiber-tapering and high-Q
factor measurement.
In Chapter 6, we demonstrate measurements of ultrahigh quality factors (Q-factors) of
the optical whispering-gallery modes excited via a tapered optical-fiber waveguide in single
glycerol/water microdroplets standing on a superhydrophobic surface in air.
In Chapter 7, we demonstrate long-term size stabilization of surface-supported liquid
aerosols of salt-water resulting from competition between resonant absorption of the infrared
heating laser by a microdroplet whispering gallery mode and water condensation in the
sample chamber.
In Chapter 8, we follow up on the previous stabilization experiments and demonstrate
controllable tuning of WGMs of self-stabilized surface-supported liquid aerosol using a tun-
able IR heating laser which has a very narrow linewidth.

Chapter 2: Optical Modes of a Microsphere-Whispering Gallery Modes (WGMs) 6
Chapter 2
OPTICAL MODES OF A MICROSPHERE-WHISPERING GALLERY
MODES (WGMS)
Resonance modes of real resonators with finite losses characterized by finite values of
Q-factor are usually referred to as morphology-dependent resonances (MDRs), whispering-
gallery modes (WGMs) and quasi-normal modes (QNMs). Optical properties of micro-
spheres are related with the electromagnetic resonant modes of the cavity. Suitable bound-
ary conditions are satisfied by some resonance frequencies. At these frequencies the electric
field is confined notably in the cavity. The difference between the modes of Fabry-Perot
cavities and the modes of microspheres is the number of dimensions of confinement. The
mode confinement direction of microspheres and Fabry-Perot cavities is three and one, re-
spectively [11].
Total internal reflection (TIR) occurs if the angle of incidence (θinc) of the light with
wavelength λ propagating within a sphere of radius a and index of refraction m(ω) is equal
to or greater than the critical angle (θc).
θinc ≥ θc = arcsin(1/m(ω)), (2.1)
The resonance condition for a sphere with circumference 2πa >> λ and light propagating
with θinc ∼ 90o is that the circumference of the sphere is nearly equal to the optical path
length as demonstrated in Fig. 2.1. The allowed limits of n wavelengths in the dielectric is
given by
2πa
λ≤ n ≤ 2πa
λ/m(ω). (2.2)
Using the size parameter which is dimensionless
x =2πa
λ, (2.3)
the resonance condition is

Chapter 2: Optical Modes of a Microsphere-Whispering Gallery Modes (WGMs) 7
θinc
Figure 2.1: The ray at glancing angle is fully reflected. When the optical path is equal tothe number of wavelengths, a resonance is formed.
x ≤ n ≤ m(ω)x. (2.4)
An internal ray completes one roundtrip that corresponds to the phase-matching con-
dition for the n = m(ω)x mode and the external wave. If the rays are not confined to the
x − y plane(e.g., the equtorial plane), the normal to the orbit is inclined at angle θ with
respect to the z-axis and z-component of the angular momentum of the mode is
m = ncos(θ). (2.5)
All of the m modes are degenerate (with 2n+ 1 degeneracy) for a perfect sphere. If the
sphericity of the cavity is perturbed, the degeneracy is lifted. When there is a distortion like
this, the integer values form are±n,±(n-1)...0, where± degeneracy rests since the resonance
modes are independent of the circulation direction (clockwise or counterclockwise).
The electric field can be expressed in terms of TE modes and TM modes. For TE
modes, there is no radial component of the electric field and for TM modes, there is no
radial component of the magnetic field. The expressions for TE and TM modes are defined
by
ETE = zn(m(ω)kr)Xnm(θ, φ), (2.6)

Chapter 2: Optical Modes of a Microsphere-Whispering Gallery Modes (WGMs) 8
ETM = ∇× {zn(m(ω)kr)Xnm(θ, φ)} (2.7)
where the wave vector in free space is k = ω/c. The zn(m(ω)kr) is the spherical Bessel
function for incident fields and internal fields that characterize the radial dependence of the
fields, zn(m(ω)kr) is the spherical Hankel function for external fields. m(ω) is the refractive
index of the surrounding medium for incident fields, the refractive index of the sphere for the
internal fields. Xnm(θ, φ) is the vector spherical harmonics that characterizes the angular
distribution of the electric fields and described by
Xnm(θ, φ) =−i
√
n(n+ 1)r ×∇Ynm(θ, φ), (2.8)
where Ynm(θ, φ) are the spherical harmonics. By matching the tangential components
of E and H at the boundary, the characteristic equation is obtained. The characteristic
equation of a sphere of radius a and index of refraction m(ω) = mr(ω) + imi(ω) in air for
TM resonances defined by
ψ′
n(m(ω)x)
ψn(m(ω)x)−m(ω)
ζ′
n(x)
ζn(x)= 0. (2.9)
The characteristic equation for TE resonances is
m(ω)ψ
′
n(m(ω)x)
ψn(m(ω)x)− ζ
′
n(x)
ζn(x)= 0, (2.10)
where x = ka = 2πa/λ is the size parameter, ψn is the Ricatti-Bessel function, ζn is the
Ricatti-Henkel function. If there is no absorption loss (mi(ω)=0), the solutions to Eq.(2.9)
and Eq.(2.10) are the complex resonance size parameters xα. The resonant frequencies for a
fixed radius sphere are designated by the real part of the size parameters. The leakage loss
of the mode out of the absorptionless dielectric cavity is related with the imaginary part of
the size parameter.
There are several independent equations represented by Eq.(2.9) and Eq.(2.10) for each
mode number n. The solutions of these transcendental equations correspond to the res-
onances, or MDRs. Also, the radial mode number l is obtained from these solutions for
each n. For a fixed n and m(ω), the first and second solutions are labeled l=1 and l=2,

Chapter 2: Optical Modes of a Microsphere-Whispering Gallery Modes (WGMs) 9
respectively. The physical interpretation is that the number of intensity maxima of the
mode along r = a/m(ω) to r = a is l.
The resonance size parameters xα of a perfect sphere are independent of m. The reso-
nance modes are generally represented by their polarization TMn,l and TEn,l. The relation
between the real part of xα and the resonance frequency is
ωα = cRe(xα)/a. (2.11)
The full width at half maximum(FWHM) of the MDR is twice the imaginary part of xα.
The FWHM of the mode is denoted ∆xα or ∆ωα. The quality factor (Q) of the resonance
is represented as
Q =Re(xα)
2Im(xα)=
ωα
∇ωα= ωατ, (2.12)
where τ is the wave lifetime on the resonance. Diffractive leakage losses limit the Q
values. The maximum Q can be as high as 10100 for a perfect lossless sphere. There are
some factors like volume inhomogeneities, surface roughness, shape deformations, nonlinear
effects and absorption that limits the maximum Q values to be less than 1010 [3]. In chapter
6, we deal with measurement of the quality factor, Q of surface-supported microdroplets.

Chapter 3: Superhydrophobic Surface Preparation and Modelling of Photothermal Tuning of theDroplet Size 10
Chapter 3
SUPERHYDROPHOBIC SURFACE PREPARATION AND
MODELLING OF PHOTOTHERMAL TUNING OF THE DROPLET
SIZE
3.1 Superhydrophobic Surface Preparation
Superhydrophobic surfaces are extremely water-repellent surfaces. The contact angles of
a water droplet exceeds 150◦ on these surfaces. Superhydrophobic surfaces were prepared
by spin coating 50 mg/ml ethanol dispersion of hydrophobically-coated silica nanoparticles
(Evonik, Aeroxide LE1) on cover glasses [4, 12]. The average size of hydrophobic silica
nanoparticles was between 7 nm and 20 nm. The superhydrophobic surfaces were trans-
parent to visible light. After spin-coating, the superhydrophobically coated-cover glasses
were dried in an oven at 85oC, for one hour, for evaporation of the remaining ethanol af-
ter spin-coating. The measured average contact angle of millimeter-sized salt-water and
glycerol/water droplets was larger than 155◦ on these surfaces. The average contact angle
of micrometer-sized microdroplets is expected to be 1− 2◦ smaller than that of millimeter
sized droplets owing to Gibbs contact line tension [4, 13, 11].
If a droplet is placed on a textured surface with roughness, the roughness structures
on the surface can be filled by the droplet liquid as shown in Fig.3.1a. This wetting state
is called Wenzel state. Due to surface tension of the droplet liquid, penetration of liquid
into surface pores can be prohibited as shown in Fig.3.1b. This wetting state is called as
Cassie-Baxter state. Hydrophobic surfaces that have the Cassie-Baxter and Wenzel state
are called slippy or sticky surfaces, respectively [14].
Chapter 3: Superhydrophobic Surface Preparation and Modelling of Photothermal Tuning of theDroplet Size 11
(a)
(b)
Figure 3.1: Wetting states of textured surfaces.(a)Wenzel state, (b)Cassie-Baxter state
3.2 Modelling of Photothermal Tuning of Liquid Microdroplets and Qabs Cal-
culation
3.2.1 Introduction
We defined a lumped equation model for the evaporation and growth of water-glycerol and
NaCl-water microdroplets standing on a superhydrophobic surface due to local heating by a
focused infrared laser. The generalized Lorenz-Mie theory [15, 16, 17] was used to calculate
the absorption of the focused laser beam by the microdroplet.
3.2.2 Rate Equation Model for a Water-glycerol Microdroplet Standing on a Superhy-
drophobic Surface
The mass and heat transfer between the microdroplet and the chamber is simulated by
using a lumped system model according to Ray et al. [18, 19]. This model is based on the
uniform temperature and composition distributions within the microdroplet for all times.
This assumption holds if the heat and mass transfer within the microdroplet is much faster
than the heat and mass transfer across a microdroplet interface. In addition, we assume
that heat and mass transfer occur solely due to molecular diffusion in a quasi-stationary

Chapter 3: Superhydrophobic Surface Preparation and Modelling of Photothermal Tuning of theDroplet Size 12
state. Using these assumptions, the number of moles of component A (water) NA and B
(glycerol) NB in the microdroplet of radius a is given by
dNA
dt= −4πafPBDA
P 0A (T∞)
RT∞(γAxAφA − SA) , (3.1)
dNB
dt= −4πafPBDB
P 0B (T∞)
RT∞(γBxBφB − SB) , (3.2)
where
φA =
(
T∞Td
)
P 0A (Td)
P 0A (T∞)
; φB =
(
T∞Td
)
P 0B (Td)
P 0B (T∞)
. (3.3)
In Eqs.(3.1-3.3), the subscripts A and B denote properties of the components A and
B, respectively, DA,B is the molecular diffusivity in the gas mixture, γA,B is the activity
coefficient, xA,B is the mole fraction, SA,B is the relative humidity in the chamber, R is
the universal gas constant, P 0A,B(T ) is the vapor pressure at temperature T , and Td and
T∞ are the temperatures at the microdroplet interface and in the chamber far from the
microdroplet, respectively. The effects of the substrate on the mass transfer is included to
the equations and defined as the correction factor fPB defined by Picknett and Bexon [20, 21]
equation:
fPB(θ) =1
2
0.6366θ + 0.09591θ2 − 0.06144θ3 0o ≤ θ < 10o
0.000008957 + 0.6333θ + 0.116θ2 − 0.08878θ3 + 0.01033θ4 10o ≤ θ < 180o,(3.4)
where θ is the contact angle. The contact angle for millimeter-size droplets standing on a
superhydrophobic surface is obtained experimentally about 160o. It is not very different for
micrometer-size droplets standing on a superhydrophobic surface. The temperature change
of the microdroplet with time can be written as:
dTddt
=∆Hvap,A
NCPL
dNA
dt+
∆Hvap,B
NCPL
dNB
dt− 3keffVm
a2CPL(Td − T∞) +
QabsPinc
NCPL, (3.5)
where Vm is the molar specific volume, N is the total number of moles, CPL is the molar
heat capacity of the glycerol-water microdroplet, ∆Hvap,A,B is the enthalpy of evaporation
and keff is the effective heat conductivity. We defined keff as the area average of heat
conductivities of air(ka) and substrate (ks). keff can be written as:
keff = fakaAa + (1− fa)ks, (3.6)

Chapter 3: Superhydrophobic Surface Preparation and Modelling of Photothermal Tuning of theDroplet Size 13
where fa can be defined as:
fa = Aa/Ad. (3.7)
In Eqn. (3.7) Aa is the surface area of the microdroplet that is in contact with the air
and Ad is the total surface area of the microdroplet. Qabs in Eq. (3.5) defines the ratio of the
total power absorbed by the microdroplet to the total power of the incident beam (Pinc).
Calculation of Qabs for a focused incident laser beam is described in Section 3.2.4. The
Table 3.1: Constants
Constant Value Unit
VA 18.0153 · 10−6 m3/mol
VB 73.03 · 10−6 m3/mol
R 8.314472 J/(mol ·K)
∆Hvap,A 40714.578 J/mol
∆Hvap,B 61000 J/mol
CPA 75.327 J/(mol ·K)
CPB 221.193 J/(mol ·K)
DA 24.2 · 10−6 m2/sec
DB 8.7710 · 10−6 m2/sec
ka 0.02620 W/(m ·K)
ks 1.14 W/(m ·K)
nA 1.33 + 1202.32 · 10−9i
nB 1.47 + 1811.95 · 10−9i
activity coefficients of water and glycerol are calculated by van Laar equation and Gibbs-
Duhem Equation , respectively. The van Laar equation for water activity coefficient(γA):
ln γA =c1
(
1 + c1c2
xA
1−xA
)2 , (3.8)
.

Chapter 3: Superhydrophobic Surface Preparation and Modelling of Photothermal Tuning of theDroplet Size 14
The parameters c1 = −0.3049 and c2 = −0.8551 in Eq. (3.8) are determined by making
the best fit to the experimental data by Tu and Ray [19].
The Gibbs-Duhem equation for the glycerol acvitivity coefficient(γB):
ln γB =c2c1
(
2√
c1 ln γA + ln γA + c1)
. (3.9)
0.0 0.2 0.4 0.6 0.8 1.00.0
0.2
0.4
0.6
0.8
1.0
0.0 0.1 0.2 0.3
-80
-60
-40
-20
0
(b)
SA=0.9730SA=0.8434SA=0.7530
Td=304.55K
x A
SA
Td=299.55K(a)
SA=0.7530 SA=0.8434 SA=0.9730
∆λ
(nm
)
Td-T (K)
Figure 3.2: Steady state analysis assuming that glycerol is ideally nonvolatile. (a) Steadymole fraction of water as a function of relative humidity of water for various values of micro-droplet temperature (Td) assuming the temperature of the chamber (T∞) to be 299.55 K.Vertical lines indicate the relative humidities of water used in the experiments. (b) Thespectral drift in the WGMs located at around 590 nm as a function of Td − T∞.
Fig. 3.2a shows the steady state situation between the microdroplet and the environment
assuming that T∞ = 299.55 K and glycerol is ideally nonvolatile. At the steady state SA
equals to γAxAφA and Td is larger than T∞. When Td increases, xA decreases. If we look at
the fixed value of SA we can see that the change of xA with temperature is more prominent
at high relative water humidities. We also observed that when SA > 0.9 the large size
change of the droplet is possible with the small variation in droplet temperature. At high
relative water humidities, there is very little amount of glycerol in the microdroplet. Due

Chapter 3: Superhydrophobic Surface Preparation and Modelling of Photothermal Tuning of theDroplet Size 15
to higher volatility of water than glycerol large tuning of microdroplet is obtained at high
relative water humidities. For the center wavelength 590 nm, the spectral change of the
WGMs as a function of Td − T∞ is showed in Fig. 3.2b for three different SA values. The
linear equation between the spectral position of the WGMs and the normalized equtorial
radius is defined as [22, 23]:∆a
a=
∆λ
λ, (3.10)
.
3.2.3 Rate Equation Model for a NaCl-water Microdroplet Standing on a Superhydrophobic
Surface
In the case of NaCl - water droplets, water is the only volatile component in the droplet.
The change in the number of moles of component A (water) in the microdroplet of radius
a and the change in the temperature of the microdroplet due to the time is the same as
Eq.3.1 and Eq.3.5, respectively. By using the polynomial best fit given in ref.[24], the water
activity coefficient (γA) and the solution density (d) are calculated as
γA = 1.0 +∑
CixiWP (3.11)
d = 0.9971 +∑
AixiWP (3.12)
where C1 = −6.366 × 10⁻³, C2 = 8.624 × 10⁻⁵, C3 = −1.158 × 10⁻⁵, C4 = 1.518 × 10⁻⁷,
A1 = 7.41 × 10⁻³, A2 = −3.741 × 10⁻⁵, A3 = 2.252 × 10⁻⁶, A4 = −2.06 × 10⁻⁸, and xWP
represents the solute weight percent.The real and imaginary part of the refractive index
were determined considering the concetration of salt amount in the microdroplet and the
wavelength of the laser [24, 25, 26, 27].
3.2.4 Generalized Lorentz-Mie Theory
Generalized Lorenz-Mie Theory is always needed when dealing with light scattering of fo-
cused beams, as opposed to the regular Lorenz-Mie theory which describes scattering of
plane waves [28]. There are three waves due to particle/laser interaction. These are the
scattered wave outside the sphere, the internal wave inside the sphere, and the incident wave.
The main goal is to obtain matching solutions to these electromagnetic waves by using the
boundary conditions at the surface of the sphere. The electromagnetic field components are

Chapter 3: Superhydrophobic Surface Preparation and Modelling of Photothermal Tuning of theDroplet Size 16
Er =∂2 (reΠ)
∂r2+ k2reΠ, (3.13)
Eθ =1
r
∂2 (reΠ)
∂θ∂r2+
k′′
rsinθ
∂ (rmΠ)
∂Φ, (3.14)
Eφ =1
rsinθ
∂2 (reΠ)
∂φ∂r2− k
′′
r
∂ (rmΠ)
∂θ, (3.15)
Hr =∂2 (rmΠ)
∂r2+ k2rmΠ, (3.16)
Hθ = − k′
rsinθ
∂ (reΠ)
∂φ+
1
r
∂2 (rmΠ)
∂r∂φ, (3.17)
Hφ = −k′
r
∂ (reΠ)
∂θ+
1
rsinθ
∂2 (rmΠ)
∂r∂φ, (3.18)
where eΠ is the scalar potential associated with the electric field, mΠ is the scalar
potental associated with the magnetic field, k′
= ik0ǫ, k′′
= ik0 and k = k0√ǫ. The
complex dielectric constant is ǫ = ǫ+ i4πσ/ω. σ is the electrical conductivity. eΠ and mΠ
satisfy the Helmhotz equation
∇2Π+ k2Π = 0. (3.19)
The most general seperation of variables solution of the Helmholtz equation (Eq.3.19) is
rΠ =∞∑
l=0
l∑
m=−l
[
Almψl (kr) + Blmχl (kr)]
Ylm(θ, φ), (3.20)
where Alm, Blm are the arbitrary constants, ψl and χl are the Ricatti-Bessel functions
and Ylm(θ, φ) is the spherical harmonic function.
The wave scalar potentials of the electric and magnetic fields for the incident field (su-
perscript i), the scattered field (superscript s) and the internal field (superscript w) are
reΠ(i) =∞∑
l=0
l∑
m=−l
Almψl (kextr)Ylm(θ, φ), (3.21)
Chapter 3: Superhydrophobic Surface Preparation and Modelling of Photothermal Tuning of theDroplet Size 17
rmΠ(i) =∞∑
l=0
l∑
m=−l
Blmψl (kextr)Ylm(θ, φ), (3.22)
reΠ(s) =∞∑
l=0
l∑
m=−l
almξ(1)l (kextr)Ylm(θ, φ), (3.23)
rmΠ(s) =∞∑
l=0
l∑
m=−l
blmξ(1)l (kextr)Ylm(θ, φ), (3.24)
reΠ(w) =∞∑
l=0
l∑
m=−l
clmξ(1)l (kintr)Ylm(θ, φ), (3.25)
rmΠ(w) =∞∑
l=0
l∑
m=−l
dlmξ(1)l (kintr)Ylm(θ, φ), (3.26)
where ξ(1)l = ψl−iχl. χl have been ignored for the incident and the internal field because
these functions are unbounded at the origin.
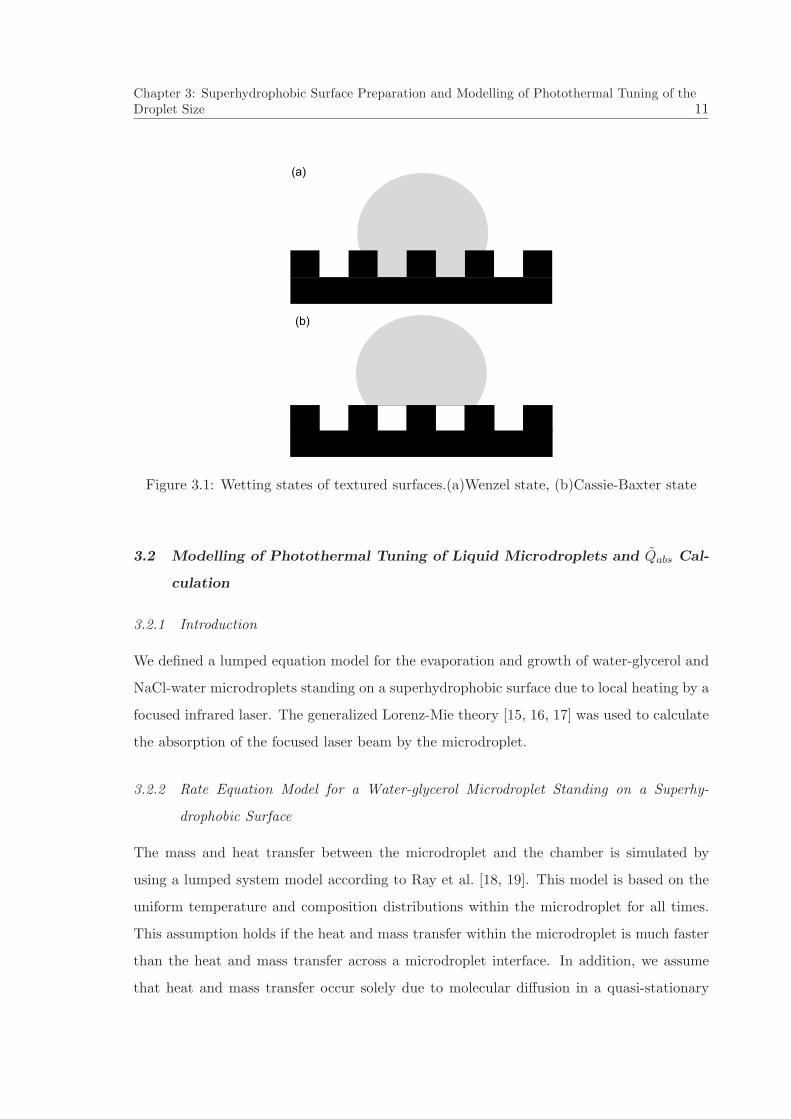
The incident, scattered and internal electromagnetic fields are provided by substituting
Eqs. 3.21-3.26 into Eqs. 3.13-3.18. The coefficients that describe individual fields can be
found using appropriate boundary conditions. The tangential components of the electric
and magnetic fields are continuous across the sphere surface.
The coefficients that describe the scattered field are defined in terms of the incident field
as;
alm =ψ
′
l (kinta)ψ (kexta)− nψl (kinta)ψ′
l (kexta)
nψl (kinta) ξ(1)′
l (kexta)− ψ′
l (kinta) ξ(1)l (kexta)
Alm, (3.27)
blm =nψ
′
l (kinta)ψ (kexta)− ψl (kinta)ψ′
l (kexta)
ψl (kinta) ξ(1)′
l (kexta)− nψ′
l (kinta) ξ(1)l (kexta)
Blm. (3.28)
The coefficients that describe the internal field are defined in terms of the incident field
as;
clm =ξ(1)′
l (kexta)ψ (kexta)− ξ(1)l (kexta)ψ
′
l (kexta)
n2ψl (kinta) ξ(1)′
l (kexta)− nψ′
l (kinta) ξ(1)l (kexta)
Alm, (3.29)
dlm =ξ(1)′
l (kexta)ψ (kexta)− ξ(1)l (kexta)ψ
′
l (kexta)
ψl (kinta) ξ(1)′
l (kexta)− nψ′
l (kinta) ξ(1)l (kexta)
Blm. (3.30)

Chapter 3: Superhydrophobic Surface Preparation and Modelling of Photothermal Tuning of theDroplet Size 18
The coefficients that describe the incident field are defined as;
Alm =a2
l(l + 1)ψl (kexta)
∫ 2π
0
∫ π
0sinθEi
r (a, θ, φ)× Y ∗
lmdθdφ, (3.31)
Blm =a2
l(l + 1)ψl (kexta)
∫ 2π
0
∫ π
0sinθH i
r (a, θ, φ)× Y ∗
lmdθdφ, (3.32)
where n is the complex relative index of refraction and defined as
n = (ǫint/ǫext)1/2 . (3.33)
The time-averaged power absorbed by the sphere can be defined by integrating the radial
component of the external field Poynting vector over a surface enclosing the sphere. For the
large integration radius, it is defined as [29, 30]
Wabs = − c
8πk20ǫext
∞∑
l=−1
l∑
m=−l
l (l + 1)[
|alm|2 + |blm|2 +Re (Alma∗
lm +Blmb∗
lm)]
. (3.34)
The ratio of the total power absorbed by the sphere to the total power of the incident
beam is defined as modified absorbtion efficiency (Qabs). Using the value of the total power
of the incident beam is (c/16)E20w
20 where E2
0 is the electric field amplitude at the beam
focus, the modified absorption efficiency is defined as
Qabs = − 2α2
πw20α
4E20
∞∑
l=1
l∑
m=−l
l (l + 1)[
|alm|2 + |blm|2 +Re (Alma∗
lm +Blmb∗
lm)]
. (3.35)

Chapter 3: Superhydrophobic Surface Preparation and Modelling of Photothermal Tuning of theDroplet Size 19
39 40 41 42 43 44
0,000
0,002
0,004
0,006
0,008
0,010
0,012
0,014
0,016
0,018
(
Qab
s~
y
z
(
7.5 m
Figure 3.3: The modified absorption efficiency (Qabs) as a function of the size parameter (α).Calculations are made for a sphere suspended in air by using the localized approximationto the beam-shape coefficients in generalized Lorenz-Mie theory. The laser propagatingin z and polarized in x directions is focused near the vicinity of the rim of the sphere aty=7.5 µm.
The calculation of (Qabs) as a function of the size parameter α = 2πa/λ, for a 7 µm
spherical particle suspended in air is shown in Fig.3.3. In this calculation, wavelength and
focal waist were taken as λ = 1064 nm and ω0 = 1000 nm. Only first order TE modes are
excited due to off-axis excitation [16].
3.2.5 Hysteresis Behavior in the Droplet Size Tuning
Fig. 3.4a shows the result of the Qabs calculation as a function of the size parameter, α =
2πa/λ, where a and λ are the radius of the microdroplet and wavelength, respectively. This
calculation was performed using the localized approximation to the beam-shape coefficients
in generalized Lorenz-Mie theory [31, 28] with an improved algorithm [16]. The refractive
index of the microdroplet was assumed to be n = 1.33 + 1202.32 · 10−9i [26]. A Gaussian
beam with a focal waist of w0=1000 nm that is propagating in z and linearly polarized in x
directions was considered to be focused 5.5 µm away from the microdroplet’s center along
the y direction, as shown in the inset in Fig. 3.4a. Angular momentum number and radial

Chapter 3: Superhydrophobic Surface Preparation and Modelling of Photothermal Tuning of theDroplet Size 20
Figure 3.4: (a) The modified absorption efficiency (Qabs) as a function of the size parameter(α). Calculations are made for a sphere suspended in air by using the localized approxima-tion to the beam-shape coefficients in generalized Lorenz-Mie theory. The laser propagatingin z and polarized in x directions is focused near the vicinity of the rim of the sphere aty=5.5 µm, exciting first order TE modes. (b) The computational hysteresis curve as func-tion of the incident laser power. The dashed line shows the peak position of the TE1
34 WGMabsorption. Inset shows the sketch of the self-stabilization mechanism.
mode order of the high quality WGMs are shown in Fig. 3.4a. Only TE WGMs are excited
due to the selected focus point, and polarization [3].
In Fig. 3.4b we show the change in α as Pinc is first gradually increased from 0 to 10 mW,
and then decreased back to 0 mW, calculated using the Qabs function shown in Fig. 3.4a.
In this calculation, the initial size parameter (α = 29.6 corresponding to a = 5.0125 µm) is

Chapter 3: Superhydrophobic Surface Preparation and Modelling of Photothermal Tuning of theDroplet Size 21
intentionally selected to be slightly larger than the position of the TE134 WGM absorption
that is peaked at α = 29.365. Hysteretic behavior is clearly observed in the calculated
photothermal tuning cycle. As Pinc is increased, α first decreases at an almost constant
rate until around Pinc=6.7 mW where α decreases sharply due to the absorption resonance.
For Pinc values between 7 and 10 mW, α once more decreases at an almost constant rate.
As Pinc is decreased from 10 mW, α increases at an almost constant rate until Pinc=1 mW
where α suddenly increases. The lower plateau observed between Pinc=1 and 7 mW in
the photothermal tuning cycle gives the self-stable operation points that correspond to the
TE134 WGM absorption that was selected. Self-stable operation points are situated on the
increasing half (region with positive slope) of a specific peak in the Qabs function, as shown
with the red box in the inset of Fig. 3.4b. Around such a self-stable operation point, an
increase or decrease in size are followed by an increase or decrease in Qabs, respectively.
These tend to bring the system back to the initial operating point, ensuring the self-stable
operation. In contrast, self-stable operation is not observed around points located on the
decreasing half (region with negative slope) of a peak in the Qabs function, as shown with
the blue circle in the inset of Fig. 3.4b. Around such a point, an increase or decrease in size
are followed by a decrease or increase in Qabs, respectively. Hence the system quickly goes
away from such an operation point [11].

Chapter 4: Probing of WGMs by Free Space Light Coupling-Applications in Surface Analysis 22
Chapter 4
PROBING OF WGMS BY FREE SPACE LIGHT
COUPLING-APPLICATIONS IN SURFACE ANALYSIS
4.1 Probing Microscopic Wetting Properties of Superhydrophobic Surfaces by
Vibrated Micrometer-Sized Droplets
4.1.1 Introduction1
Superhydrophobic (SH) surfaces are gaining increasing attention because of their potential
applications in liquid nanotechnology, e.g. in MEMS and optofluidic systems [32, 33, 34, 4].
The wetting properties of a SH surface can be described by the apparent contact angle
θ that characterizes the overall energy balance of the liquid–solid–vapor interaction [35].
Several techniques exist for measuring the value of θ over the macroscopic length scales of
SH surfaces (> 100 µm) [36, 37, 38]; however, these techniques do not allow probing of the
variations of θ resulting from the micron–scale heterogeneity of the surface chemistry and/or
topography. Alternative methods based on AFM [13] or electron microscopy imaging [39]
are restricted by the accessible range of θ (θ < 90o) or the ambient atmosphere humidity,
respectively.
In this part, we introduce a novel method for the microscopic contact angle measurement
that is based on the analysis of mechanical resonances of individual micrometer–sized liquid
droplets supported by a vibrated SH surface. We exploit the spectroscopy of the optical
whispering gallery modes (WGMs) excited by laser light in the fluorescently stained droplets
to simultaneously identify the droplet mechanical resonances and sizes. The droplets act
as optical microcavities [4] and their fluorescence spectra feature WGMs whose spectral
widths depend on the droplet vibration amplitude. By monitoring the WGM width as a
function of the substrate oscillation frequency for droplets of different sizes, we identify their
mechanical resonances at the frequencies of the maximal WGM broadening. Droplet size is
1This work has been published in ”Probing Microscopic Wetting Properties of Superhydrophobic Surfacesby Vibrated Micrometer-Sized Droplets”, Langmuir 27 (6), 2150-2154 (2011)
Chapter 4: Probing of WGMs by Free Space Light Coupling-Applications in Surface Analysis 23
then determined by mode–matching of the WGMs using the Lorenz–Mie scattering theory.
For a given droplet, the precise value of the contact angle θ is subsequently obtained from
independent measurements of the droplet mechanical resonance frequency and size using
the previously developed theory for the axisymmetric sessile droplet oscillations [40, 41].
Using our technique we measure microscopic contact angles on two substrates with different
levels of superhydrophobicity and find a good correlation with the average contact angles
of millimetric droplets observed on the same surfaces.
We note that contact angle determination using droplet vibrational frequency measure-
ment has been demonstrated previously only with millimeter–sized droplets [42]. However,
measurement of contact angles larger than 110◦ was not reported in [42]. Moreover, the
experiments did not employ WGMs to simultaneously determine the mechanical resonance
and size of a droplet with high precision.

Chapter 4: Probing of WGMs by Free Space Light Coupling-Applications in Surface Analysis 24
LaserQPD
Piezo
driving
Vibrating substrate
with microdroplets
Humidity chamber
Salt-water
reservoir Humidity
chamber base
Piezo
Pump
laser
Microscope
objective
Dichroic
mirror
To spectrograph
(a)
(b) 30
25
20
15
10
5
0Be
am
de
fle
ctio
n [
a.u
.]
2001751501251007550
f [kHz]
Figure 4.1: Experimental setup used for the microdroplet contact angle measurement. (a)Illustration of the controlled humidity sample chamber. [left] The frequency response ofthe mounted substrate to the harmonic PZT driving is characterized using an auxiliarycollimated laser beam and a quadrant photodiode (QPD). [right] Actual detection of themicrodroplet resonant frequency is carried out using inverted microscope configuration fea-turing a spectrograph. (b) Laser beam deflection from the substrate as a function of thedriving frequency f . The beam deflection is directly proportional to the substrate vibrationamplitude.

Chapter 4: Probing of WGMs by Free Space Light Coupling-Applications in Surface Analysis 25
4.1.2 Experimental Section
The model SH surfaces used in the experiments described here are prepared by spin–coating
suspensions of hydrophobically–coated silica nanoparticles (Aeroxide LE1, average particle
size: 14± 3 nm; Evonik) onto a cleaned cover glass as described previously [43]. The super-
hydrophobicity level of the surface is adjusted by suspending the nanoparticles in different
solvents (ethanol or chloroform at concentration of 50 mg/ml) before spin–coating. Rho-
damine B doped NaCl–water microdroplets (2.5 M NaCl, 100µM Rhodamine B) generated
by an ultrasonic nebulizer are sprayed onto the SH surface in ambient atmospheric condi-
tions. A piezoelectric transducer (PZT) that excites the droplet oscillations perpendicular
to the plane of the cover glass is glued to the opposite surface of the cover glass using
Entellan microscopy mounting medium (Merck Chemicals) so that it does not obstruct
the observation of the droplets (see Fig.4.1a). Subsequently, the studied substrate bearing
the microdroplets is attached to the bottom part of a home–made sample chamber whose
relative water humidity is fixed at 84% with a saturated water solution of KCl. Optical
spectroscopic experiments are performed in the inverted microscope geometry (see Fig.4.1a,
right). An air microscope objective (NA=0.8, 60x; Nikon) is used for tight focusing of
the pump CW green laser (λ = 532 nm, 4.5 mW max. power) onto the rim of a selected
droplet. The fluorescence excited in the droplet is then collected by the same microscope
objective and directed to a 500 mm monochromator with 1200 gr/mm grating (spectral
resolution: 0.07 nm, SpectraPro; Acton Research) that disperses the light before detection
by a spectroscopic CCD camera (Pixis 100F; Princeton Instruments). A high voltage am-
plifier (WMA-300; Falco Systems) connected to the output of a function generator (33220A;
Agilent) is used to drive the PZT with a ∼300 V peak-to-peak sinusoidal signal at varying
frequencies.
For each prepared sample chamber, the vibrational response of the substrate was char-
acterized by measuring the deflection of a laser beam reflected from the vibrating substrate
with a quadrant photodiode (see Fig.4.1a, left). Fig.4.1b shows a typical vibrational re-
sponse from a substrate used in the experiments. Considerable substrate vibration ampli-
tudes are observed between 50-200 kHz. This is the critical frequency range that contains the
lowest–order axisymmetric mechanical resonances of the micrometer–sized droplets studied
here [40]. Some variations were observed in the vibrational responses of different substrates

Chapter 4: Probing of WGMs by Free Space Light Coupling-Applications in Surface Analysis 26
used in the experiments, mainly due to variations in the elastic properties and the mounting
of the cover glasses. However, the peaks featured in the substrate vibrational responses were
always broad due to the amorphous nature of the cover glasses. Hence, approximately con-
stant oscillatory forcing was ensured in the vicinity of the mechanical resonant frequencies
of individual studied droplets.
4.1.3 Results and Discussion
Contact angle measurements relied on sweeping the piezo–driving frequency while recording
the fluorescence spectra from individual microdroplets. Droplet mechanical resonances were
then revealed after an analysis of the WGM widths as a function of the driving frequency.
It should be noted that for each of the studied droplets, only a single mechanical resonant
frequency was observed within the frequency range 50-200 kHz.
0.35
0.30
0.25
0.20
FW
HM
[nm
]
155150145140135130125
f [kHz]
fres
150
100
50
0
f = 125 kHzFWHM
150
100
50
0
f = 143 kHz
150
100
50
0
605604603602601600
Wavelength [nm]
f = 155 kHz
Flu
ore
sce
nce
in
ten
sity [a
.u.]
Figure 4.2: Response of surface–supported microdroplets to the harmonic oscillatory driv-ing. (left) Fluorescence spectra of an oscillating droplet with spherical radius R = 5.0 µmat three different driving frequencies f . The WGM centered at 602.3 nm is characterizedby its full width at half maximum (FWHM). (right) FWHM as a function of f . The crossesindicate experimental data points, the continuous line is the Gaussian fit that gives thedroplet resonant frequency f expres = 141.1 kHz.
Fig.4.2 illustrates how the full width at half maximum (FWHM) of a WGM from an

Chapter 4: Probing of WGMs by Free Space Light Coupling-Applications in Surface Analysis 27
exemplary NaCl–water microdroplet changes with the mechanical driving frequency f . The
WGM in the fluorescence spectrum of the vibrated droplet displays a significant broadening
when the mechanical resonant frequency is approached. This is caused by the intensified
droplet shape oscillations at the resonance which lower the optical Q-factor of the droplet
cavity [3]. The actual resonance at f expres = 141.1 kHz is clearly revealed by a Gaussian fit of
the measured data. Vibration of sessile droplets has been recently extensively studied and
various models predicting the droplet resonant frequencies have been proposed [44, 45, 46].
For our case of vertically–driven micrometric spherical droplets whose shape is completely
determined by surface tension with a negligible influence of gravity, the most appropriate
model of oscillations is the one developed by Strani and Sabetta [40]. Within this model,
the lowest axisymmetric oscillation frequency f thres is given by:
f thres = (2π)−1[
γ
ρR3λ1(θ)
]1/2
(4.1)
where γ, ρ, and R correspond to the surface tension of the liquid, the density of the liquid,
and the droplet spherical radius, respectively. λ1(θ) is the eigenvalue associated with the
lowest–frequency mode (mode number 1) that strongly depends on the contact angle θ.
Consequently, for a droplet of known material properties and size, the value of θ can be
determined using Eq. 4.1 and the measured resonant frequency f expres .
Besides being extremely sensitive to small droplet vibrations, WGMs also allow an inde-
pendent measurement of the droplet spherical radius R. Fluorescence spectra recorded in
our experiments cover a spectral range of 39.1 nm containing at least 3 WGMs belonging to
the same mode family identified by polarization and mode order. Within the framework of
the Lorenz–Mie scattering theory, the value ofR can be obtained from direct mode–matching
of these WGMs [3, 47, 48]. In this approach, R is determined by finding a set of droplet
size parameters ai = (2πR)/λi which provide the best match between the measured WGM
spectral positions and those calculated for the droplet refractive index n = 1.3677. Here, λi
denote the experimentally determined vacuum wavelengths of the WGMs contained within
the given droplet fluorescence spectrum. For the case shown in Fig.4.2, mode–matching
gives R = 5.0 µm. We estimate the uncertainty in R values (mainly given by the un-
certainty in the droplet refractive index) to be less than 100 nm. Such precision cannot
be obtained from the optical microscopy observation of the droplet as the identification of
the droplet equatorial plane where its spherical radius can be measured is to large extent

Chapter 4: Probing of WGMs by Free Space Light Coupling-Applications in Surface Analysis 28
arbitrary.
200
150
100
50
f re
s [kH
z]
8.07.57.06.56.05.55.04.54.0
R [µm]
θ = 139°
θ = 177°
θ = 160°
LE1 / ethanol surface LE1 / chloroform surface
Figure 4.3: Dependence of the lowest–mode resonant frequency fres on the droplet size. Thecircles and triangles indicate experimental data points obtained for droplets supported bythe LE1/ethanol and LE1/chloroform surfaces, respectively. The lines show the resonantfrequency values calculated from Eq. 4.1 for the contact angles of 177◦ (lower frequencylimit), 160◦ (frequency mid-range), and 139◦ (upper frequency limit). Other calculationparameters for the NaCl-water microdroplet: surface tension γ = 74.62 mN/m, densityρ = 1144.7 kg/m3, and refractive index n = 1.3677.
Fig.4.3 shows the distributions of f expres for microdroplets of various spherical radii R
supported by two different SH surfaces (LE1/ethanol coating - red circles, LE1/chloroform
coating - blue triangles). For both of the studied surfaces, the experimental data was
recorded on several substrates prepared using the procedure described above and no sig-
nificant substrate–to–substrate variations were observed. Also shown in the plot are the
resonant frequencies f thres calculated from Eq. 4.1 for several contact angles with the contact-
angle–dependent eigenvalues λ1(θ) determined using previously described procedure [41].
Comparison of the measured and calculated values of the lowest–mode resonant frequen-
cies indicates that the droplet resonant behavior is indeed well described by the formalism
developed by Strani and Sabeta in [40]. The spread in the measured resonant frequencies
for droplets of given R can be attributed mainly to the spot–to–spot variations of the lo-
cal chemistry and/or topography of the studied SH surface that are also observed in light

Chapter 4: Probing of WGMs by Free Space Light Coupling-Applications in Surface Analysis 29
microscopy, AFM, and SEM images of the surfaces [49] and that lead to the contact angle
hysteresis [50]. Additional uncertainty of f expres then stems from the non–uniform response
of the sample chamber to the mechanical oscillatory driving (see Fig.4.1).
(a) (b)
(c)
θETH = 155.5° θCHL = 138.2°
1 mm
20
15
10
5
0
Co
un
t
18017016015014013012011010090
θ [°]
θETH
θCHL
Figure 4.4: Contact angle measurements on superhydrophobic (SH) surfaces. Direct imagingof an NaCl-water droplet on (a) LE1/ethanol-coated and (b) LE1/chloroform-coated SHsurfaces. (c) Histogram of the microscopic contact angles θ for the LE1/ethanol–coated(70 measurements, θETH = 166.7◦) and LE1/chloroform–coated (68 measurements, θCHL =153.8◦) SH surfaces. The contact angles are calculated from the data presented in Fig.4.3using Eq. 4.1.
From the experimental data presented in Fig.4.3, it is evident that the mechanical res-
onant frequencies for the droplets of a given R differ for the LE1/ethanol–coated and
LE1/chloroform–coated SH surfaces. Since the droplet material properties are identical
for both cases, this deviation can only be attributed to contact angles differences between
the two surfaces (see Eq. 4.1). Such dependence of the contact angle on the solvent used
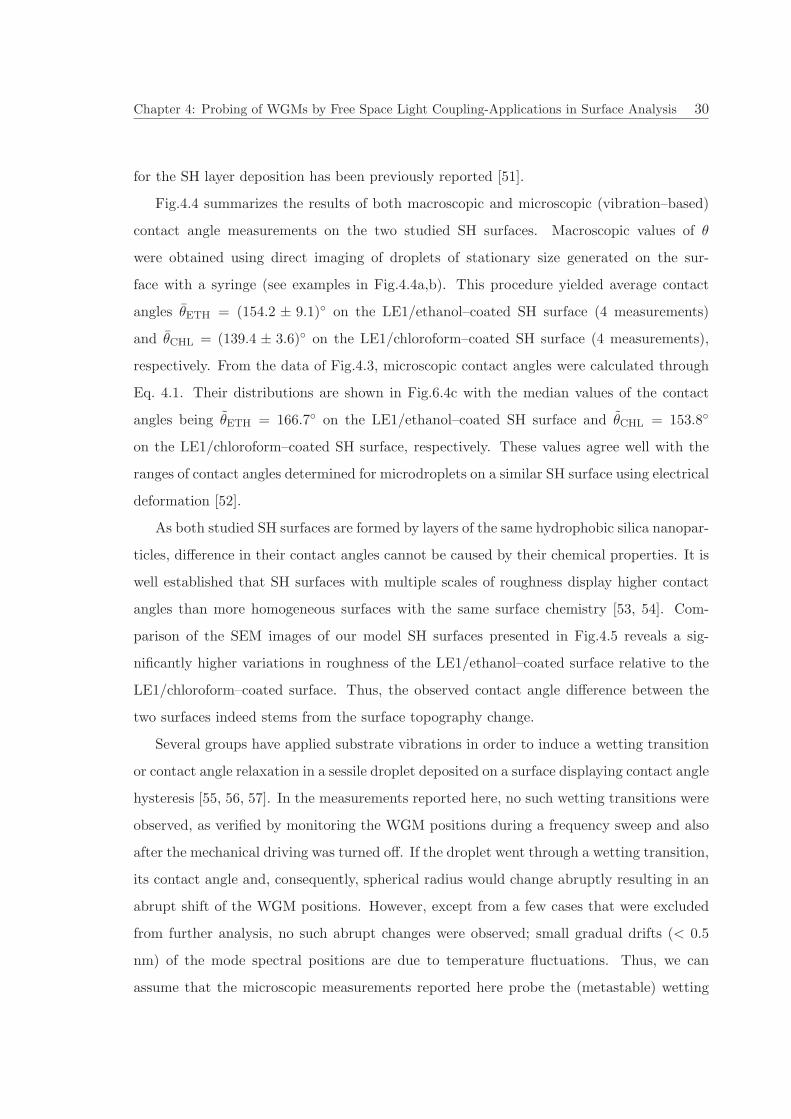
Chapter 4: Probing of WGMs by Free Space Light Coupling-Applications in Surface Analysis 30
for the SH layer deposition has been previously reported [51].
Fig.4.4 summarizes the results of both macroscopic and microscopic (vibration–based)
contact angle measurements on the two studied SH surfaces. Macroscopic values of θ
were obtained using direct imaging of droplets of stationary size generated on the sur-
face with a syringe (see examples in Fig.4.4a,b). This procedure yielded average contact
angles θETH = (154.2 ± 9.1)◦ on the LE1/ethanol–coated SH surface (4 measurements)
and θCHL = (139.4 ± 3.6)◦ on the LE1/chloroform–coated SH surface (4 measurements),
respectively. From the data of Fig.4.3, microscopic contact angles were calculated through
Eq. 4.1. Their distributions are shown in Fig.6.4c with the median values of the contact
angles being θETH = 166.7◦ on the LE1/ethanol–coated SH surface and θCHL = 153.8◦
on the LE1/chloroform–coated SH surface, respectively. These values agree well with the
ranges of contact angles determined for microdroplets on a similar SH surface using electrical
deformation [52].
As both studied SH surfaces are formed by layers of the same hydrophobic silica nanopar-
ticles, difference in their contact angles cannot be caused by their chemical properties. It is
well established that SH surfaces with multiple scales of roughness display higher contact
angles than more homogeneous surfaces with the same surface chemistry [53, 54]. Com-
parison of the SEM images of our model SH surfaces presented in Fig.4.5 reveals a sig-
nificantly higher variations in roughness of the LE1/ethanol–coated surface relative to the
LE1/chloroform–coated surface. Thus, the observed contact angle difference between the
two surfaces indeed stems from the surface topography change.
Several groups have applied substrate vibrations in order to induce a wetting transition
or contact angle relaxation in a sessile droplet deposited on a surface displaying contact angle
hysteresis [55, 56, 57]. In the measurements reported here, no such wetting transitions were
observed, as verified by monitoring the WGM positions during a frequency sweep and also
after the mechanical driving was turned off. If the droplet went through a wetting transition,
its contact angle and, consequently, spherical radius would change abruptly resulting in an
abrupt shift of the WGM positions. However, except from a few cases that were excluded
from further analysis, no such abrupt changes were observed; small gradual drifts (< 0.5
nm) of the mode spectral positions are due to temperature fluctuations. Thus, we can
assume that the microscopic measurements reported here probe the (metastable) wetting
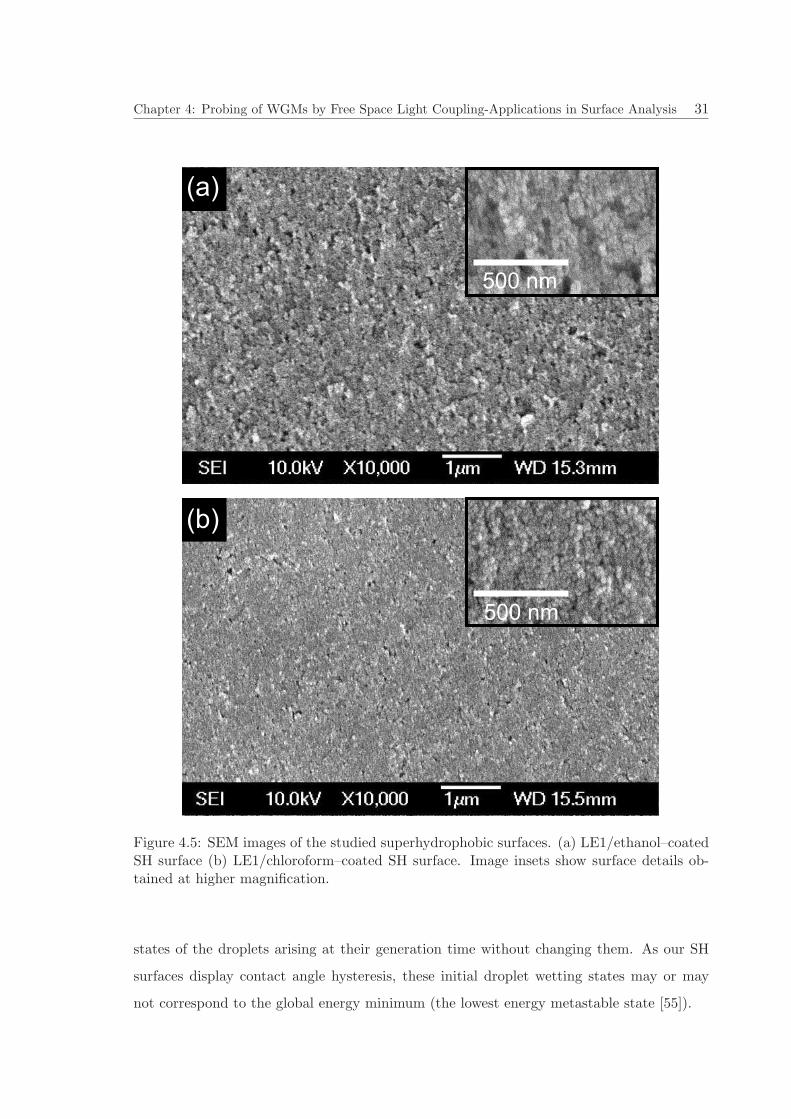
Chapter 4: Probing of WGMs by Free Space Light Coupling-Applications in Surface Analysis 31
(a)
(b)
500 nm
500 nm
Figure 4.5: SEM images of the studied superhydrophobic surfaces. (a) LE1/ethanol–coatedSH surface (b) LE1/chloroform–coated SH surface. Image insets show surface details ob-tained at higher magnification.
states of the droplets arising at their generation time without changing them. As our SH
surfaces display contact angle hysteresis, these initial droplet wetting states may or may
not correspond to the global energy minimum (the lowest energy metastable state [55]).

Chapter 4: Probing of WGMs by Free Space Light Coupling-Applications in Surface Analysis 32
Comparison of the macroscopic and microscopic contact angles reveals a difference in
the two values with microscopic measurements being systematically shifted to larger values
by about 14◦. We attribute this to wetting states that are closer to the global energy
minimum [55] in macroscopic measurements where a droplet rolls easily on the surface and
can readily move to the most hydrophilic region in the vicinity of the deposition point.
Relaxation of the contact angle is further facilitated by mechanical agitation during the
syringe retraction in these measurements.
From a practical point of view, it is worth noting that the microscopic contact angle
values measured with small droplets are more appropriate for microfluidics applications as
they reflect the wetting properties of the surfaces at the relevant length scale. For the typical
droplet radius and contact angle values (R = 5 µm, θ = 165◦) on a SH surface, the contact
area between the droplet and the substrate has the radius r = Rsin(θ) ≈ 1.3 µm; it is this
radius that sets the spatial resolution limit of the contact angle measurement. We note that
this resolution limit can be further reduced to < 1µm by employing smaller droplets for the
surface probing. In order to accomplish this, a different PZT that allows efficient excitation
of droplet vibrations above 200 kHz has to be used.
4.1.4 Conclusions
In conclusion, we have characterized experimentally the microscopic liquid–solid contact
angles by analyzing the mechanical resonances of individual micrometric liquid droplets
standing on a vibrated SH surface. For two surfaces with different superhydrophobicity lev-
els we have compared the contact angles determined with this method to the values obtained
with macroscopic droplet imaging and found a good correlation between the microscopic
and macroscopic contact angle measurements. Further investigations are needed to eluci-
date the relation between the measured microscopic contact angle and global wetting energy
minimum for the studied substrate–liquid combination. The presented microscopic contact
angle probing has potential applications in the characterization of structured surfaces with
complex surface chemistry patterning under a wide range of ambient atmospheric condi-
tions, especially if combined with a precise on–demand positioning of the liquid droplets
over the target surface areas.

Chapter 4: Probing of WGMs by Free Space Light Coupling-Applications in Surface Analysis 33
4.2 Determination of Microdroplet Contact Angles Using Electrically Driven
Droplet Oscillations2
Optical microcavities based on liquid microdroplets with readily tunable size, shape, and
refractive index and exceptionally smooth surfaces can host high-quality optical resonances
- the whispering gallery modes (WGMs) [3]. This property makes them well suited for
on-chip integrated optofluidic applications, e.g. as reconfigurable optical switches, light
sources, or chemical and biological sensors [58]. Several strategies have been developed for
incorporating the microdroplets into optofluidic systems [1]. When dealing with droplets
of aqueous (polar) liquids, it is advantageous to deposit them on a solid substrate with a
superhydrophobic surface [4]. Such a surface deposition stabilizes the position of the droplets
without disturbing significantly their shape and, simultaneously, enables interfacing of the
droplets with other components of a lab-on-a-chip device, such as integrated waveguides
and electronics.
Recently, an application of liquid-based microcavities has been proposed that uses the
analysis of sessile droplet vibrations for determining the liquid-solid contact angle θ over
micrometer-sized contact areas [59]. In this approach, surface-supported microdroplets were
vibrated perpendicularly to the surface using a piezoelectric transducer (PZT) and the values
of θ were subsequently calculated from the measured droplet mechanical resonant frequency
and spherical radius using a previously developed theory of the sessile droplet axisymmetric
oscillations [40]. Vibrational resonances were identified by analyzing the spectral width of
the WGMs present in the fluorescence spectra of the dye-doped microdroplets as a func-
tion of the droplet vibration frequency. Microscopic contact angle measurements based on
the resonant frequency analysis were able to discriminate between surfaces with different
superhydrophobicity.
In this part, we extend the vibration-based contact angle measurement technique by
introducing electric field driving of the microdroplet mechanical oscillations. To this end,
the microdroplets are deposited in a channel formed between two planar gold electrodes on
a superhydrophobic surface and subsequently excited by horizontal AC electric field applied
between the electrodes (see Fig. 4.6). According to the leaky dielectrics model, this causes
2This work has been published in ”Determination of Microdroplet Contact Angles Using ElectricallyDriven Droplet Oscillations”,Appl. Phys. Lett. 98, 194101 (2011)

Chapter 4: Probing of WGMs by Free Space Light Coupling-Applications in Surface Analysis 34
periodic droplet deformations that are proportional to the square of the applied electric
field [60, 61]. The use of horizontal AC electric field offers an alternative, more practical
mechanism for exciting the droplet vibrations. Since the direct mechanical driving of the
droplet-bearing substrate with a PZT is eliminated, substrate resonances do not influence
the observed droplet mechanical response. Consequently, the droplet excitation is more
uniform over the range of the driving frequencies used in the experiments.
The Strani-Sabetta theory [40] describes axisymmetric vibrations of inviscid liquid droplets
whose shape is completely determined by surface tension with a negligible influence of
gravity. For the lowest-order vibration mode, the resonant frequency f1 is given by f1 =
(2π)−1[
γρR3λ1(θ)
]1/2. Thus, for a droplet of known surface tension γ, density ρ, spherical
radius R, and resonant frequency f1, the contact angle θ can be determined from the lowest-
mode eigenvalue λ1(θ) calculated from the above equation [40, 41, 62]. Strictly speaking,
driving the droplet oscillations with the horizontal AC electric field does not induce purely
axisymmetric vibration modes as the driving force is perpendicular to the axis of symmetry
of a sessile droplet. However, we show here that in the limit of small non-axisymmetric de-
formations and large contact angles, droplet resonant frequencies determined sequentially
using PZT (axisymmetric) and horizontal field (non-axisymmetric) driving are very close.
Hence, the use of the Strani-Sabetta theory is justified for the contact angle measurements
based on electrically driven droplet oscillations.
We note that electrically driven oscillations in the horizontal electric field geometry have
been previously reported for characterizing the mechanical frequency response of millimeter-
sized water droplets [63]. In that work, however, large droplet deformations were observed
that led to significant changes of the droplet contact angle during its oscillation. Also,
droplets having relatively small contact angles (θ < 124◦) were studied and no quantitative
comparison to a theoretical model was made.
Our experimental setup is depicted in Fig. 4.6. Planar electrodes are prepared by sub-
sequent evaporation of Ti (thickness: 0.5 µm) and Au (thickness: 1 µm) on coverglass
substrates in a 10−5 Pa vacuum chamber. A copper mask is used during evaporation in
order to obtain 70-90 µm-wide insulating channels between the electrodes. Superhydropho-
bic surfaces are prepared by spin coating a suspension of hydrophobic silica nanoparticles
(50 mg Aeroxide LE1 in 1 mL ethanol, average particle size: 14± 3 nm; Evonik) on cover-

Chapter 4: Probing of WGMs by Free Space Light Coupling-Applications in Surface Analysis 35
AC driving
Humidity chamber
Salt-water
reservoir Humidity
chamber base
PZT
Au contact
MicrodropletSuperhydrophobic
surface
Coverslip
AC electric field
Microscope
objective
Pump
laser
Figure 4.6: Experimental setup for contact angle measurements using vibrated micro-droplets. Droplets are sequentially driven by a horizontal AC electric field and a PZT.
glasses with electrodes [43]. Rhodamine B-doped NaCl-water microdroplets (2.5 M NaCl,
100 µM Rhodamine B) are then sprayed into the channel between the Au electrodes by an
ultrasonic nebulizer in ambient atmospheric conditions. A PZT is glued beneath the cov-
erglasses for direct mechanical excitation of the droplet vibrations. Prepared coverglasses
are then attached to the base of a sealed humidity chamber whose relative humidity is fixed
at 84% with a saturated water solution of KCl. Experiments are performed approximately
one hour after sealing the chamber, once the droplets reach their equilibrium sizes.
WGMs of dye-doped droplets are observed using fluorescence spectroscopy [43, 59]. Indi-

Chapter 4: Probing of WGMs by Free Space Light Coupling-Applications in Surface Analysis 36
vidual droplets are excited in the vicinity of their rim by a 532 nm CW green laser (maximal
power 4.5 mW) that is focused by an air objective (NA=0.8, 60x). The fluorescence emis-
sion is collected using the same objective and dispersed by a 500 mm monochromator with
a 1200 gr/mm grating (spectral resolution: 0.07 nm). A cooled CCD camera is used for
recording fluorescence spectra with an exposure time of 750 ms. High voltage oscillatory
driving of the electrodes or the PZT is achieved by a high voltage amplifier attached to the
output of a function generator, providing ∼300 V peak-to-peak sinusoidal voltage at varying
frequencies. During the experiments, mechanical resonances are characterized using both
the PZT and the horizontal electric field driving for each microdroplet. In both cases, con-
secutive fluorescence spectra are recorded as a function of the excitation frequency and the
mechanical resonances are revealed by the analysis of the frequency dependence of the WGM
spectral widths. The droplet spherical radii are determined by the WGM mode-matching
as described previously [59].
Fig. 4.7a shows exemplary fluorescence spectra recorded from a droplet with a spherical
radius of 5.4 µm upon horizontal electric field driving with frequencies of 105 kHz, 119 kHz,
and 135 kHz. We note that, for the case of the horizontal electric field driving, excitation
frequencies reported in this work are equal to twice the frequency of the AC voltage applied
between the electrodes because of the quadratic dependence of the droplet deformation
on the field strength. The WGM centered at ∼600.2 nm shows maximal broadening at
∼119 kHz due to the mechanical resonance of the droplet. The mechanical resonant fre-
quency is determined by analyzing the full width at half maximum (FWHM) of the WGM
as a function of the excitation frequency (Fig. 4.7b, top). A Gaussian fit to the experi-
mental data reveals a mechanical resonant frequency of 119.3 kHz for this microdroplet.
For comparison, Fig. 4.7b, bottom, shows the frequency dependence of the FWHM of the
same WGM obtained from the same microdroplet upon PZT driving. In this case, the
Gaussian fit gives a mechanical resonant frequency of 119.5 kHz which is very close to the
value obtained by the electrical excitation. In general, near resonance, the mechanical fre-
quency response of a droplet obtained with the electric field driving is broader than that
obtained with the PZT driving. We attribute this mainly to the fact that, for the case of the
PZT driving, the observed frequency response of the droplet is narrowed by multiplication
of its actual frequency response by the spectrally non-uniform frequency response of the

Chapter 4: Probing of WGMs by Free Space Light Coupling-Applications in Surface Analysis 37
500
400
300
200
100
0
I WG
M [a
.u.]
602601600599598
Wavelength [nm]
FWHMf = 135 kHz
f = 119 kHz
f = 105 kHz
0.40
0.35
0.30
0.25 fres,EF
Electric fielddriving
0.500.450.400.350.300.25
135130125120115110105
f [kHz]
fres,PZT
PZTdriving
(a)
(b)
FW
HM
[n
m]
Figure 4.7: (a) Fluorescence spectra of a droplet with a spherical radius R = 5.4 µm excitedby a horizontal AC electric field at three different frequencies f . (b) FWHM of the WGM in(a) as a function of f for horizontal electric field (top plot) and PZT (bottom plot) drivingfor the same droplet. Crosses indicate experimental data points, continuous lines are theGaussian fits that reveal droplet resonant frequencies f expres,EF = 119.3 kHz and f expres,PZT =119.5 kHz, respectively.
superhydrophobic substrate [59].
Fig. 4.8(a) shows the resonant frequencies of droplets with spherical radii varying be-
tween 3.5-6 µm obtained from sequential measurements performed using horizontal electric
field (red circles) and PZT (blue triangles) driving. The contact angles calculated from
the Strani-Sabetta theory for the experimental data presented in Fig. 4.8(a) are shown in
Fig. 4.8(b). Only small relative differences between the horizontal electric field and PZT

Chapter 4: Probing of WGMs by Free Space Light Coupling-Applications in Surface Analysis 38
200
150
100
f re
s [kH
z] θ = 152°
θ = 178°
180
175
170
165
160
155
θ [
°]
6.05.55.04.54.03.5
R [µm]
Electric field driving PZT driving
(a)
(b)
Figure 4.8: (a) Dependence of the measured mechanical resonant frequencies fres on thedroplet spherical radius R. Circles and triangles indicate data points obtained with hor-izontal electric field and vertical PZT driving, respectively. Lines show the values of frescalculated using the Strani-Sabetta theory for contact angles of 178◦ (lower frequency limit)and 152◦ (upper frequency limit). Other calculation parameters for the NaCl-water micro-droplets: surface tension γ = 80.1 mN/m, density ρ = 1144.7 kg/m3, and refractive indexn = 1.3677. (b) Contact angles calculated for the resonant frequencies in (a) using theStrani-Sabetta theory.
driving are observed in the measured resonant frequencies (max ±10%) and contact angles
(max ±2%), with no systematic bias. These small differences that are mainly attributed to
the substrate’s non-uniform mechanical response during the PZT driving, indicate that in
both cases, approximately axisymmetric vibrations predicted by the Strani-Sabetta theory
are excited. This assumption is further justified by the relatively small (< 0.2%) non-
axisymmetric deformations of the droplets due the electric field intensities used for the
droplet driving [52]. Hence, the Strani-Sabetta theory is well suited for the contact angle
measurements reported in this letter.
Chapter 4: Probing of WGMs by Free Space Light Coupling-Applications in Surface Analysis 39
In conclusion, we have studied the lowest-order vibrational resonances of microdroplets
on superhydrophobic surfaces for droplet oscillations driven both horizontally with an AC
electric field and vertically with a PZT. Our experimental results show that for small defor-
mations, the horizontal electric field driving excites nearly axisymmetric droplet vibrational
modes for contact angles θ > 150◦. Consequently, the theoretical model of the axisymmetric
droplet oscillations can be used to calculate the droplet-surface contact angle. In comparison
to the PZT driving, horizontal electric field driving offers a more practical mechanism for
the contact angle measurement, enabling direct oscillatory excitation of the droplets, with-
out being influenced by the substrate’s mechanical response. Electric field driving can be
applied to droplets immersed in another fluid instead of air. In such a situation, the ampli-
tude of the driving will change depending on the material properties of both fluids (relative
permittivity, conductivity, viscosity, and interfacial tension) [60], but the general contact
angle measurement procedure is not altered. Electric field driving can also provide an easy
access to the selective excitation of chosen microdroplets using suitably designed electric
contact geometries which can be integrated into microfluidic systems in a straightforward
way.
4.3 Measuring the Mechanical Resonances of Microdroplets Using a Quadrant
Photodiode(QPD)
Detection of mechanical resonances of surface-supported liquid microdroplets from their
WGM spectra allows only a limited number of spectral measurements to be carried out
before the fluorescent dye inside the droplets photobleaches. In order to address this lim-
itation, we used QPD (quadrant photodiode) instead of optical spectroscopy of WGMs to
analyze the mechanical resonances of microdroplets standing on a superhydrophobic sur-
face. The change in amplitude of oscillations on the surface of microdroplet excited by a
horizontal AC electric field was measured using the QPD. With this measurement tech-
nique, we could observe the mechanical resonance frequency of the microdroplet that had
small contact angles because we did not rely on the excitation of WGMs in the droplets
which requires an almost complete spherical shape of the droplets. In addition to that, we
did not need dye molecule, so we could make long-time observation of each microdroplet.
The experimental setup is shown in Fig. 4.9. As before, microdroplets were sprayed on

Chapter 4: Probing of WGMs by Free Space Light Coupling-Applications in Surface Analysis 40
the superhydrophobic surface between two gold electrodes that were used to drive droplet
oscillations with horizontal AC electric field and, subsequently, mechanical oscillations of
individual microdroplets were analyzed as a function of driving frequency.
QPD
Lazer
Gold
Electrods
Figure 4.9: Experimental setup for the measuring the mechanical resonance of microdropletwith the use of a quadrant photodiode (QPD).
Fig. 4.10 shows the frequency responses of a microdroplet excited with increasing am-
plitude of the sinusoidally-varying AC voltage. The peak at 20 kHz is the fundamental
mechanical resonance of the microdroplet. The peak at 160 kHz is frequency response of
the instruments. If the excitation voltage increases the mechanical resonances that have
higher mode orders appears on the frequency response curves. These higher-order modes
do not correspond to the frequencies predicted by Strani-Sabbetta model of axisymetric
oscillations. This behaviour is attributed to the departing of droplet shape from rotational
symmetry with more intense driving.

Chapter 4: Probing of WGMs by Free Space Light Coupling-Applications in Surface Analysis 41
Figure 4.10: Frequency response of a microdroplet at different amplitudes of the sinusoidalexcitation voltage.

Chapter 5: Tapered Optical Fiber Fabrication and Custom Microscope Setups 42
Chapter 5
TAPERED OPTICAL FIBER FABRICATION AND CUSTOM
MICROSCOPE SETUPS
5.1 Introduction
WGM (whispering gallery mode) microcavities are high quality resonators. The most im-
portant issue for applications of such resonators is the efficiency of the light coupling from
the outside. A schematics view of a spherical WGM resonator is shown in Fig. 5.1. The
associated contact line in the figure corresponds to any coupling system.
Figure 5.1: Schematic view of WGM resonator coupled to its contact line
We can consider each resonance ω0 individually because of the high finesse of the res-
onator. Sin, Sout, u, τe ,and τo denote the input signal, the output signal, the amplitude of
the resonator mode, the characteristic life time of the resonator mode, and intrinsic photon
lifetime, respectively. The light confined in the resonator can escape from the cavity by a
radiative or absorptive process with a characteristic duration τo and by a back coupling to
the output field in the contact line. The intrinsic Q-factor and external Q-factor are defined
by Q0 = ω0τo/2 and and by Qe = ω0τe/2 respectively. The overall Q-factor is determined

Chapter 5: Tapered Optical Fiber Fabrication and Custom Microscope Setups 43
from the intrinsic and external Q-factors values by
1
Q=
1
Q0+
1
Qe(5.1)
and the photon lifetime τ in the cavity is then defined by Q = ω0τ/2. Using the coupled
mode theory (CMT), the intensity transmission spectrum T reads as
T =(1/τe − 1/τ0)
2 + 4π2δ2
1/τe + 1/τ0)2 + 4π2δ2(5.2)
where 2πδ = ω-ω0 is the frequency detuning function [64, 65]. The relative values of τ0
and τe define the coupling regime of resonator. When τ0 = τe, the resonator is critically
coupled. It means that the losses are equal to the coupling rate. When τ0 > τe and τ0<τe
, the resonator is overcoupled and undercoupled, respectively. Free propagating beams are
not efficient for optical coupling due to actually weak radiative transfer to WGMs which can
be seen as quasi-bound state of light trapped inside a dielectric material. Several methods
have been developed to solve this problem. The oldest method used to couple light in WGM
resonators is prism coupling [66, 67, 68]. This method can be improved using an angle
polished fiber instead of prism [69]. Alternatively, tapered fibers have been used usually to
obtain critical coupling [70, 10]. In our work, we tried to observe the critical coupling of a
high-Q liquid microdroplet whispering gallery mode resonator coupled to a fiber taper. In
this chapter, the design and implementation of experimental setup for tapering of optical
fibers is presented. We also introduce custom-made microscope that allows observation of
light coupling from tapered optical fibers to surface-supported liquid microdroplets. As a
first test of our light-coupling system based on tapered optical fibers, we study WGMs of
cylindrical resonator formed by a piece of bare regular optical fiber.
5.2 Fabrication of Tapered Optical Fibers
Computer-controlled experimental setup for manufacturing tapered optical fibers for ap-
plications in optical WGM spectroscopy of microdroplets was realized(see Fig. 5.2). This
setup uses a hydrogen-burning torch with precisely controlled hydrogen flow rate to melt
locally the fiber while simultaneously pulling it with two motorized linear stages moving
in opposite directions. Pilot experiments with fiber tapering were carried out in order to
optimize the conditions for reproducible manufacturing of tapers with low transmission loss

Chapter 5: Tapered Optical Fiber Fabrication and Custom Microscope Setups 44
Figure 5.2: Experimental setup for manufacturing tapered optical fibers.
and dimensions appropriate for efficient coupling of light into microdroplets. The produced
fiber tapers were characterized by direct optical imaging of the fiber and measurement of
the taper transmission during the fiber pulling and by SEM imaging of final tapered fibers
(see Fig. 5.3).

Chapter 5: Tapered Optical Fiber Fabrication and Custom Microscope Setups 45
(E)
(F)
Figure 5.3: Characterization of produced fiber tapers by direct optical imaging of the fiberduring the fiber pulling (A) - (C) and by SEM imaging of final tapered fibers (D),(E),(F).
Pulling conditions warranting final taper transmissions higher than 80% were found.

Chapter 5: Tapered Optical Fiber Fabrication and Custom Microscope Setups 46
Figure 5.4: Transmission of the tapered fiber recorded during the taper pulling.
Transmission of the tapered fiber recorded during the taper pulling reveals the transition into
the taper single-mode operating regime required for the WGM spectroscopy (see Fig. 5.4).
As the fiber tapers, the core becomes extremely thin and the light is no longer confined
between the core and cladding. Rather, the light is now confined by the boundary of the
cladding and air. Once this transition occurs, multiple optical modes will be supported
until the fiber is on order of 1 wavelength of light in diameter, in our case it is smaller than
1 µm. It is at this point, when the taper only supports the fundamental optical mode.
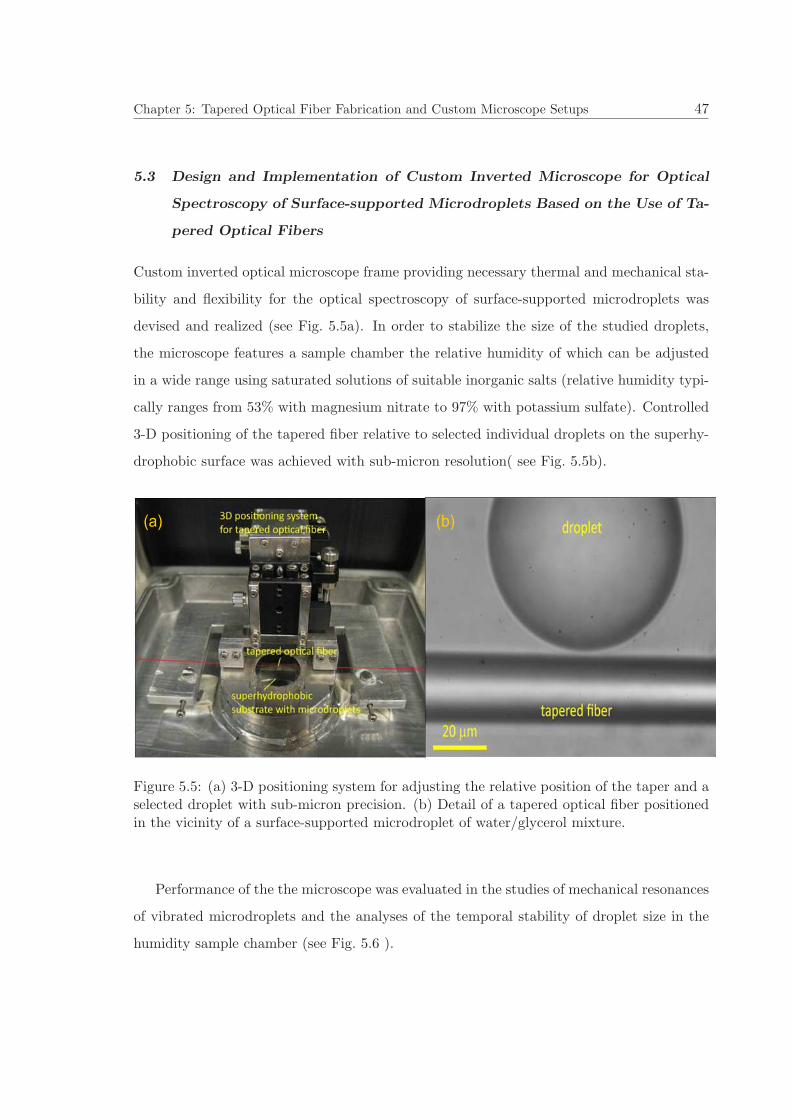
Chapter 5: Tapered Optical Fiber Fabrication and Custom Microscope Setups 47
5.3 Design and Implementation of Custom Inverted Microscope for Optical
Spectroscopy of Surface-supported Microdroplets Based on the Use of Ta-
pered Optical Fibers
Custom inverted optical microscope frame providing necessary thermal and mechanical sta-
bility and flexibility for the optical spectroscopy of surface-supported microdroplets was
devised and realized (see Fig. 5.5a). In order to stabilize the size of the studied droplets,
the microscope features a sample chamber the relative humidity of which can be adjusted
in a wide range using saturated solutions of suitable inorganic salts (relative humidity typi-
cally ranges from 53% with magnesium nitrate to 97% with potassium sulfate). Controlled
3-D positioning of the tapered fiber relative to selected individual droplets on the superhy-
drophobic surface was achieved with sub-micron resolution( see Fig. 5.5b).
(a) (b)
Figure 5.5: (a) 3-D positioning system for adjusting the relative position of the taper and aselected droplet with sub-micron precision. (b) Detail of a tapered optical fiber positionedin the vicinity of a surface-supported microdroplet of water/glycerol mixture.
Performance of the the microscope was evaluated in the studies of mechanical resonances
of vibrated microdroplets and the analyses of the temporal stability of droplet size in the
humidity sample chamber (see Fig. 5.6 ).

Chapter 5: Tapered Optical Fiber Fabrication and Custom Microscope Setups 48
Figure 5.6: Measurements of the droplet size stability in the humidity sample chamberreveal typical shift of the WGM position on the order of 3 nm/hour. This corresponds tothe relative change of the droplet size smaller than 5e-3/hour.
5.4 Whispering Gallery Mode of a Bare Optical Fiber
We tested the produced tapered fibers and the custom microscope system with a cylindrical
solid microresonator. A standard 125 µm diameter single mode optical fiber was used as
a cylindrical microresonator. Buffer removal was achieved using a standard fiber stripper.
Light was coupled into WGMs of the cylindrical microresonator via the evanescent field
generated by the tapered region of the second fiber(see Fig. 5.7 ).
bare fibertapered fiber
Figure 5.7: A sketch for the cylindrical solid microresonator excited by a tapered opticalfiber.
The light source used to excite whispering gallery modes in the microresonator was a
5 mW Laser, tunable over the range from 632.5 nm to 637 nm(TLB-6300 Velocity, New
Focus). The detectors for measuring the power transmitted through the tapered fiber dur-
ing laser wavelength tuning and incident power coupled into the taper were was Thorlabs
DET110 high speed silicon detectors. In order to eliminate the influence of changes in the

Chapter 5: Tapered Optical Fiber Fabrication and Custom Microscope Setups 49
taper input power on the measured taper transmission spectra, the measured transmitted
power was normalized by the incident power. When the two fibers were separated, the mea-
sured normalized transmitted signal was flat. Upon decreasing the distance between the two
fibers, light could couple from the tapered optical fiber into the cylindrical resonator, re-
sulting in transmission dips at specific input light wavelengths corresponding to the WGMs
of the cylindrical resonator. The mode structure of the WGM spectrum depended on the
position of the bare fiber relative to the tapered fiber. Small fluctuations in the position
could have important effects on the relative coupling efficiencies into different modes.
0.85
0.90
0.95
1.00
633 634 635 636 637Wavelenght (nm)
Norm
aliz
ed T
ransm
issi
on
Figure 5.8: Experimentally measured WGM spectrum for a 125 µm diameter bare fiber.The free spectral range is 0.72 nm.
The series of equally spaced dips corresponded to WGMs which had different azimuthal
wave numbers. By using Q = λ0/∆λ, Q-factor of a bare fiber was calculated and found to be
around 103. This result agrees well with the reported Q-factor of the bare fiber [71]. The free
spectral range of the fiber cavity ∆λ, i.e., the spacing between two adjacent transmission
dips, is given by
∆λ =λ2
nπd(5.3)
where n and d are the refractive index and the fiber diameter, respectively. Eq. 5.3 gives
0.71 nm for 125 µm silica fiber. This result is very close to the measured free spectral range
of fiber cavity.

Chapter 6: Probing of Ultrahigh Optical Q-factors of Individual Liquid Microdroplets in Air UsingTapered Optical Fiber Waveguides 50
Chapter 6
PROBING OF ULTRAHIGH OPTICAL Q-FACTORS OF
INDIVIDUAL LIQUID MICRODROPLETS IN AIR USING TAPERED
OPTICAL FIBER WAVEGUIDES
6.1 Introduction1
Ultrahigh-quality (ultrahigh-Q) optical resonant microcavities that confine and concentrate
light to small modal volumes enable optical fields to interact strongly with dipolar emitters
embedded in the cavity or with mechanical degrees of freedom of the cavity [72]. Moreover,
the spectral positions of their optical resonances are very sensitive to changes in the shape
and / or composition of the cavity or its environment. These properties make ultrahigh-
Q microcavities ideally suited for applications in cavity QED, cavity opto-mechanics, and
label-free biological sensing [72, 73, 74, 75].
The Q-factor of an optical resonant mode can be defined as
Q =ω
δω=
λ
δλ, (6.1)
where ω (λ) is the resonant frequency (wavelength) and δω (δλ) is the resonance linewidth.
Droplet-based optical cavities have been subject to extensive theoretical and experimen-
tal studies. Chylek calculated the spacing between the neighboring WGMs of oil droplets
and compared the theoretical results to experimental data with ∼ 1% accuracy [76]. Ev-
ersole et al. studied the spectral positions of WGMs and used them to determine the
droplet refractive index [47, 77]. In a number of experimental investigations, dye las-
ing [22, 78, 79, 80, 81, 82], stimulated Raman scattering [83, 84, 7, 85], and Raman las-
ing [86, 87] from droplets of various liquids surrounded by air or another immiscible liquid
with low index of refraction have been analyzed and characterized. At visible wavelengths,
absorption-limited Q-factors of ∼ 108 have been predicted for the first order WGMs of water
1This work has been published in ”Probing of ultrahigh optical Q-factors of individual liquid microdropletsin air using tapered optical fiber waveguides”, J. Opt. Soc. Am. B 29 (12), 3240-3247 (2012)

Chapter 6: Probing of Ultrahigh Optical Q-factors of Individual Liquid Microdroplets in Air UsingTapered Optical Fiber Waveguides 51
microdroplets in air with a size parameter α = 2πa/λ (a and λ being the droplet radius and
the light wavelength, respectively) larger than ∼ 60 [9]. Experiments involving a stream of
liquid microdroplets floating in air have revealed Q-factors up to 5 × 10⁵, using measure-
ments of photon lifetime of light scattered elastically from the droplets [88]. In addition,
experiments with cavity-enhanced energy transfer between donor and acceptor molecules
have suggested Q-factors of ∼ 5× 10⁶ for the WGMs of single electrodynamically levitated
glycerol microdroplets in air [89, 90]. Despite these demonstrations, characterization of Q-
factors of liquid microdroplets in air based on direct high-resolution determination of WGM
linewidths has not been reported. The main experimental challenge of such measurements
lies in stabilizing the droplet position and size during the measurement and simultaneously
coupling efficiently the probe laser light into the droplet.
In this chapter, we demonstrate direct, linewidth-based measurements of ultrahigh-Q fac-
tors of individual optical resonances excited in liquid microdroplets surrounded by air. The
droplets were deposited on a superhydrophobic surface and their WGMs were probed using
tapered optical fiber waveguides. The experimental configuration with a superhydrophobic
surface is robust, easy to implement, and preserves the spherical shape of the microdroplets
while stabilizing their position [4]. Thus, it simplifies significantly the measurements of Q-
factors of liquid droplets in air and allows prolonged investigation of individual droplets. In
our experiments, the droplet size was stabilized by adding glycerol to the aqueous droplets
and keeping the droplets in a closed chamber with controlled relative humidity. We used a
tapered optical fiber waveguide to couple light from a narrow-linewidth tunable laser into an
individual surface-supported droplet of glycerol-water mixture and measured the fiber trans-
mission as a function of the laser wavelength. Tapered optical fiber coupling is commonly
used for characterizing ultrahigh-Q microcavities [72, 73, 74, 75]. In contrast to free space
coupling, fiber tapers allow selective phase-matched excitation of individual WGMs [10]
with a coupling efficiency better than 90% [70] and a spectral resolution limited only by
the linewidth of the laser used. We note that Q-factors of individual liquid droplets have
been previously characterized using tapered fibers [91]. In that work, the studied aqueous
droplets were immersed in an immiscible cladding liquid that prevented evaporation of the
droplet liquid. While this approach provided stabilization of the droplet size, simultaneous
requirements of liquid immiscibility and refractive index contrast put limits on the suitable

Chapter 6: Probing of Ultrahigh Optical Q-factors of Individual Liquid Microdroplets in Air UsingTapered Optical Fiber Waveguides 52
droplet / immersion medium liquid pairs.
6.2 Experimental Setups and Procedures
The experimental setup used for the ultrahigh-Q WGM spectroscopy of surface-supported
liquid microdroplets is depicted in Fig. 6.1. Tapered optical fiber waveguides were manu-
factured from a single-mode optical fiber (SM600; Thorlabs) by heat-pull method using a
stationary hydrogen flame [8, 92]. During the taper pulling, the transmission of light from
an auxiliary laser (λ = 637 nm) through the formed taper was monitored and the pulling of
the fiber was halted when oscillations in the transmitted light intensity ceased. Since these
oscillations arose due to interference of multiple transverse modes propagating in the fiber,
their disappearance indicated single-mode operation of the taper [92]. The transmission of
the final tapers was typically higher than 90% and SEM imaging revealed taper diameters
in the range of 500–700 nm. The taper was mounted on a 3-axis piezo stage (Tritor 102SG;
Piezosystem Jena) that allowed fine positioning of the taper with respect to the droplet with
a resolution better than 2 nm. Individual droplets of glycerol-water mixture were deposited
on the superhydrophobic surface at ambient room humidity (∼ 42 − 44%) using a glass
microcapillary connected to a syringe. The initial concentration of glycerol in the mixture
was 47.8% w/w; however, this increased after the droplet deposition due to the evaporation
of water in the low-humidity ambient environment. Subsequently, the surface with a single
droplet and the mounted taper were enclosed in a chamber having a total volume of ∼1.9L
with its relative humidity adjusted to 53% by a saturated solution of magnesium nitrate.
At this relative humidity and with an ambient temperature of ∼ 23 oC, the equilibrium
concentration of glycerol in the droplet is 77.1%w/w [93] which corresponds to a refractive
index nD = 1.439 [27]. The experiments were carried out within 2 hours after the droplet
deposition. During this time, the humidity in the sample chamber gradually approached the
equilibrium value of 53% and the droplet size roughly stabilized. Typical equilibrium radius
of droplets used in the Q-factor measurements ranged from ∼ 100µm to ∼ 200µm. Light
from a tunable external-cavity diode laser (tuning range 632.5–637 nm, linewidth < 300
kHz, Velocity 6304; New Focus) was coupled into the tapered fiber that was then brought
to the proximity of the droplet to induce coupling between the taper and the droplet. While
approaching the taper to the droplet, we recorded simultaneously the taper transmission

Chapter 6: Probing of Ultrahigh Optical Q-factors of Individual Liquid Microdroplets in Air UsingTapered Optical Fiber Waveguides 53
spectra and stopped approaching when we observed resonant transmission dips with a suf-
ficient modulation depth (more than 20%). Since efficient coupling between the taper and
the droplet requires overlap of evanescent fields of the two objects, the distance between
the taper and the droplet was on the order of the penetration depth of the evanescent field
d = λ/(2π(n2D − 1)1/2) [94]. For our experimental conditions, d ≈ 100 nm. In order to
minimize the absorption of the pump laser light in the droplet liquid, we carried out the
measurements in the visible part of the spectrum where both water and glycerol are virtu-
ally non-absorbing. The laser power was monitored both at the input and the output of
the tapered fiber and the measured taper transmission was normalized by the input power
in order to cancel out the laser power variations during wavelength tuning. Wavelength
scans of the tunable probe laser were carried out at low and high resolutions. During the
low-resolution scans, the position of the tuning mirror inside the laser was changed by a
DC motor with a spectral resolution of 0.02 nm over the whole 4.5 nm tuning range. These
low-resolution scans were used to determine the free spectral range of the droplet cavity.
Due to the DC motor actuation of the tuning mirror, the low-resolution scans were slow
(scan duration ∼ 100 s).
In contrast, droplet WGM spectra with the resolution limited by the laser linewidth
(<300 kHz) were acquired in the high-resolution scans that were performed within the
∼ 90 GHz mode-hop free tuning range by the displacement of the tuning mirror with a
piezoelectric transducer. The calibration of wavelength tuning in the high-resolution scans
was carried out using a scanning Fabry-Perot interferometer. The high-resolution spectra
over the full fine-tuning range of ∼125 pm with the laser linewidth-limited resolution of
∼0.4 fm could be acquired in approximately 2 seconds.
6.3 Results
6.3.1 Stability of Droplet Shape and Size
Figure 6.2 shows a side view of a representative glycerol-water microdroplet standing on
a superhydrophobic surface. This figure illustrates the very good sphericity of the droplet
shape and its high contact angle on the superhydrophobic surface (typically > 155◦). We
analyzed the droplet shape by locating the droplet contour in the images and fitting this
contour with a circle using a custom-written routine implemented in IgorPro (WaveMetrics).

Chapter 6: Probing of Ultrahigh Optical Q-factors of Individual Liquid Microdroplets in Air UsingTapered Optical Fiber Waveguides 54
Microdroplet
Superhydrophobic surface
x
y
zPZT
Scanner
Tapered
fiber
PD2
PD1
Tunable laser
Beam splitterCoupler
Controlled
humidity
chamber
(a)
(b)
Droplet
Tapered fiber
10 µm
x
y
z
Figure 6.1: (a) Experimental setup for ultrahigh-Q spectroscopy of surface-supported liq-uid microdroplets. PD1 (PD2) – photodetectors monitoring the light power at the input(output) of the tapered fiber. (b) Image of a surface-supported glycerol-water microdropletwith a tapered fiber positioned in its equatorial plane (view along the z-axis).
From the shape analysis, we obtained the relative rms difference between the true droplet
contour and the best-fit circle D/a ≈ 0.2% where D is the absolute rms difference between
the true contour and the fit and a is the droplet radius. The droplet was deformed towards
an oblate spheroid which is consistent with gravity-induced deformation (see Section 6.3.2).
In order to asses the stability of surface-supported droplets, we monitored the same droplet
exposed to the ambient room conditions (average relative humidity ∼ 55%, temperature
25◦C) for an extended period of time (up to three days). Comparison of the top and
bottom images in Fig. 6.2 that were acquired with a time separation of 24 hours shows that

Chapter 6: Probing of Ultrahigh Optical Q-factors of Individual Liquid Microdroplets in Air UsingTapered Optical Fiber Waveguides 55
158°
50 µm157°
t = 0 h
t = 24 h
Figure 6.2: Images of a glycerol-water microdroplet standing on a superhydrophobic surface(side view along the surface plane). Images were acquired at different times t elapsed sincethe droplet generation.
a prolonged exposure of the droplet to ambient atmosphere did not have any influence on
the droplet contact angle and overall shape. The droplet shape analysis revealed a slight
decrease of the droplet size in 24 hours (relative radius change ∼ 2%). This size change can
be attributed to the fluctuations in the ambient room humidity between the acquisition of
the subsequent images.
In Fig. 6.3, a typical low-resolution transmission spectrum of a tapered fiber waveguide
coupled to a microdroplet is shown. The average optical input power coupled into the taper
was approximately 60µW. Despite the residual variations of the non-resonant transmission
background during the wavelength scan, sharp transmission dips corresponding to the exci-
tation of individual WGMs of the droplet cavity are clearly visible. The overall structure of
the WGM spectra is rather complex with the mode degeneracy largely lifted due to a slight
droplet deformation by gravity and contact line pinning on surface inhomogeneities (see

Chapter 6: Probing of Ultrahigh Optical Q-factors of Individual Liquid Microdroplets in Air UsingTapered Optical Fiber Waveguides 56
1.0
0.9
0.8
0.7
0.6
No
rma
lize
d fib
er
tra
nsm
issio
n [a
.u.]
637636635634633
Wavelength [nm]
FSR
Figure 6.3: Low-resolution transmission spectrum of a tapered fiber waveguide coupledto a glycerol-water droplet in air as a function of the pump laser wavelength. Spectrumacquisition time was ∼ 100 s. FSR indicates the free spectral range of the microdropletcavity (FSR = 0.414 nm).
also the discussion in Section 6.3.2). Thus, we did not attempt to assign the observed taper
transmission dips to specific mode orders. Using the asymptotic formula of Chylek [95]
a =λ2
2π FSR
arctan([
n2D − 1]1/2
)
([
n2D − 1]1/2
)(6.2)
and assuming an effective refractive index of nD = 1.439 for the glycerol-water mixture at
53% relative humidity, we calculated the droplet radius a from the free spectral range (FSR)
of 0.414 nm at the mean wavelength λ = 635 nm to be a = 120µm. This value matched
well the radius of ∼127 µm obtained from the droplet image analysis, considering ambiguity
in defining precisely the location of the droplet boundary in the image that furthermore
depends on microscope focusing. For droplets much larger than the light wavelength, the
FSR given by Eq. (6.2) is rather insensitive to the droplet radius changes ∆a (the FSR
change ∆FSR ∼ −(λ/a)2∆a) [95, 76]. On the other hand, the observed shift of the absolute
WGM positions ∆λ scales with ∆a as [65]
∆λ =
(
λ
a
)
∆a. (6.3)
Consequently, at λ = 635 nm and a = 120µm, even a modest resolution of ∆λ = 0.1 nm in
detecting the WGM position corresponds to the smallest resolvable change of the droplet
radius ∆a = 18.9 nm which is well below the typical effective pixel size of CCD detectors

Chapter 6: Probing of Ultrahigh Optical Q-factors of Individual Liquid Microdroplets in Air UsingTapered Optical Fiber Waveguides 57
used in high-resolution optical microscopy (∼ 65 nm, assuming physical pixel size 6.45µm
and 100-times optical magnification [96]). Hence, tracking of the absolute position of a
selected WGM provides much more precise information on the droplet size changes than
the analysis of the droplet image. For this reason, all quantifications of the droplet size
changes in the following text are based on the WGM position tracking.
15
10
5
0
Tim
e [s]
635.00634.96634.92634.88
Wavelength [nm]
(a)
15
10
5
0
Tim
e [s]
634.93634.92634.91634.90634.89
(b)
1.0
0.9
0.8
0.7
Fib
er
tra
nsm
issio
n
634.93634.92634.91634.90634.89
Wavelength [nm]
(c)-0.6 0.0 0.6Wavelength [pm]
FWHM = 0.5 pm
Figure 6.4: High-resolution transmission spectrum of a tapered fiber waveguide coupled to aglycerol-water droplet in air as a function of the pump laser wavelength and time. (a) Timeseries of transmission scans over the whole fine-tuning range of the laser (spectral intervalwidth ∼ 125 pm). (b) Time series of transmission scans over the tuning range occupiedby a group of WGMs shown in the left part of spectral map (a) (spectral interval width∼ 54 pm). (c) Spectral profile of the tapered fiber transmission along the dashed whiteline shown in spectral map (b). Black cross denotes a representative WGM used for theQ-factor analysis (see graph inset and text). Average droplet radius was 130µm and rateof the droplet radius change was−0.17 nm/s.
Repeated high-resolution wavelength scans of the taper transmission revealed spectral
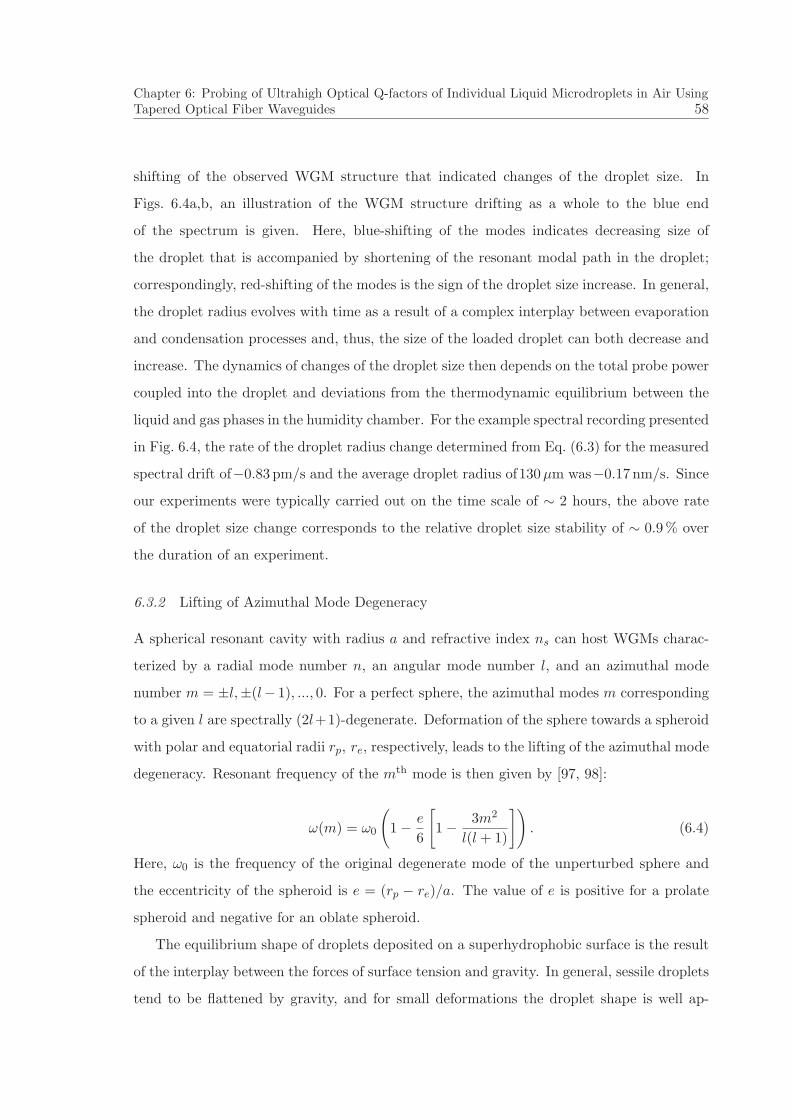
Chapter 6: Probing of Ultrahigh Optical Q-factors of Individual Liquid Microdroplets in Air UsingTapered Optical Fiber Waveguides 58
shifting of the observed WGM structure that indicated changes of the droplet size. In
Figs. 6.4a,b, an illustration of the WGM structure drifting as a whole to the blue end
of the spectrum is given. Here, blue-shifting of the modes indicates decreasing size of
the droplet that is accompanied by shortening of the resonant modal path in the droplet;
correspondingly, red-shifting of the modes is the sign of the droplet size increase. In general,
the droplet radius evolves with time as a result of a complex interplay between evaporation
and condensation processes and, thus, the size of the loaded droplet can both decrease and
increase. The dynamics of changes of the droplet size then depends on the total probe power
coupled into the droplet and deviations from the thermodynamic equilibrium between the
liquid and gas phases in the humidity chamber. For the example spectral recording presented
in Fig. 6.4, the rate of the droplet radius change determined from Eq. (6.3) for the measured
spectral drift of−0.83 pm/s and the average droplet radius of130µm was−0.17 nm/s. Since
our experiments were typically carried out on the time scale of ∼ 2 hours, the above rate
of the droplet size change corresponds to the relative droplet size stability of ∼ 0.9% over
the duration of an experiment.
6.3.2 Lifting of Azimuthal Mode Degeneracy
A spherical resonant cavity with radius a and refractive index ns can host WGMs charac-
terized by a radial mode number n, an angular mode number l, and an azimuthal mode
number m = ±l,±(l− 1), ..., 0. For a perfect sphere, the azimuthal modes m corresponding
to a given l are spectrally (2l+1)-degenerate. Deformation of the sphere towards a spheroid
with polar and equatorial radii rp, re, respectively, leads to the lifting of the azimuthal mode
degeneracy. Resonant frequency of the mth mode is then given by [97, 98]:
ω(m) = ω0
(
1− e
6
[
1− 3m2
l(l + 1)
])
. (6.4)
Here, ω0 is the frequency of the original degenerate mode of the unperturbed sphere and
the eccentricity of the spheroid is e = (rp − re)/a. The value of e is positive for a prolate
spheroid and negative for an oblate spheroid.
The equilibrium shape of droplets deposited on a superhydrophobic surface is the result
of the interplay between the forces of surface tension and gravity. In general, sessile droplets
tend to be flattened by gravity, and for small deformations the droplet shape is well ap-

Chapter 6: Probing of Ultrahigh Optical Q-factors of Individual Liquid Microdroplets in Air UsingTapered Optical Fiber Waveguides 59
proximated by an oblate spheroid [99]. Besides gravity, the droplet shape can be perturbed
by other factors, the most prominent of which is inhomogeneity of the superhydrophobic
surface that causes pinning and distortion of the droplet contact line. Consequently, the
droplet shape departs from that of a perfect sphere or a rotationally symmetrical spheroid.
All additional distortions that increase the droplet eccentricity lead to further frequency
splitting of the azimuthal m-modes.
Droplet eccentricity e can be estimated from the measured mode frequency splitting.
From Eq. (6.4), the frequency difference ∆ω(m) between two neighboring m-modes is
∆ω(m) = ω(m+ 1)− ω(m) =
=ω0e
l(l + 1)
[
m+1
2
]
. (6.5)
For a glycerol-water droplet with radius a = 130µm and refractive index ns = 1.44 probed
with a mean laser wavelength λ = 635 nm, the approximate value of l is:
l ≈ 2π ansλ
≈ 1852 ≫ 1. (6.6)
Moreover, in our experimental geometry (excitation of droplet WGMs via a tapered fiber
located at the droplet equatorial plane), we excite most efficiently the WGMs with |m| ≈ l
and the intensity of the observed WGMs falls off rapidly with increasing value of (l− |m|) [91]. Hence, Eq. (6.5) simplifies to
∆ω(m) ≈ ω0e
l2
[
m+1
2
]
≈ ω0e
l, (6.7)
and, upon substituting (6.6) into (6.7), we obtain
e ≈ ∆ω(m)
ω0
2π ansλ
=2π ans∆λ
λ2, (6.8)
where ∆λ is the measured mode splitting. For the spectrum presented in Fig. 6.4c, the
spacing of neighboring modes is ≈ 1.5 pm. Because of the mode excitation symmetry (the
taper located in the droplet equatorial plane), odd azimuthal modes are not excited and
the observed mode separation is actually equal to 2∆λ [91]. Therefore, ∆λ ≈ 0.75 pm and
the droplet eccentricity e ≈ 2.2× 10⁻³. This value of eccentricity is comparable to the rms
droplet shape distortion of ∼ 2 × 10⁻³ that was obtained from the droplet shape analysis
presented in Section 6.3.1.

Chapter 6: Probing of Ultrahigh Optical Q-factors of Individual Liquid Microdroplets in Air UsingTapered Optical Fiber Waveguides 60
6.3.3 Q-Factor Measurements
In order to characterize the Q-factors of WGMs of surface-supported liquid microdroplets,
we conducted series of relatively fast, high-resolution spectral scans over a narrow spectral
range of 54 pm within 2.06 s. In Fig. 6.4c, an example of such high-resolution spectral
recording is presented for a group of WGMs collectively drifting to the blue end of the
spectrum. This group of WGMs consists of an intense long-wavelength mode accompanied
by a number of shorter-wavelength modes whose intensities decrease with decreasing wave-
length. Such a spectrum is consistent with a family of WGMs with the same angular and
radial mode numbers and different azimuthal mode numbers originating from the degener-
acy lifting in a sphere deformed towards an oblate spheroid (see Section 6.3.2). Here, the
longest-wavelength mode corresponds to the highest absolute value of the azimuthal mode
number that belongs to the modes circulating in the droplet equatorial plane [97, 98]. In ac-
cordance with Eq. (6.2), the relative positions of individual WGMs are virtually unaffected
by the droplet size drift. A Lorentzian fit of a representative WGM denoted by a black cross
in Fig. 6.4c gave the mode FWHM δλ = 0.5 pm. Knowing δλ, Q-factor at the mean laser
wavelength λ = 635 nm could be determined using Eq. (6.1). Since the droplet size changed
slightly during the spectrum acquisition, Q-factor should be calculated after correcting the
measured FWHM for the spectral drift of WGMs. Our high-resolution spectral scans were
carried out from red to blue wavelengths; thus, for a blue-drifting mode, the true FWHM of
the mode is smaller than the measured one. Taking into account the measured rate of the
WGM position drift of ∼ 0.8 pm/s and the spectral acquisition rate of 54 pm/2.06 s ≈ 26.2
pm/s, we obtain the true FWHM of ∼ 0.485 pm and, consequently, Q-factor of 1.31× 10⁶
for the selected WGM.
Images of a glycerol-water microdroplet on a superhydrophobic surface presented in
Fig. 6.2 suggest that the droplet shape and contact angle are stable on the time scale of
hours. This implies that the optical properties of surface-supported microdroplet cavities
should not change significantly after the droplet deposition.
In Fig. 6.5, time evolution of the Q-factor of a single microdroplet is presented within
the interval of ∼ 1 hour following the droplet deposition. Values of Q-factors were deter-
mined using the above described procedure. In order to minimize the possibility of forming
a liquid bridge between the tapered fiber and the droplet, the taper was repeatedly moved

Chapter 6: Probing of Ultrahigh Optical Q-factors of Individual Liquid Microdroplets in Air UsingTapered Optical Fiber Waveguides 61
2.5x10⁶
2.0
1.5
1.0
0.5
0.0
Q-F
acto
r
4000350030002500200015001000500
Time [s]
Q-Factor = 1.9505x10⁶-197.89 x Time
Figure 6.5: Time evolution of the Q-factor of degeneracy-lifted azimuthal WGMs of asurface-supported microdroplet. Time t = 0 s corresponds to the droplet deposition on thesurface. Crosses represent experimental data, line is the linear fit of this data. Averagedroplet radius was 150µm.
towards and away from the droplet between consecutive Q-factor measurements. Therefore,
it is likely that modes with different angular and azimuthal numbers were characterized in
individual measurements shown in Fig. 6.5. As illustrated by this figure, the characteris-
tic Q-factors of degeneracy-lifted azimuthal WGMs of the droplet decreased slightly with
time. While we did not observe any discernible changes in the droplet shape over several
hours, it is likely that contaminant particles originating from the droplet liquid and / or
slowly dissolving superhydrophobic surface accumulated at the liquid-air interface during
this time. Such accumulation of contaminant particles would then lead to an increase in
the light scattering at the droplet surface and, thus, increased loss of the cavity which is
equivalent to a lower Q-factor. It is worth noting it is not possible to observe directly
binding of individual nanoparticles forming the superhydrophobic surface to the droplet
since the mass of nanoparticles (∼3.8 attogram / particle) is too small to cause a detectable
shift of the WGM positions [100]. Hence, accumulation of nanoparticles on the droplet
surface manifests itself as a continuous process rather than a sequence of discrete jumps
of the WGM properties. In addition, unlike with solid cavities, contaminant particles on
liquid surfaces are not immobilized but instead diffuse in and out of the WGM field which
further smears the optical response of the cavity. Despite the slight decrease with time, the
droplet Q-factor remains on the order of 106. Consistence of this value with the expected
experimental limits on the measured Q-factors is discussed in the next section.

Chapter 6: Probing of Ultrahigh Optical Q-factors of Individual Liquid Microdroplets in Air UsingTapered Optical Fiber Waveguides 62
6.4 Experimental Limits on Measured Q-factors
6.4.1 Contributions to Overall Q-Factor of a Resonant Cavity
In general, the overall quality factor Q defined by Eq. (6.1) consists of several components:
1
Q=
1
Qrad+
1
Qmat+
1
Qs.s., (6.9)
where 1/Qrad characterizes losses of the resonant cavity due to radiation, 1/Qmat describes
losses due to material absorption and bulk scattering, and 1/Qs.s. is the contribution of
scattering from surface inhomogeneities [65, 101]. In perfect spheres with 2a/λ ≥ 15,
radiative quality factor Qrad > 1011 [101]. In spheroids characterized by eccentricity e,
photon paths generally depart from ideal circularity. This results in a lowering of Qrad
relative to undeformed spheres which is proportional to e2 and negligible for WGMs with
modal paths localized in the equatorial plane of the spheroid [102]. As these are the modes
we predominantly excite and characterize in our experimental geometry, we can assume that
the value of Qrad is approximately unaltered by the droplet deformation. Material-related
quality factor Qmat represents typically the main limit for the overall Q. This contribution
can be expressed as
Qmat =2π nsαλ
, (6.10)
where α is the linear absorption coefficient of the cavity material and ns is the cavity
refractive index at wavelength λ. For glycerol-water mixture at λ = 635 nm, α ≈ 2.8 ×10⁻³cm−1 [103] and ns = 1.44 [27], and, thus, Qmat ≈ 5×10⁷. Finally, Qs.s. can be expressed
as
Qs.s. =λ2 a
π2∆2B, (6.11)
with ∆ being the rms size of surface inhomogeneities and B their correlation length [101].
For glycerol-water droplets, thermal fluctuations of the droplet shape lead to ∆ ≈ 0.07
nm (see Eq. (6.12)) and B can be estimated from the characteristic wavenumber q of the
maximal liquid surface roughness (q ∼ 107 cm−1) as B ≈ 2π/q ≈ 6.3 nm [104]. Assuming
further that the droplet radius a = 130µm, Qs.s. ≈ 1.7× 10¹¹.
From the above analysis, it follows that the expected limit on the intrinsic value of Q-
factor measured in our experiments is set by Qmat at the level of ≈ 5 × 10⁷. This limit,
however, is approximately 10 times larger than the maximum observed Q-factors. As argued

Chapter 6: Probing of Ultrahigh Optical Q-factors of Individual Liquid Microdroplets in Air UsingTapered Optical Fiber Waveguides 63
in Section 6.4.2, we attribute this difference to thermally-induced droplet shape fluctuations
that lower the Q-factor values measured with the use of tapered optical fibers.
6.4.2 Fluctuation of Mode Position Due to Thermally-Induced Droplet Shape Fluctuations
Due to thermal excitation, droplet shape undergoes random dynamic distortions with a
characteristic amplitude given by [105]:
∆ =
[
kBT
4πγ
]1/2
, (6.12)
where kB is the Boltzmann constant,γ is the glycerol surface tension(63.4 mN/m) and T is
the thermodynamic temperature. For a glycerol droplet at room temperature T = 293◦K,
∆ ≈ 0.07 nm.
According to Eq. (6.4), the frequency ω(m) of the mth azimuthal mode depends linearly
on the droplet eccentricity e. Thus, a change in e leads to a corresponding change in ω(m):
dω(m) = −ω0
6
[
1− 3m2
l(l + 1)
]
de. (6.13)
Assuming droplet volume conservation upon deformation into a spheroid (i.e. rp r2e = a3), a
shape distortion ∆ in the direction of the droplet polar radius rp is associated with a change
in eccentricity δe:
δe =
1 +1
2
(
a
rp
)3/2
∆
a. (6.14)
For glycerol–water microdroplets supported by a superhydrophobic surface, the droplet
distortion from sphericity is very small (e ≈ 2.2 × 10⁻³) and also ∆/a ≪ 1. Thus, rp ≈ a
and
δe ≈ 3
2
∆
a. (6.15)
Upon substituting (6.15) into (6.13), we obtain a relative frequency spread of the mth mode
position as:dω(m)
ω0= −1
6
[
1− 3m2
l(l + 1)
]
3
2
∆
a. (6.16)
Assuming again l ≫ 1 and |m|≈ l, this simplifies to
dω(m)
ω0=
1
2
∆
a. (6.17)
For the considered values of ∆ = 0.07 nm and a = 130µm, dω(m)/ω0 ≈ 2.7 × 10⁻⁷. As
the amplitude ∆ of the thermally-induced droplet shape fluctuations is much smaller than

Chapter 6: Probing of Ultrahigh Optical Q-factors of Individual Liquid Microdroplets in Air UsingTapered Optical Fiber Waveguides 64
the static droplet deformation due to gravity and contact line pinning ∆g ≈ ea ≈ 286 nm,
degeneracy-lifted azimuthal modes of thermally-vibrating droplets remain well resolved and
do not mix with each other [105].
Thermal fluctuations of the droplet shape typically occur in the frequency range of ∼ 105
Hz. On the other hand, spectroscopic characterization of the droplet WGMs using a tapered
fiber and a narrow–linewidth tunable laser was carried out on the time scale of ∼1 s. Hence,
the spectral measurement detects an ”effective” width of the WGM given by (6.17). This
in turn corresponds to an effective quality factor Qeff
Qeff =ω0
dω(m)=
2a
∆≈ 3.7× 10⁶. (6.18)
It is this value of Qeff (and not the intrinsic quality factor of the modes set by the value
of Qmat in our system) which represents an upper limit on the quality factors measurable
with the current experimental setup. This finding is consistent with the experimental data
presented in Figs. 6.4 and 6.5.
6.5 Conclusion
In this article, we have presented systematic experimental characterization of ultrahigh-Q
resonant modes (WGMs) of liquid microdroplets surrounded by air. To this end, we have
deposited the droplets of glycerol-water mixture on superhydrophobic surfaces with high
contact angles and used light coupling from a tapered optical fiber waveguide to record the
droplet WGM spectra. The measured Q-factors exceeded 106 and were stable on the time
scale of an hour. We have shown that slight residual deformations of the droplet shape
due to the presence of the superhydrophobic surface with the contact angle smaller than
180 degrees do not represent a restriction in the ultrahigh-Q spectroscopic measurements.
Despite the high experimental values of the Q-factor, we have not reached the fundamental
limit set by the light absorption in the droplets; our measurements have been limited by
the thermally-induced shape fluctuations of the droplets. Even though the stability of the
droplet size in air has been greatly improved by controlling the humidity of the ambient
atmosphere, some residual drift of the droplet radius has been observed. This issue can be
further improved by active photothermal control of the droplet size [93]. The experimental
configuration involving a superhydrophobic surface has allowed for the first time prolonged

Chapter 6: Probing of Ultrahigh Optical Q-factors of Individual Liquid Microdroplets in Air UsingTapered Optical Fiber Waveguides 65
spectroscopic measurements on individual liquid droplets in air and simplified significantly
efficient phase-matched light coupling into the droplets. Hence, it represents a well-suited
platform for characterizing liquid-based micro-optical components.

Chapter 7: Size Stabilization of Surface-supported Liquid Aerosols Using Tapered Optical FiberCoupling 66
Chapter 7
SIZE STABILIZATION OF SURFACE-SUPPORTED LIQUID
AEROSOLS USING TAPERED OPTICAL FIBER COUPLING
7.1 Introduction1
Liquid aerosol research is important for a large variety of fields including atmospheric chem-
istry and physics, combustion science, plasma physics, and health science [106, 107]. Such
studies require experimental tools for simultaneous manipulation and high-resolution char-
acterization of individual liquid aerosol particles. This is a challenging task due to the
airborne nature of aerosols which makes them difficult to localize and renders their chemi-
cal and physical properties (e.g. composition, size, and mixing state) very sensitive to the
composition and temperature of the surrounding gas. Localization of liquid aerosols has
been up to date successfully achieved with various approaches including the use of optical
levitation [6], electrodynamic levitation [108], acoustic levitation [109], optical tweezers [7],
and superhydrophobic surfaces [4]. In contrast, precise size stabilization is still an unresolved
issue that limits prolonged studies of individual liquid aerosol particles. Currently, size sta-
bilization of liquid aerosols is mostly accomplished by adding non-volatile components (e.g.
inorganic salt or glycerol) into their composition and keeping them in chambers with fixed
environmental conditions. This approach, however, is insufficient for high-resolution aerosol
characterization due to the difficulties in precise control of the environmental conditions
leading to size instabilities of the liquid aerosol particles.
Recently, an alternative method for self-stabilization of the size of aqueous microdroplets
based on heating with a free-space propagating laser beam has been demonstrated and
successfully applied to microdroplets immobilized on a superhydrophobic (SH) surface [110,
111] or by optical tweezers [112]. In these demonstrations, stable locking of the droplet size
resulted from the competition between droplet growth due to the condensation in a high-
1This work has been published in ”Size-stabilization of surface-supported liquid aerosols using taperedoptical fiber coupling”, Opt. Lett. 38 (5), 793-795 (2013)

Chapter 7: Size Stabilization of Surface-supported Liquid Aerosols Using Tapered Optical FiberCoupling 67
humidity chamber and shrinkage due to the evaporation caused by resonant absorption of the
heating laser light either directly by water [111, 112] or by a dissolved fluorescent dye [110].
The stability of the droplet size was characterized by monitoring the spectral positions of
the droplet whispering gallery modes (WGMs) via fluorescence spectroscopy [110, 111] or
Raman spectroscopy [112].
Here, we demonstrate long-term size-stabilization of individual microdroplets standing
on a SH surface and coupled to single tapered optical fibers which guide simultaneously a
tunable red laser for the WGM probing [113] and an infrared (IR) heating laser. The use
of a tapered optical fiber for coupling both lasers into the droplets increases significantly
the coupling efficiency in comparison to the free-space arrangement adopted previously [10].
Moreover, droplet size stabilization and high-resolution WGM spectroscopy can be carried
out concurrently, with almost no increase in the setup complexity. We note that self-
stabilization of a solid microcavity coupled to a tapered fiber has been previously shown [114]
using cavity expansion and refractive index change caused by laser heating as the underlying
physical mechanisms.
7.2 Theory of Size-stabilization
Laser-induced heating of droplets depends strongly on the droplet radius a. When a is in
resonance with the heating laser wavelength (λH), light absorption and associated heating
can increase by several orders of magnitude. As shown by Karadag et al. [111], the size of a
growing droplet that is initially out of resonance with heating laser WGMs can be stabilized
at a certain size parameter αS = 2πaS/λH at which the water evaporation and condensation
precisely balance each other; this αS is slightly blue-detuned with respect to a WGM of the
heating laser. Upon reaching αS , further increase of size above aS tunes the droplet closer
to the absorption resonance. This in turn causes increased heating which drives the droplet
back to αS . Similarly, decrease of size with respect to aS leads to a stronger condensation
since the heating power decreases farther from the resonance. Again, the droplet is driven
back to αS . This mechanism then leads to the self-locking of the droplet size.

Chapter 7: Size Stabilization of Surface-supported Liquid Aerosols Using Tapered Optical FiberCoupling 68
7.3 Experimental Setup
The experimental setup and procedures used for the size stabilization of surface-supported
liquid microdroplets were similar to those described in Ref. [113]. SH surfaces were prepared
by spin coating of hydrophobic silica nanoparticles suspended in isopropanol on cleaned glass
substrates. Subsequently, individual microdroplets of aqueous solution of MgCl2 (initial
concentration 2 mM) with a typical radius a = 245µm were manually deposited on the
SH surface with a glass microcapillary. A fiber taper manufactured from a single-mode
optical fiber optimized for 633 nm by heat-and-pull technique served to couple both probe
and heating lasers into and out of the microdroplet [113, 10]. An XYZ piezo-stage was
used to position the taper within the proximity of the droplet to allow light coupling. The
microdroplet deposited on the SH surface was kept in a sealed chamber with its relative
humidity fixed at 84% by a saturated water solution of KCl.
Microdroplet
Superhydrophobic surface
Tapered
fiber
PD2
PD1
Tunable laser2x2 Fused
coupler
x
y
z
Heating laser
VNDIR filter
IR filter
Figure 7.1: Experimental setup for size-stabilization of surface-supported liquid micro-droplets. PD1 (PD2) – photodetectors monitoring the light power at the input (output) ofthe tapered fiber.
A tunable probe laser (λP = 638 nm, tuning range 0.056 nm, linewidth < 300 kHz)
and a fixed wavelength heating laser (λH = 1064 nm, linewidth < 17 MHz) were combined
in the same tapered fiber using a fused fiber coupler(see Fig. 7.1) . In order to minimize

Chapter 7: Size Stabilization of Surface-supported Liquid Aerosols Using Tapered Optical FiberCoupling 69
the absorption of the tunable probe laser light in the droplet liquid, we performed the
measurements in the visible part of the spectrum where water is virtually non-absorbing.
In contrast, the heating laser wavelength was selected to be in the IR region where water
absorption is more than two orders of magnitude larger than that at visible wavelengths.
7.4 Results
600
500
400
300
200
100
0
Tim
e [s]
(a)
Locking #1
Locking #2
Locking beam off
1.0
0.8
0.6
0.4
0.2
0.0Ta
pe
r tr
an
sm
issio
n
635.60635.56635.52635.48
Wavelength [nm]
(b)
Locking #1Locking #2
Figure 7.2: (a) 2-D plot of consecutive WGM spectra of a droplet stabilized by IR laserheating. At time t = 410 s, the heating laser was blocked during 10 spectral acquisitionsand then unblocked again, resulting in a change of the stabilized droplet size. (b) Detailsof the droplet WGM spectra along the dash-dotted and dashed lines shown in (a). Dropletsize was 245µm
Fig. 7.2(a) shows a two-dimensional (2-D) plot of consecutive WGM spectra recorded
from a microdroplet exhibiting size-locking. Laser powers used in this experiment were
measured at the output of the fiber taper as 16.5 µW and 0.35 mW for the probe and
heating lasers, respectively. Average acquisition time of an individual spectrum (a single
horizontal line in the image) was 2.064 s. Prior to the spectrum acquisition, the microdroplet

Chapter 7: Size Stabilization of Surface-supported Liquid Aerosols Using Tapered Optical FiberCoupling 70
was prepared at 73% ambient relative humidity and then placed in a closed sample chamber
with humidity fixed at 84%. Hence, upon chamber loading, microdroplet growth due to the
gradual condensation was observed. Results shown in Fig. 7.2 were recorded immediately
after the chamber loading, before the microdroplet reached its equilibrium size. For times
t < 410 s, both the probe and the heating lasers were coupled to the tapered fiber. During
this period, spectral positions of the WGMs remained virtually constant with only a small
red shift ∆λ = 3.1 pm over the total acquisition time. This slow spectral shift can be
attributed to the gradual increase of the chamber relative humidity towards its saturation
value. With higher humidity, the condensation rate increases and, thus, new equilibrium
between evaporation and condensation is established at a slightly longer wavelength closer
to the heating beam resonance. ∆λ can be converted into the residual drift of the droplet
radius ∆a as ∆a = ∆λ(a/λP ) [113]. For a = 245µm and λP = 638 nm, ∆a = 1.2 nm. For
times 410 s < t < 430 s, the heating laser was blocked which resulted in a large spectral
drift of the droplet WGMs towards the red end of the spectrum due to condensation in the
chamber. Subsequently, the heating laser was unblocked again, starting at time t = 430
s until the final acquisition time t = 635 s. During this period, spectral positions of the
WGMs were again almost constant, suggesting size-stabilization of the microdroplet with
a similar rate of the residual drift of the droplet size as in the first locking period. We
note that the spectral positions of the WGMs during the first (t = 〈0− 410〉 s) and second
(t = 〈430− 635〉 s) size-stabilized periods are not the same (see Fig. 7.2(b)). This indicates
locking of the microdroplet to different absorption resonances of the heating laser which
correspond to different droplet sizes.
In order to study the dynamics of the droplet self-stabilization after a sudden change of
environmental conditions, we carried out experiments in which we periodically modulated
the heating laser power and monitored the droplet response. Figs. 7.3 and 7.4 provide an
illustration of the droplet size-locking dynamics. In Fig. 7.3(a), a low-Q WGM spectrum
of a size-stabilized droplet is shown (Q ≈ 2.1 × 10⁵). After acquiring this spectrum, the
probe laser was tuned to the droplet WGM wavelength indicated by an arrow in Fig. 7.3(a).
Subsequently, the heating laser was repeatedly blocked for 100 ms and then unblocked again
and the taper transmission was simultaneously recorded at the fixed WGM wavelength.
The time trace of the recorded taper transmission is shown in Fig. 7.3(b). In the time
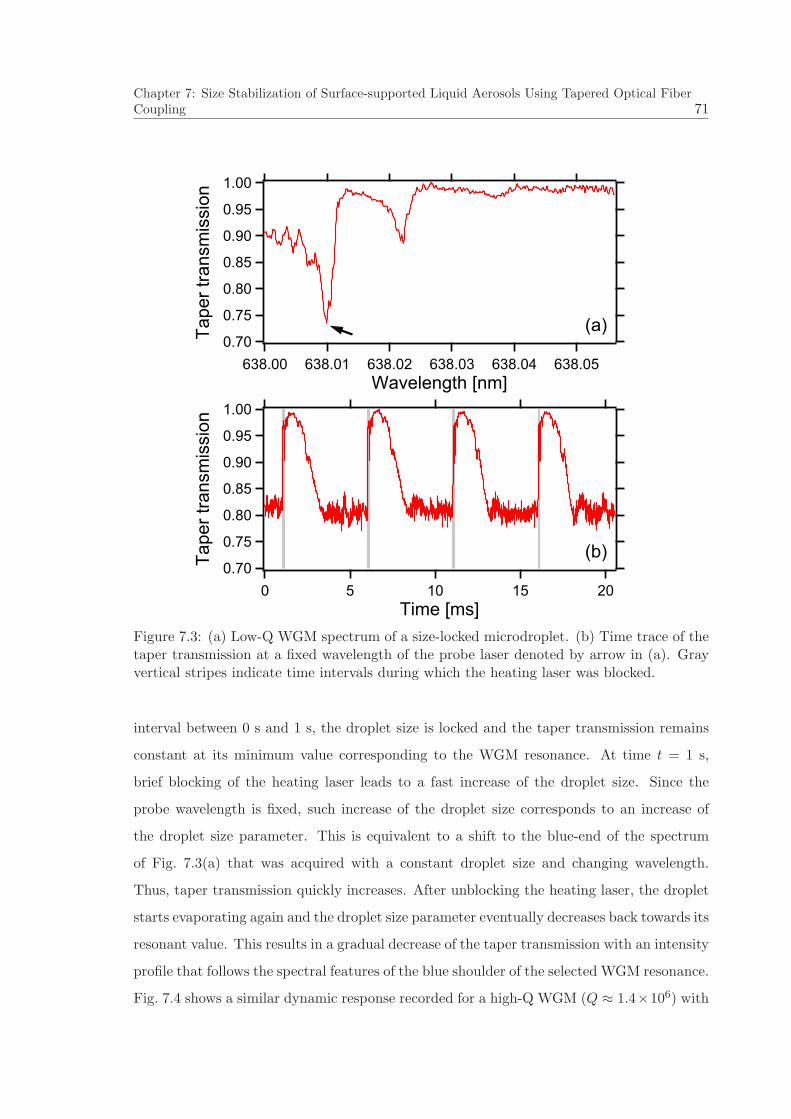
Chapter 7: Size Stabilization of Surface-supported Liquid Aerosols Using Tapered Optical FiberCoupling 71
1.00
0.95
0.90
0.85
0.80
0.75
0.70
Ta
pe
r tr
an
sm
issio
n
638.05638.04638.03638.02638.01638.00
Wavelength [nm]
(a)
1.00
0.95
0.90
0.85
0.80
0.75
0.70
Ta
pe
r tr
an
sm
issio
n
20151050
Time [ms]
(b)
Figure 7.3: (a) Low-Q WGM spectrum of a size-locked microdroplet. (b) Time trace of thetaper transmission at a fixed wavelength of the probe laser denoted by arrow in (a). Grayvertical stripes indicate time intervals during which the heating laser was blocked.
interval between 0 s and 1 s, the droplet size is locked and the taper transmission remains
constant at its minimum value corresponding to the WGM resonance. At time t = 1 s,
brief blocking of the heating laser leads to a fast increase of the droplet size. Since the
probe wavelength is fixed, such increase of the droplet size corresponds to an increase of
the droplet size parameter. This is equivalent to a shift to the blue-end of the spectrum
of Fig. 7.3(a) that was acquired with a constant droplet size and changing wavelength.
Thus, taper transmission quickly increases. After unblocking the heating laser, the droplet
starts evaporating again and the droplet size parameter eventually decreases back towards its
resonant value. This results in a gradual decrease of the taper transmission with an intensity
profile that follows the spectral features of the blue shoulder of the selected WGM resonance.
Fig. 7.4 shows a similar dynamic response recorded for a high-Q WGM (Q ≈ 1.4×10⁶) with

Chapter 7: Size Stabilization of Surface-supported Liquid Aerosols Using Tapered Optical FiberCoupling 72
1.00
0.96
0.92
0.88
Ta
pe
r tr
an
sm
issio
n
638.05638.04638.03638.02638.01638.00
Wavelength [nm]
(a)
1.00
0.96
0.92
0.88
Ta
pe
r tr
an
sm
issio
n
20151050
(b)
1.00
0.96
0.92
0.88
Ta
pe
r tr
an
sm
issio
n
111098765
Time [s]
(c)
Figure 7.4: (a) High-Q WGM spectrum of a size-locked microdroplet. (b) Time trace ofthe taper transmission at a fixed wavelength of the probe laser denoted by arrow in (a).Gray vertical stripes indicate time intervals during which the heating laser was blocked. (c)Detail of the time trace shown in (b).
a largely lifted degeneracy of the different azimuthal modes (see Fig. 7.4(a)). In this case,
the temporal profile of the taper transmission is rather complex, reflecting again the shape

Chapter 7: Size Stabilization of Surface-supported Liquid Aerosols Using Tapered Optical FiberCoupling 73
of the spectrum in the blue shoulder of the selected WGM resonance. Indeed, the depths
of individual spectral dips observed in the wavelength scan and the time trace (compare
corresponding dip numbers in Figs. 7.4(a) and (c)) are in a good agreement. As shown
in Figs. 7.3(b) and 7.4(b) upon repeated blocking of the heating laser, the shape of the
temporal response remains almost constant. This indicates that the whole process is fully
reversible.
7.5 Conclusion
We have demonstrated long-term self-stabilization of the size of salt-water microdroplets
standing on a superhydrophobic surface and coupled to a tapered optical fiber guiding inde-
pendent probe and heating lasers. The size self-stabilization resulted from the competition
between resonant heating of the droplets by an infrared laser and water condensation in
ambient environment with controlled relative humidity. Thanks to the narrow linewidth of
the heating laser, stabilization of the microdroplet radius with a precision down to ∼1.2 nm
was achieved. This technique can be useful for ultrahigh-resolution characterization of liq-
uid aerosols and applications of liquid optical microcavities which require size stabilization
such as frequency combs [115].
Chapter 8: Controlling WGMs of Surface-supported Liquid Aerosols 74
Chapter 8
CONTROLLING WGMS OF SURFACE-SUPPORTED LIQUID
AEROSOLS
8.1 Introduction
Liquid aerosols represent unique optical resonant microcavities that hold potential for many
fields of research because of their high Q-factors and low mode volumes [85]. However,
the use of droplet-based optical resonators in some applications which require controllable
high resolution tuning and/or stabilization of high-Q whispering gallery modes (WGM) of
the resonator (for example, sensing and cavity-quantum electrodynamics experiments), is
challenging [116]. Recently, spectral tuning of WGMs of dye-doped droplets standing on a
superhydrophobic surface by evaporation/condensation [93] and electric field [117] has been
demonstrated. In these experiments, spectral positions and Q-factors of the droplet WGMs
were determined from far-field fluorescence spectra. However, due to the limited resolution
of optical spectroscopy, it was not possible to observe and control the spectral positions
of high-Q modes with sufficient precision. In order to overcome this problem, we have
recently introduced prolonged self-stabilization and high-resolution WGM characterization
of single microdroplets standing on a superhydrophobic surface using a fixed wavelength
heating infrared (IR) laser and tunable red probe laser which were coupled to the droplet
with a tapered optical fiber waveguide [118]. In this chapter, we follow up on the previous
stabilization experiments and demonstrate controllable tuning of WGMs of self-stabilized
surface-supported liquid aerosol using a tunable IR heating laser which has a very narrow
linewidth.
8.2 Experimental Setup
The experimental setup used for the size tuning and high-resolution spectroscopy of surface-
supported liquid microdroplets is shown in Fig. 8.1. Superhydrophobic (SH) surfaces were
prepared by spin coating of hydrophobically coated silica nanoparticles which were dissolved
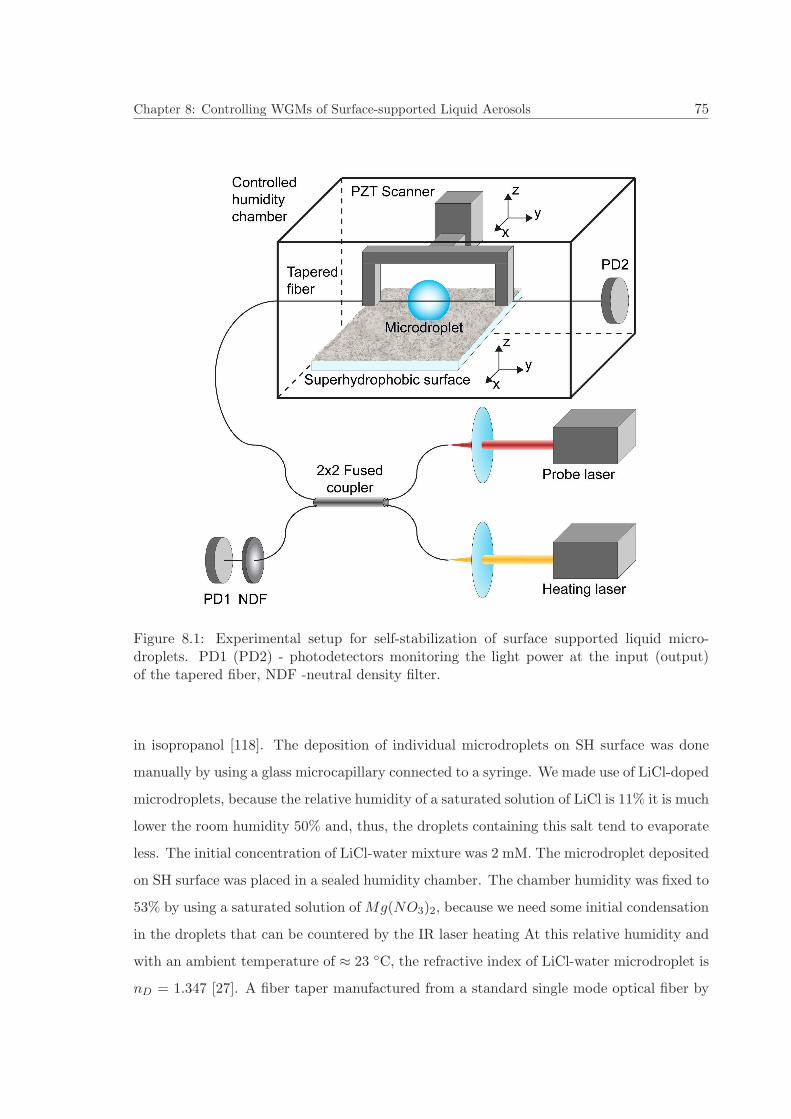
Chapter 8: Controlling WGMs of Surface-supported Liquid Aerosols 75
Figure 8.1: Experimental setup for self-stabilization of surface supported liquid micro-droplets. PD1 (PD2) - photodetectors monitoring the light power at the input (output)of the tapered fiber, NDF -neutral density filter.
in isopropanol [118]. The deposition of individual microdroplets on SH surface was done
manually by using a glass microcapillary connected to a syringe. We made use of LiCl-doped
microdroplets, because the relative humidity of a saturated solution of LiCl is 11% it is much
lower the room humidity 50% and, thus, the droplets containing this salt tend to evaporate
less. The initial concentration of LiCl-water mixture was 2 mM. The microdroplet deposited
on SH surface was placed in a sealed humidity chamber. The chamber humidity was fixed to
53% by using a saturated solution ofMg(NO3)2, because we need some initial condensation
in the droplets that can be countered by the IR laser heating At this relative humidity and
with an ambient temperature of ≈ 23 ◦C, the refractive index of LiCl-water microdroplet is
nD = 1.347 [27]. A fiber taper manufactured from a standard single mode optical fiber by
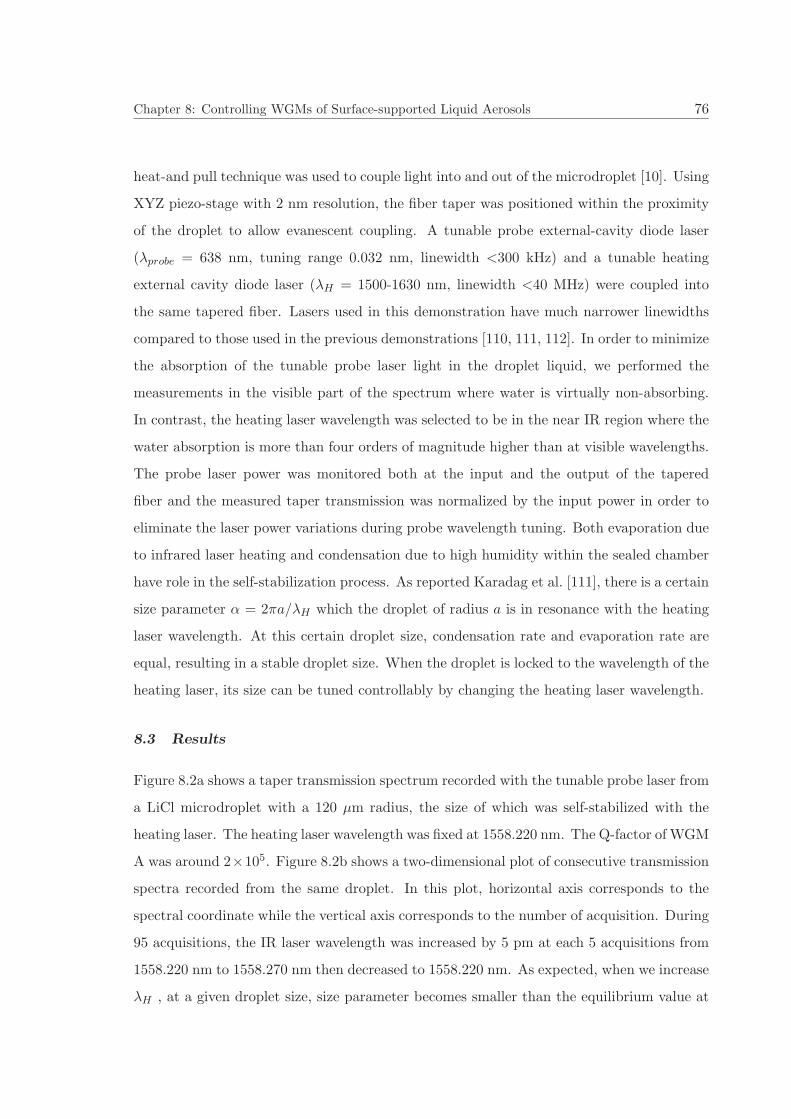
Chapter 8: Controlling WGMs of Surface-supported Liquid Aerosols 76
heat-and pull technique was used to couple light into and out of the microdroplet [10]. Using
XYZ piezo-stage with 2 nm resolution, the fiber taper was positioned within the proximity
of the droplet to allow evanescent coupling. A tunable probe external-cavity diode laser
(λprobe = 638 nm, tuning range 0.032 nm, linewidth <300 kHz) and a tunable heating
external cavity diode laser (λH = 1500-1630 nm, linewidth <40 MHz) were coupled into
the same tapered fiber. Lasers used in this demonstration have much narrower linewidths
compared to those used in the previous demonstrations [110, 111, 112]. In order to minimize
the absorption of the tunable probe laser light in the droplet liquid, we performed the
measurements in the visible part of the spectrum where water is virtually non-absorbing.
In contrast, the heating laser wavelength was selected to be in the near IR region where the
water absorption is more than four orders of magnitude higher than at visible wavelengths.
The probe laser power was monitored both at the input and the output of the tapered
fiber and the measured taper transmission was normalized by the input power in order to
eliminate the laser power variations during probe wavelength tuning. Both evaporation due
to infrared laser heating and condensation due to high humidity within the sealed chamber
have role in the self-stabilization process. As reported Karadag et al. [111], there is a certain
size parameter α = 2πa/λH which the droplet of radius a is in resonance with the heating
laser wavelength. At this certain droplet size, condensation rate and evaporation rate are
equal, resulting in a stable droplet size. When the droplet is locked to the wavelength of the
heating laser, its size can be tuned controllably by changing the heating laser wavelength.
8.3 Results
Figure 8.2a shows a taper transmission spectrum recorded with the tunable probe laser from
a LiCl microdroplet with a 120 µm radius, the size of which was self-stabilized with the
heating laser. The heating laser wavelength was fixed at 1558.220 nm. The Q-factor of WGM
A was around 2×10⁵. Figure 8.2b shows a two-dimensional plot of consecutive transmission
spectra recorded from the same droplet. In this plot, horizontal axis corresponds to the
spectral coordinate while the vertical axis corresponds to the number of acquisition. During
95 acquisitions, the IR laser wavelength was increased by 5 pm at each 5 acquisitions from
1558.220 nm to 1558.270 nm then decreased to 1558.220 nm. As expected, when we increase
λH , at a given droplet size, size parameter becomes smaller than the equilibrium value at

Chapter 8: Controlling WGMs of Surface-supported Liquid Aerosols 77
638 638.005 638.01 638.015 638.02 638.025 638.030.4
0.6
0.8
1
Nor
mal
ized
Inte
nsity
(a.
u.)
Wavelength(nm)
638 638.005 638.01 638.015 638.02 638.025 638.03
20
40
60
80
Acq
uisi
tion
num
ber
Wavelength(nm)
(b)
(a)
WGM A
Figure 8.2: (a) WGM spectrum of a stabilized droplet recorded at a fixed wavelength of theheating laser. (b) 2D consecutive WGM spectra of the same droplet recorded for increasing(frames 1 to 50) and decreasing (frames 51 to 95) wavelength of the heating laser.
which condensation is balanced by evaporation. Thus, absorption decreases (we tune the
droplet away from the resonance), condensation dominates, and the droplet grows in size.
Intuitively, for a larger heating laser wavelength, we need a bigger droplet to fit the same
number of wavelengths along the droplet perimeter in resonance. This size increase leads
to a red-shift in spectral positions of WGMs of both heating and probe laser beams.
∆λprobeλprobe
=∆λHλH
=∆a
a(8.1)
According to Eq. 8.1, 50 pm heating laser wavelength tuning (∆λH) reveals 20.5 pm
probe laser wavelength tuning (∆λprobe). As seen in Fig. 8.2, the red-shift of WGM A
is around 20 pm during heating laser wavelength tuning. This result agrees well with the
calculated value. However, there is a discrepancy between initial and final spectral positions
of WGMs, after completing one tuning cycle. This spectral position difference was attributed

Chapter 8: Controlling WGMs of Surface-supported Liquid Aerosols 78
to the change of the droplet contact angle during evaporation [119] and wavelength accuracy
of the heating laser.
10 20 30 40 50 60 70 80 90 1000.2
0.4
0.6
0.8
1
1.2
Inte
nsity
(a.u
.)
Number of steps
Figure 8.3: Tapered fiber transmission spectra from a self-stabilized droplet during forwardand backward tuning of the heating laser wavelength λH . Probe laser wavelength was fixedat λprobe = 638 nm.
Figure 8.3 shows normalized transmission intensity of the tapered fiber recorded during
λH tuning cycle at a fixed λprobe as a function of the number of tuning steps. The wavelength
scan of λH was between 1550 nm and 1549 nm in 0.01 nm steps. Scanning of λH causes
changes of the droplet size; if λprobe is fixed, these size changes result in the modulation of
the taper transmission as the droplets is gradually tuned in and out of resonance with λH .
According to Eq. 8.1, 1 nm scan corresponds to 80 nm change in droplet radius. Despite this
large radius change, spectral positions of WGMs during the forward and backward parts
of the tuning cycle were almost preserved as shown in Fig. 8.3. The intensity difference of
the same WGM between backward and forward scan indicates that the coupling efficiency
between droplet and tapered fiber was different. According to asymptotic formula of Chylek
et al. [120], free spectral range (FSR) of a 120 µm radius droplet for 1550 nm was calculated
as 2.59 nm. Thus, in our 1 nm scan of the heating laser wavelength, we did not observe

Chapter 8: Controlling WGMs of Surface-supported Liquid Aerosols 79
periodically repeating WGM structure from which FSR could be determined.
8.4 Conclusion
As a conclusion, we have demonstrated controllable tuning of high-QWGMs of self-stabilized
droplet sustained on a superhydrophobic surface. It is possible to use this technique to ob-
tain droplet-based tunable frequency combs [121] and add-drop filters [122].

Chapter 9: Conclusion 80
Chapter 9
CONCLUSION
In this thesis, ultrahigh Q-factors of microdroplets standing on superhydropbobic sur-
face were investigated as a tool for optofluidic applications. First, to gain a better under-
standing, basic properties of the microsphere microcavity were summarized. The resonance
wavelengths of the microsphere, which were the solutions of Maxwell equations fulfilling
boundary conditions at the sphere surface were calculated.
In the following chapter, superhydrophobic surface preparation was explained. Then
lumped system formulation of the mass and heat transfer between the microdroplet and
the chamber was given. The modified absorption efficiency (Qabs) of a spherical parti-
cle suspended in air was calculated using the localized approximation to the beam-shape
coefficients in generalized Lorenz-Mie theory.
Initial experiments were done by using free-space excitation of WGMs in surface-supported
microdroplets. A novel method for the microscopic contact angle measurement was pre-
sented that is based on the analysis of mechanical resonances of individual micrometer–
sized liquid droplets supported by a vibrated SH surface or oscillatory deformations of
micrometer-sized NaCl-water droplets by an AC electric field. In addition to that a QPD
(quadrant photodiode) instead of optical spectroscopy of WGMs was used to analyze the
mechanical resonances of microdroplets standing on a superhydrophobic surface.
A sub-micron tapered optical fiber waveguide was manufactured to couple light from
a narrow-linewidth tunable laser into an individual surface-supported droplet of glycerol-
water mixture and measured the fiber transmission as a function of the laser wavelength
was measured. Linewidth-based measurements of ultrahigh-Q factors of individual optical
resonances excited in liquid microdroplets were reported.
Long-term size-stabilization resulting from balance between the condensation in a high-
humidity chamber and shrinkage due to the evaporation of individual microdroplets standing
on a SH surface and coupled to single tapered optical fibers which guide simultaneously a

Chapter 9: Conclusion 81
tunable red laser for the WGM probing and an infrared (IR) heating laser was achieved. In
addition to self-stabilization we demonstrated controllable tuning of WGMs of self-stabilized
surface-supported liquid aerosol using a tunable IR heating laser which has a very narrow
linewidth. Fine control of WGMs of microdroplets can has potential applications in chemical
and biological sensing and also in frequency comb generation.

Bibliography 82
BIBLIOGRAPHY
[1] D. Psaltis, S. R. Quake, and C. Yang, “Developing optofluidic technology through the
fusion of microfluidics and optics,” Nature 442, 381–386 (2006).
[2] M. Li and C. K. Ober, “Block copolymer patterns and templates,” Materials Today
9, 30–39 (2006).
[3] M. H. Fields, J. Popp, and R. K. Chang, “Nonlinear optics in microspheres,” in
“Progress in Optics,” , vol. 41, E. Wolf, ed. (Elsevier, 2000), pp. 1–95.
[4] A. Kiraz, A. Kurt, M. A. Dundar, and A. L. Demirel, “Simple largely tunable optical
microcavity,” Appl. Phys. Lett. 89, 081118 (2006).
[5] S. Arnold, M. Neuman, and A. B. Pluchino, “Molecular spectroscopy of a single aerosol
particle,” Opt. Lett. 9, 4–6 (1984).
[6] A. Ashkin and J. M. Dziedzic, “Optical levitation of liquid drops by radiation pres-
sure,” Science 187, 1073 (1975).
[7] R. J. Hopkins, L. Mitchem, A. D. Ward, and J. P. Reid, “Control and characterisation
of a single aerosol droplet in a single-beam gradient-force optical trap,” Phys. Chem.
Chem. Phys. 6, 4924 (2004).
[8] T. A. Birks and Y. W. Li, “The shape of fiber tapers,” J. Lightwave Technol. 10,
432–438 (1992).
[9] A. Serpenguzel, J. C. Swindal, R. K. Chang, and W. P. Acker, “Two-dimensional
imaging of sprays with fluorescence, lasing, and stimulated Raman scattering,” Appl.
Opt. 31, 3543–3551 (1992).

Bibliography 83
[10] J. C. Knight, G. Cheung, F. Jacques, and T. A. Birks, “Phase-matched excitation
of whispering-gallery-mode resonances by a fiber taper,” Opt. Lett. 22, 1129–1131
(1997).
[11] Y. Karadag, “Spectral tuning of liquid microdroplets standing on a superhydropho-
bic surface by using a focused infrared laser or electrowetting,” Master’s thesis, Koc
Universty (2009).
[12] M. A. Dundar, “Inducing a novel optical microcavity: A glycerol/water microdroplet
on a superhydrophobic surface,” Master’s thesis, Koc Universty (2007).
[13] A. Checco, P. Guenoun, and J. Daillant, “Nonlinear dependence of the contact angle
of nanodroplets on contact line curvature,” Phys. Rev. Lett. 91, 186101 (2003).
[14] H. Azzouz, “Liquid droplet dye laser,” Master’s thesis, Technical Universty of Den-
mark (2005).
[15] G. Grehan, B. Maheu, and G. Gouesbet, “Scattering of laser beams by mie scatter
centers: numerical results using a localized approximation,” Appl. Opt. 25, 3539–3548
(1986).
[16] J. A. Lock, “Improved gaussian beam-scattering algorithm,” Appl. Opt. 34, 559–570
(1995).
[17] J. A. Lock, “Excitation efficiency of a morphology-dependent resonance by a focused
gaussian beam,” J. Opt. Soc. Am. A 15, 2986–2994 (1998).
[18] A. K. Ray, R. D. Johnson, and A. Souyri, “Dynamic behavior of single glycerol
droplets in humid air streams,” Langmuir 5, 133–140 (1989).
[19] H. Tu and A. K. Ray, “Measurement of activity coefficients from unsteady state
evaporation and growth of microdroplets,” Chem. Eng. Comm. 192, 474–498 (2005).
[20] R. G. Picknett and R. J. Bexon, “The evaporation of sessile or pendant drops in still
air,” J. Colloid Interface Sci. 61, 336–350 (1977).

Bibliography 84
[21] G. McHale, S. Aqil, N. J. Shirtcliffe, M. I. Newton, and H. Y. Erbil, “Analysis
of droplet evaporation on a superhydrophobic surface,” Langmuir 21, 11053–11060
(2005).
[22] S.-X. Qian, J. B. Snow, H. M. Tzeng, and R. K. Chang, “Lasing droplets: Highlighting
the liquid-air interface by laser emission,” Science 231, 486 (1986).
[23] V. V. Datsyuk, “Optics of microdroplets,” J. Mol. Liq. 84, 1308–1316 (2001).
[24] I. N. Tang, A. C. Tridico, and K. H. Fung, “Thermodynamic and optical properties
of sea salt aerosols,” J. Geophys. Res. 102, 23269–23275 (1997).
[25] D. Segelstein, “The complex refractive index of water,” Master’s thesis, University of
Missouri, Kansas City (1981).
[26] E. J. G. Peterman, F. Gittes, and C. F. Schmidt, “Laser-induced heating in optical
traps,” Biophys. J. 84, 1308–1316 (2003).
[27] D. R. Lide, CRC Handbook of Chemistry and Physics, Internet Version 2012,
<http://www.hbcpnetbase.com> (CRC Press, 2012).
[28] G. Gouesbet and J. A. Lock, “Rigorous justification of the localized approximation
to the beam-shape coefficients in generalized lorenz-mie theory. ii. off-axis beams,” J.
Opt. Soc. Am. A 11, 2516–2525 (1994).
[29] J. P. Barton, D. R. Alexander, and S. A. Schaub, “Internal and near-surface electro-
magnetic fields for a spherical particle irradiated by a focused laser beam,” J. Appl.
Phys. 64, 1632–1639 (1988).
[30] J. P. Barton, D. R. Alexander, and S. A. Schaub, “Internal fields of a spherical
particle illuminated by a tightly focused laser beam: Focal point positioning effects
at resonance,” J. Appl. Phys. 65, 2900–2906 (1989).

Bibliography 85
[31] J. A. Lock and G. Gouesbet, “Rigorous justification of the localized approximation
to the beam-shape coefficients in generalized lorenz-mie theory. i. on-axis beams,” J.
Opt. Soc. Am. A 11, 2503–2515 (1994).
[32] M. Nosonovsky and B. Bhushan, “Superhydrophobic surfaces and emerging applica-
tions: Non-adhesion, energy, green engineering,” Curr. Opin. Colloid Interface Sci.
14, 270–280 (2009).
[33] B. Bhushan, “Nanotribology and nanomechanics of mems/nems and
biomems/bionems materials and devices,” Microelectron. Eng. 84, 387–412 (2007).
[34] J. P. Rothstein, “Slip on superhydrophobic surfaces,” Annu. Rev. Fluid Mech. 42,
89–109 (2010).
[35] P. G. de Gennes, “Wetting: statics and dynamics,” Rev. Mod. Phys. 57, 827–863
(1985).
[36] K. K. S. Lau, J. Bico, K. B. K. Teo, M. Chhowalla, G. A. J. Amaratunga, W. I. Milne,
G. H. McKinley, and K. K. Gleason, “Superhydrophobic carbon nanotube forests,”
Nano Lett. 3, 1701–1705 (2003).
[37] C. Journet, S. Moulinet, C. Ybert, S. T. Purcell, and L. Bocquet, “Contact angle
measurements on superhydrophobic carbon nanotube forests: Effect of fluid pressure,”
Europhys. Lett. 71, 104–109 (2005).
[38] Y.-L. Hung, Y.-Y. Chang, M.-J. Wang, and S.-Y. Lin, “A simple method for measur-
ing the superhydrophobic contact angle with high accuracy,” Rev. Sci. Instrum. 81,
065105 (2010).
[39] Y.-T. Cheng, D. E. Rodak, A. Angelopoulos, and T. Gacek, “Microscopic observations
of condensation of water on lotus leaves,” Appl. Phys. Lett. 87, 194112 (2005).
[40] M. Strani and F. Sabetta, “Free vibrations of a drop in partial contact with a solid
support,” J. Fluid Mech. 141, 233–247 (1984).

Bibliography 86
[41] R. W. Smithwick and J. A. M. Boulet, “Vibrations of microscopic mercury droplets
on glass,” J. Colloid Interface Sci. 130, 588–596 (1989).
[42] S. Yamakita, Y. Matsui, and S. Shiokawa, “New method for measurement of contact
angle (droplet free vibration frequency method),” Jpn. J. Appl. Phys. 38, 3127–3130
(1999).
[43] A. Kiraz, Y. Karadag, S. C. Yorulmaz, and M. Muradoglu, “Reversible photother-
mal tuning of a salty water microdroplet,” Phys. Chem. Chem. Phys. 11, 2597–2560
(2009).
[44] X. Noblin, A. Buguin, and F. Brochard-Wyart, “Vibrated sessile drops: Transition
between pinned and mobile contact line oscillations,” Eur. Phys. J. E 14, 395–404
(2004).
[45] F. Celestini and R. Kofman, “Vibration of submillimeter-size supported droplets,”
Phys. Rev. E 73, 041602 (2006).
[46] G. McHale, S. J. Elliott, M. I. Newton, D. L. Herbertson, and K. Esmer, “Levitation-
free vibrated droplets: Resonant oscillations of liquid marbles,” Langmuir 25, 529–533
(2009).
[47] J. D. Eversole, H.-B. Lin, and A. J. Campillo, “Cavity-mode identification of fluores-
cence and lasing in dye-doped microdroplets,” Appl. Opt. 31, 1982–1991 (1992).
[48] J. D. Eversole, H.-B. Lin, and A. J. Campillo, “Input/output resonance correlation
in laser-induced emission from microdroplets,” J. Opt. Soc. Am. B 12, 287 (1995).
[49] M. Y. Yuce, A. L. Demirel, and F. Menzel, “Tuning the surface hydrophobicity of
polymer/nanoparticle composite films in the wenzel regime by composition,” Lang-
muir 21, 5073 (2005).
[50] A. Marmur, “Thermodynamic aspects of contact angle hysteresis,” Adv. Colloid In-
terface Sci. 50, 121–141 (1994).

Bibliography 87
[51] M. Y. Yuce, “Preparation and characterization of hydrophobic surfaces,” Master’s
thesis, Koc University (2006).
[52] S. C. Yorulmaz, M. Mestre, M. Muradoglu, B. E. Alaca, and A. Kiraz, “Controlled
observation of nondegenerate cavity modes in a microdroplet on a superhydrophobic
surface,” Opt. Commun. 282, 3024–3027 (2009).
[53] M. Nosonovsky, “Multiscale roughness and stability of superhydrophobic biomimetic
interfaces,” Langmuir 23, 3157–3161 (2007).
[54] N. J. Shirtcliffe, G. McHale, M. I. Newton, G. Chabrol, and C. C. Perry, “Dual-scale
roughness produces unusually water-repellent surfaces,” Adv. Mater. 16, 1929–1932
(2004).
[55] S. Mettu and M. K. Chaudhury, “Stochastic relaxation of the contact line of a water
drop on a solid substrate subjected to white noise vibration: Roles of hysteresis,”
Langmuir 26, 8131–8140 (2010).
[56] T. S. Meiron, A. Marmur, and I. S. Saguy, “Contact angle measurement on rough
surfaces,” J. Colloid Interface Sci. 274, 637–644 (2004).
[57] E. Bormashenko, R. Pogreb, G. Whyman, and M. Erlich, “Resonance cassie-wenzel
wetting transition for horizontally vibrated drops deposited on a rough surface,” Lang-
muir 23, 12217–12221 (2007).
[58] S. K. Y. Tang, R. Derda, Q. Quan, M. Loncar, and G. M. Whitesides, “Continuously
tunable microdroplet-laser in a microfluidic channel,” Opt. Express 19, 2204–2215
(2011).
[59] A. Jonas, Y. Karadag, N. Tasaltin, I. Kucukkara, and A. Kiraz, “Probing micro-
scopic wetting properties of superhydrophobic surfaces by vibrated micrometer-sized
droplets,” Langmuir 27, 2150–2154 (2011).
[60] S. Torza, R. G. Cox, and S. G. Mason, “Electrohydrodynamic deformation and burst
of liquid drops,” Phil. Trans. R. Soc. A 269, 295–319 (1971).

Bibliography 88
[61] N. Bentenitis and S. Krause, “Droplet deformation in dc electric fields: The extended
leaky dielectric model,” Langmuir 21, 6194–6209 (2005).
[62] R. W. Smithwick and J. A. M. Boulet, “Electrically driven oscillations of a mercury-
droplet electrode,” J. Colloid Interface Sci. 150, 567–574 (1992).
[63] T. Yamada, T. Sugimoto, Y. Higashiyama, M. Takeishi, and T. Aoki, “Resonance
phenomena of a single water droplet located on a hydrophobic sheet under ac electric
field,” IEEE Transactions on Industry Applications 39, 59–65 (2003).
[64] H. A. Haus, Waves and Fields in Optoelectronics (Prentice-Hall, 1984).
[65] G. C. Righini, Y.Dumeige, P. Feron, M. Ferrari, G. N. Conti, D. Ristic, and S. Soria,
“Whispering gallery mode microresonators: Fundamentals and applications,” Rivista
Del Nuovo Cimento 34, 435–488 (2011).
[66] Y. Treussart, V. S. Ilchenko, J. Roch, J. Hare, V. L. Seguin, J. Raimond, and
S. Haroche, “Evidence for intrinsic kerr bistability of high-q microsphere resonators
in superfluid helium,” Eur. Phys. J. D 1, 235–238 (1998).
[67] V. Braginsky, M. Gorodetsky, and V. Ilchenko, “Quality-factor and nonlinear proper-
ties of optical whispering-gallery modes,” Physics Letters A 137, 393–397 (1989).
[68] M. L. Gorodetsky and V. S. Ilchenko, “Optical microsphere resonators: optimal cou-
pling to high-q whispering-gallery modes,” JOSA B 16, 147–154 (1999).
[69] V. S. Ilchenko, X. S. Yao, and L. Maleki, “Pigtailing the high-q microsphere cavity: a
simple fiber coupler for optical whispering-gallery modes,” Optics Letters 24, 723–725
(1999).
[70] M. Cai, O. Painter, and K. J. Vahala, “Observation of critical coupling in a fiber taper
to a silica-microsphere whispering-gallery mode system,” Phys. Rev. Lett. 85, 74–77
(2000).

Bibliography 89
[71] A. Boleininger, T. Lake, S. Hami, and C. Vallance, “Whispering gallery modes in stan-
dard optical fibres for fibre profiling measurements and sensing of unlabelled chemical
species,” Sensors 10, 1765–1781 (2010).
[72] K. J. Vahala, “Optical microcavities,” Nature 424, 839 (2003).
[73] T. J. Kippenberg and K. J. Vahala, “Cavity opto-mechanics,” Opt. Express 15, 17172–
17205 (2007).
[74] A. M. Armani, R. P. Kulkarni, S. E. Fraser, R. C. Flagan, and K. J. Vahala,
“Label-free, single-molecule detection with optical microcavities,” Science 317, 783–
787 (2007).
[75] F. Vollmer and S. Arnold, “Whispering-gallery-mode biosensing: label-free detection
down to single molecules,” Nature Methods 5, 591–596 (2008).
[76] P. Chylek, “Resonance structure of Mie scattering: distance between resonances,” J.
Opt. Soc. Am. A 7, 1609–1613 (1990).
[77] J. D. Eversole, H.-B. Lin, A. L. Huston, A. J. Campillo, P. T. Leung, S. Y. Liu,
and K. Young, “High-precision identification of morphology-dependent resonances in
optical processes in microdroplets,” J. Opt. Soc. Am. B 10, 1955–1968 (1993).
[78] H.-B. Lin, A. L. Huston, B. L. Justus, and A. J. Campillo, “Some characteristics of a
droplet whispering-gallery-mode laser,” Opt. Lett. 11, 614–616 (1986).
[79] H. B. Lin, J. D. Eversole, and A. J. Campillo, “Spectral properties of lasing micro-
droplets,” J. Opt. Soc. Am. B 9, 43–50 (1992).
[80] A. Kiraz, A. Sennaroglu, S. Doganay, M. A. Dundar, A. Kurt, H. Kalaycioglu,
and A. L. Demirel, “Lasing from single, stationary, dye-doped glycerol/water mi-
crodroplets located on a superhydrophobic surface,” Opt. Commun. 276, 145–148
(2007).

Bibliography 90
[81] M. Tanyeri, R. Perron, and I. M. Kennedy, “Lasing droplets in a microfabricated
channel,” Opt. Lett. 32, 2529–2531 (2007).
[82] S. K. Y. Tang, Z. Li, A. R. Abate, J. J. Agresti, D. A. Weitz, D. Psaltis, and G. M.
Whitesides, “A multi-color fast-switching microfluidic droplet dye laser,” Lab Chip 9,
2767–2771 (2009).
[83] J. B. Snow, S.-X. Qian, and R. K. Chang, “Stimulated Raman scattering from indi-
vidual water and droplets at morphology-dependent resonances,” Opt. Lett. 10, 37–39
(1985).
[84] H. B. Lin, J. D. Eversole, and A. J. Campillo, “Continuous-wave stimulated Raman
scattering in microdroplets,” Opt. Lett. 17, 828–830 (1992).
[85] R. Symes, R. M. Sayer, and J. P. Reid, “Cavity enhanced droplet spectroscopy: Prin-
ciples, perspectives and prospects,” Phys. Chem. Chem. Phys. 6, 474–487 (2004).
[86] A. Sennaroglu, A. Kiraz, M. A. Dundar, A. Kurt, and A. L. Demirel, “Raman lasing
near 630 nm from stationary glycerol-water microdroplets on a superhydrophobic
surface,” Opt. Lett. 32, 2197–2199 (2007).
[87] Y. Karadag, M. Gundogan, M. Y. Yuce, H. Cankaya, A. Sennaroglu, and A. Kiraz,
“Prolonged Raman lasing in size-stabilized salt-water microdroplets on a superhy-
drophobic surface,” Opt. Lett. 35, 1995–1997 (2010).
[88] J.-Z. Zhang, D. H. Leach, and R. K. Chang, “Photon lifetime within a droplet: tempo-
ral determination of elastic and stimulated Raman scattering,” Opt. Lett. 13, 270–272
(1988).
[89] S. Arnold and L. M. Folan, “Energy transfer and the photon lifetime within an aerosol
particle,” Opt. Lett. 14, 387–389 (1989).
[90] P. T. Leung and K. Young, “Theory of enhanced energy transfer in an aerosol particle,”
J. Chem. Phys. 89, 2894–2899 (1988).

Bibliography 91
[91] M. Hossein-Zadeh and K. J. Vahala, “Fiber-taper coupling to whispering-gallery
modes of fluidic resonators embedded in a liquid medium,” Opt. Express 14, 10800–
10810 (2006).
[92] F. Orucevic, V. Lefevre-Seguin, and J. Hare, “Transmittance and near-field charac-
terization of sub-wavelength tapered optical fibers,” Opt. Express 15, 13624–13626
(2007).
[93] A. Kiraz, Y. Karadag, and M. Muradoglu, “Large spectral tuning of a water/glycerol
microdroplet by a focused laser: Characterization and modeling,” Phys. Chem. Chem.
Phys. 10, 6446–6454 (2008).
[94] M. Born and E. Wolf, Principles of Optics: Electromagnetic Theory of Propagation,
Interference and Diffraction of Light (Cambridge University Press, 1999), 7th ed.
[95] P. Chylek, “Partial-wave resonances and the ripple structure in the Mie normalized
exctinction cross section,” J. Opt. Soc. Am. 66, 285–287 (1976).
[96] J. C. Waters, “Accuracy and precision in quantitative fluorescence microscopy,” J.
Cell Biol. 185, 1135–1148 (2012).
[97] H. M. Lai, P. T. Leung, K. Young, P. W. Barber, and S. C. Hill, “Time–independent
perturbation for leaking electromagnetic modes in open systems with application to
resonances in microdroplets,” Phys. Rev. A 41, 5187–5198 (1990).
[98] G. Chen, M. M. Mazumder, Y. R. Chemla, A. Serpenguzel, R. K. Chang, and S. C.
Hill, “Wavelength variation of laser emission along the entire rim of slightly deformed
microdroplets,” Opt. Lett. 18, 1993–1995 (1993).
[99] V. A. Lubarda and K. A. Talke, “Analysis of the equilibrium droplet shape based on
an ellipsoidal droplet model,” Langmuir 27, 10705–10713 (2011).
[100] S. Arnold, R. Ramjit, D. Keng, V. Kolchenko, and I. Teraoka, “Microparticle photo-
physics illuminates viral bio-sensing,” Faraday Discuss. 137, 65–83 (2008).

Bibliography 92
[101] M. L. Gorodetsky, A. A. Savchenkov, and V. S. Ilchenko, “Ultimate Q of optical
microsphere resonators,” Opt. Lett. 21, 453–455 (1996).
[102] H. M. Lai, C. C. Lam, P. T. Leung, and K. Young, “Effect of perturbations on the
widths of narrow morphology–dependent resonance in Mie scattering,” J. Opt. Soc.
Am. B 8, 1962–1973 (1991).
[103] G. M. Hale and M. R. Querry, “Optical constants of water in the 200-nm to 200 um
wavelength region,” Appl. Opt. 12, 555–563 (1973).
[104] L. F. Phillips, “A geometrical explanation for the enhanced small–scale roughness of
a liquid surface,” J. Phys. Chem. B 108, 1986–1991 (2004).
[105] H. M. Lai, P. T. Leung, and K. Young, “Limitations on the photon storage lifetime
in electromagnetic resonances of highly transparent microdroplets,” Phys. Rev. A 41,
5199–5204 (1990).
[106] J. P. Reid and L. Mitchem, “Laser probing of single-aerosol droplet dynamics,” Annu.
Rev. Phys. Chem. 57, 245–271 (2006).
[107] D. McGloin, D. R. Burnham, M. D. Summers, D. Rudd, N. Dewar, and S. Anand,
“Optical manipulation of airborne particles: techniques and applications,” Faraday
Discuss. 137, 335–350 (2008).
[108] S. Arnold and L. M. Folan, “Fluorescence spectrometer for a single electrodynamically
levitated microparticle,” Rev. Sci. Inst. 57, 2250 (1986).
[109] H. Azzouz, L. Alkhafadiji, S. Balslev, J. Johansson, N. A. Mortensen, S. Nilsson, and
A. Kristensen, “Levitated droplet dye laser,” Opt. Express 14, 4374–4379 (2006).
[110] A. Kiraz, A. Kurt, M. A. Dundar, M. Y. Yuce, and A. L. Demirel, “Volume stabi-
lization of single, dye-doped water microdroplets with femtoliter resolution,” J. Opt.
Soc. Am. B 24, 1824–1828 (2007).

Bibliography 93
[111] Y. Karadag, M. Mestre, and A. Kiraz, “Photothermal self-stability and optical bista-
bility of a nacl-water microdroplet on a superhydrophobic surface,” Phys. Chem.
Chem. Phys. 11, 7145–7151 (2009).
[112] M. Guillon, R. E. H. Miles, J. P. Reid, and D. McGloin, “Thermo-optical resonance
locking of an optically trapped salt-water microdroplet,” New J. Phys. 11, 103041
(2009).
[113] A. Jonas, Y. Karadag, M. Mestre, and A. Kiraz, “Probing of ultrahigh optical q-
factors of individual liquid microdroplets on superhydrophobic surfaces using tapered
optical fiber waveguides,” J. Opt. Soc. Am. B 29, 3240–3247 (2012).
[114] T. Carmon, L. Yang, and K. J. Vahala, “Dynamical thermal behavior and thermal
self-stability of microcavities,” Opt. Express 12, 4742–4750 (2004).
[115] P. Del’Haye, A. Schliesser, O. Arcizet, T. Wilken, R. Holzwarth, and T. J. Kippenberg,
“Optical frequency comb generation from a monolithic microresonator,” Nature 450,
1214–1217 (2007).
[116] M. Pllinger, D. O’Shea, F. Warken, and A. Rauschenbeutel, “Ultrahigh-q tunable
whispering-gallery-mode microresonator,” Phys. Rev. Lett. 103, 053901 (2009).
[117] A. Kiraz, Y. Karadag, and A. F. Coskun, “Spectral tuning of liquid microdroplets
standing on a superhydrophobic surface using electrowetting,” Appl. Phys. Lett. 92,
191104 (2008).
[118] Y. Karadag, A. Jonas, I. Kucukkara, and A. Kiraz, “Size-stabilization of surface-
supported liquid aerosols using tapered optical fiber coupling,” Opt. Lett. 38(10),
793–795 (2013).
[119] X. Chen, R. Ma, J. Li, C. Hao, W. Gao, B. L. Luk, S. C. Li, S. Yao, and Z. Wang,
“Evaporation of droplets on superhydrophobic surfaces: Surface roughness and small
droplet size effects,” Phys. Rev. Lett. 109, 116101 (2012).

Bibliography 94
[120] P. Chylek, J. T. Kiehl, and M. K. W. Ko, “Optical levitation and partial-wave reso-
nances,” Physical Review A: Atomic, Molecular, and Optical Physics 18, 2229 (1978).
[121] A. A. Savchenkov, A. B. Matsko, V. S. Ilchenko, I. Solomatine, D. Seidel, and
L. Maleki, “Tunable optical frequency comb with a crystalline whispering gallery
mode resonator,” Phys. Rev. Lett. 101, 093902 (2008).
[122] F. Monifi, J. Friedlein, S. K. Ozdemir, and L. Yang, “A robust and tunable add-drop
filter using whispering gallery mode microtoroid resonator,” Journal of Lightwave
Technology 21, 3306–3315 (2012).

Vita 95
VITA
Yasin Karadag was born in Istanbul, Turkey on November 1, 1983. He received his
B.Sc. degree in physics from Bilkent University, Ankara, Turkey, in 2007. He joined the
M.Sc. program in Physics at Koc University in 2007. He received his M.Sc. degree from
Koc University in 2009. His master thesis work was titled as Spectral Tuning of Liquid
Microdroplets Standing on a Superhydrophobic Surface by Using a Focused Infrared Laser
or Electrowetting. He has been a doctoral student in Koc University Physics Department
since 2009. He is a student member of International Society for Optical Engineering (SPIE)
and Optical Society of America(OSA).
List of Publications
1. A. Kiraz, S. C. Yavuz, Y. Karadag, A. Kurt, A. Sennaroglu, and H. Cankaya. ”Large
spectral tuning of liquid microdroplets standing on a superhydrophobic surface using
optical scattering force” Appl. Phys. Lett. 91, 231102 (2007)
2. A. Kiraz, Y. Karadag, and A. F. Coskun. ”Spectral tuning of liquid microdroplets
standing on a superhydrophobic surface using electrowetting” Appl. Phys. Lett. 92,
191104 (2008)
3. A. Kiraz, Y. Karadag, and M. Muradoglu. ”Large spectral tuning of a water-glycerol
microdroplet by a focused laser: characterization and modeling” Phys. Chem. Chem.
Phys. 10, 6446-6454 (2008)
4. A. Kiraz, Y. Karadag, S. C. Yorulmaz, and M. Muradoglu. ”Reversible photothermal
tuning of a salty water microdroplet” Phys. Chem. Chem. Phys. 11, 2597-2600
(2009)
5. Y. Karadag, M. Mestre, and A. Kiraz, ”Photothermal self-stability and optical bista-
bility of single NaCl-water microdroplets on a superhydrophobic surface”, Phys. Chem.
Chem. Phys. 11, 7145-7151 (2009)

Vita 96
6. M. Mestre, Y. Karadag, S. C. Yorulmaz, M. Gundogan, and A. Kiraz, ”Photothermal
Tuning and Size Locking of Salt-Water Microdroplets on a Superhydrophobic Surface”,
Int. J. Optomechatronics 3 (4), 303-318 (2009)
7. Y. Karadag, M. Gundogan, M. Y. Yuce, H. Cankaya, A. Sennaroglu, and A. Kiraz,
”Prolonged Raman lasing in size-stabilized salt-water microdroplets on a superhy-
drophobic surface”, Opt. Lett. 35 (12), 1995-1997 (2010)
8. A. Jonas, Y. Karadag, N. Tasaltin, I. Kucukkara, and A. Kiraz, ”Probing Micro-
scopic Wetting Properties of Superhydrophobic Surfaces by Vibrated Micrometer-
Sized Droplets”, Langmuir 27 (6), 2150-2154 (2011)
9. Y. Karadag, A. Jonas, N. Tasaltin, and A. Kiraz, ”Determination of Microdroplet
Contact Angles Using Electrically Driven Droplet Oscillations”, Appl. Phys. Lett.
98, 194101 (2011)
10. A. Jonas, Y. Karadag, M. Mestre, and A. Kiraz, ”Probing of ultrahigh optical Q-
factors of individual liquid microdroplets in air using tapered optical fiber waveguides”,
J. Opt. Soc. Am. B 29 (12) 3240-3247 (2012)
11. Y. Karadag, A. Jonas, I. Kucukkara, and A. Kiraz, ”Size-stabilization of surface-
supported liquid aerosols using tapered optical fiber coupling”, Opt. Lett. 38 (5),
793-795 (2013)
12. Y. Karadag , M. Aas, A. Jonas, S. Anand, D. McGloin, and A. Kiraz, ”Dye lasing in
optically manipulated liquid aerosols”, Opt. Lett. 38 (10), 1669-1671 (2013)


![Crystals with Ultrahigh Piezoelectricityvixra.org/pdf/2001.0316v1.pdfCrystals with Ultrahigh Piezoelectricity ... smartphones to advanced microprocessors. [26] ... probabilistic smears](https://img.pdfslide.us/doc/110x75/6045ca6abb58fa5d2f40bf63/crystals-with-ultrahigh-p-crystals-with-ultrahigh-piezoelectricity-smartphones.jpg)