Embed Size (px)
Citation preview

Ultrafiltration Control using Hematocrit Monitoring
2013 ANNA North Carolina Statewide Symposium and the Southeastern Kidney Council NC Annual Meeting
“Unique Challenges for the Nephrology Professional”
Kimberly F. Clarkson, MSN, RN, CNN
May 22, 2013
Objectives
• Describe blood volume monitoring• Identify trend and graph development
during hemodialysis• Evaluate nursing assessment
considerations to decrease intradialytic mortality

Relative Blood Volume Monitoring
• Measures hematocrit in arterial blood– Crit-Line® Technology
• Optical transmission detecting blood volume changes– Blood volume change – surrogate marker for
vascular refilling– Increase in hematocrit relative to decrease in fluid
removal• Interface display of changes• Affords a “window” into intravascular space
Davenport, 2009
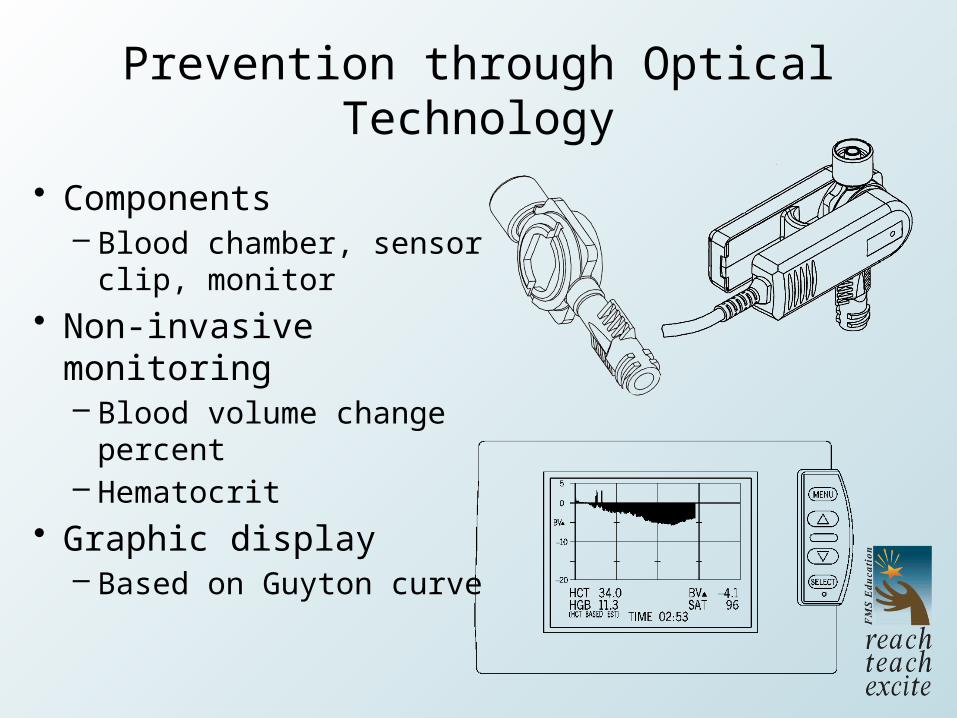
Prevention through Optical Technology
• Components– Blood chamber, sensor
clip, monitor• Non-invasive
monitoring– Blood volume change
percent– Hematocrit
• Graphic display– Based on Guyton curve
Guyton’s Curve
• Dr. Guyton (September 8, 1919 - April 3, 2003)– Physiologist; primarily circulatory system– Cardiac output related to peripheral circulation– Demonstrated oxygen demand regulated
cardiac output• Overturned previous conventional wisdom
– Heart itself does not control output
– Developed graphic representation• Fundamental base in medical school• Guyton Curve
Hall, 2003

Fluid Volume Distribution
• Volume distribution; 70 kilogram male example– Intracellular
• Approximately 23 L
– Extracellular• Approximately 17 L
– Intravascular• Approximately 5 L; cannot accommodate > 7 L

Guyton’s Curve Applied
0
1
2
3
4
5
6
7
8
5 10 15 20 25 30 35 400
Adapted from Guyton, AC: Textbook of Medical Physiology, 1991, pg.324
Normal
Death
Blo
od
Vo
lum
e (l
ite
rs)
Extracellular Fluid Volume (liters)
0
1
2
3
4
5
6
7
8
5 10 15 20 25 30 35 400
Adapted from Guyton, AC: Textbook of Medical Physiology, 1991, pg.324
Normal
DeathHypovolemia
C
B
AEdema
Bloo
d Vo
lum
e (li
ters
)
Extracellular Fluid Volume (liters)
ShiftDue
to:
Low O2MedsUFRNa+TempPosture
Optical Data Transformed – Graphic Image
The Crit-Line® monitor provides objective data and visual display of:• Relative Plasma Volume slope as an
indicator of volume status• Degree of Relative Blood Volume Slope
– Remember Guyton Curve• Intradialytic plasma refill ability or inability
– In comparison to ultrafiltration• Intradialytic plasma refill with minimal
ultrafiltration
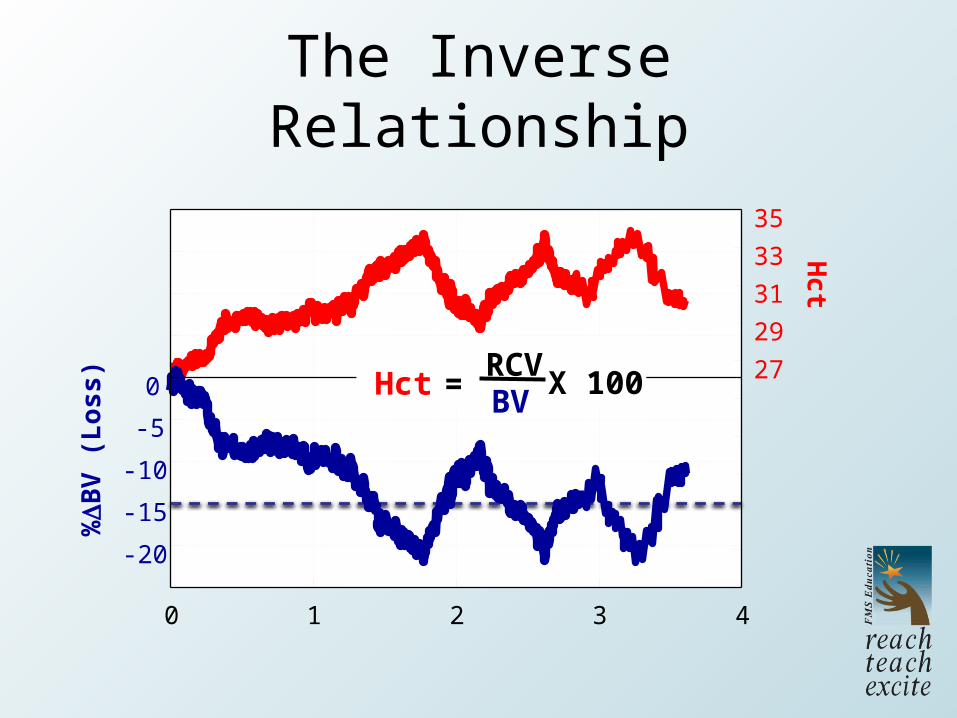
The Inverse Relationship
0 1 2 3 4
0
-5
-10
-15
-20
27
29
31
33
35
%B
V (
Lo
ss)
Hc
t
Hct =RCVBV
X 100

Profile A• Ultrafiltration and
plasma refill– Equal, or positive
slope or slope less than -3%• Special considerations
may apply
Hypertension, 2010
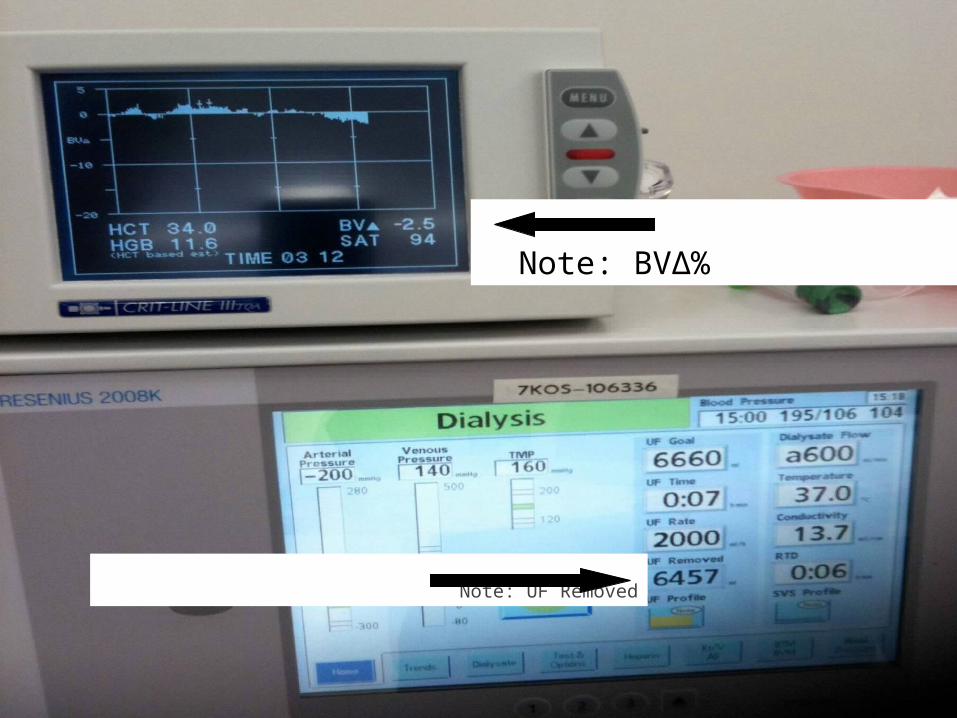
RPV Principles
11
Note: BV∆%
Note: UF Removed

RPV Principles
12
-8.6% ÷ 3.3 hour = -2.6% per hour
= Profile A

Profile B• Ultrafiltration rate
exceeds plasma refill rate– Studies range from -
1.33% per hour to -8% per hour• Not to exceed -16% at
end of 3 to 4 hour treatment
Agarwal, 2010

RPV Principles
14
-12.8% ÷ 3 hours = - 4.3%/hour
= Profile B
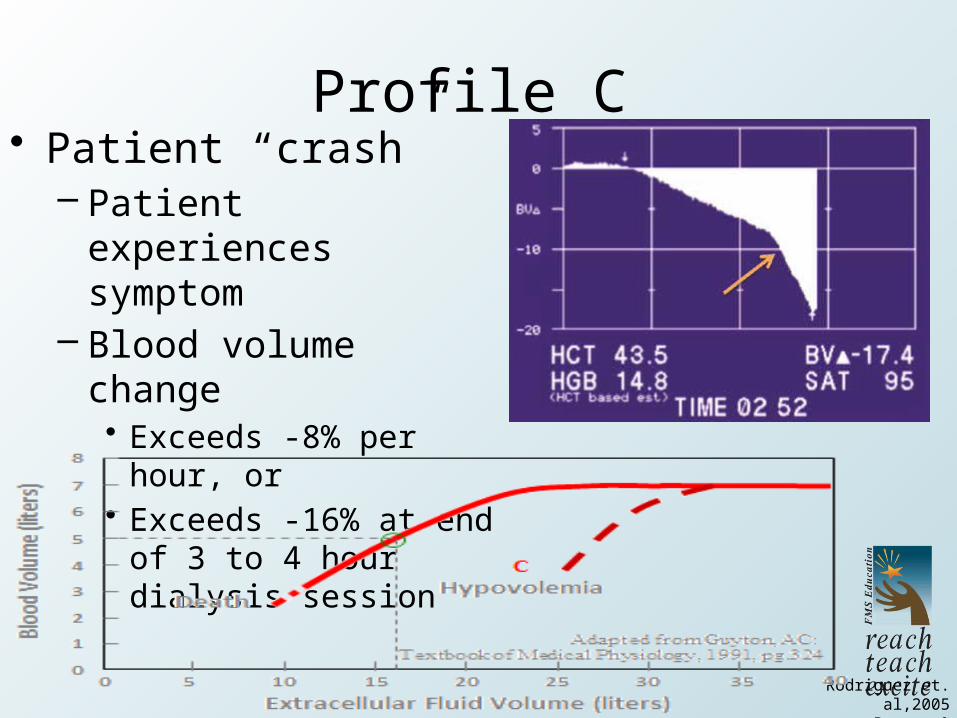
Profile C• Patient “crash”
– Patient experiences symptom
– Blood volume change• Exceeds -8% per hour, or• Exceeds -16% at end of 3
to 4 hour dialysis session
Rodriguez et. al,2005Brewer & Goldstein,
2004

RPV Principles
16
-20.9 ÷ 2 = -10.4
= Profile C
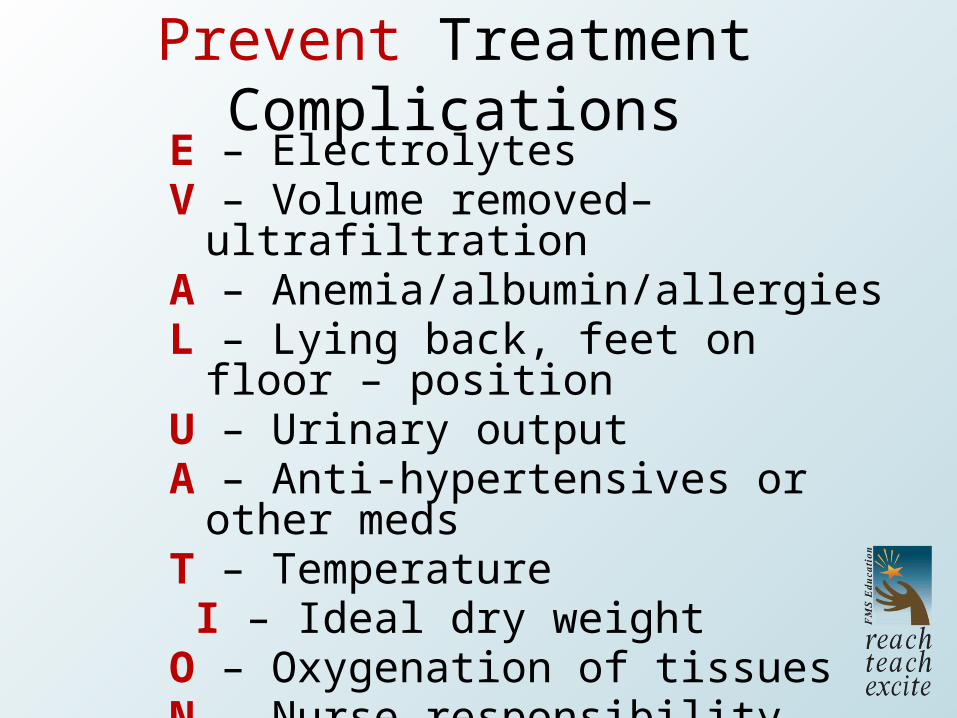
Prevent Treatment ComplicationsE – Electrolytes V – Volume removed–ultrafiltration A – Anemia/albumin/allergiesL – Lying back, feet on floor – positionU – Urinary outputA – Anti-hypertensives or other medsT – Temperature I – Ideal dry weightO – Oxygenation of tissuesN – Nurse responsibility
Summary
• Hematocrit monitoring affords a proactive approach to– Achieve ideal dry weight– Prevent intradialytic complications– Prevent hospitalizations
• Affords validation of nursing interventions– Real time measurement– Data provision – graphical representation– Individualized patient

ReferencesAgarwal, R. (2010). Hypervolemia is associated with increased mortality among hemodialysis
patients. Hypertension. 56(3). p. 512-7. doi: 10.1161/HYPERTENSIONAHA.110.154815
Brewer, M., M., & Goldstein, S., L. (2004). Blood volume monitoring to achieve target weight in
pediatric hemodialysis patients. Pediatric Nephology. 19(4). p. 432-437.
Chapdelaine, I., Deziel, C. & Madore, F. (2011). Automated blood volume regulation during
hemodialysis; Progress in hemodialysis. Emergent Biotechnology to Clinical Practice.
Accessed April 5, 2013 from http://www.intechopen.com/books/progress-in-
hemodialysis-from-emergent-biotechnology-to-clinicalpractice/automated-blood-
volume-regulation-during-hemodialysis
Davenport, A. (2009). Can advances in hemodialysis machine technology prevent intradialytic
hypotension? Seminars in Dialysis. 22(3), 231-236. DOI:10.1111/j.1525-
139X.2009.00614.x
Goldstein, S., Smith, C., & Currier, H. (2003). Non-invasive interventions to decrease
hospitalization and associated costs for pediatric patients receiving hemodialysis.
Journal of the American Society of
Nephrology. 14. p. 2127-2131.
Guyton, A., C. (1976). Textbook of Medical Physiology (5th ed.). Philadelphia: W.B. Saunders
Hall, J., D. (2003). In memorandum. Circulation. 107. p. 2990-2992.
doi:10.1161/01.CIR.0000080480.62058.4A
Rodriguez, H., J., Domenici, R., Diroll, A., & Goykhman, I. (2005). Assessment of dry weight by
monitoring changes in blood volume during hemodialysis using Crit-Line. Kidney
International. 68. p. 854-861.