Embed Size (px)
Citation preview

2006) 207–221www.elsevier.com/locate/geomorph
Geomorphology 78 (
Ultra-rapid landscape response and sediment yield followingglacier retreat, Icy Bay, southern Alaska
Andrew Meigs a,⁎, William C. Krugh a, Kelsay Davis a, Greg Bank b
a Department of Geosciences, Oregon State University, Corvallis, OR 97331, USAb Department of Geology, Virginia Polytechnic and State University, Blacksburg, VA 24061-0420, USA
Received 18 August 2005; received in revised form 7 January 2006; accepted 10 January 2006Available online 17 February 2006
Abstract
Glacial retreat and opening of Taan Fjord (an arm of Icy Bay, Alaska) in the last two decades drove a base level fall of ∼400 mat the outlets of four tributary valleys in the region of the current Tyndall Glacier terminus. Response in the tributary valleys to thisbase level fall includes evacuation of stored sediment, incision of slot gorges into bedrock, and landsliding on valley walls. Fluvialtransfer of eroded bedrock, glacial deposits, and stored nonglacial fluvial deposits after 1983 resulted in progradation of fan deltastoward the fjord centerline at the outlet of each of the four catchments. In the largest nonglacial tributary valley, ∼0.08 km3 (∼8%)of the 0.59 km3 of N500-m-thick stored fluvial and colluvial deposits has been transferred to the adjacent fjord. A percentage of thefjord sedimentation in the last two decades thus includes material eroded from bedrock and stored in the landscape during theprevious glacial expansions. Distal deltaic deposits extend across the fjord floor and likely interfinger with distal proglacial deltaicdeposits sourced from the Tyndall Glacier. A paraglacial landscape response, such as the one exhibited in upper Taan Fjord wheresediment delivery to fjords from tributary sources in synchrony with sediment produced by primary bedrock erosion by glaciers,helps to explain the order-of-magnitude discrepancy between sediment yields from Alaskan tidewater glaciers on 100- to 102-yeartimescales and sediment yields and exhumation rates on 104- to 106-year timescales.© 2006 Elsevier B.V. All rights reserved.
Keywords: Paraglacial; Erosion rates; Sediment yield; Alaska; Landscape evolution; Deglaciation
1. Introduction
Deglaciation inevitably produces a geomorphicresponse in the landscape because glaciers act as baselevel for non-glaciated hillslopes and tributaries andbecause formerly glaciated portions of the landscape aresubject to fluvial and hillslope processes after glacier
⁎ Corresponding author. Tel.: +1 541 737 1214; fax: +1 541 7371200.
E-mail address: [email protected] (A. Meigs).
0169-555X/$ - see front matter © 2006 Elsevier B.V. All rights reserved.doi:10.1016/j.geomorph.2006.01.029
retreat (Fig. 1) (Church and Ryder, 1972; Harbor andWarburton, 1993; Ballantyne, 2002). Fluvial incisioninto glacial valley bottoms, landsliding on over-steepened glacial valley walls, and remobilization ofsediment stored non-glaciated tributary valleys create asediment pulse from within glaciated basins that decayswith time following glacial retreat (the so-calledparaglacial period; Ballantyne, 2002). Erosion withinformerly glaciated trunk and tributary valleys andsediment transfer out of basins is represented by aperiod of enhanced sediment accumulation in fjords andother sediment sinks. In landscapes where glaciers

Fig. 1. Conceptual models depicting potential sources of sediment in glaciated basins. Sources include (A) erosion of cirque headwalls, valley walls,and the glacier bed (arrows); (B) fluvial modification of glaciated valleys; (C) transfer of stored material (1) to adjacent basins following glacial retreat(2).
208 A. Meigs et al. / Geomorphology 78 (2006) 207–221
retract but do not disappear during glacial minima, thesenonglacial sediment sources add to the volume ofsediment produced by glaciers over the same time span.Sediment sources within glaciated basins thus vary inspace on glacial maxima–glacial minima timescales(Evenson and Clinch, 1987; Powell and Molnia, 1989;Cowan and Powell, 1991).
Taan Fjord, an arm of Icy Bay in the active Chugach/St. Elias orogenic belt in southern Alaska, has beencreated as the consequence of the dramatic retreat of theTyndall Glacier over the past 50 years (Fig. 2) (Porter,1989; Meigs and Sauber, 2000). The terminus hasretreated ∼10 km in the upper reach of Taan Fjordsince 1983. Continuous sedimentation in the fjord hasaccompanied glacier retreat, sedimentation that isinterpreted to be dominated by output from glaciertermini (Molnia, 1979; Jaeger and Nittrouer, 1999;Koppes and Hallet, 2002). Analysis of aerial photo-graphs from 1978, 1983, and 1996, field mapping, andtopographic and bathymetric profiling are combined inthis study to quantify the magnitude of sediment inputinto the fjord from sources other than the TyndallGlacier. These data reveal a dramatic and rapidlandscape response to the Tyndall Glacier retreat, theconsequence of which has been a commingling ofsediment derived from four tributary valleys and theTyndall Glacier following opening of the upper fjordbetween 1983 and 1996. The paraglacial landscaperesponse, forced by retreat, affects fjord sedimentation,sediment sources, timescales and rates of sedimentrouting, and glacial landscape evolution. Moreover,consideration of sediment contributed from tributaryvalleys to fjords that include active trunk tidewaterglaciers resolves, in part, discrepancies betweensediment volume-based glacial erosion rates calculatedon short 100- to 102-year timescales (Hallet et al.,1996; Koppes and Hallet, 2002) and sediment yields
and exhumation rates on 104- to 106-year timescales(Jaeger and Nittrouer, 1999; Sheaf et al., 2003; Spotilaet al., 2004).
2. Glacial retreat in Icy Bay
Icy Bay did not exist at the beginning of the twentiethcentury according to coastal explorers; the terminus of aglacier system comprising the individual glaciers ineach arm of the bay occupied the modern bay mouth(Molnia, 1986; Porter, 1989). Taan Fjord, one of the fourarms of Icy Bay, was created by the isolation of theTyndall Glacier from the glacier system after 1960 (Fig.2). Retreat of the Tyndall Glacier up Taan Fjordoccurred in three stages. The terminus retreated ∼6 kmup-fjord (∼0.6 km/year) between 1960 and 1969 (Porter,1989). Aerial photos taken in 1983 show the terminus∼2 km up-fjord from its position in 1969, indicating aslowing of the retreat rate to ∼0.15 km/year. A rateincrease from 1983 to 1996 of ∼0.8 km/year wasfollowed by stabilization of the terminus∼10 km fartherup the fjord by or before 1996. Bedrock outcrops in thecenter of the fjord in the 1969–1983 terminus region andan icefall with ∼450 m of relief at the present terminusposition suggest that bedrock highs and steps in thelongitudinal profile of the valley floor modulated theretreat rate.
3. Methods
Landscape evolution in response to retreat of theTyndall Glacier was quantified by a number of methods.Bedrock units, structural data, geomorphic surfaces,modern and abandoned channels, and landslides weremapped at 1:24,000 on aerial photographs taken in 1996(Fig. 3). Field observations and sedimentologic descrip-tion provided characterization of the geomorphology in

Fig. 2. False color air photo of Taan Fjord in 1978. Fjord outlet indicated by dashed green line. Thick black lines across fjord mark terminus positionof Tyndall Glacier in 1960, 1969, 1983, and 1996 (see Porter, 1989 and Fig. 3). Drainage divides for tributary basins outlined with dashed lines.Tyndall Glacier lateral moraines marked by arcuate black lines near bedrock (grey)–vegetation (red) break on the eastern wall of fjord. Yellow dotwest of fjord outlet indicates ice-free area between late Holocene glacial advances (Porter, 1989). White arrows identify knickpoints in tributaryrivers. Inset map shows location of study area in southern Alaska. Fig. 3 location shown for reference.
209A. Meigs et al. / Geomorphology 78 (2006) 207–221
the four tributary valleys (Figs. 4–7). Landscapechanges between 1978 and 1996 were constrained bycomparison of 1978, 1983, and 1996 air photos (Fig. 5).A GPS/fish-finding sonar was used to make depthmeasurements in Taan Fjord. Position and individualpoints have an average spacing of ∼5.4 m (Figs. 8 and9). Depth errors are b±5 m, based on the tidal range inthe fjord (∼3 m), and replicate measurements of
selected points. Limited portions of the fjord are poorlyimaged because of the concentration of ice dischargedby calving by a persistent SE-directed brackish-waterinput. Alluvial fan surfaces and modern stream profileswere measured with a laser range-finding device and ahand-held GPS unit (Fig. 9). Angular and distance errorsof the laser range finder are ±0.4° and ±0.15 m,respectively.

210 A. Meigs et al. / Geomorphology 78 (2006) 207–221
4. Geomorphology and post-1978 landscape change
The valley system in upper Taan fjord is inset intobedrock comprised of deformed Cenozoic sedimentarystrata. North-dipping fluviodeltaic deposits of theEocene Kultieth Formation (Plafker, 1987) are in thrustcontact with north-dipping Pliocene–Pleistocene gla-ciomarine Yakataga Formation bedrock (Lagoe et al.,1993; Zellers, 1993) in the Tyndall Glacier terminusregion (Fig. 3). Surficial fluvial, glacial, and hillslopedeposits unconformably overlie these bedrock units andwere deposited by glaciers, rivers, hillslope processes,and landsliding.
4.1. West side tributaries
All tributaries at the head of Taan Fjord have evolvedas Tyndall Glacier thinned and retreated (Figs. 2 and 3).Two glacial and one fluvial tributary deliver sediment tothe fjord from the west (Fig. 3). Glaciers in the Daisyand Coal basins were tributaries to the Tyndall Glacieras recently as 1983 (Fig. 2) and retreated into theirrespective valleys by 1996 (Figs. 3 and 4). Both glaciersnow occupy hanging valleys and the topographicinflections between each tributary valley and the fjordwall are elevated more than 450 m asl (Fig. 4A). Apoorly sorted, blocky unconsolidated deposit comprisedof angular clasts overlies Yakataga Formation bedrockdownstream of the terminus of the Daisy Glacier (Figs. 3
Fig. 3. (A) Map of upper Taan Fjord on 1996 air photo. Tyndall Glacier heigh(Cr), Daisy (Dr), and Coal (COr). Dashed white line is shoreline. Geomorphicfan (HHf). Moraines: short black lines. Bedrock units: Kultieth Formation (Tk
line. Landslide and scarps: solid black lines with half-ball. Shoreline marked
and 4C). This veneer of sediment is interpreted as arecessional moraine, which is part of a geomorphicsurface created during retreat and isolation from theTyndall Glacier (surface T3; Fig. 3). A similar depositdownstream from the Coal Glacier terminus mantlesKultieth Formation bedrock (Figs. 3 and 4D). Proglacialrivers emerging from beneath stagnant ice-coredmoraines have incised through the thin veneer ofrecessional moraine into bedrock downstream of thetermini of both glaciers (Fig. 4C,D). Farther down-stream, across the hanging-trunk valley junction, theDaisy and Coal Rivers have steep channels and have cutnarrow slot canyons into bedrock, in which relief in thegorges exceeds 60 m locally (Fig. 4A).
There are 2 principal nonglacial sediment sources onthe western side of the fjord: a large-scale landslide ofthe interfluve between the Daisy and Coal basins (∼800m high, 500 m wide) and the steep fluvial catchmentCamp Creek basin (Fig. 3). Extensive exposure ofYakataga Formation bedrock characterizes the CampCreek basin (Fig. 3). Topographic relief in the basin is∼700 m between the headwaters and the fjord. There isno evidence of glacial occupation (moraines, till, kameterraces, etc.) in the drainage. A glacier was not presentin the basin in 1978 (Fig. 2). Retreat of the TyndallGlacier to its present position was accompanied byformation of a deep-seated bedrock landslide in theYakataga Formation on the ridge separating the Daisyfrom the Coal Glacier (compare Figs. 2 and 3) (Meigs
t in 1983 marked by black dashed line. Rivers (solid white lines): Campsurfaces: T1, 2, 3. Camp fan (Cf), Daisy–Coal fan (DCf), and Hoof Hill) and Yakataga Formation (Ty). Thrust faults: thin white barbed dashedby thick line.

Fig. 4. Photographs of the Daisy and Coal drainage basins. (A) View looking west to the Daisy and Coal outlet streams. Note that both streams occupysteep, narrow gorges incised into bedrock. The eastern face of the interfluve between the two drainages is the site of a post-retreat landslide (see Fig. 2and Meigs and Sauber, 2000). (B) View looking south across the Daisy/Coal fan delta complex. Brown water is interpreted to be hypopicnal flow ofbrackish water carrying suspended sediment from the Tyndall Glacier terminus, the Coal, and the Daisy streams. (C) View looking SW at the Daisystream at the valley outlet. A thick white line marks the contact between a recessional moraine (T3) formed after 1983 and the Yakataga Formation(Ty) bedrock. (D) View downstream to the SE of the Coal Glacier outlet stream incised into an ice-cored moraine near the glacier terminus and arecessional moraine formed after 1983.
211A. Meigs et al. / Geomorphology 78 (2006) 207–221
and Sauber, 2000; Davis et al., 2002). Both the landslideitself and erosion of the landslide surface by debrisflows and shallow channels transfer material into thefjord.
4.2. East side tributaries
The 12.4-km2 Hoof Hill valley is the principalcatchment on the east side of Taan Fjord (Fig. 3). Asecond, smaller basin lies to the south (Fig. 2). In 1978the Tyndall Glacier flowed ∼1 km eastward into thelower Hoof Hill valley (Fig. 5A). Comparison of 1978,1983, and 1996 aerial photography and field observa-tions indicates that the glacier surface elevation between1978 and 1983 was roughly 390 m asl. By 1996 theTyndall Glacier terminus had retreated to a positionnorth of the outlet of the Hoof Hill River (Figs. 3 and 5).The lower Hoof Hill River presently occupies a canyon
where the same reach flowed on a low-gradient alluvialbed at∼500 m asl as recently as 1983 (compare points 1and 2; Fig. 5).
Whereas the lower Hoof Hill valley is deeplydissected, the upper part of the basin is U-shaped andthe longitudinal profile is characterized by a steepheadwall reach that becomes nearly flat downstream(Fig. 6E,F). In the upstream reach, the Hoof Hill Riverflows on top of an alluvial surface (Fig. 5B), whichextended nearly to the margin of the Tyndall Glacier in1978 (Fig. 5A). A N450-m-thick sequence of uncon-solidated sand and gravel is exposed throughout thelower, dissected reach of the Hoof Hill river. Theseunconsolidated sediments unconformably overlie bed-rock. Valley-parallel striations are preserved on thebedrock surface below the contact where exposed.
Three geomorphic surfaces, abandoned erosional ordepositional surfaces, are preserved in the Hoof Hill

Fig. 5. Aerial photographs comparing Hoof Hill valley (HH) in 1978 (left) and 1996 (right). Numbers 1, 2, and 3 are reference points for comparisonof the magnitude of change and knickpoint migration accompanying thinning and retreat of the Tyndall Glacier (TG) and the opening of Taan Fjord(TF). The knickpoint in the Hoof Hill River migrated 2.7 km from point 1 to point 3 between 1978 and 1996. Dashed line in the 1978 photo delineatesthe eastern margin of the Tyndall Glacier.
212 A. Meigs et al. / Geomorphology 78 (2006) 207–221
drainage (Fig. 3). T1, the oldest and highest surface, sitsabove 500 m asl (Fig. 6A). T1 is underlain by more than450 m of unconsolidated alluvium and colluvium (Fig.6B–F. Concave-to-the-west low-relief ridges occur atthe same elevation (∼500 m asl), but to the west of theT1 surface. T2 is a low relief surface present along thenorthern flank of the Hoof Hill River valley. The surfaceis inset and topographically lower than T1. A b1–10-m-thick stratified boulder–cobble deposit underlies T2. T3,the youngest surface, is a discontinuous sloping, west-facing surface that extends from 410 to 45 m elevationand cross cuts the gravel lying below T1. A series ofparallel, north–south trending, 2- to 4-m-high gravel-cored ridges are present on T3 between 410 and 90 melevation (Fig. 3). These ridges parallel the trend of theeast wall of Taan Fjord. Differential relief between theT1 surface and the current channel increases from 0 m2 km west of the headwaters to N100 m 5 km west ofthe headwaters (compare Fig. 6C–F).
The unconsolidated sediments underlying T1 consistof a sequence of interbedded gravel and sand (Fig. 7).Most of the sediments are perched on the walls of thecurrent river canyon and not accessible for closeinspection. A measured section was constructed usingthe laser range finder to measure thickness at a series offour observation points. Thickness and the generalcharacteristics of the strata were measured from eachobservation site. These strata are continuously exposedfrom ~45 m asl to the T1 surface at ∼500 m elevation(Fig. 6). Onlap onto an erosional surface on bedrock
characterizes the basal contact of the sequence (Fig. 6B,C). Internally the sequence is stratified (Fig. 6C,D) andorganized into 8- to 15-m-thick packages that fineupward from clast-supported cobble–boulder depositsto pebbly sands (Fig. 7). Basal contacts of each packageundulate, with 1–5 m of relief, and are apparentlyerosional. Bedding is well developed in most of thepackages (Fig. 6C,D). Two-to eight-meter-high crossstrata are present throughout the section (Fig. 6B).Massive, poorly sorted ∼10- to 30-m-thick angularcobble–boulder beds occur at the base, between 120 and130 m and between 160 and 190 m (Fig. 7).
T1 and the underlying strata are interpreted as asequence of braided stream deposits that infilled apreviously glaciated valley. Although moraines arepresent at the outlet of the Hoof Hill River on the west,these moraines are concave-west indicating that a west-flowing glacier in the Hoof Hill valley did not formthem. These moraines are interpreted as lateralmoraines formed on the eastern margin of the TyndallGlacier (Fig. 3). Because the moraines and associatedtrimlines down fjord to the south are most likely relatedwith the maximum extent of the Tyndall Glacier at theend of the nineteenth century, the moraine at 500 m isinterpreted to have formed during the Little Ice Ageadvance. The gravel ridges on T3 are interpreted to berecessional moraines formed from thinning and retreatof the eastern margin of the Tyndall Glacier. Together,these observations and interpretations suggest that theTyndall Glacier margin acted as a dam to the flux of

Fig. 6. Upstream changes in the Hoof Hill drainage basin. (A) View looking east across Taan Fjord at the Hoof Hill fan, T1 and T3, and Kultieth (Tk)and Yakataga Formations (Ty) bedrock. (B) Depositional contact between T1 gravel and Ty at km 4.2 (Fig. 10). Note the ∼5-m-high cross-stratification, which represents either a delta front in an ice-marginal lake or lateral accretion surfaces of a side bar. Thickness of T1 fill is∼450 m. (C)Onlap and upstream thinning of T1 gravel at km 5.0 (Fig. 10) indicate back-filling of pre-existing paleorelief. Note the stratification. Decrease indifferential relief between T1 and the present Hoof Hill stream between river km 5.0 (C) and 6.0 (D). (E) View looking upstream from river km 6.0 to7.5 illustrating the location of a knickpoint in 1998. (F) Upstream of km 7.5, the Hoof Hill stream flows on gravel bed surface of T1.
213A. Meigs et al. / Geomorphology 78 (2006) 207–221
sediment derived from within the Hoof Hill valley.Accordance of the elevation of the T1 surface and aTyndall Glacier lateral moraine indicates that aggrada-tion of fluvially and hillslope-derived material wasforced by a base level rise caused by glacial thickeningas the Tyndall Glacier advanced downvalley and
penetrated a short distance into the Hoof Hill valleyin late Holocene glaciations.
There is no evidence that a tributary glacier occupiedthe Hoof Hill valley during the Little Ice Age. Nomoraines have been preserved on the surface of T1 to theeast of the Tyndall Glacier lateral moraine (Figs. 2 and

Fig. 7. Measured stratigraphic section through the unconsolidated sediments underlying T1 in Hoof Hill valley. The base of the section occurs at∼43 m asl and unconformably overlies bedrock.
214 A. Meigs et al. / Geomorphology 78 (2006) 207–221
5). Relative to the elevation of valleys that supportedglaciers during the Little Ice Age, the Hoof Hill valley islower. The elevation of the headwaters of the Hoof Hillvalley is ∼600 m, whereas the headwaters of the Coaland Daisy valleys are above ∼800 and ∼900 m,respectively. Estimates of the modern equilibrium linealtitude (ELA), snowline, and glaciation threshold all liebetween 800 and 900 m for the Chugach/St. Elias Rangeat the latitude of upper Icy Bay (Péwé, 1975; Østrem etal., 1981; Mayo, 1986). ELAs during the Holocene are
estimated to have been 150 to 200 m lower than atpresent (Calkin et al., 2001). The Hoof Hill valley,therefore, may not have been sufficiently high to supportglacier formation. Whether glaciers occupied the valleyduring earlier Holocene advances is not clear. Whereasthe massive, poorly sorted beds (Fig. 7) may representtill from either the Tyndall Glacier or from a tributaryglacier within the Hoof Hill valley, the lack of evidencefor glacial occupation in the valley implies that theylikely represent debris flow deposits from the valley

215A. Meigs et al. / Geomorphology 78 (2006) 207–221
walls. Regardless, material evacuated from the valleysince 1996 (or earlier) is dominated by fluvial andcolluvial sediments stored in the Hoof Hill valley overone or more late Holocene glacial advances.
4.3. Post-retreat sediment transfer to Taan Fjord
Fan deltas constructed between 1983 and 1996 arenow present at all tributary valley outlets at the head of
Fig. 8. Bathymetry of upper Taan Fjord. Submarine fans are associated withsourced from the terminus of the Tyndall Glacier (TG) occupies the northernshaded region is land. Contour interval is 10 m. Inset shows distribution of dWhite areas between the shoreline and data points in the north end of the fjo
the fjord (Fig. 8). Sediment sources of the east side fandeltas are fundamentally different from those on thewest because of differences in the geomorphology onthe two sides of the fjord. On the west side, sedimentcomprising the Camp and Daisy–Coal fan deltas wasderived primarily from bedrock eroded followingopening of the last kilometer of Taan Fjord. Sedimentfrom the Coal and Daisy catchments includes materialproduced by primary glacial and fluvial erosion of
the Hoof Hill, Camp, and Daisy–Coal (DCf) drainages. A large fanend of the fjord. The heavy black line marks the shoreline and the greyepth measurements, the coastline, and topographic profiles on the fans.rd were inaccessible because of calved Tyndall Glacier ice.

216 A. Meigs et al. / Geomorphology 78 (2006) 207–221
bedrock and removal of the thin veneer of till (T3)mantling bedrock (Fig. 4). Although the presence ofdeeply incised gorges downstream of both the Daisy andCoal Glaciers implies that fluvial incision of bedrock isan important source (Fig. 4A,C), the proportion ofdetritus in the fan delta complex derived from hillslopeand fluvial sources relative to glacial sources isunknown. Fluvial and mass-wasting erosion of thelandslide in the interfluve between the Coal and Daisybasins also contributes material to the fan delta complex.Hillslope and fluvial processes produce sedimentdelivered from the Camp basin (Fig. 3). On the eastside, two principal sources comprise the Hoof Hill fandelta. One major source is the wedge of fluvial andcolluvial deposits that underlie T1 (Fig. 6B–E). Thesecond source is primary bedrock erosion of bedrockbelow the T1–bedrock contact (Fig. 6B,C). Thus, theHoof Hill fan delta consists of material derived from thefluvial erosion bedrock in the last 20–30 years and,importantly, stored material produced by bedrockerosion during the Little Ice Age and earlier Holoceneadvances.
The west-side fan delta complex has a smaller area(0.2 km2) than the Hoof Hill complex on the east (0.4 km2)(Figs. 3 and 8). A prominent break in slope occurs at theshoreline on each of the fan delta complexes (Fig. 9A–
Fig. 9. Combined bathymetric and topographic profiles across Taan Fjord and(C) Southeastern Hoof Hill. (D) Fjord centerline profile. Surface slopes are rinterpreted to represent sediment-free bedrock surface (solid). Sediment aresurface with respect to fjord axis (line). Inset shows profile locations.
C). From the fan head on land to the delta toe, thesurface slope is 6° to 11° between the head and the coastand decreases from 28°–18° to 0° systematically fromthe coast to the toe at the fjord center. Depth along thefjord centerline increases from −70 m roughly 0.4 kmsouth of the Tyndall Glacier terminus to −130 m 1.1 kmto the SSE (Fig. 9D). Both the cross-sections and mapindicate that the Hoof Hill delta has apparentlyprograded across the fjord center line, which may haveresulted in the commingling of the Camp and Hoof Hilldelta bottom sets (Figs. 8, 9B). Iceberg discharge fromthe Tyndall Glacier limited the proximity to which thefjord near the terminus could be mapped. Clearly, a deltacomplex sourced from the glacier is prograding to theSE (Fig. 9D). Thus, material accumulating in the upper3 km of the fjord since retreat of the glacier to its presentposition includes sediment derived from glacial erosionin the Tyndall Glacier basin, from fluvial erosion ofbedrock in the Camp basin, from primary bedrockerosion by fluvial and glacial processes in the Daisy andCoal basins, and from erosion of stored older fluvialdeposits and fluvial erosion of bedrock in the Hoof Hillbasin. Deltaic bottom sets from each of these basinsoverlap in the upper fjord (Fig. 8). Fjord-bottomsediment volume in profile, therefore, cannot be simplyinverted for the proglacial sediment flux and basin-
fan delta complexes. (A) Hoof Hill–Daisy–Coal. (B) Hoof Hill–Camp.eported in degrees. Fjord morphology on the SW side of profile (C) isa (km2) is material between the bedrock and the modern depositional
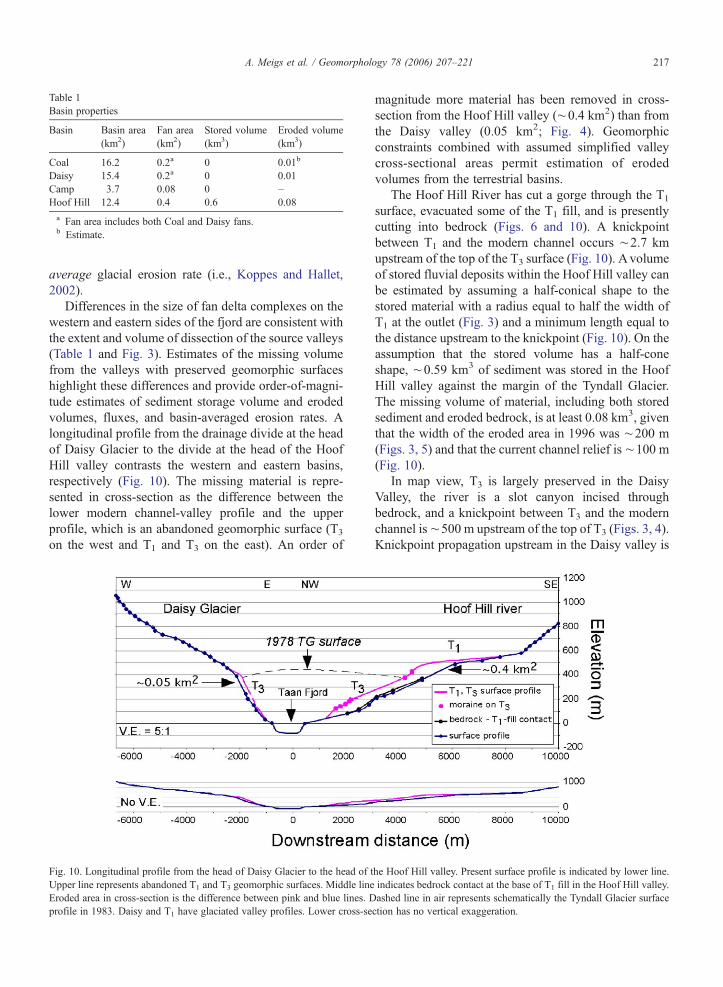
Table 1Basin properties
Basin Basin area(km2)
Fan area(km2)
Stored volume(km3)
Eroded volume(km3)
Coal 16.2 0.2a 0 0.01b
Daisy 15.4 0.2a 0 0.01Camp 3.7 0.08 0 –Hoof Hill 12.4 0.4 0.6 0.08a Fan area includes both Coal and Daisy fans.b Estimate.
217A. Meigs et al. / Geomorphology 78 (2006) 207–221
average glacial erosion rate (i.e., Koppes and Hallet,2002).
Differences in the size of fan delta complexes on thewestern and eastern sides of the fjord are consistent withthe extent and volume of dissection of the source valleys(Table 1 and Fig. 3). Estimates of the missing volumefrom the valleys with preserved geomorphic surfaceshighlight these differences and provide order-of-magni-tude estimates of sediment storage volume and erodedvolumes, fluxes, and basin-averaged erosion rates. Alongitudinal profile from the drainage divide at the headof Daisy Glacier to the divide at the head of the HoofHill valley contrasts the western and eastern basins,respectively (Fig. 10). The missing material is repre-sented in cross-section as the difference between thelower modern channel-valley profile and the upperprofile, which is an abandoned geomorphic surface (T3
on the west and T1 and T3 on the east). An order of
Fig. 10. Longitudinal profile from the head of Daisy Glacier to the head of tUpper line represents abandoned T1 and T3 geomorphic surfaces. Middle lineEroded area in cross-section is the difference between pink and blue lines. Dprofile in 1983. Daisy and T1 have glaciated valley profiles. Lower cross-se
magnitude more material has been removed in cross-section from the Hoof Hill valley (∼0.4 km2) than fromthe Daisy valley (0.05 km2; Fig. 4). Geomorphicconstraints combined with assumed simplified valleycross-sectional areas permit estimation of erodedvolumes from the terrestrial basins.
The Hoof Hill River has cut a gorge through the T1
surface, evacuated some of the T1 fill, and is presentlycutting into bedrock (Figs. 6 and 10). A knickpointbetween T1 and the modern channel occurs ∼2.7 kmupstream of the top of the T3 surface (Fig. 10). Avolumeof stored fluvial deposits within the Hoof Hill valley canbe estimated by assuming a half-conical shape to thestored material with a radius equal to half the width ofT1 at the outlet (Fig. 3) and a minimum length equal tothe distance upstream to the knickpoint (Fig. 10). On theassumption that the stored volume has a half-coneshape, ∼0.59 km3 of sediment was stored in the HoofHill valley against the margin of the Tyndall Glacier.The missing volume of material, including both storedsediment and eroded bedrock, is at least 0.08 km3, giventhat the width of the eroded area in 1996 was ∼200 m(Figs. 3, 5) and that the current channel relief is ∼100 m(Fig. 10).
In map view, T3 is largely preserved in the DaisyValley, the river is a slot canyon incised throughbedrock, and a knickpoint between T3 and the modernchannel is∼500 m upstream of the top of T3 (Figs. 3, 4).Knickpoint propagation upstream in the Daisy valley is
he Hoof Hill valley. Present surface profile is indicated by lower line.indicates bedrock contact at the base of T1 fill in the Hoof Hill valley.ashed line in air represents schematically the Tyndall Glacier surfacection has no vertical exaggeration.

218 A. Meigs et al. / Geomorphology 78 (2006) 207–221
limited by the glacier terminus at km ∼3.5 (Fig. 10),which effectively dictates how far upvalley a fluvialsignal is transmitted. An eroded volume of 0.01 km3 issuggested given the average 200-m canyon width inmap view (Fig. 3) and the 0.05-km2 area missing bet-ween the modern channel and T3 (Fig. 10). A compa-rable amount has probably been removed from the CoalGlacier valley, although it is not possible to directlyestimate because the 1996 air photo only covers a part ofthe valley (Fig. 3).
Whilst valleys in upper Taan Fjord have experienceda base level drop of at least 400 m since 1978 (Fig. 10),more material has been transferred from the Hoof Hillvalley to Taan Fjord than the Daisy and Coal basinscombined because of the greater erodibility of theunconsolidated T1 fill in the Hoof Hill valley comparedwith the bedrock in the other valleys. Constraining thequantity of sediment evacuated by the rivers or thehillslopes from the Daisy and Coal Glaciers is notpossible. The rate of downcutting by the Hoof Hill Rivermay have decreased, however, after it encounteredbedrock at the base of the fill.
5. Discussion
Sediment volumes from sinks within glaciated basinsrepresent one of the primary data sets used to estimateprimary bedrock erosion rates by glaciers (Molnia,1979; Stravers and Syvitski, 1991; Hallet et al., 1996;Jaeger and Nittrouer, 1999; Koppes and Hallet, 2002).Sediment accumulated over the past 101 to 103 years insouthern Alaskan fjords have very large volumes(ranging from 2–100×106 m3 year−1) (Molnia, 1979;Carlson, 1989; Powell and Molnia, 1989; Hallet et al.,1996; Hunter et al., 1996), which equate to basin-averaged erosion rates ranging from 5 to 60 mm year−1
(Hallet et al., 1996). These rates exceed sediment yieldrates on 104- to 105-year timescales determined fromsediment thicknesses as deduced from seismic lines andcores (Jaeger and Nittrouer, 1999; Sheaf et al., 2003),exhumation rates measured on 106-year timescalesderived from low-temperature thermochronometers(Johnston et al., 2004; Spotila and Meigs, 2004; Spotilaet al., 2004), and estimates of tectonic influx and rockuplift rates in the Yakutat terrane foreland fold-and-thrust belt and backstop (Meigs and Sauber, 2000;Johnston et al., 2004; Meigs et al., 2004; Spotila et al.,2004).
One way to reconcile the observation that the basin-average sediment yield deduced from sediment thick-ness is greater over the last 102 years than over the last104 years is to argue for an increase in erosion rates on
101- to 103-year timescales as the consequence of aclimatically induced change in glacier sliding rateresulting from a short-term shift in glacier mass balance(Koppes and Hallet, 2002). Alternatively, stored sedi-ment and a disequilibrium landscape response representa potentially significant contributor of sediment to sinks(Church and Ryder, 1972; Church and Slaymaker, 1989;Harbor and Warburton, 1993; Ballantyne, 2002). Thebasin-averaged erosion rate for the Hoof Hill valleybetween 1983 and 1996, for example, is 50 mm/year(given an eroded volume of 0.08 km3 and a basin areaof 12.4 km2). Clearly the sediment volume andassociated rate reflect the combined effects of a short-lived landscape response to a 400-m base level fall,pronounced geomorphic disequilibrium accompanyingupstream knickpoint migration, and of a high sourcearea erodibility. The volume transferred to the fjord fromthe Hoof Hill valley to the fjord is dominated bysediment stored over one or more Holocene glacialfluctuations and the amount represented by primarybedrock erosion by fluvial processes is relatively small(Fig. 10). Bedrock erosion that produced the storedvolume occurred, in part, during one or more earlierHolocene glacial maxima. Sediment yield and volumesin fjords and other sinks used by Hallet et al. (1996) andothers to estimate basin-average glacial erosion rateslikely include material derived from sediment stored inthe landscape in addition to primary bedrock erosion byglaciers (Church and Ryder, 1972; Church and Slay-maker, 1989; Harbor and Warburton, 1993; Ballantyne,2002).
Geomorphic reorganization as the consequence ofthinning and retreat of the Tyndall Glacier andconcomitant base level fall is the principal factor drivingsediment production from tributaries in upper TaanFjord. The glacier system in Icy Bay has been in retreatsince ∼A.D. 1904 (Molnia, 1979; Porter, 1989). Theterminus of Tyndall Glacier is more than 50-km up-fjordfrom the A.D. 1904 position. Given that thicknesschange for glaciers is greatest in the terminus region(Paterson, 1994), the rate of base level fall for anytributary valley depends on its distance from theterminus. Base level fall rate in upper Taan Fjord musthave changed from a low rate between 1904 and 1983 toa high rate between 1983 and 1996 as the terminusreached its present location. Those rates can bedetermined using the preserved geomorphic surfacesin the Hoof Hill valley and from changes in the TyndallGlacier surface height in the 1976 and 1983 aerialphotographs. T1 is an aggradational surface graded tothe maximum height of the Tyndall Glacier during thelast advance. Thus, the glacier surface elevation lowered

219A. Meigs et al. / Geomorphology 78 (2006) 207–221
from 490 m to ∼390 m between 1904 and 1983 andfrom 390 m to sea level by 1996 (Fig. 4). Rate of baselevel fall, therefore, jumped from 1.3 m/year to 30 m/year before base level stabilized in 1996 or earlier.Modest incision of both the T1 fill and T3 surface on the1983 and earlier photos supports this interpretation andsuggests that tributary sources contributed a percentageof the material carried by the glacier prior to 1983. Sincethe Daisy and Coal Glaciers were still flowing into theTyndall Glacier in 1983, the mode of sedimentproduction from these tributary basins remained un-changed until rivers replaced glaciers in the lowerreaches, which was followed by fluvial incision ofbedrock (Fig. 4).
Do other tributary basins in the upper Taan Fjordreflect a similar response to Tyndall Glacier thinningand retreat? If a sediment pulse from tributary valleys isan important source of sediment to fjords during theparaglacial period, whether other basins preserve ageomorphic history similar to the basins in upper TaanFjord represents a key question. Six basins (with areasthat range from 3.8 to 19.6 km2) in the lower Taan Fjordhave knickpoints, evidence of steep, eroding valleybottoms, and fan deltas at their outlets (Fig. 2). Thelargest of these tributaries shows many similarities to theHoof Hill basin. The “1978 basin” has an outlet thatcoincides with the 1978 Tyndall Glacier terminusposition (Fig. 2). Key characteristics of the 1978 basininclude flat, alluviated upper valley reaches, TyndallGlacier lateral moraines at roughly the same elevation asthe alluviated valley reaches; lower valley reachescharacterized by steep, unvegetated valley bottoms; andprominent knickpoints separating the lower from theupper valley reaches. If the Hoof Hill valley representsan analog, the upper low gradient, alluviated valley
Fig. 11. Model of stored sediment volume and base level as a function of timglacier terminus at glacial maxima. The Tyndall Glacier terminus was ∼30 krespectively, during Holocene glacial advances. Holocene glacial maxima inand 750–100 YBP (Little Ice Age) (Porter, 1989; Barclay et al., 2001; Calkilevel rise accompanying glacier advance. Glacial retreat (grey shading) is acctributaries, the magnitude of which is a function of the amount of stored mateaggradation/degradation (a/d; white arrows) and degradation/aggradation (d/aglacier thickening/thinning modulates base level, which varies in space and timsurface profile.
bottom at the same elevation as an apparent lateralmoraine suggests the presence of sediment storedagainst the margin of the Tyndall Glacier. A steepchannel downstream of a knickpoint is indicative of thechannel response to a base level fall accompanyingthinning and retreat of the glacier past the outlet before1978 (Fig. 2). Attempts to confirm these interpretationsin the 1978 basin were thwarted by dense vegetation andimpassable valley bottoms.
A general model summarizes the linkages betweensediment production, routing, and landscape evolutionof tributary valleys to glacier advance and retreat inTaan Fjord (Fig. 11). Aggradation–degradation cyclesin tributary basins depend on a base level controlled bytrunk glacier thickness variations in space and time.Assuming a constant sediment production rate intributary valleys, the flux of material to adjacent fjordsor trunk glaciers in time is a function of glacieradvance–retreat rates and the tributary basin locationrelative to the trunk glacier terminus at glacial maximaand minima. Holocene deposits that suggest retractionof the terminus to a position at least ∼25 km up-fjordfrom the mouth at 2000–1800 YBP and at 900–500YBP (yellow dot, Fig. 2) (Porter, 1989) imply that the1978 basin (located within ∼30 km of the mouth ofIcy Bay), for example, would experience repeated backfilling and evacuation over Holocene glacial maxima/minima cycles, respectively (solid line, Fig. 11). HoofHill valley, which is ∼50 km up-fjord, would haveshorter cycles because of its greater distance from theglacial minima terminus position (Fig. 11). Totalvolume stored and evacuated would be sensitive tosediment production rates within the catchment, theduration of aggradation and degradation periods, andthe sediment transport capacity of streams. Sediment
e for tributary basins at intermediate and large distances from a trunkm (solid line) and 50 km (dashed) from the 1978 and Hoof Hill basins,southern Alaska occurred between 3600–3400 YBP, 1500–1300 YBP,n et al., 2001). Storage volume increase in tributaries is forced by baseompanied by base level fall and erosion of sediment volume stored inrial, the duration of the glacial minimum, and stream power. Note that; black arrows) transitions are out of phase for the two basins becausee as a function of glacier advance/retreat rates, respectively, and glacier

220 A. Meigs et al. / Geomorphology 78 (2006) 207–221
delivery from such a basin to a trunk glacier or fjordhas two time and volume scales. Partial evacuation ofthe tributary basin would result from glacier thinning atthe valley mouth during short-period retreat. Near-complete evacuation is expected to occur only whenthe trunk glacier terminus retracts upvalley past thetributary valley junction.
6. Conclusions
Tributary valleys in the upper 10 km of Taan Fjord,an arm of Icy Bay on the south flank of the Chugach/St.Elias Range in southern Alaska, are responding to theretreat and stabilization of the Tyndall Glacier terminusto its present position in the last two decades. Landscapechange was documented by a combination of interpre-tation of air photos taken in 1978, 1983, and 1996 andfield mapping and characterization of the geomorphol-ogy of tributaries in the upper fjord. Key findingsinclude the following:
(i) Retreat of the Tyndall Glacier has caused a N400 mbase level fall for all tributary valleys along TaanFjord.
(ii) Daisy and Coal Glaciers were tributaries to theTyndall Glacier as recently as 1983. Presently, thetwo glaciers are confined to their respectivevalleys. Proglacial streams from each of theglaciers have cut slot canyons through glaciomar-ine and fluvial–deltaic Tertiary bedrock. Knick-points in both the streams have reached the glaciertermini.
(iii) Hoof Hill valley was occupied by a river in 1978and probably throughout the Little Ice Ageadvance. More than 500 m of fluvial materialaggraded in the valley against the eastern marginof the Tyndall Glacier during the Little Ice Ageadvance (and possibly previous advances). Aknickpoint has migrated ∼3 km upstream fromthe 1983 Tyndall Glacier margin and the channelhas incised through the stored material into theunderlying Tertiary bedrock.
(iv) Estimates of eroded volumes from the Daisy,Coal, and Hoof Hill Valleys are 0.01, 0.01, and0.08 km3, respectively. The eroded volume fromthe Daisy and Coal valleys represents primarybedrock erosion by rivers, whereas the erodedvolume from the Hoof Hill valley is predomi-nantly stored sediment produced by bedrockerosion during earlier glacial maxima. Roughly0.5 km3 of sediment remains stored in the HoofHill valley.
(v) Fan/deltas are building out from the outlets ofeach of these tributary valleys. The distal portionof the Hoof Hill fan interfingers with the distalportion of the Daisy, Coal, and Camp fans as wellas the distal portion of a delta formed by theTyndall Glacier.
(vi) Six additional tributary valleys show character-istics similar to the four basins of this study,including knickpoints separating deeply dissectedlower reaches from undissected upper reaches,apparent sediment storage in valleys, and fan/deltas at their outlets.
(vii) A paraglacial landscape response resulting in asignificant influx of sediment into fjords (includ-ing sources from stored sediment, primarybedrock erosion by rivers, and primary bedrockerosion by glaciers) may help to explain the largevolumes of sediment in fjords and other sinksproduced from within Alaskan glaciated basins.
Acknowledgements
Supported by NSF grant EAR-0001192 and NASAgrant NASA (NAG-5-7646). Reviews of an earlierversion of this manuscript by Mehgan Blair, RossPowell, Suzanne Anderson, Bob Anderson, and ananonymous reviewer caused me to substantially rethinkmy interpretations. Dick Marston and 2 anonymousreviewers provided thoughtful reviews for this versionof the manuscript. Danny Rosenkrans and Devi Sharp ofthe Warngell/St. Elias Park and Preserve were instru-mental in facilitating this work.
References
Ballantyne, C.K., 2002. Paraglacial geomorphology. QuaternaryScience Reviews 21, 1935–2017.
Barclay, D.J., Calkin, P.E., Wiles, G.C., 2001. Holocene history ofHubbard Glacier in Yakutat Bay and Russell Fiord, southernAlaska. Geological Society of America Bulletin 113 (3),388–402.
Calkin, P.E., Wiles, G.C., Barclay, D.J., 2001. Holocene coastalglaciation of Alaska. Quaternary Science Reviews 20, 449–461.
Carlson, P.R., 1989. Seismic reflection characteristics of glacial andglacimarine sediment in the Gulf of Alaska and adjacent fjords.Marine Geology 85, 391–416.
Church, M., Ryder, J.M., 1972. Paraglacial sedimentation: aconsideration of fluvial processes conditioned by glaciation.Geological Society of America Bulletin 83, 3059–3072.
Church, M., Slaymaker, O., 1989. Disequilibrium of Holocenesediment yield in glaciated British Columbia. Nature 337,452–454.
Cowan, E.A., Powell, R.D., 1991. Ice-proximal sediment accumulationrates in a temperate glacial fjord, southeastern Alaska. In: Anderson,J.B., Ashley, G.M. (Eds.), Glacial Marine Sedimentation;

221A. Meigs et al. / Geomorphology 78 (2006) 207–221
Paleoclimatic Significance. Geological Society of America, Boulder,CO, pp. 61–73.
Davis, K., Meigs, A., Krugh, W., 2002. Factor of safety implicationsfrom a slide caused by glacial erosion. Abstracts with Programs -Geological Society of America 34 (5), A-26.
Evenson, E.B., Clinch, J.M., 1987. Debris transport mechanisms atactive alpine glacier margins: Alaskan case studies. Special Paper -Geological Survey of Finland 2, 111–136.
Hallet, B., Hunter, L., Bogen, J., 1996. Rates of erosion and sedimentevacuation by glaciers: a review of field data and their implications.Global and Planetary Change 12, 213–235.
Harbor, J., Warburton, J., 1993. Relative rates of glacial and nonglacialerosion in alpine environments. Arctic and Alpine Research 25,1–7.
Hunter, L.E., Powell, R.D., Lawson, D.E., 1996. Flux of debris by iceat three Alaskan tidewater glaciers. Journal of Glaciology 42 (140),123–135.
Jaeger, J.M., Nittrouer, C.A., 1999. Sediment deposition in an Alaskanfjord: controls on the formation and preservation of sedimentarystructures in Icy Bay. Journal of Sedimentary Research 69 (5),1011–1026.
Johnston, S., Meigs, A., Spotila, J., Garver, J., 2004. Backstop andorogenic wedge cooling histories in the active Yakutat terranecollision, southern Alaska. Abstracts with Programs - GeologicalSociety of America 36 (5), 270.
Koppes, M., Hallet, B., 2002. Influence of rapid glacial retreat on therate of erosion by tidewater glaciers. Geology 30 (1), 47–50.
Lagoe, M.B., Eyles, C.H., Eyles, N., Hale, C., 1993. Timing of lateCenozoic tidewater glaciation in the far North Pacific. GeologicalSociety of America Bulletin 105, 1542–1560.
Mayo, L.R., 1986. Annual runoff rate from glaciers in Alaska: a modelusing the altitude of glacier mass balance equilibrium. In: Kane, D.L. (Ed.), Cold Regions Hydrology Symposium. American WaterResources Association, Bethesda, MD, pp. 509–517.
Meigs, A., Sauber, J., 2000. Southern Alaska as an example of thelong-term consequences of mountain building under the influenceof glaciers. Quaternary Science Reviews 19, 1543–1562.
Meigs, A., Spotila, J., Johnston, S., Blair, M., 2004. Role of tectonicsand climate in the topography, glaciation, denudation, and flow ofrocks in the Chugach/St. Elias range (southern Alaska) activecollisional orogen. Abstracts with Programs - Geological Societyof America 36 (5), 307.
Molnia, B.F., 1979. Sedimentation in coastal embayments, northeast-ern Gulf of Alaska. Proceedings 11th Offshore TechnologyConference I, 665–676.
Molnia, B.F., 1986. Glacial history of the northeastern Gulf of Alaska—a synthesis. In: Hamilton, T.D., Reed, K.M., Thorson, R.M. (Eds.),Glaciation in Alaska: The Geologic Record. Alaska GeologicSociety, Anchorage, AK, pp. 219–235.
Østrem, G., Haakensen, N., Eriksson, T., 1981. The glaciation level insouthern Alaska. Geografiska Annaler 63A, 251–260.
Paterson, W.S.B., 1994. The Physics of Glaciers. Elsevier, Tarrytown,NY. 480 pp.
Péwé, T.L., 1975. Quaternary Geology of Alaska. United StatesGeological Survey Professional Paper, vol. 835. Reston VA,145 pp.
Plafker, G., 1987. Regional geology and petroleum potential of thenorthern Gulf of Alaska continental margin. In: Scholl, D.W.,Grantz, A., Vedder, J.G. (Eds.), Geology and Petroleum Potentialof the Continental Margin of Western North America and AdjacentOcean Basins—Beaufort Sea to Baja California. Earth ScienceSeries. Circum-Pacific Council for Energy and Mineral Resources,Houston, TX, pp. 229–268.
Porter, S.C., 1989. Late Holocene fluctuations of the fiord glaciersystem in Icy Bay, Alaska. Arctic and Alpine Research 21 (4),364–379.
Powell, R.D., Molnia, B.F., 1989. Glacimarine sedimentary processes,facies and morphology of the south–southeast Alaska shelf andfjords. Marine Geology 85, 359–390.
Sheaf, M.A., Serpa, L., Pavlis, T.L., 2003. Exhumation rates in the St.Elias Mountains, Alaska. Tectonophysics 367 (1–2), 1–11.
Spotila, J., Meigs, A., 2004. Testing glacial limits to mountainbuilding: the buzz saw in the Chugach/St. Elias Range, Alaska.EOS, Transactions—American Geophysical Union, Fall 2004Abstracts with Programs 85 (47), T33D-03.
Spotila, J.A., Buscher, J.T., Meigs, A., Reiners, P.W., 2004. Long-termglacial erosion of active mountain belts: the Chugach/St. EliasRange, Alaska. Geology 32 (6), 501–505.
Stravers, J.A., Syvitski, J.P.M., 1991. Land–sea correlations andevolution of the Cambridge Fiord marine basin during the lastdeglaciation of northern Baffin Island. Quaternary Research 35 (1),72–90.
Zellers, S.D., 1993. Controls on glacial–marine accumulation rates inthe Yakataga Formation, Gulf of Alaska. GCSSEPM Foundation14th Annual Research Conference Rates of Geological Processes,pp. 299–306.