Embed Size (px)
Citation preview
ULTRA-DOWNSIZING OF INTERNAL COMBUSTION ENGINES
Victor Gheorghiu, Prof PhD ME Hamburg University of Applied Sciences, Germany
1st International Conference on Engine Processes 6-7 June 2013
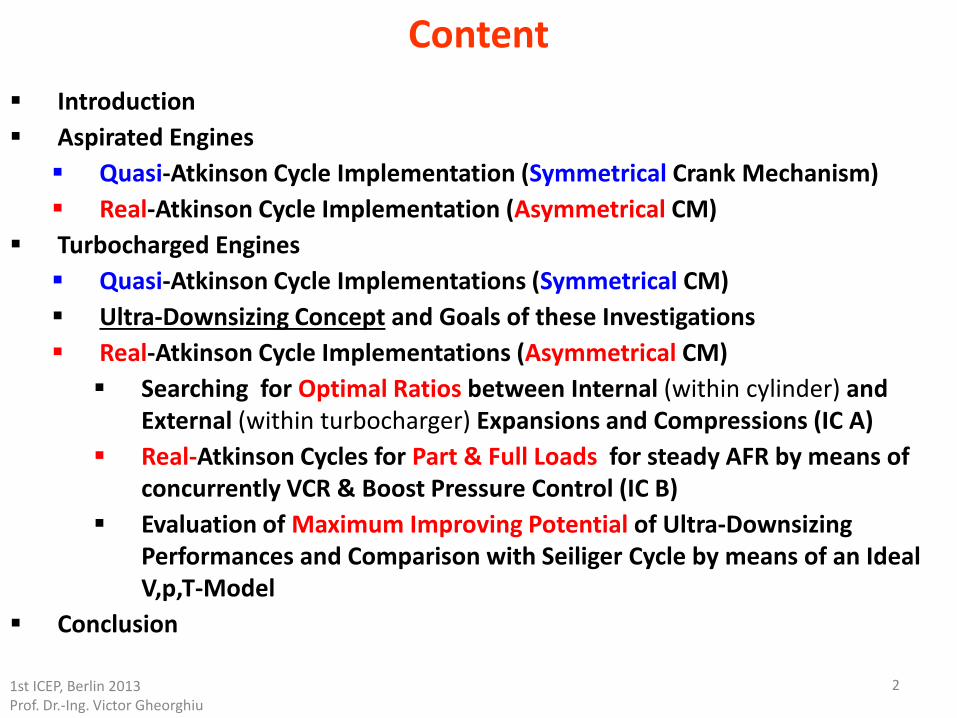
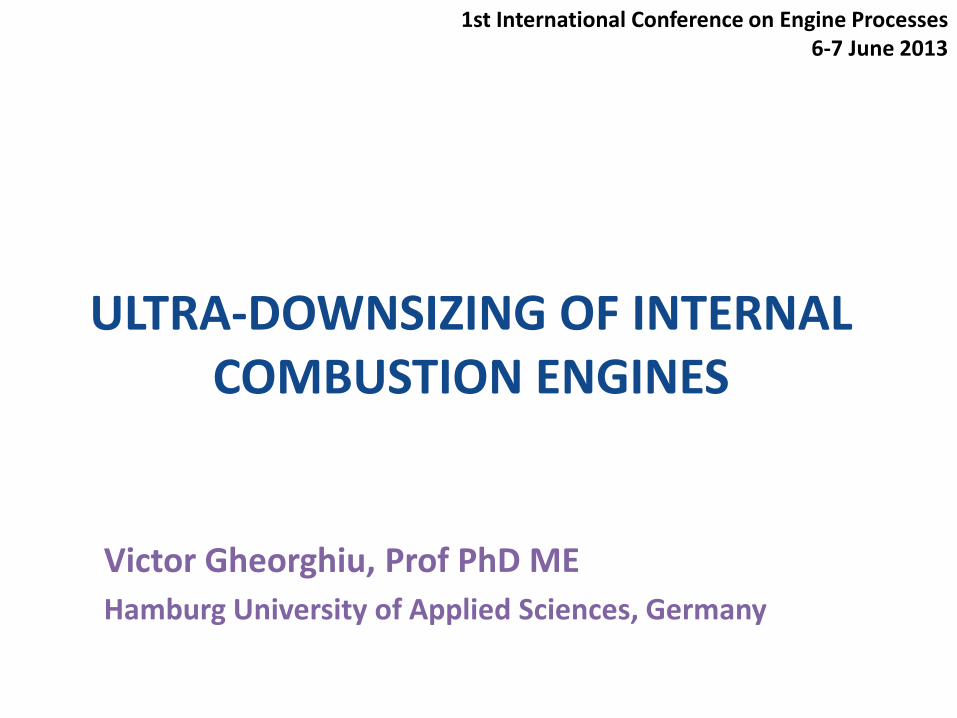
Content Introduction Aspirated Engines Quasi-Atkinson Cycle Implementation (Symmetrical Crank Mechanism) Real-Atkinson Cycle Implementation (Asymmetrical CM)
Turbocharged Engines Quasi-Atkinson Cycle Implementations (Symmetrical CM) Ultra-Downsizing Concept and Goals of these Investigations Real-Atkinson Cycle Implementations (Asymmetrical CM) Searching for Optimal Ratios between Internal (within cylinder) and
External (within turbocharger) Expansions and Compressions (IC A) Real-Atkinson Cycles for Part & Full Loads for steady AFR by means of
concurrently VCR & Boost Pressure Control (IC B) Evaluation of Maximum Improving Potential of Ultra-Downsizing
Performances and Comparison with Seiliger Cycle by means of an Ideal V,p,T-Model
Conclusion
2 1st ICEP, Berlin 2013 Prof. Dr.-Ing. Victor Gheorghiu
1st ICEP, Berlin 2013 Prof. Dr.-Ing. Victor Gheorghiu
3
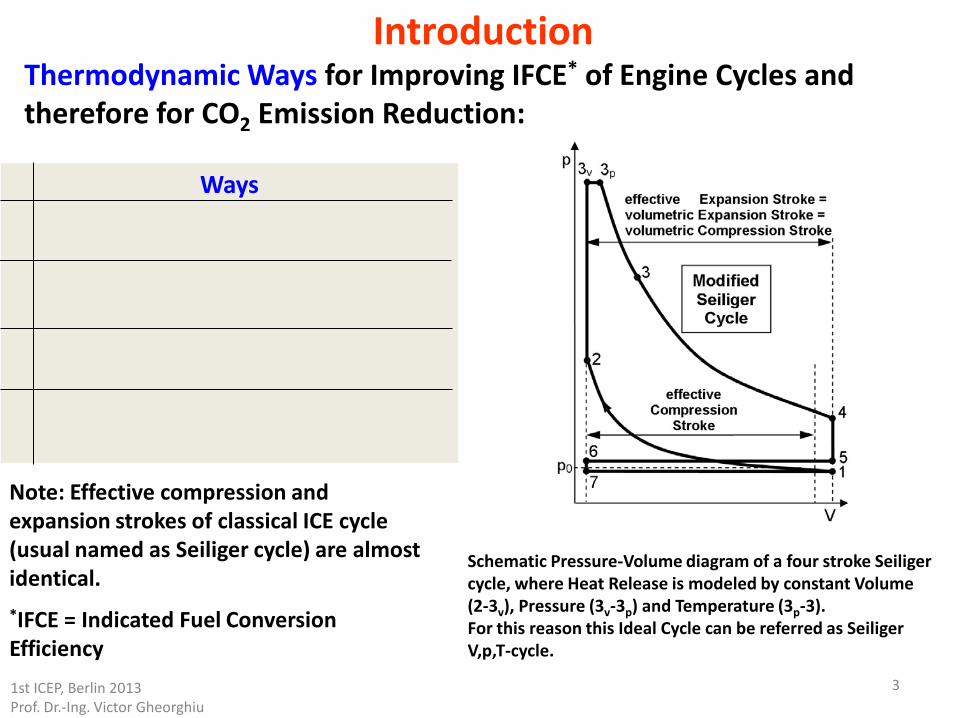
Introduction Thermodynamic Ways for Improving IFCE* of Engine Cycles and therefore for CO2 Emission Reduction:
Ways 1. Increasing effective compression
ratio 2. Shorten eff. compression stroke (e.g.
delaying intake valve closing) 3. Completing eff. expansion stroke
(e.g. delaying exh. valve opening) 4. Turbo-charging for a concurrent
increase in IFCE & BMEP
Schematic Pressure-Volume diagram of a four stroke Seiliger cycle, where Heat Release is modeled by constant Volume (2-3v), Pressure (3v-3p) and Temperature (3p-3). For this reason this Ideal Cycle can be referred as Seiliger V,p,T-cycle.
Note: Effective compression and expansion strokes of classical ICE cycle (usual named as Seiliger cycle) are almost identical.
*IFCE = Indicated Fuel Conversion Efficiency
4
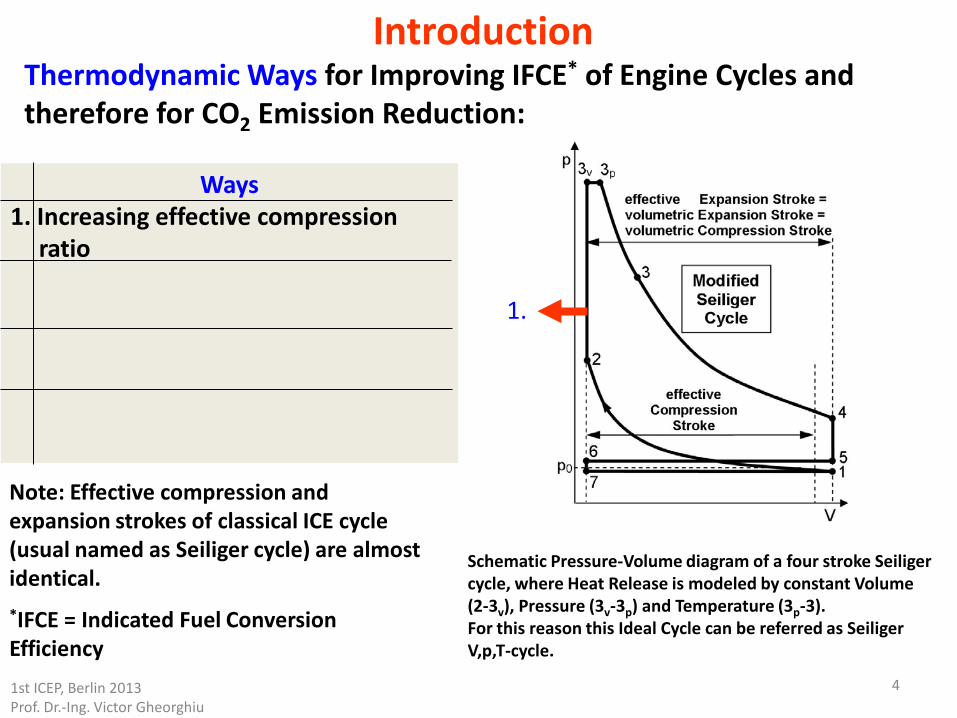
Introduction Thermodynamic Ways for Improving IFCE* of Engine Cycles and therefore for CO2 Emission Reduction:
Ways 1. Increasing effective compression
ratio 2. Shorten eff. compression stroke (e.g.
delaying intake valve closing) 3. Completing eff. expansion stroke
(e.g. delaying exh. valve opening) 4. Turbo-charging for a concurrent
increase in IFCE & BMEP
Schematic Pressure-Volume diagram of a four stroke Seiliger cycle, where Heat Release is modeled by constant Volume (2-3v), Pressure (3v-3p) and Temperature (3p-3). For this reason this Ideal Cycle can be referred as Seiliger V,p,T-cycle.
1.
1st ICEP, Berlin 2013 Prof. Dr.-Ing. Victor Gheorghiu
Note: Effective compression and expansion strokes of classical ICE cycle (usual named as Seiliger cycle) are almost identical.
*IFCE = Indicated Fuel Conversion Efficiency
Ways 1. Increasing effective compression
ratio 2. Shorten eff. compression stroke (e.g.
delaying intake valve closing) 3. Completing eff. expansion stroke
(e.g. delaying exh. valve opening) 4. Turbo-charging for a concurrent
increase in IFCE & BMEP
5
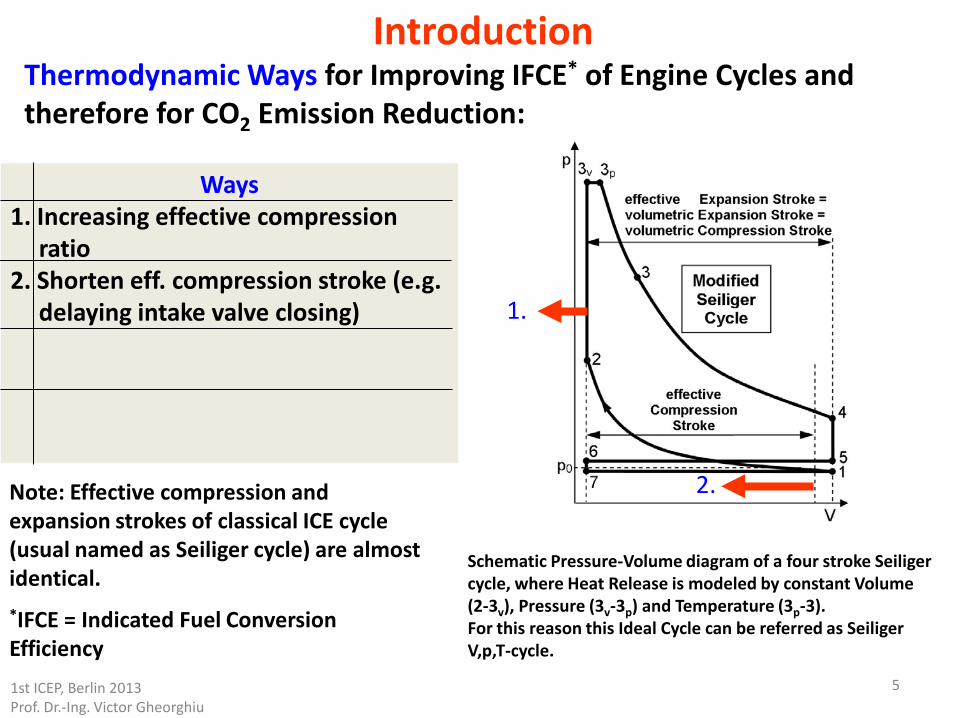
Introduction Thermodynamic Ways for Improving IFCE* of Engine Cycles and therefore for CO2 Emission Reduction:
Schematic Pressure-Volume diagram of a four stroke Seiliger cycle, where Heat Release is modeled by constant Volume (2-3v), Pressure (3v-3p) and Temperature (3p-3). For this reason this Ideal Cycle can be referred as Seiliger V,p,T-cycle.
1.
2.
1st ICEP, Berlin 2013 Prof. Dr.-Ing. Victor Gheorghiu
Note: Effective compression and expansion strokes of classical ICE cycle (usual named as Seiliger cycle) are almost identical.
*IFCE = Indicated Fuel Conversion Efficiency
6
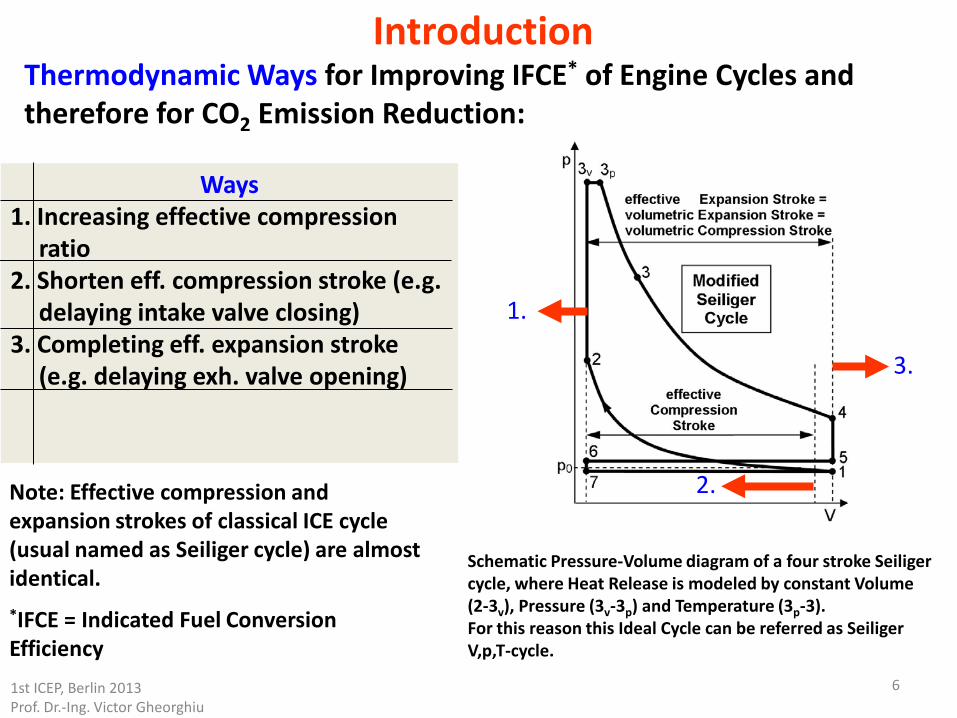
Introduction Thermodynamic Ways for Improving IFCE* of Engine Cycles and therefore for CO2 Emission Reduction:
Ways 1. Increasing effective compression
ratio 2. Shorten eff. compression stroke (e.g.
delaying intake valve closing) 3. Completing eff. expansion stroke
(e.g. delaying exh. valve opening) 4. Turbo-charging for a concurrent
increase in IFCE & BMEP
Schematic Pressure-Volume diagram of a four stroke Seiliger cycle, where Heat Release is modeled by constant Volume (2-3v), Pressure (3v-3p) and Temperature (3p-3). For this reason this Ideal Cycle can be referred as Seiliger V,p,T-cycle.
1.
2.
3.
1st ICEP, Berlin 2013 Prof. Dr.-Ing. Victor Gheorghiu
Note: Effective compression and expansion strokes of classical ICE cycle (usual named as Seiliger cycle) are almost identical.
*IFCE = Indicated Fuel Conversion Efficiency
7
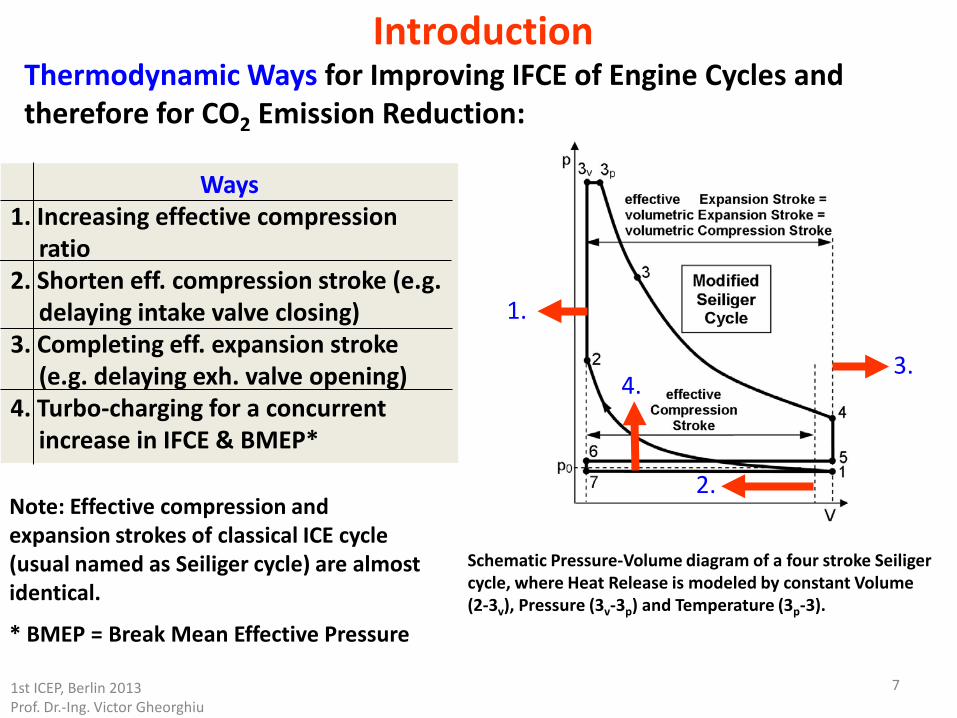
Introduction Thermodynamic Ways for Improving IFCE of Engine Cycles and therefore for CO2 Emission Reduction:
Ways 1. Increasing effective compression
ratio 2. Shorten eff. compression stroke (e.g.
delaying intake valve closing) 3. Completing eff. expansion stroke
(e.g. delaying exh. valve opening) 4. Turbo-charging for a concurrent
increase in IFCE & BMEP*
Schematic Pressure-Volume diagram of a four stroke Seiliger cycle, where Heat Release is modeled by constant Volume (2-3v), Pressure (3v-3p) and Temperature (3p-3).
1.
2.
3. 4.
1st ICEP, Berlin 2013 Prof. Dr.-Ing. Victor Gheorghiu
Note: Effective compression and expansion strokes of classical ICE cycle (usual named as Seiliger cycle) are almost identical.
* BMEP = Break Mean Effective Pressure
8
Introduction
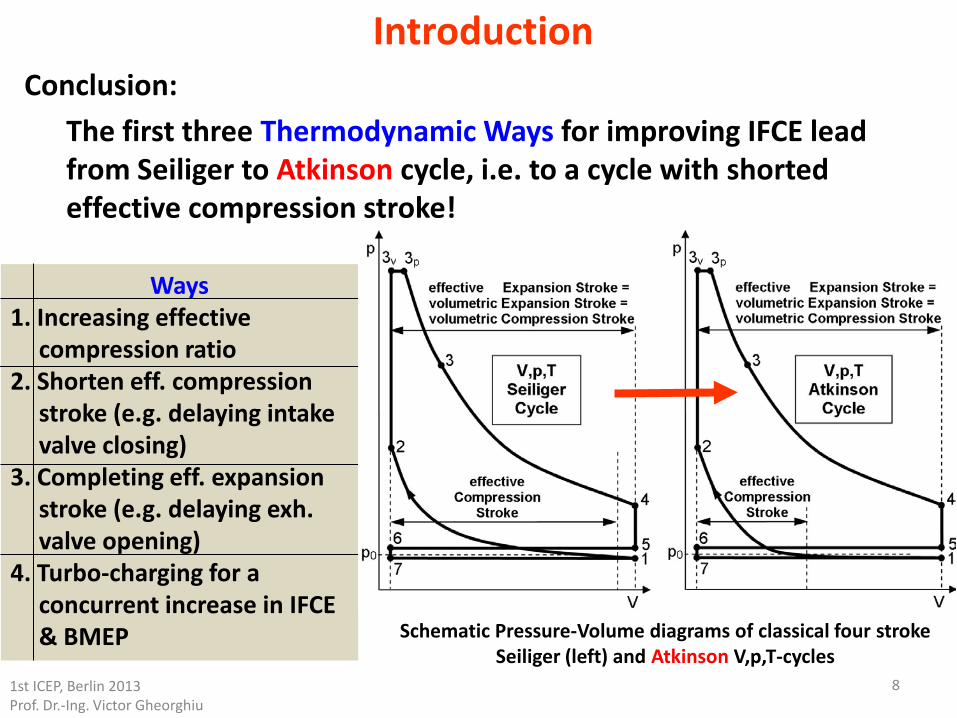
Ways 1. Increasing effective
compression ratio 2. Shorten eff. compression
stroke (e.g. delaying intake valve closing)
3. Completing eff. expansion stroke (e.g. delaying exh. valve opening)
4. Turbo-charging for a concurrent increase in IFCE & BMEP
Conclusion: The first three Thermodynamic Ways for improving IFCE lead from Seiliger to Atkinson cycle, i.e. to a cycle with shorted effective compression stroke!
Schematic Pressure-Volume diagrams of classical four stroke Seiliger (left) and Atkinson V,p,T-cycles
1st ICEP, Berlin 2013 Prof. Dr.-Ing. Victor Gheorghiu
9
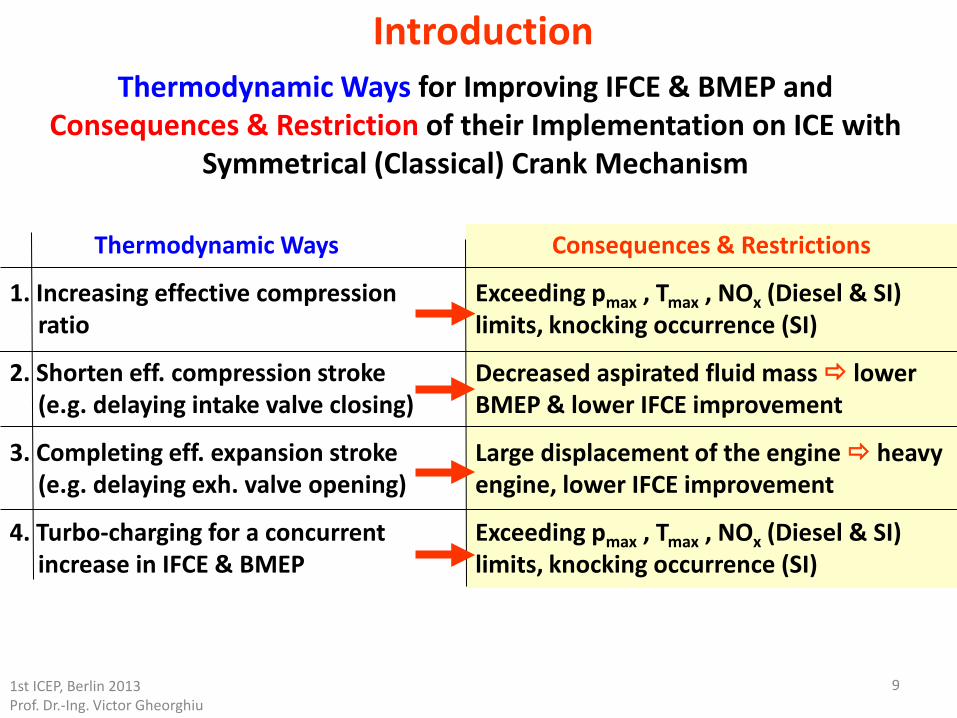
Introduction Thermodynamic Ways for Improving IFCE & BMEP and
Consequences & Restriction of their Implementation on ICE with Symmetrical (Classical) Crank Mechanism
Thermodynamic Ways
1. Increasing effective compression ratio
2. Shorten eff. compression stroke (e.g. delaying intake valve closing)
3. Completing eff. expansion stroke (e.g. delaying exh. valve opening)
4. Turbo-charging for a concurrent increase in IFCE & BMEP
Consequences & Restrictions
Exceeding pmax , Tmax , NOx (Diesel & SI) limits, knocking occurrence (SI)
Decreased aspirated fluid mass lower BMEP & lower IFCE improvement
Large displacement of the engine heavy engine, lower IFCE improvement
Exceeding pmax , Tmax , NOx (Diesel & SI) limits, knocking occurrence (SI)
1st ICEP, Berlin 2013 Prof. Dr.-Ing. Victor Gheorghiu
Introduction
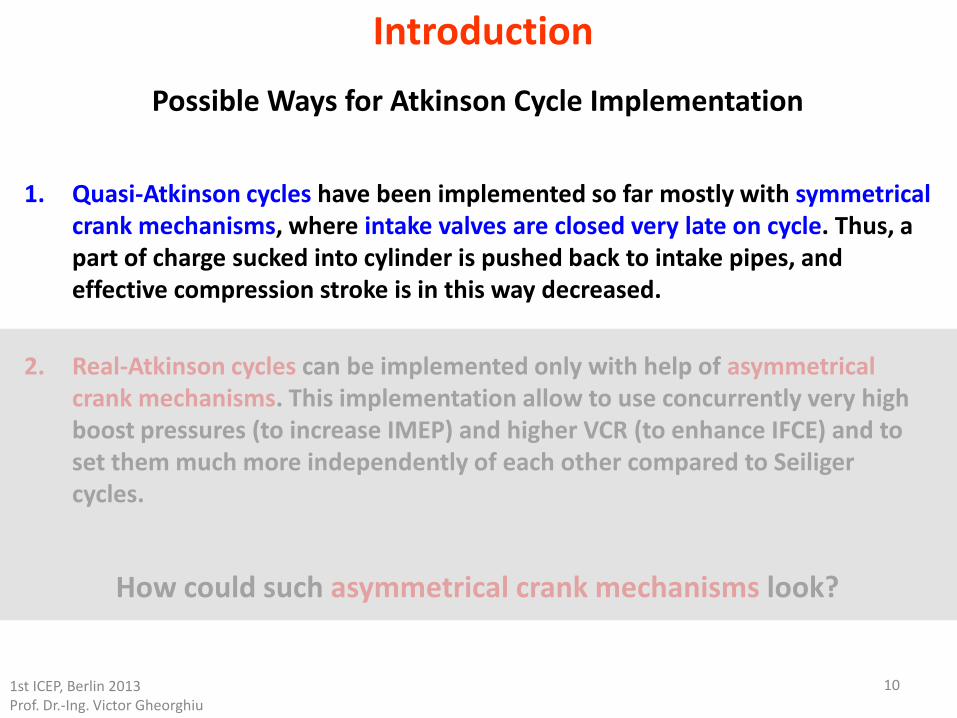
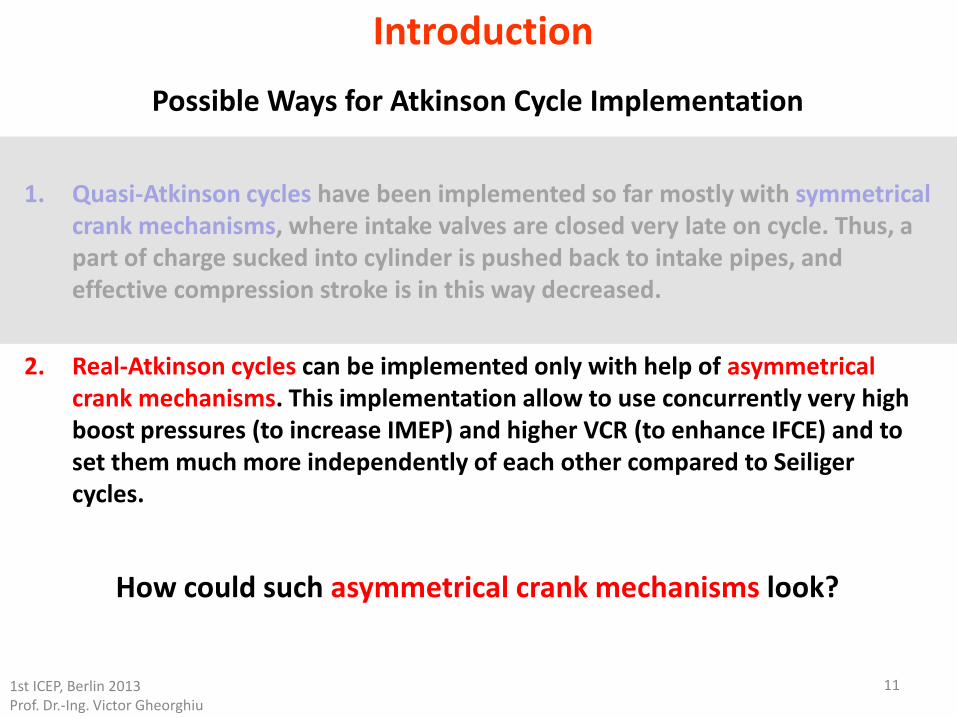
1. Quasi-Atkinson cycles have been implemented so far mostly with symmetrical crank mechanisms, where intake valves are closed very late on cycle. Thus, a part of charge sucked into cylinder is pushed back to intake pipes, and effective compression stroke is in this way decreased.
2. Real-Atkinson cycles can be implemented only with help of asymmetrical
crank mechanisms. This implementation allow to use concurrently very high boost pressures (to increase IMEP) and higher VCR (to enhance IFCE) and to set them much more independently of each other compared to Seiliger cycles.
Possible Ways for Atkinson Cycle Implementation
10 1st ICEP, Berlin 2013 Prof. Dr.-Ing. Victor Gheorghiu
How could such asymmetrical crank mechanisms look?
Introduction
1. Quasi-Atkinson cycles have been implemented so far mostly with symmetrical crank mechanisms, where intake valves are closed very late on cycle. Thus, a part of charge sucked into cylinder is pushed back to intake pipes, and effective compression stroke is in this way decreased.
2. Real-Atkinson cycles can be implemented only with help of asymmetrical
crank mechanisms. This implementation allow to use concurrently very high boost pressures (to increase IMEP) and higher VCR (to enhance IFCE) and to set them much more independently of each other compared to Seiliger cycles.
Possible Ways for Atkinson Cycle Implementation
11 1st ICEP, Berlin 2013 Prof. Dr.-Ing. Victor Gheorghiu
How could such asymmetrical crank mechanisms look?
12
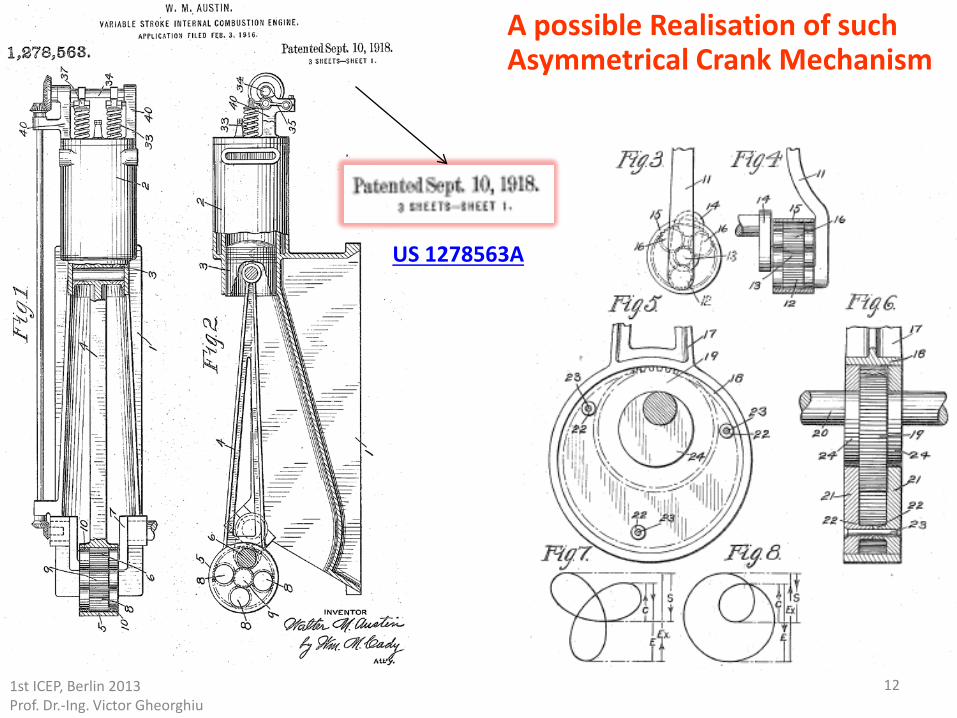
A possible Realisation of such Asymmetrical Crank Mechanism
US 1278563A
1st ICEP, Berlin 2013 Prof. Dr.-Ing. Victor Gheorghiu
13
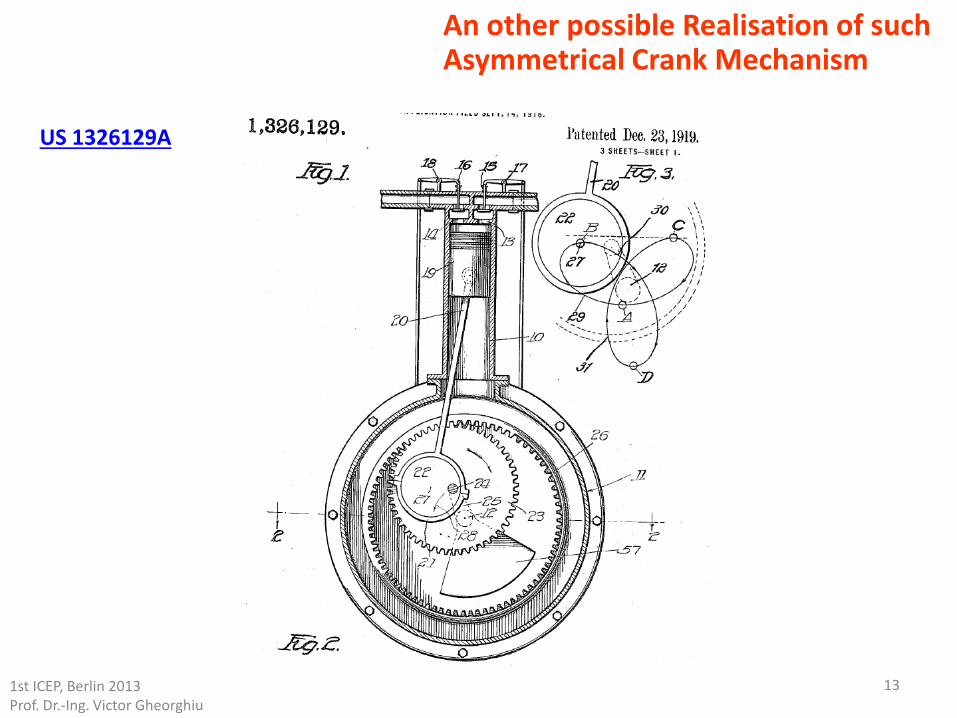
US 1326129A
An other possible Realisation of such Asymmetrical Crank Mechanism
1st ICEP, Berlin 2013 Prof. Dr.-Ing. Victor Gheorghiu
Content Introduction Aspirated Engines Quasi-Atkinson Cycle Implementation (Symmetrical Crank Mechanism) Real-Atkinson Cycle Implementation (Asymmetrical CM)
Turbocharged Engines Quasi-Atkinson Cycle Implementations (Symmetrical CM) Ultra-Downsizing Concept and Goals of these Investigations Real-Atkinson Cycle Implementations (Asymmetrical CM) Searching for Optimal Ratios between Internal (within cylinder) and
External (within turbocharger) Expansions and Compressions (IC A) Real-Atkinson Cycles for Part & Full Loads for steady AFR by means of
concurrently VCR & Boost Pressure Control (IC B) Evaluation of Maximum Improving Potential of Ultra-Downsizing
Performances and Comparison with Seiliger Cycle by means of an Ideal V,p,T-Model
Conclusion
14 1st ICEP, Berlin 2013 Prof. Dr.-Ing. Victor Gheorghiu
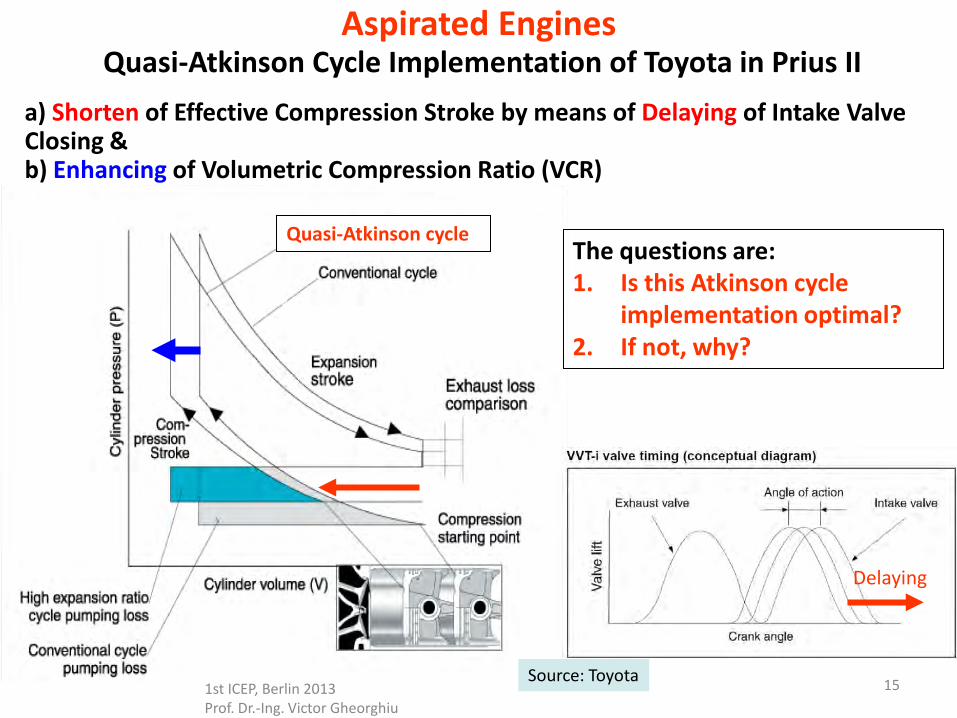
15 Source: Toyota
Delaying
The questions are: 1. Is this Atkinson cycle
implementation optimal? 2. If not, why?
Quasi-Atkinson cycle
Aspirated Engines Quasi-Atkinson Cycle Implementation of Toyota in Prius II
a) Shorten of Effective Compression Stroke by means of Delaying of Intake Valve Closing & b) Enhancing of Volumetric Compression Ratio (VCR)
1st ICEP, Berlin 2013 Prof. Dr.-Ing. Victor Gheorghiu
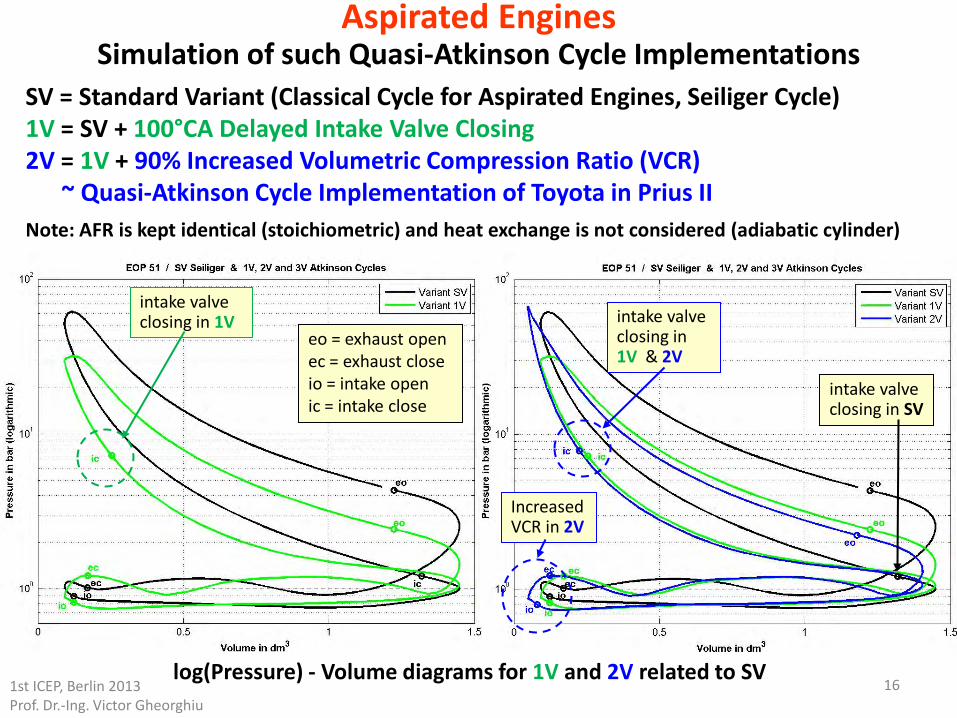
16 log(Pressure) - Volume diagrams for 1V and 2V related to SV
SV = Standard Variant (Classical Cycle for Aspirated Engines, Seiliger Cycle) 1V = SV + 100°CA Delayed Intake Valve Closing 2V = 1V + 90% Increased Volumetric Compression Ratio (VCR) ~ Quasi-Atkinson Cycle Implementation of Toyota in Prius II Note: AFR is kept identical (stoichiometric) and heat exchange is not considered (adiabatic cylinder)
intake valve closing in SV
eo = exhaust open ec = exhaust close io = intake open ic = intake close
intake valve closing in 1V
Increased VCR in 2V
intake valve closing in 1V & 2V
Aspirated Engines Simulation of such Quasi-Atkinson Cycle Implementations
1st ICEP, Berlin 2013 Prof. Dr.-Ing. Victor Gheorghiu
17
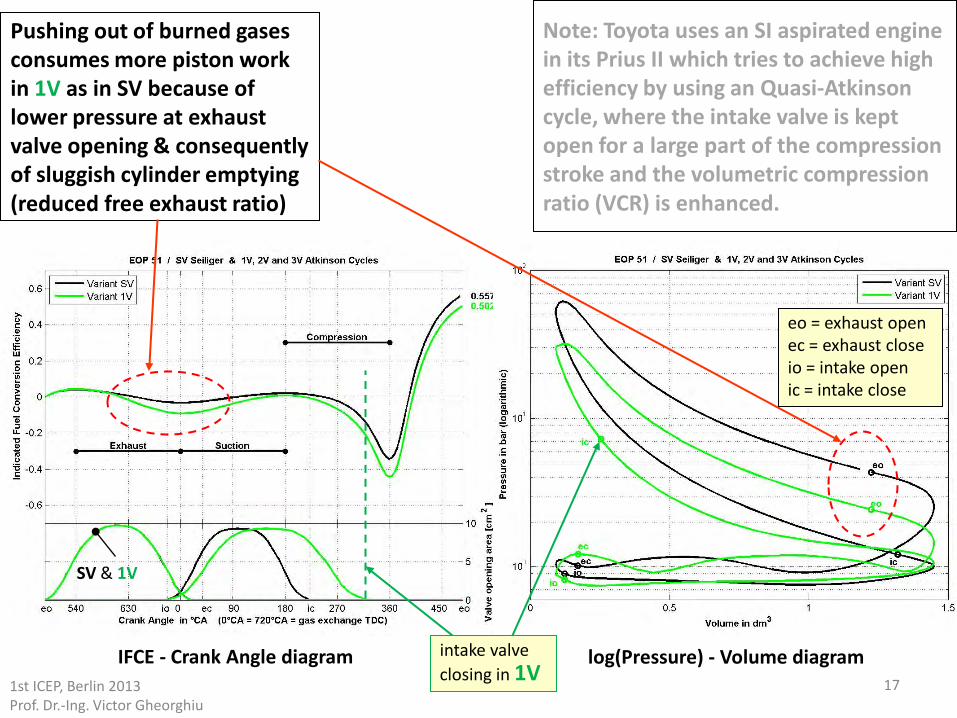
IFCE - Crank Angle diagram
Pushing out of burned gases consumes more piston work in 1V as in SV because of lower pressure at exhaust valve opening & consequently of sluggish cylinder emptying (reduced free exhaust ratio)
log(Pressure) - Volume diagram
Note: Toyota uses an SI aspirated engine in its Prius II which tries to achieve high efficiency by using an Quasi-Atkinson cycle, where the intake valve is kept open for a large part of the compression stroke and the volumetric compression ratio (VCR) is enhanced.
SV & 1V
eo = exhaust open ec = exhaust close io = intake open ic = intake close
intake valve closing in 1V
1st ICEP, Berlin 2013 Prof. Dr.-Ing. Victor Gheorghiu
18
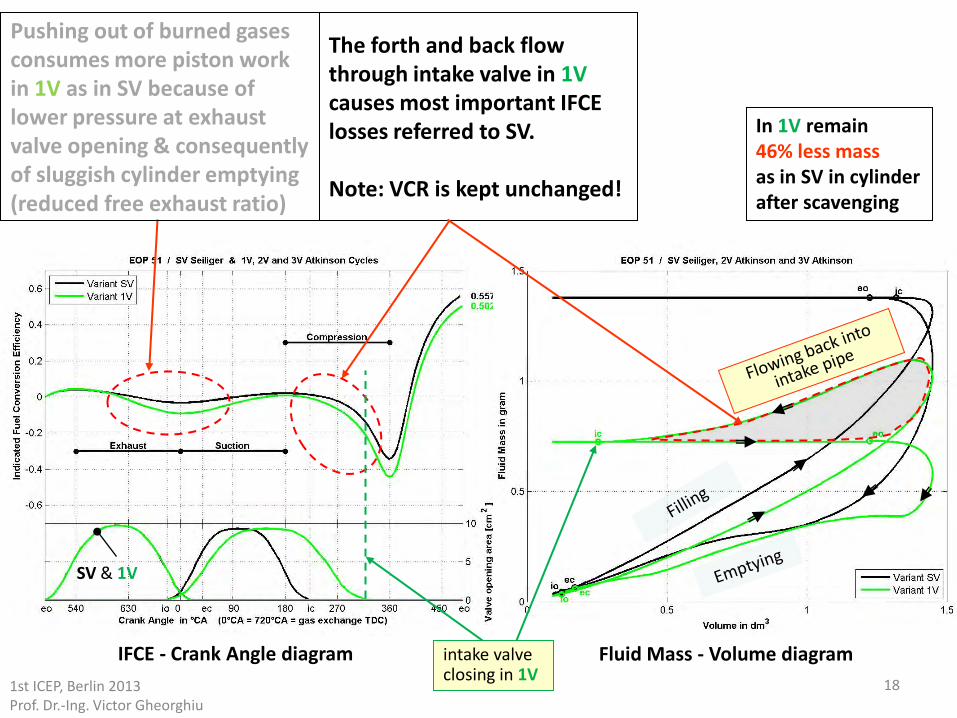
IFCE - Crank Angle diagram
The forth and back flow through intake valve in 1V causes most important IFCE losses referred to SV. Note: VCR is kept unchanged!
Fluid Mass - Volume diagram
SV & 1V
In 1V remain 46% less mass as in SV in cylinder after scavenging
intake valve closing in 1V
Pushing out of burned gases consumes more piston work in 1V as in SV because of lower pressure at exhaust valve opening & consequently of sluggish cylinder emptying (reduced free exhaust ratio)
1st ICEP, Berlin 2013 Prof. Dr.-Ing. Victor Gheorghiu
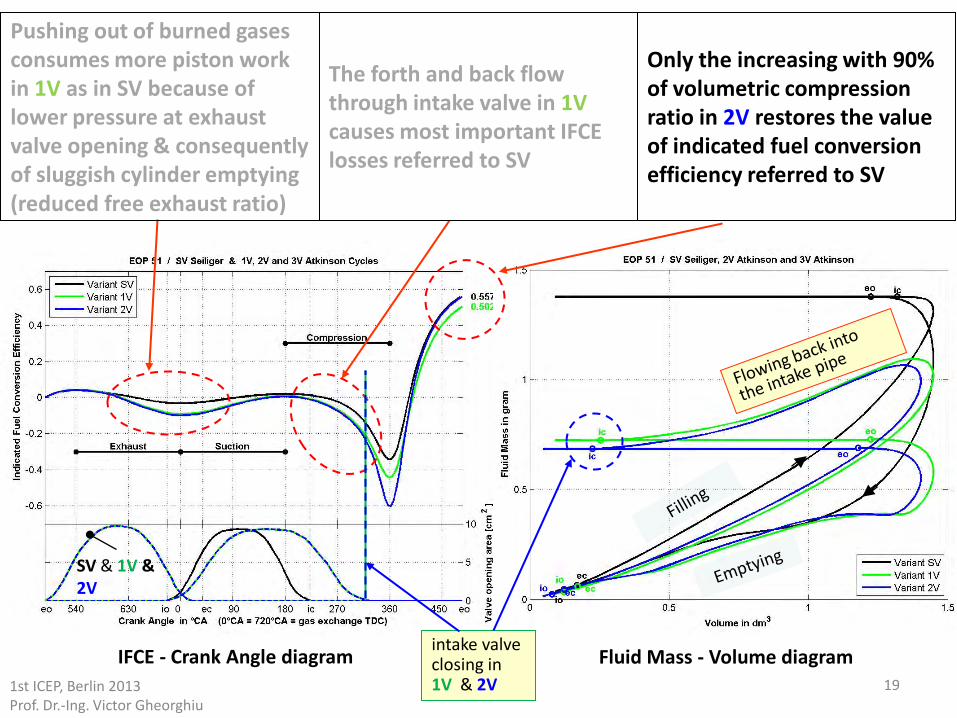
19
IFCE - Crank Angle diagram Fluid Mass - Volume diagram
SV & 1V & 2V
Only the increasing with 90% of volumetric compression ratio in 2V restores the value of indicated fuel conversion efficiency referred to SV
intake valve closing in 1V & 2V
The forth and back flow through intake valve in 1V causes most important IFCE losses referred to SV
Pushing out of burned gases consumes more piston work in 1V as in SV because of lower pressure at exhaust valve opening & consequently of sluggish cylinder emptying (reduced free exhaust ratio)
1st ICEP, Berlin 2013 Prof. Dr.-Ing. Victor Gheorghiu
20
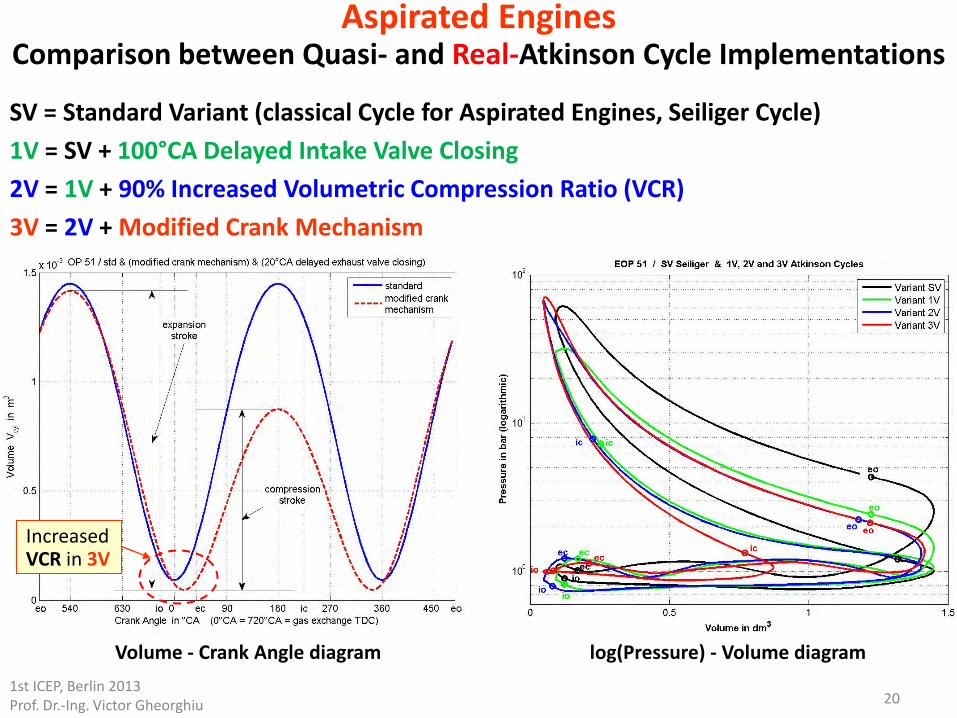
log(Pressure) - Volume diagram Volume - Crank Angle diagram
SV = Standard Variant (classical Cycle for Aspirated Engines, Seiliger Cycle) 1V = SV + 100°CA Delayed Intake Valve Closing 2V = 1V + 90% Increased Volumetric Compression Ratio (VCR) 3V = 2V + Modified Crank Mechanism
1st ICEP, Berlin 2013 Prof. Dr.-Ing. Victor Gheorghiu
Increased VCR in 3V
Aspirated Engines Comparison between Quasi- and Real-Atkinson Cycle Implementations
21
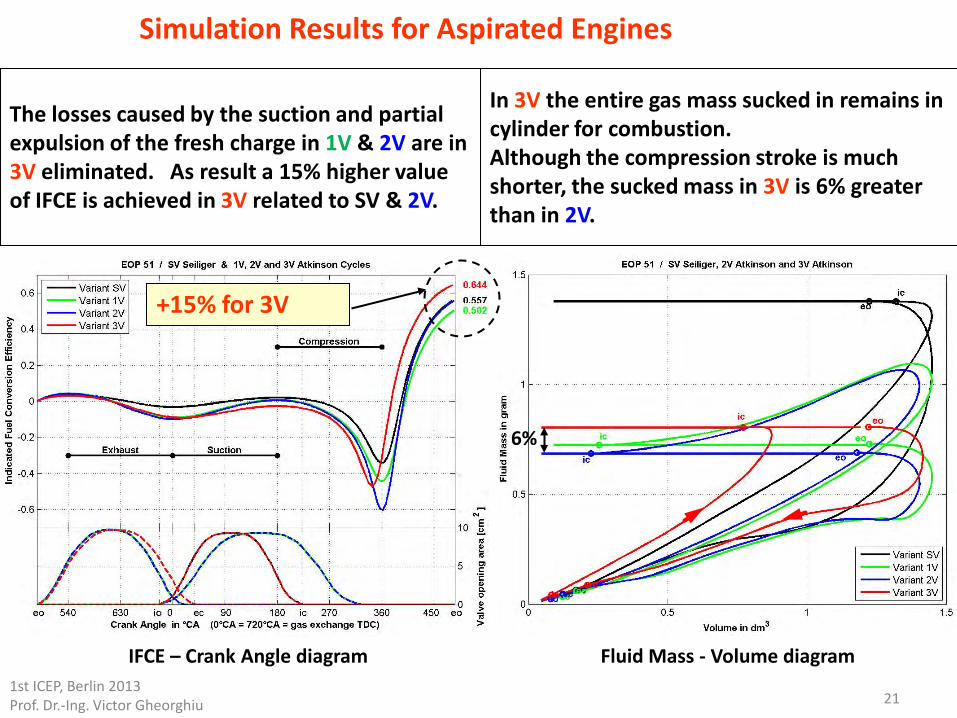
+15% for 3V
Simulation Results for Aspirated Engines
6%
The losses caused by the suction and partial expulsion of the fresh charge in 1V & 2V are in 3V eliminated. As result a 15% higher value of IFCE is achieved in 3V related to SV & 2V.
In 3V the entire gas mass sucked in remains in cylinder for combustion. Although the compression stroke is much shorter, the sucked mass in 3V is 6% greater than in 2V.
Fluid Mass - Volume diagram IFCE – Crank Angle diagram 1st ICEP, Berlin 2013 Prof. Dr.-Ing. Victor Gheorghiu
22
In the case of aspirated engines, where the intake valve is kept open for a large part of the compression, the advantage of performing the cycle using this Quasi-Atkinson cycle implementation is of little benefit for following reasons: The Gain in IFCE is modest and is largely dependent on the fine tuning of all
parameters Pushing out of the burned gases consumed more piston work as in SV Forth & back flow through intake valve causes most important losses in IFCE BMEP is low because of the decreased retained mass of fresh charge in cylinder
before combustion. As consequence a relatively large displacement and therefore heavy engine is needed to power the vehicle.
Supercharging seem to be the necessary solution to compensate the diminishing of BMEP and for enhancing of IFCE.
Aspirated Engines
Conclusion referred to this Quasi-Atkinson Cycle Implementation
1st ICEP, Berlin 2013 Prof. Dr.-Ing. Victor Gheorghiu
Content Introduction Aspirated Engines Quasi-Atkinson Cycle Implementation (Symmetrical Crank Mechanism) Real-Atkinson Cycle Implementation (Asymmetrical CM)
Turbocharged Engines Quasi-Atkinson Cycle Implementations (Symmetrical CM) Ultra-Downsizing Concept and Goals of these Investigations Real-Atkinson Cycle Implementations (Asymmetrical CM) Searching for Optimal Ratios between Internal (within cylinder) and
External (within turbocharger) Expansions and Compressions (IC A) Real-Atkinson Cycles for Part & Full Loads for steady AFR by means of
concurrently VCR & Boost Pressure Control (IC B) Evaluation of Maximum Improving Potential of Ultra-Downsizing
Performances and Comparison with Seiliger Cycle by means of an Ideal V,p,T-Model
Conclusion
23 1st ICEP, Berlin 2013 Prof. Dr.-Ing. Victor Gheorghiu
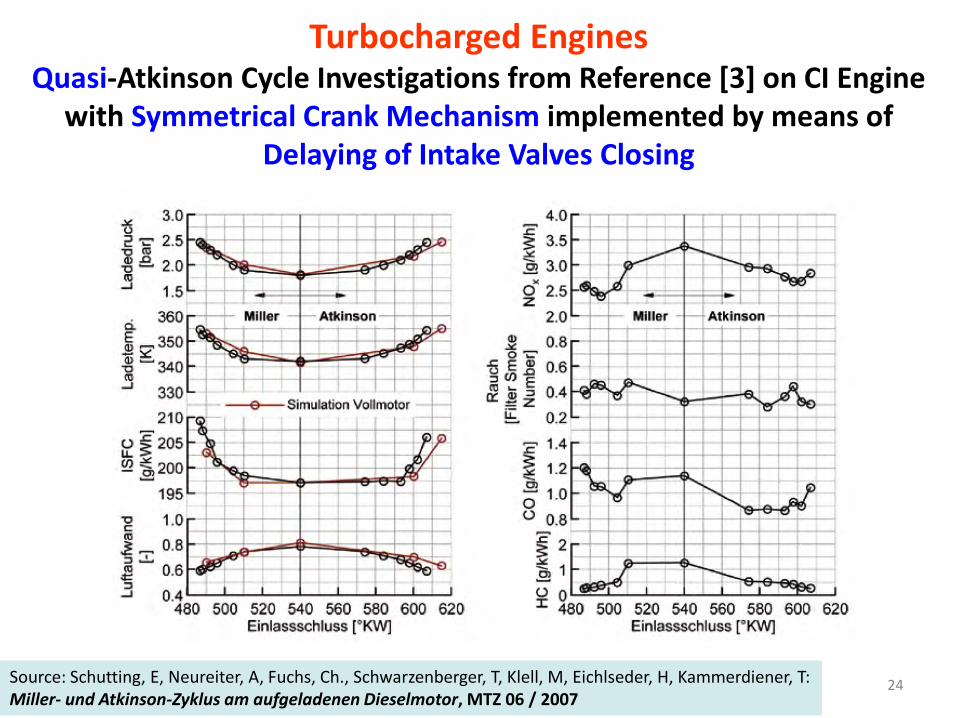
Source: Schutting, E, Neureiter, A, Fuchs, Ch., Schwarzenberger, T, Klell, M, Eichlseder, H, Kammerdiener, T: Miller- und Atkinson-Zyklus am aufgeladenen Dieselmotor, MTZ 06 / 2007
24
Turbocharged Engines Quasi-Atkinson Cycle Investigations from Reference [3] on CI Engine
with Symmetrical Crank Mechanism implemented by means of Delaying of Intake Valves Closing
25
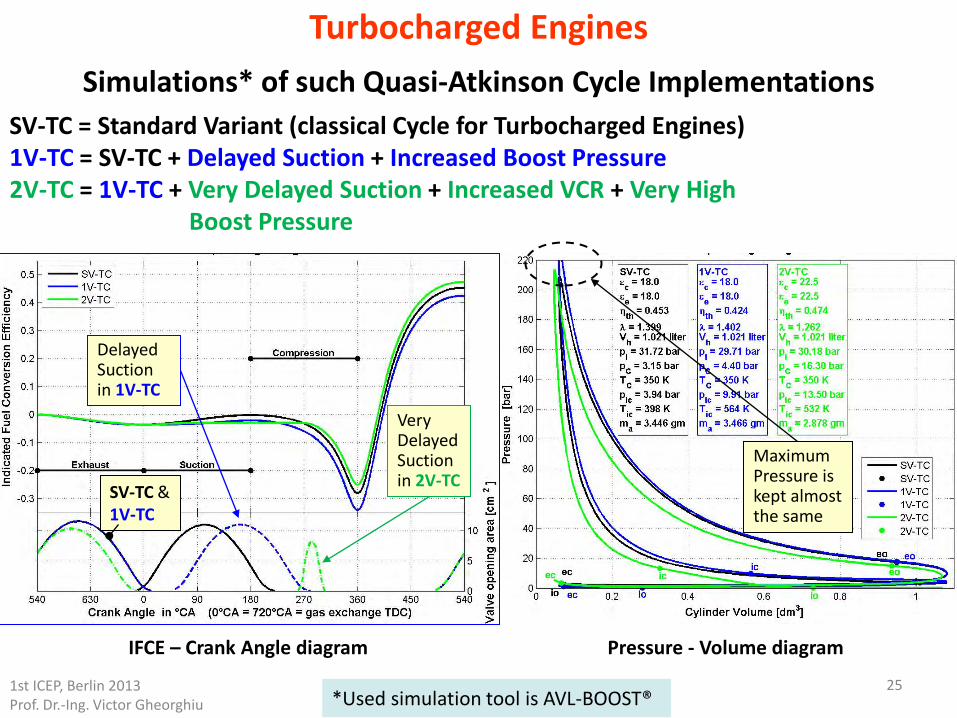
Turbocharged Engines Simulations* of such Quasi-Atkinson Cycle Implementations
Pressure - Volume diagram IFCE – Crank Angle diagram
SV-TC & 1V-TC
Delayed Suction in 1V-TC
Very Delayed Suction in 2V-TC
SV-TC = Standard Variant (classical Cycle for Turbocharged Engines) 1V-TC = SV-TC + Delayed Suction + Increased Boost Pressure 2V-TC = 1V-TC + Very Delayed Suction + Increased VCR + Very High Boost Pressure
1st ICEP, Berlin 2013 Prof. Dr.-Ing. Victor Gheorghiu *Used simulation tool is AVL-BOOST®
Maximum Pressure is kept almost the same
26
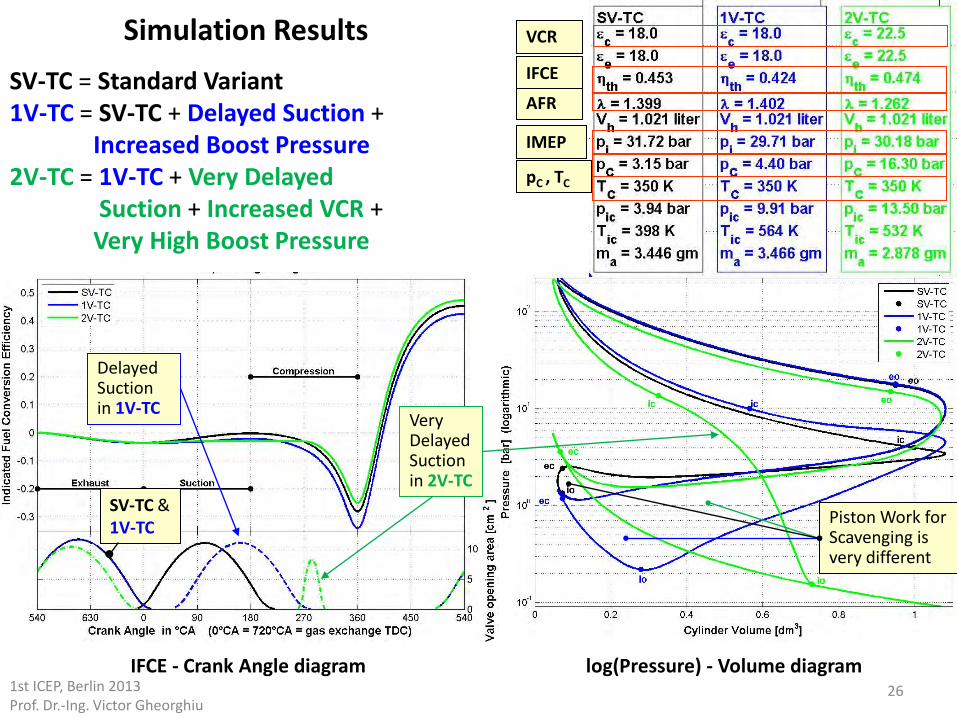
Simulation Results SV-TC = Standard Variant 1V-TC = SV-TC + Delayed Suction + Increased Boost Pressure 2V-TC = 1V-TC + Very Delayed Suction + Increased VCR + Very High Boost Pressure
log(Pressure) - Volume diagram IFCE - Crank Angle diagram
VCR
AFR
IMEP
pC , TC
IFCE
Piston Work for Scavenging is very different
Delayed Suction in 1V-TC
Very Delayed Suction in 2V-TC
1st ICEP, Berlin 2013 Prof. Dr.-Ing. Victor Gheorghiu
SV-TC & 1V-TC
27
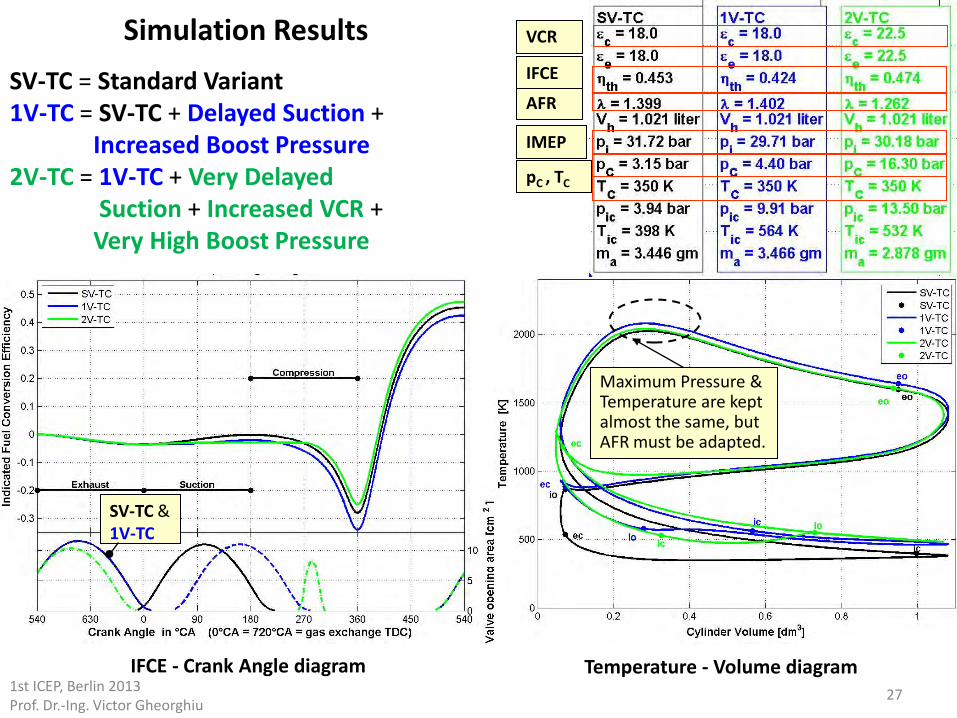
Temperature - Volume diagram IFCE - Crank Angle diagram
Maximum Pressure & Temperature are kept almost the same, but AFR must be adapted.
VCR
AFR
IMEP
pC , TC
IFCE
1st ICEP, Berlin 2013 Prof. Dr.-Ing. Victor Gheorghiu
Simulation Results SV-TC = Standard Variant 1V-TC = SV-TC + Delayed Suction + Increased Boost Pressure 2V-TC = 1V-TC + Very Delayed Suction + Increased VCR + Very High Boost Pressure
SV-TC & 1V-TC
28
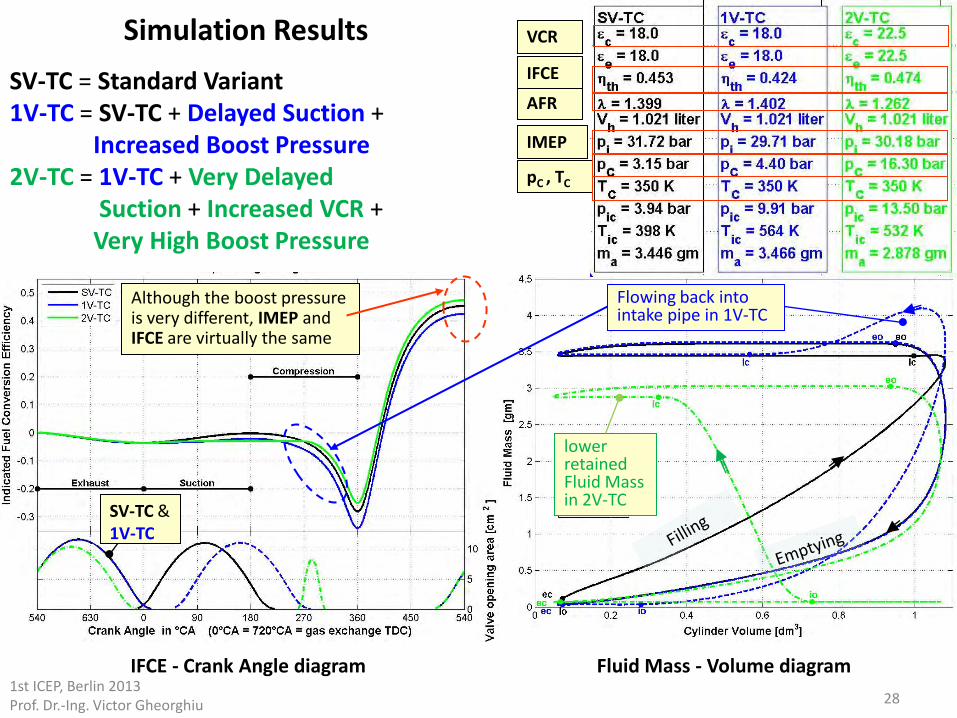
Fluid Mass - Volume diagram IFCE - Crank Angle diagram
Flowing back into intake pipe in 1V-TC
lower retained Fluid Mass in 2V-TC
VCR
AFR
IMEP
pC , TC
IFCE
Although the boost pressure is very different, IMEP and IFCE are virtually the same
Simulation Results SV-TC = Standard Variant 1V-TC = SV-TC + Delayed Suction + Increased Boost Pressure 2V-TC = 1V-TC + Very Delayed Suction + Increased VCR + Very High Boost Pressure
1st ICEP, Berlin 2013 Prof. Dr.-Ing. Victor Gheorghiu
SV-TC & 1V-TC
29
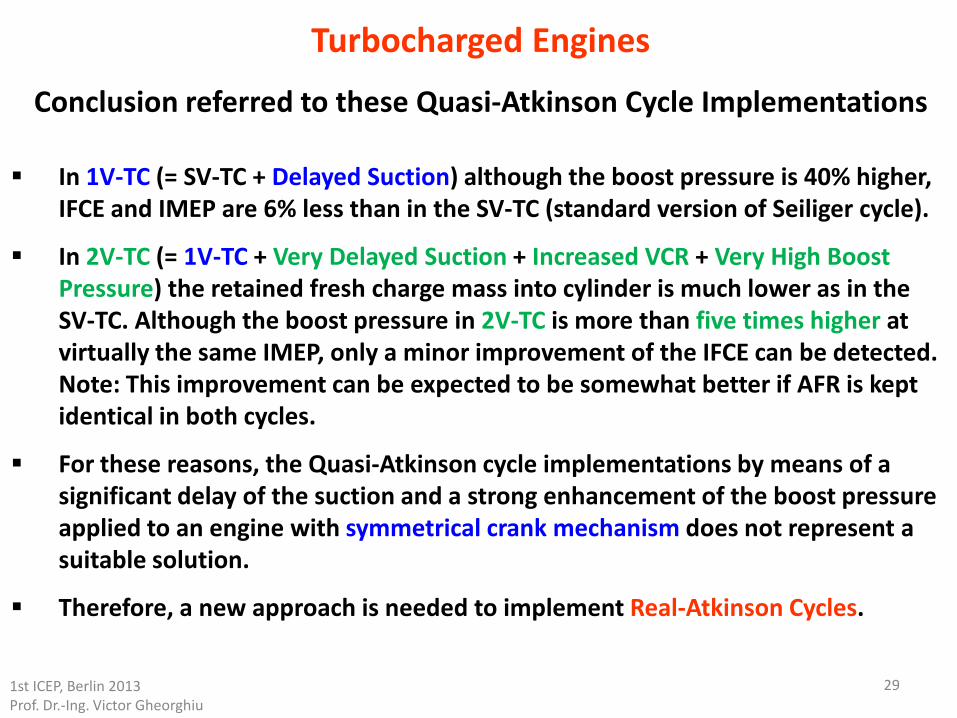
In 1V-TC (= SV-TC + Delayed Suction) although the boost pressure is 40% higher, IFCE and IMEP are 6% less than in the SV-TC (standard version of Seiliger cycle).
In 2V-TC (= 1V-TC + Very Delayed Suction + Increased VCR + Very High Boost Pressure) the retained fresh charge mass into cylinder is much lower as in the SV-TC. Although the boost pressure in 2V-TC is more than five times higher at virtually the same IMEP, only a minor improvement of the IFCE can be detected. Note: This improvement can be expected to be somewhat better if AFR is kept identical in both cycles.
For these reasons, the Quasi-Atkinson cycle implementations by means of a significant delay of the suction and a strong enhancement of the boost pressure applied to an engine with symmetrical crank mechanism does not represent a suitable solution.
Therefore, a new approach is needed to implement Real-Atkinson Cycles.
Turbocharged Engines
Conclusion referred to these Quasi-Atkinson Cycle Implementations
1st ICEP, Berlin 2013 Prof. Dr.-Ing. Victor Gheorghiu
Content Introduction Aspirated Engines Quasi-Atkinson Cycle Implementation (Symmetrical Crank Mechanism) Real-Atkinson Cycle Implementation (Asymmetrical CM)
Turbocharged Engines Quasi-Atkinson Cycle Implementations (Symmetrical CM) Ultra-Downsizing Concept and Goals of these Investigations Real-Atkinson Cycle Implementations (Asymmetrical CM) Searching for Optimal Ratios between Internal (within cylinder) and
External (within turbocharger) Expansions and Compressions (IC A) Real-Atkinson Cycles for Part & Full Loads for steady AFR by means of
concurrently VCR & Boost Pressure Control (IC B) Evaluation of Maximum Improving Potential of Ultra-Downsizing
Performances and Comparison with Seiliger Cycle by means of an Ideal V,p,T-Model
Conclusion
30 1st ICEP, Berlin 2013 Prof. Dr.-Ing. Victor Gheorghiu
31
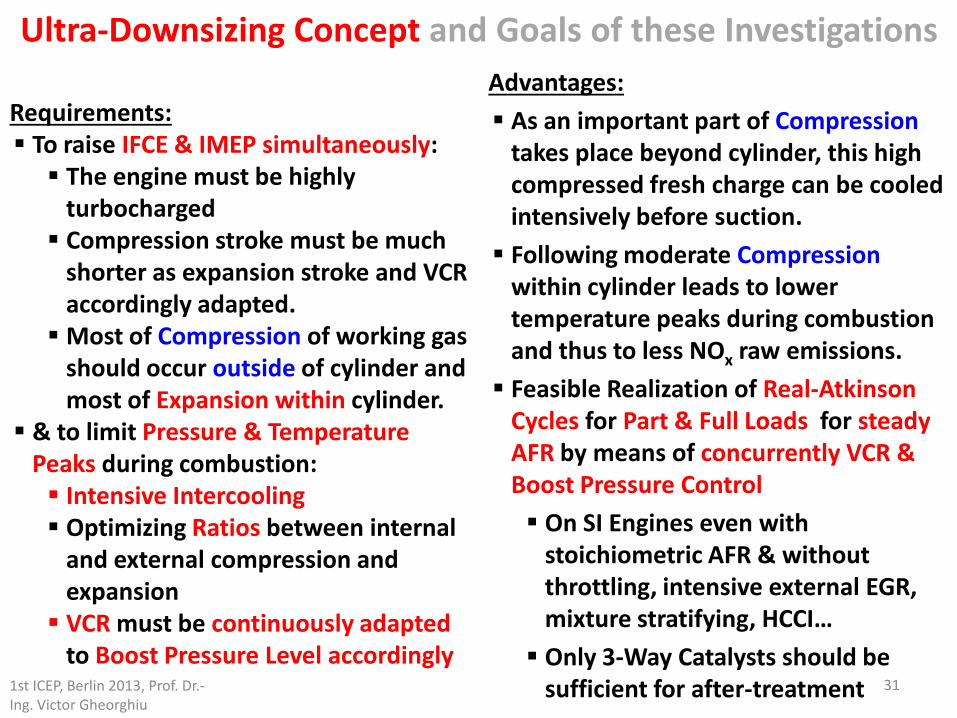
Requirements: To raise IFCE & IMEP simultaneously: The engine must be highly
turbocharged Compression stroke must be much
shorter as expansion stroke and VCR accordingly adapted. Most of Compression of working gas
should occur outside of cylinder and most of Expansion within cylinder.
& to limit Pressure & Temperature Peaks during combustion: Intensive Intercooling Optimizing Ratios between internal
and external compression and expansion VCR must be continuously adapted
to Boost Pressure Level accordingly
Advantages: As an important part of Compression
takes place beyond cylinder, this high compressed fresh charge can be cooled intensively before suction. Following moderate Compression
within cylinder leads to lower temperature peaks during combustion and thus to less NOx raw emissions. Feasible Realization of Real-Atkinson
Cycles for Part & Full Loads for steady AFR by means of concurrently VCR & Boost Pressure Control On SI Engines even with
stoichiometric AFR & without throttling, intensive external EGR, mixture stratifying, HCCI… Only 3-Way Catalysts should be
sufficient for after-treatment
Ultra-Downsizing Concept and Goals of these Investigations
1st ICEP, Berlin 2013, Prof. Dr.-Ing. Victor Gheorghiu
32 1st ICEP, Berlin 2013, Prof. Dr.-Ing. Victor Gheorghiu
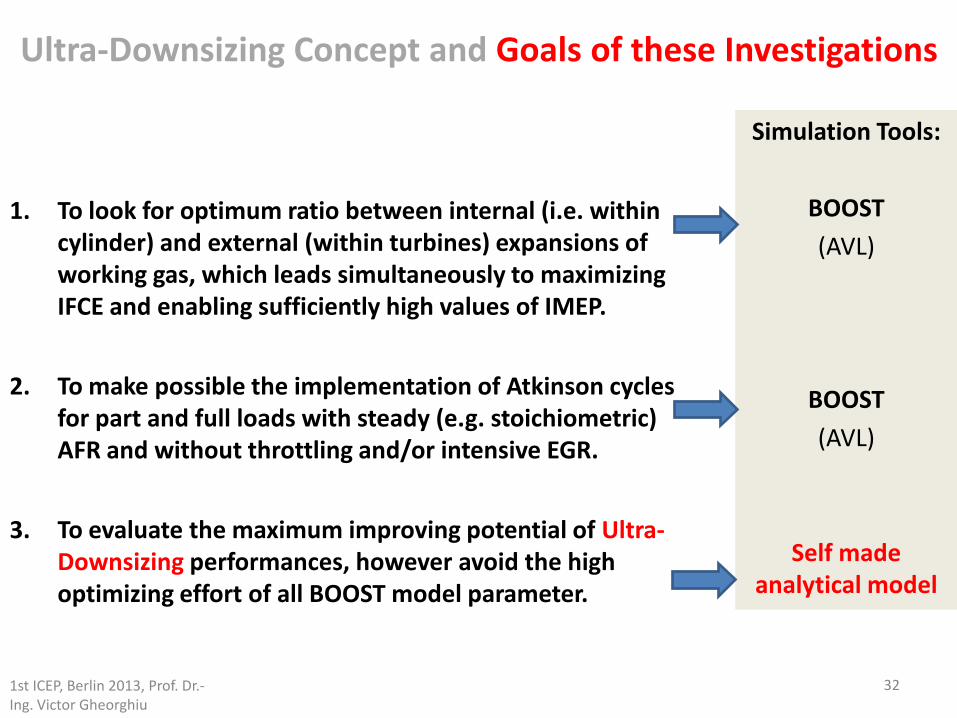
1. To look for optimum ratio between internal (i.e. within cylinder) and external (within turbines) expansions of working gas, which leads simultaneously to maximizing IFCE and enabling sufficiently high values of IMEP.
2. To make possible the implementation of Atkinson cycles for part and full loads with steady (e.g. stoichiometric) AFR and without throttling and/or intensive EGR.
3. To evaluate the maximum improving potential of Ultra-Downsizing performances, however avoid the high optimizing effort of all BOOST model parameter.
Simulation Tools:
BOOST (AVL)
BOOST (AVL)
Self made analytical model
Ultra-Downsizing Concept and Goals of these Investigations
33 1st ICEP, Berlin 2013, Prof. Dr.-Ing. Victor Gheorghiu
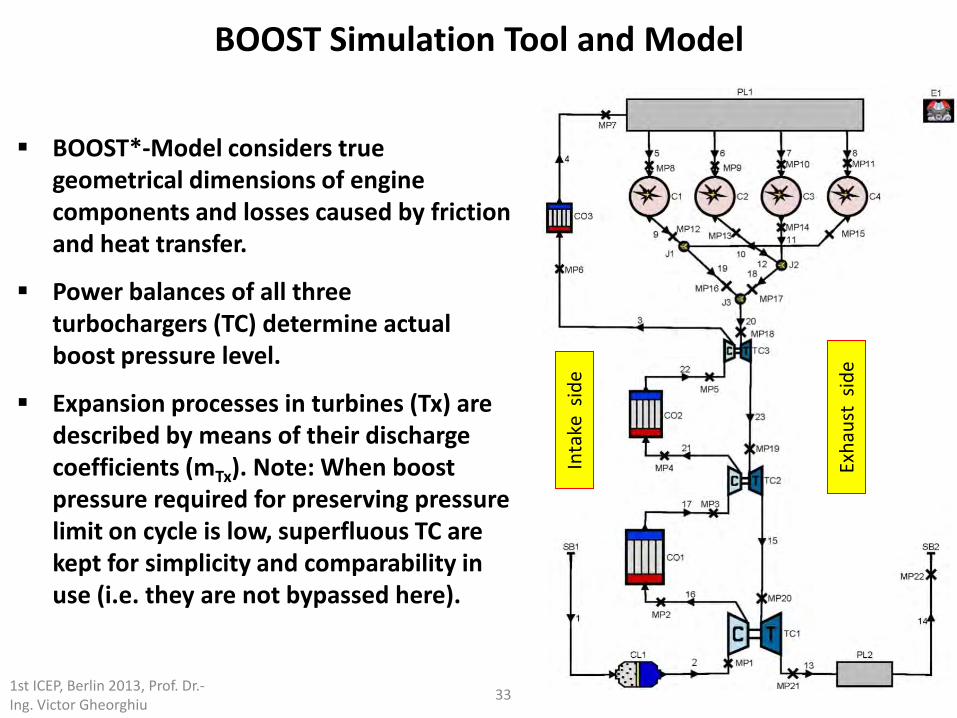
BOOST Simulation Tool and Model
BOOST*-Model considers true geometrical dimensions of engine components and losses caused by friction and heat transfer.
Power balances of all three turbochargers (TC) determine actual boost pressure level.
Expansion processes in turbines (Tx) are described by means of their discharge coefficients (mTx). Note: When boost pressure required for preserving pressure limit on cycle is low, superfluous TC are kept for simplicity and comparability in use (i.e. they are not bypassed here).
Inta
ke s
ide
Exha
ust
side
34 1st ICEP, Berlin 2013, Prof. Dr.-Ing. Victor Gheorghiu
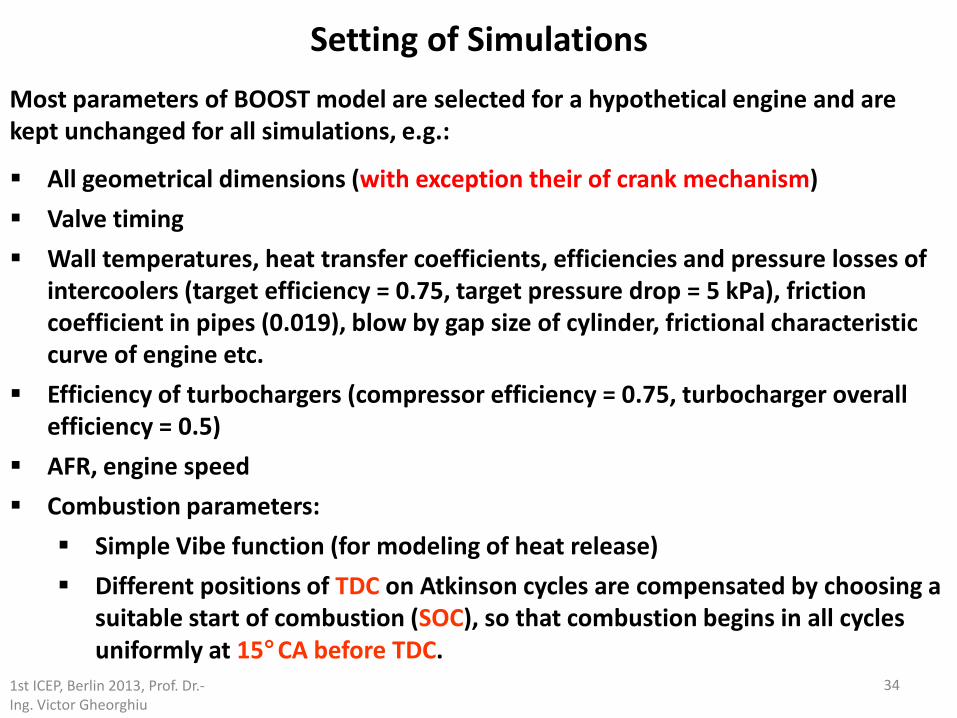
Setting of Simulations Most parameters of BOOST model are selected for a hypothetical engine and are kept unchanged for all simulations, e.g.:
All geometrical dimensions (with exception their of crank mechanism) Valve timing Wall temperatures, heat transfer coefficients, efficiencies and pressure losses of
intercoolers (target efficiency = 0.75, target pressure drop = 5 kPa), friction coefficient in pipes (0.019), blow by gap size of cylinder, frictional characteristic curve of engine etc.
Efficiency of turbochargers (compressor efficiency = 0.75, turbocharger overall efficiency = 0.5)
AFR, engine speed Combustion parameters:
Simple Vibe function (for modeling of heat release) Different positions of TDC on Atkinson cycles are compensated by choosing a
suitable start of combustion (SOC), so that combustion begins in all cycles uniformly at 15°CA before TDC.
Content Introduction Aspirated Engines Quasi-Atkinson Cycle Implementation (Symmetrical Crank Mechanism) Real-Atkinson Cycle Implementation (Asymmetrical CM)
Turbocharged Engines Quasi-Atkinson Cycle Implementations (Symmetrical CM) Ultra-Downsizing Concept and Goals of these Investigations Real-Atkinson Cycle Implementations (Asymmetrical CM) Searching for Optimal Ratios between Internal (within cylinder) and
External (within turbocharger) Expansions and Compressions (IC A) Real-Atkinson Cycles for Part & Full Loads for steady AFR by means of
concurrently VCR & Boost Pressure Control (IC B) Evaluation of Maximum Improving Potential of Ultra-Downsizing
Performances and Comparison with Seiliger Cycle by means of an Ideal V,p,T-Model
Conclusion
35 1st ICEP, Berlin 2013 Prof. Dr.-Ing. Victor Gheorghiu
36 1st ICEP, Berlin 2013, Prof. Dr.-Ing. Victor Gheorghiu
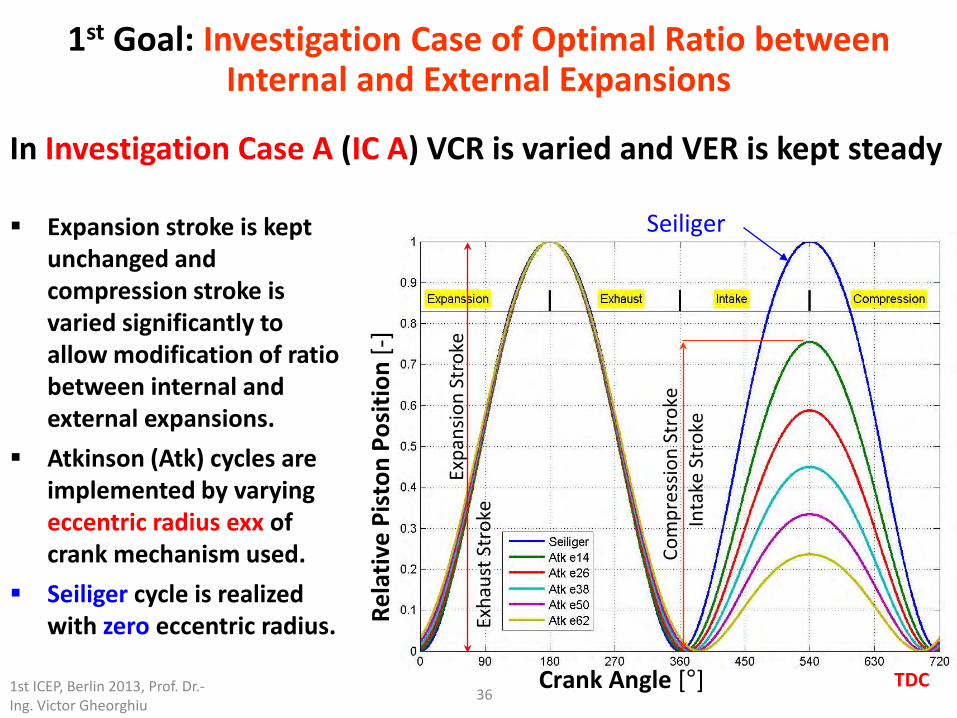
1st Goal: Investigation Case of Optimal Ratio between Internal and External Expansions
In Investigation Case A (IC A) VCR is varied and VER is kept steady
Expansion stroke is kept unchanged and compression stroke is varied significantly to allow modification of ratio between internal and external expansions.
Atkinson (Atk) cycles are implemented by varying eccentric radius exx of crank mechanism used.
Seiliger cycle is realized with zero eccentric radius.
TDC
Seiliger
Rela
tive
Pist
on P
ositi
on [-
]
Crank Angle [°]
Expa
nsio
n St
roke
Com
pres
sion
Stro
ke
Inta
ke S
trok
e
Exha
ust S
trok
e
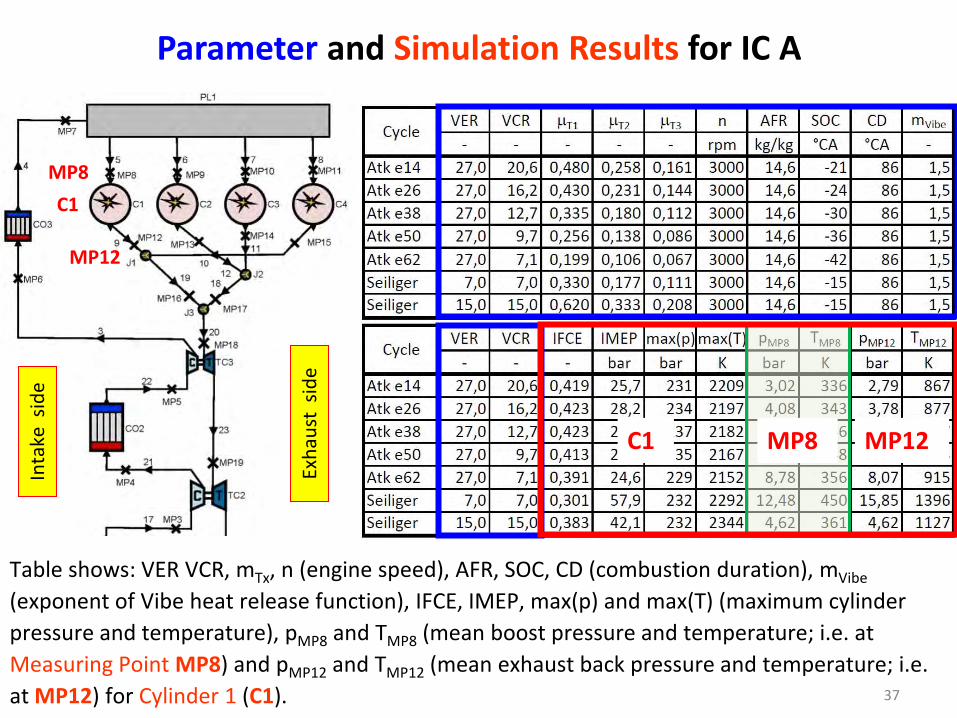
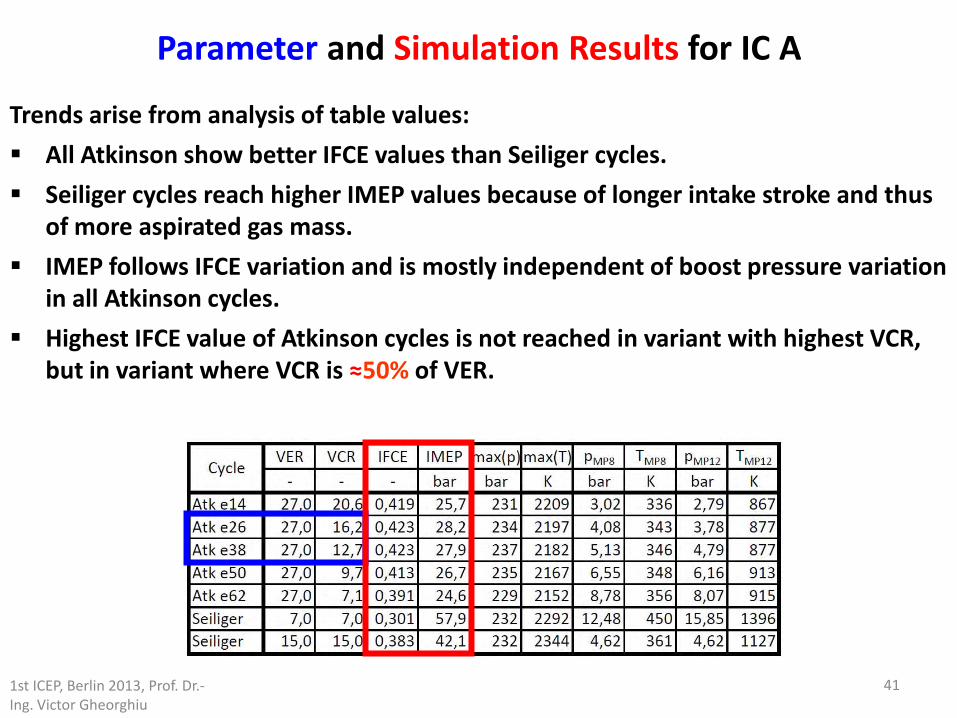
Table shows: VER VCR, mTx, n (engine speed), AFR, SOC, CD (combustion duration), mVibe (exponent of Vibe heat release function), IFCE, IMEP, max(p) and max(T) (maximum cylinder pressure and temperature), pMP8 and TMP8 (mean boost pressure and temperature; i.e. at Measuring Point MP8) and pMP12 and TMP12 (mean exhaust back pressure and temperature; i.e. at MP12) for Cylinder 1 (C1). 37
Parameter and Simulation Results for IC A
MP8
MP12
C1
Inta
ke s
ide
Exha
ust
side
MP8 MP12 C1
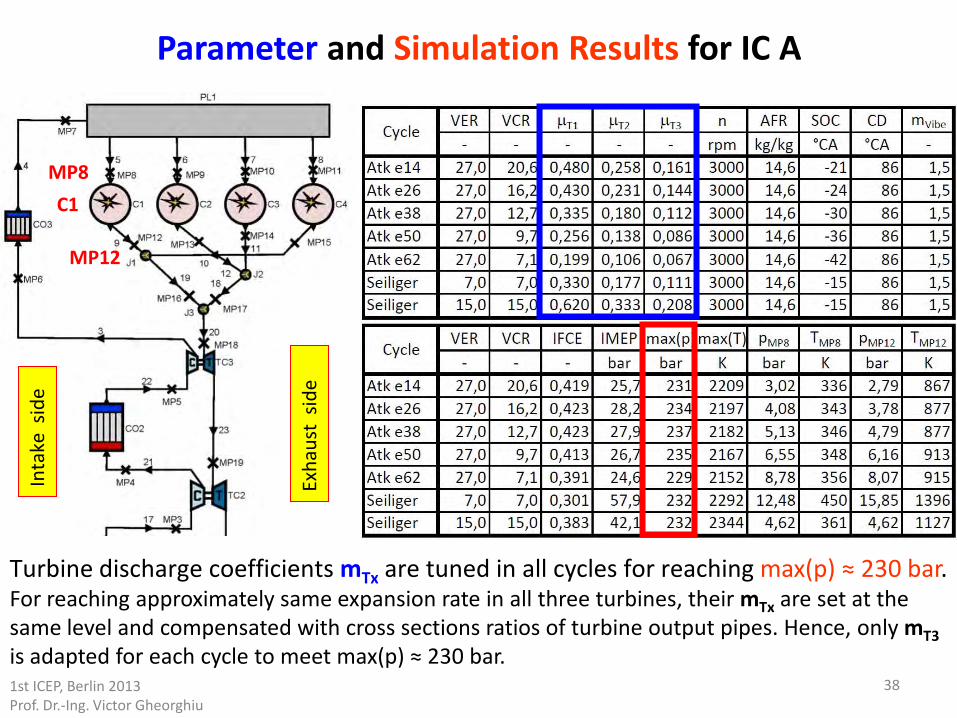
Turbine discharge coefficients mTx are tuned in all cycles for reaching max(p) ≈ 230 bar. For reaching approximately same expansion rate in all three turbines, their mTx are set at the same level and compensated with cross sections ratios of turbine output pipes. Hence, only mT3 is adapted for each cycle to meet max(p) ≈ 230 bar.
38
Parameter and Simulation Results for IC A
MP8
MP12
C1
Inta
ke s
ide
Exha
ust
side
1st ICEP, Berlin 2013 Prof. Dr.-Ing. Victor Gheorghiu
39
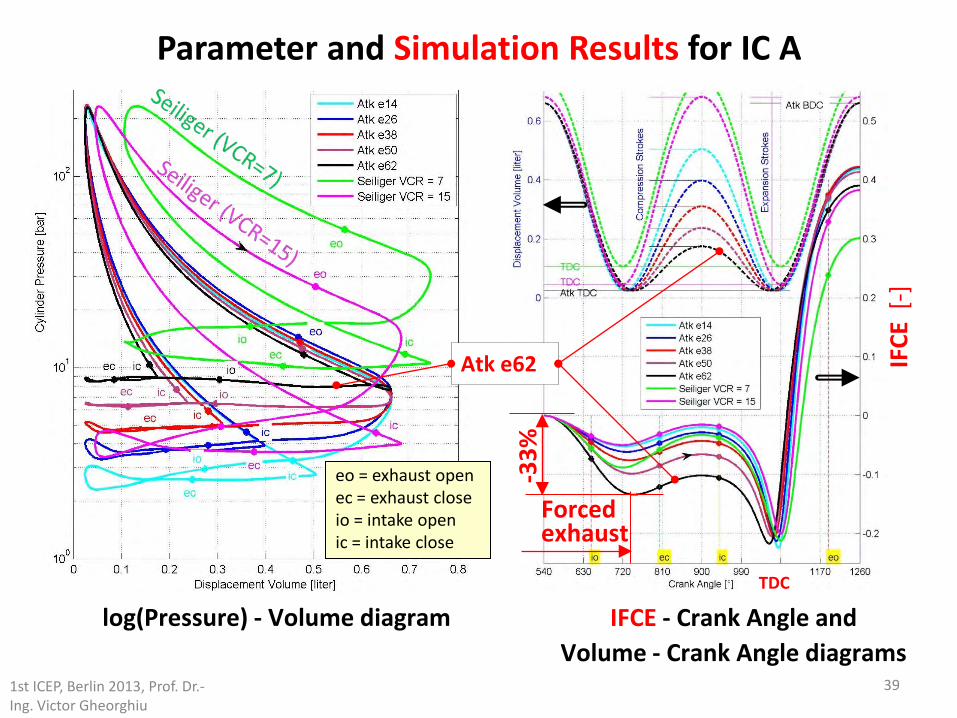
Parameter and Simulation Results for IC A
log(Pressure) - Volume diagram IFCE - Crank Angle and Volume - Crank Angle diagrams
Atk e62
TDC
IFCE
[-]
-33%
Forced exhaust
eo = exhaust open ec = exhaust close io = intake open ic = intake close
1st ICEP, Berlin 2013, Prof. Dr.-Ing. Victor Gheorghiu
40
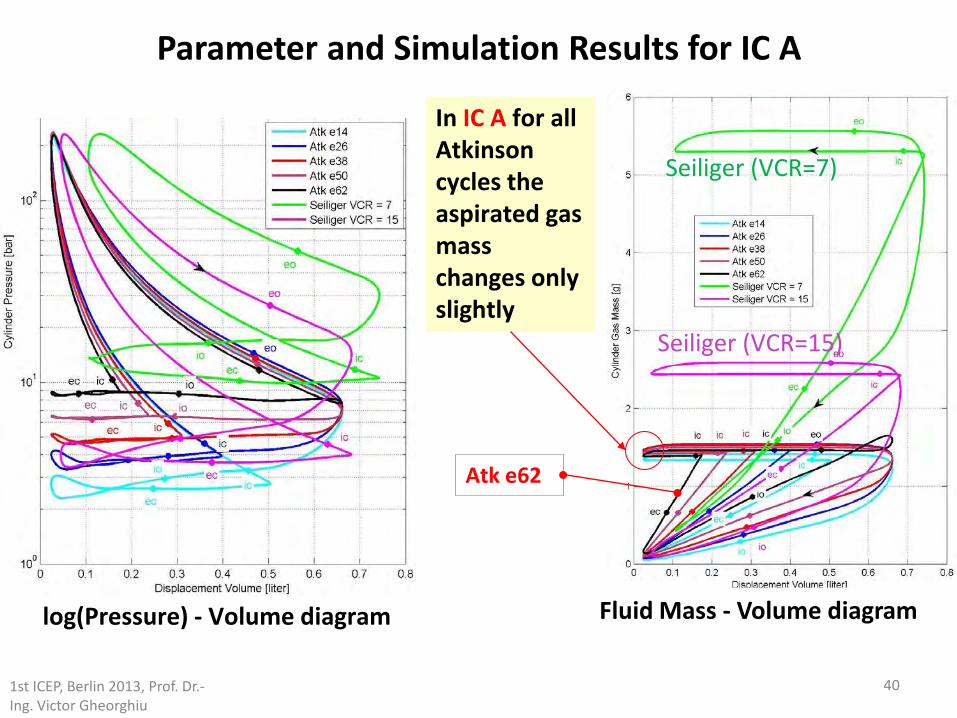
Parameter and Simulation Results for IC A
In IC A for all Atkinson cycles the aspirated gas mass changes only slightly
Seiliger (VCR=7)
Seiliger (VCR=15)
Atk e62
Fluid Mass - Volume diagram log(Pressure) - Volume diagram
1st ICEP, Berlin 2013, Prof. Dr.-Ing. Victor Gheorghiu
41 1st ICEP, Berlin 2013, Prof. Dr.-Ing. Victor Gheorghiu
Parameter and Simulation Results for IC A
Trends arise from analysis of table values: All Atkinson show better IFCE values than Seiliger cycles. Seiliger cycles reach higher IMEP values because of longer intake stroke and thus
of more aspirated gas mass. IMEP follows IFCE variation and is mostly independent of boost pressure variation
in all Atkinson cycles. Highest IFCE value of Atkinson cycles is not reached in variant with highest VCR,
but in variant where VCR is ≈50% of VER.
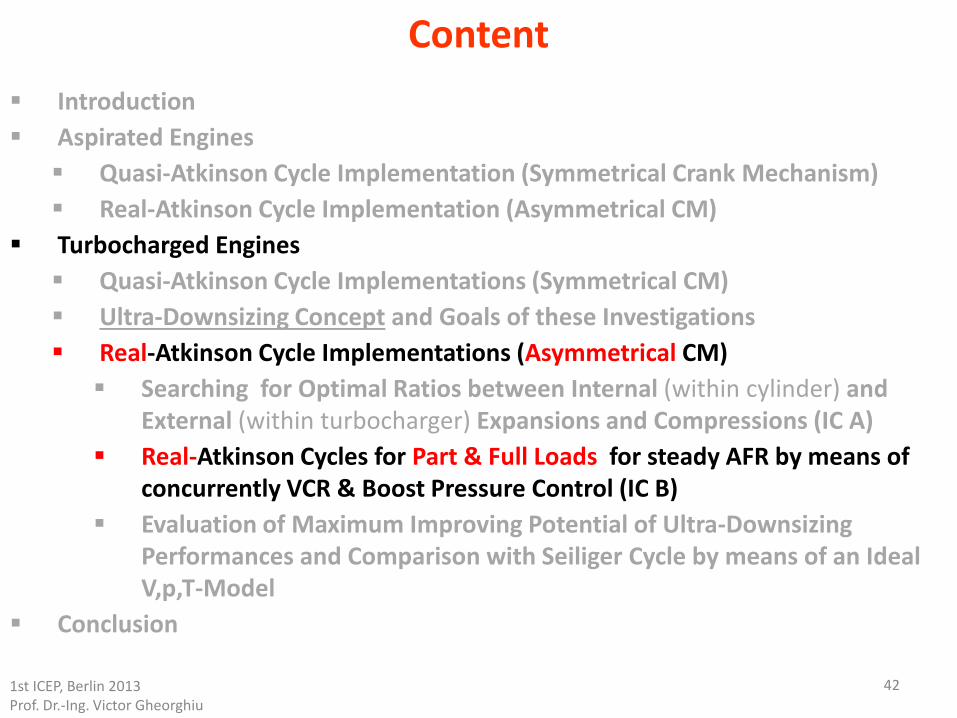
Content Introduction Aspirated Engines Quasi-Atkinson Cycle Implementation (Symmetrical Crank Mechanism) Real-Atkinson Cycle Implementation (Asymmetrical CM)
Turbocharged Engines Quasi-Atkinson Cycle Implementations (Symmetrical CM) Ultra-Downsizing Concept and Goals of these Investigations Real-Atkinson Cycle Implementations (Asymmetrical CM) Searching for Optimal Ratios between Internal (within cylinder) and
External (within turbocharger) Expansions and Compressions (IC A) Real-Atkinson Cycles for Part & Full Loads for steady AFR by means of
concurrently VCR & Boost Pressure Control (IC B) Evaluation of Maximum Improving Potential of Ultra-Downsizing
Performances and Comparison with Seiliger Cycle by means of an Ideal V,p,T-Model
Conclusion
42 1st ICEP, Berlin 2013 Prof. Dr.-Ing. Victor Gheorghiu
43
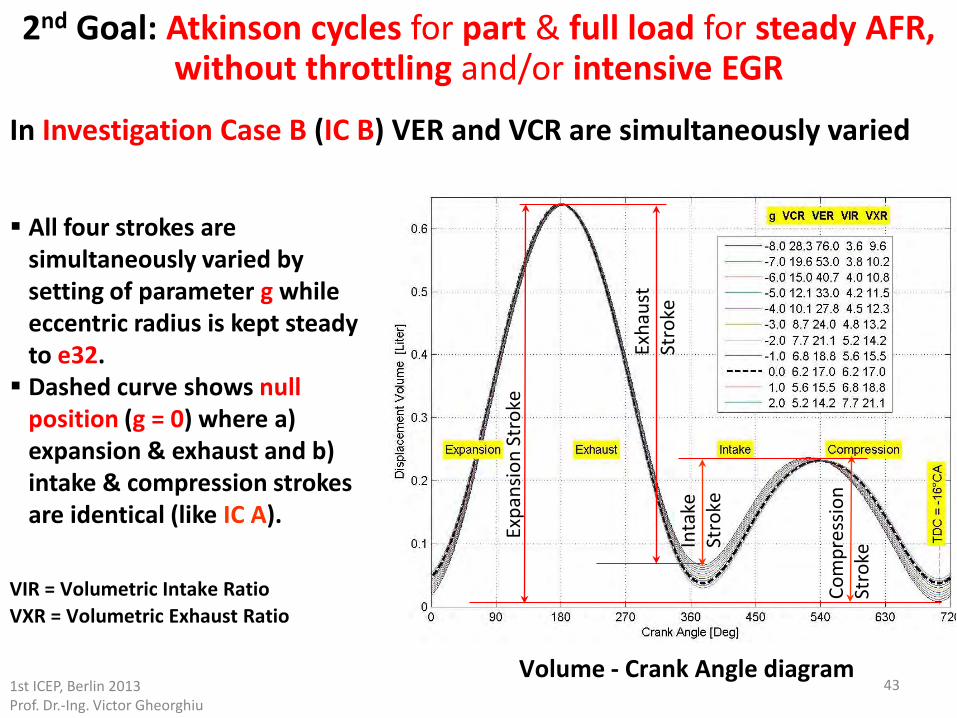
In Investigation Case B (IC B) VER and VCR are simultaneously varied
Expa
nsio
n St
roke
Com
pres
sion
Stro
ke
All four strokes are simultaneously varied by setting of parameter g while eccentric radius is kept steady to e32. Dashed curve shows null
position (g = 0) where a) expansion & exhaust and b) intake & compression strokes are identical (like IC A).
Inta
ke
Stro
ke
Exha
ust
Stro
ke
Volume - Crank Angle diagram
VIR = Volumetric Intake Ratio VXR = Volumetric Exhaust Ratio
2nd Goal: Atkinson cycles for part & full load for steady AFR, without throttling and/or intensive EGR
1st ICEP, Berlin 2013 Prof. Dr.-Ing. Victor Gheorghiu
44
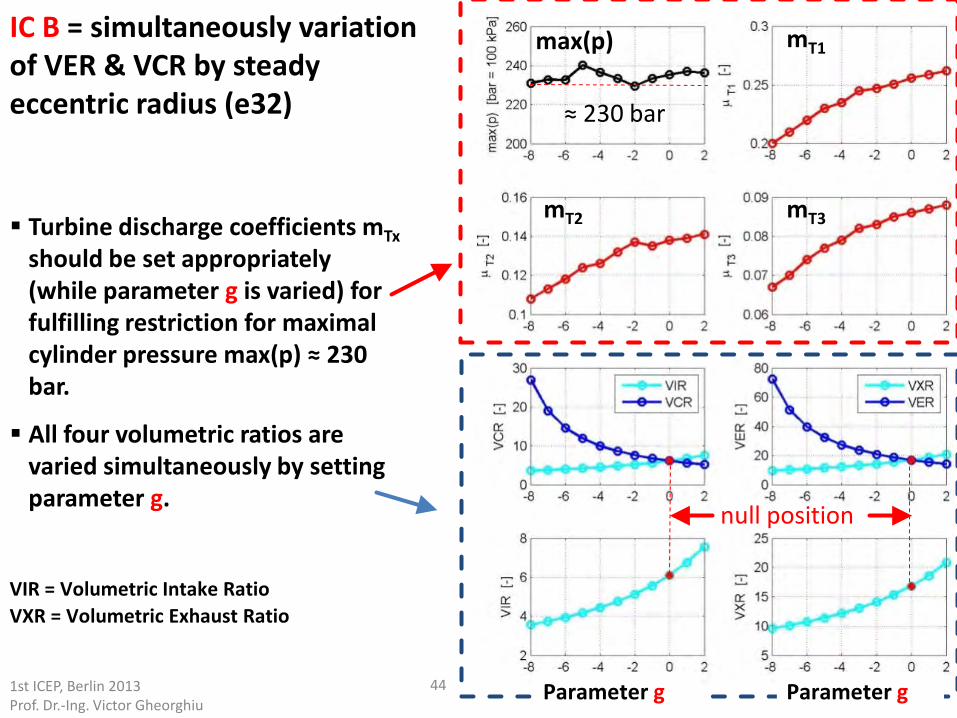
IC B = simultaneously variation of VER & VCR by steady eccentric radius (e32)
Turbine discharge coefficients mTx should be set appropriately (while parameter g is varied) for fulfilling restriction for maximal cylinder pressure max(p) ≈ 230 bar.
All four volumetric ratios are varied simultaneously by setting parameter g.
null position
≈ 230 bar
max(p) mT1
mT3 mT2
Parameter g Parameter g 1st ICEP, Berlin 2013 Prof. Dr.-Ing. Victor Gheorghiu
VIR = Volumetric Intake Ratio VXR = Volumetric Exhaust Ratio
45
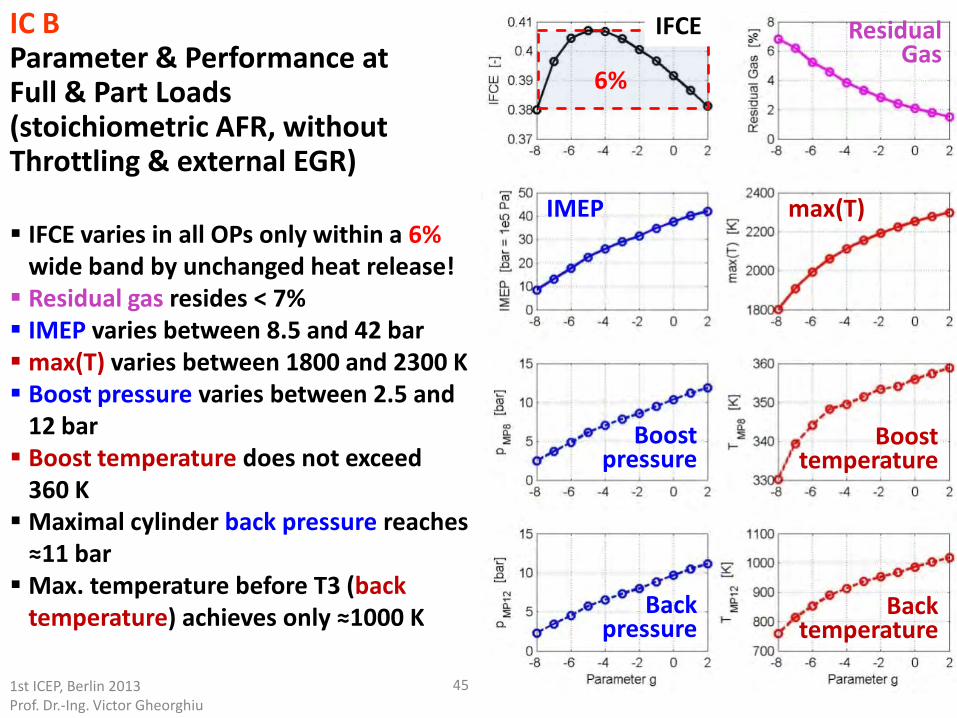
IFCE varies in all OPs only within a 6% wide band by unchanged heat release! Residual gas resides < 7% IMEP varies between 8.5 and 42 bar max(T) varies between 1800 and 2300 K Boost pressure varies between 2.5 and
12 bar Boost temperature does not exceed
360 K Maximal cylinder back pressure reaches
≈11 bar Max. temperature before T3 (back
temperature) achieves only ≈1000 K
IC B Parameter & Performance at Full & Part Loads (stoichiometric AFR, without Throttling & external EGR)
6%
IFCE Residual Gas
IMEP max(T)
1st ICEP, Berlin 2013 Prof. Dr.-Ing. Victor Gheorghiu
Boost pressure
Boost temperature
Back pressure
Back temperature
46
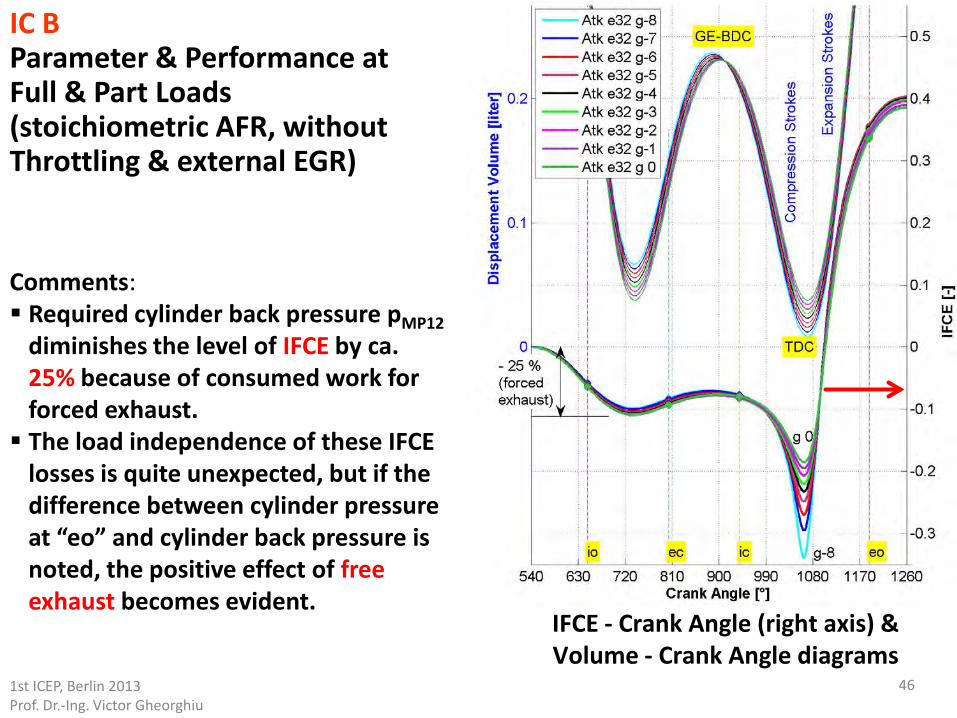
Comments: Required cylinder back pressure pMP12
diminishes the level of IFCE by ca. 25% because of consumed work for forced exhaust. The load independence of these IFCE
losses is quite unexpected, but if the difference between cylinder pressure at “eo” and cylinder back pressure is noted, the positive effect of free exhaust becomes evident.
IFCE - Crank Angle (right axis) & Volume - Crank Angle diagrams
1st ICEP, Berlin 2013 Prof. Dr.-Ing. Victor Gheorghiu
IC B Parameter & Performance at Full & Part Loads (stoichiometric AFR, without Throttling & external EGR)
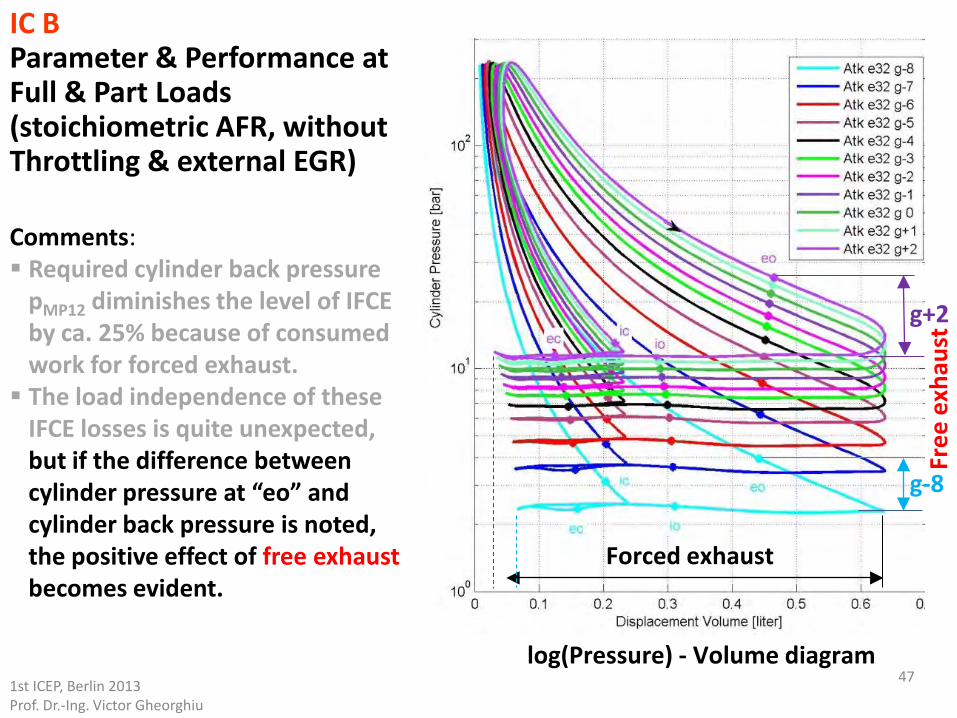
47
Forced exhaust
Free
exh
aust
1st ICEP, Berlin 2013 Prof. Dr.-Ing. Victor Gheorghiu
IC B Parameter & Performance at Full & Part Loads (stoichiometric AFR, without Throttling & external EGR)
Comments: Required cylinder back pressure
pMP12 diminishes the level of IFCE by ca. 25% because of consumed work for forced exhaust. The load independence of these
IFCE losses is quite unexpected, but if the difference between cylinder pressure at “eo” and cylinder back pressure is noted, the positive effect of free exhaust becomes evident.
log(Pressure) - Volume diagram
g+2
g-8
Content Introduction Aspirated Engines Quasi-Atkinson Cycle Implementation (Symmetrical Crank Mechanism) Real-Atkinson Cycle Implementation (Asymmetrical CM)
Turbocharged Engines Quasi-Atkinson Cycle Implementations (Symmetrical CM) Ultra-Downsizing Concept and Goals of these Investigations Real-Atkinson Cycle Implementations (Asymmetrical CM) Searching for Optimal Ratios between Internal (within cylinder) and
External (within turbocharger) Expansions and Compressions (IC A) Real-Atkinson Cycles for Part & Full Loads for steady AFR by means of
concurrently VCR & Boost Pressure Control (IC B) Evaluation of Maximum Improving Potential of Ultra-Downsizing
Performances and Comparison with Seiliger Cycle by means of an Ideal V,p,T-Model
Conclusion
48 1st ICEP, Berlin 2013 Prof. Dr.-Ing. Victor Gheorghiu
49
3rd Goal: Evaluation of Maximum Improving Potential of Ultra-Downsizing Performances and Comparison with
Seiliger Cycle by means of an Ideal V,p,T-Model
In the case of supercharged engines, the number of parameters which influence the IFCE and BMEP is very high.
As a consequence, the effort to achieve combinations of parameters which maximize the performances of the real (by BOOST) cycle becomes difficult and very time expensive.
For these reasons, the V,p,T analytical model of ideal open cycles have been developed for this purpose (see Appendix).
In ideal V,p,T-cycle the heat is partially released isochorically (2 – 3v), isobarically (3v – 3p) and isothermally (3p – 3). The amounts of heat released isochorically and isobarically depend on the targets
for maximum pressure and temperature on the cycle (i.e. isochorically up to max(p) isobarically up to max(T) and the rest of the heat is released isothermally).
1st ICEP, Berlin 2013 Prof. Dr.-Ing. Victor Gheorghiu
50
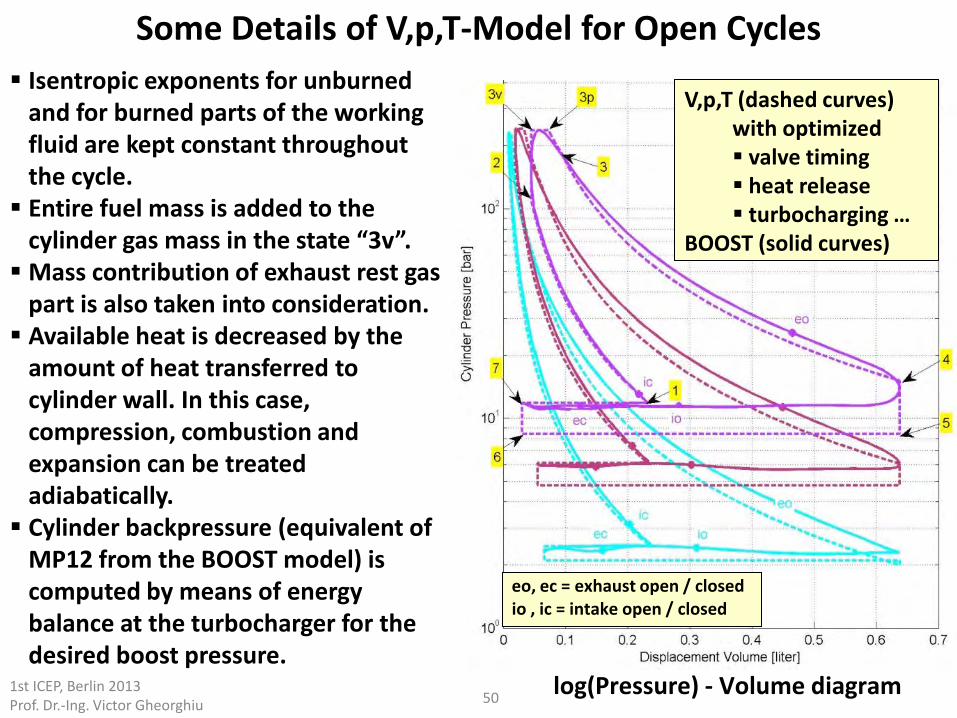
Some Details of V,p,T-Model for Open Cycles
V,p,T (dashed curves) with optimized valve timing heat release turbocharging …
BOOST (solid curves)
eo, ec = exhaust open / closed io , ic = intake open / closed
log(Pressure) - Volume diagram
Isentropic exponents for unburned and for burned parts of the working fluid are kept constant throughout the cycle. Entire fuel mass is added to the
cylinder gas mass in the state “3v”. Mass contribution of exhaust rest gas
part is also taken into consideration. Available heat is decreased by the
amount of heat transferred to cylinder wall. In this case, compression, combustion and expansion can be treated adiabatically. Cylinder backpressure (equivalent of
MP12 from the BOOST model) is computed by means of energy balance at the turbocharger for the desired boost pressure.
1st ICEP, Berlin 2013 Prof. Dr.-Ing. Victor Gheorghiu
51
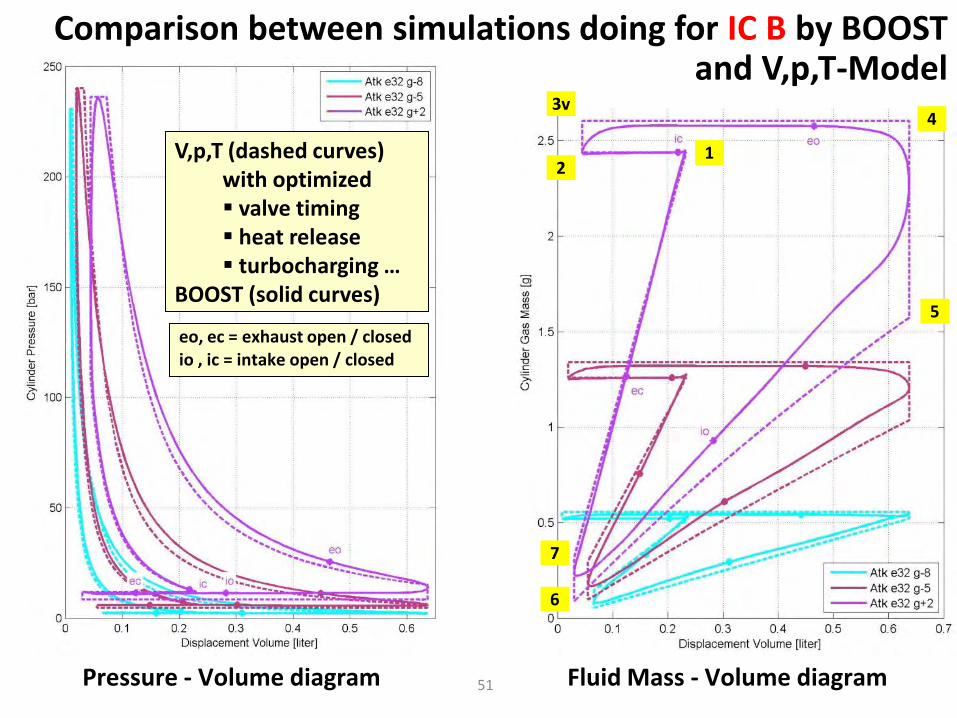
Comparison between simulations doing for IC B by BOOST and V,p,T-Model
1 2
3v 4
5
6
7
Pressure - Volume diagram Fluid Mass - Volume diagram
V,p,T (dashed curves) with optimized valve timing heat release turbocharging …
BOOST (solid curves)
eo, ec = exhaust open / closed io , ic = intake open / closed
52 Parameter g Parameter g Parameter g Parameter g
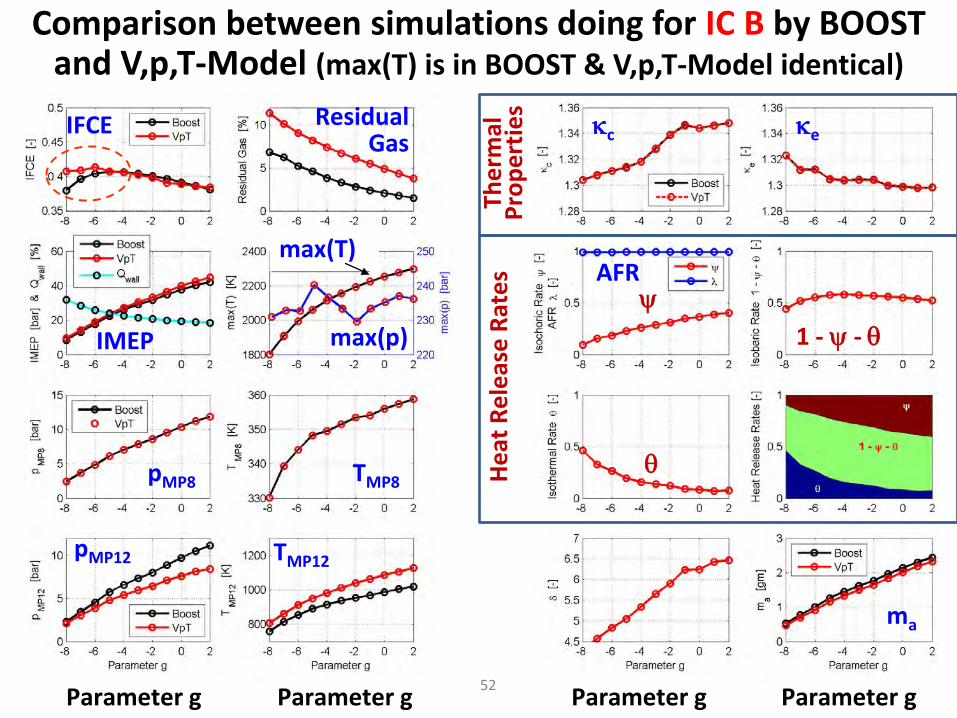
IFCE
IMEP
pMP8 TMP8
pMP12 TMP12
Residual Gas
κc κe
ψ
AFR
1 - ψ - θ
θ
ma
Heat
Rel
ease
Rat
es
max(p)
max(T)
Ther
mal
Pr
oper
ties
Comparison between simulations doing for IC B by BOOST and V,p,T-Model (max(T) is in BOOST & V,p,T-Model identical)
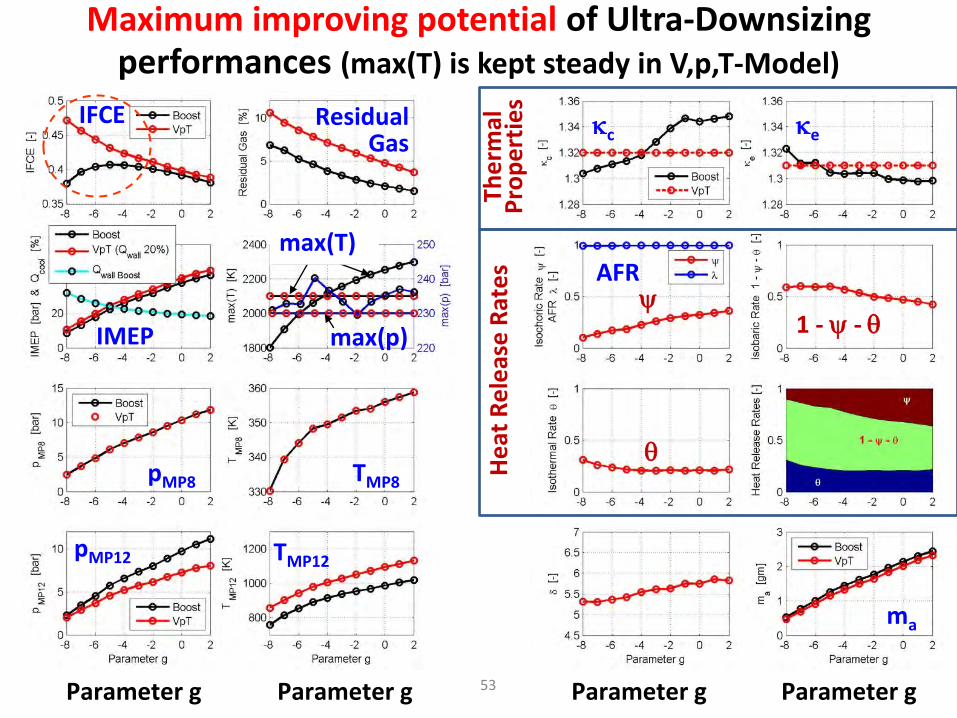
Maximum improving potential of Ultra-Downsizing performances (max(T) is kept steady in V,p,T-Model)
53 Parameter g Parameter g Parameter g Parameter g
IFCE
IMEP
pMP8 TMP8
pMP12 TMP12
Residual Gas
max(p)
max(T)
κc κe
ψ 1 - ψ - θ
θ
ma
Heat
Rel
ease
Rat
es
Ther
mal
Pr
oper
ties
AFR
54
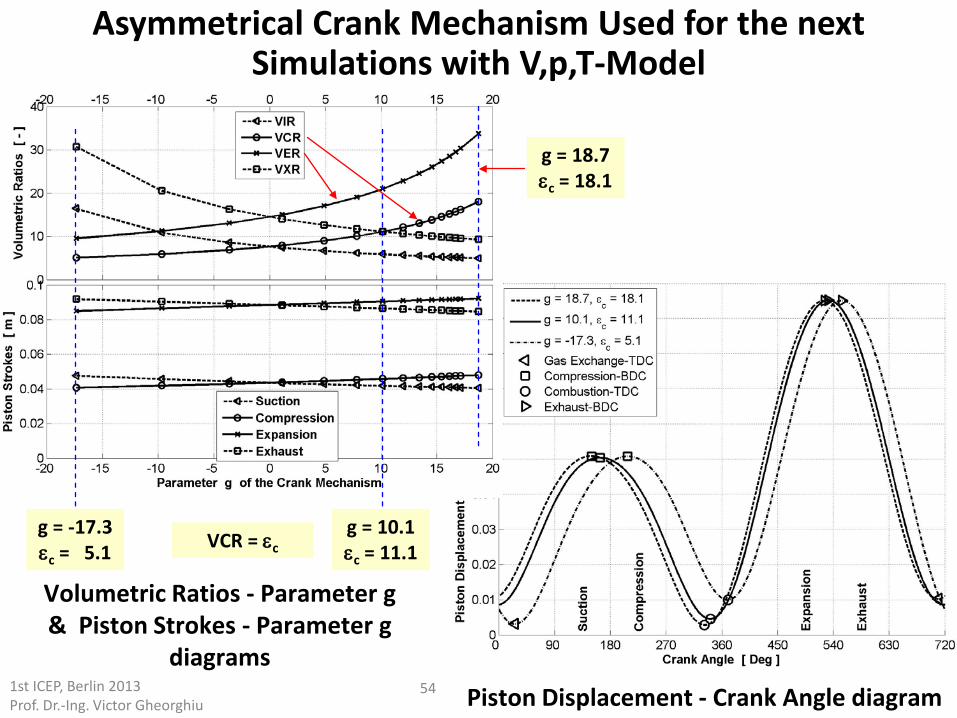
Asymmetrical Crank Mechanism Used for the next Simulations with V,p,T-Model
1st ICEP, Berlin 2013 Prof. Dr.-Ing. Victor Gheorghiu
g = -17.3 εc = 5.1
g = 10.1 εc = 11.1
g = 18.7 εc = 18.1
Volumetric Ratios - Parameter g & Piston Strokes - Parameter g
diagrams Piston Displacement - Crank Angle diagram
VCR = εc
55
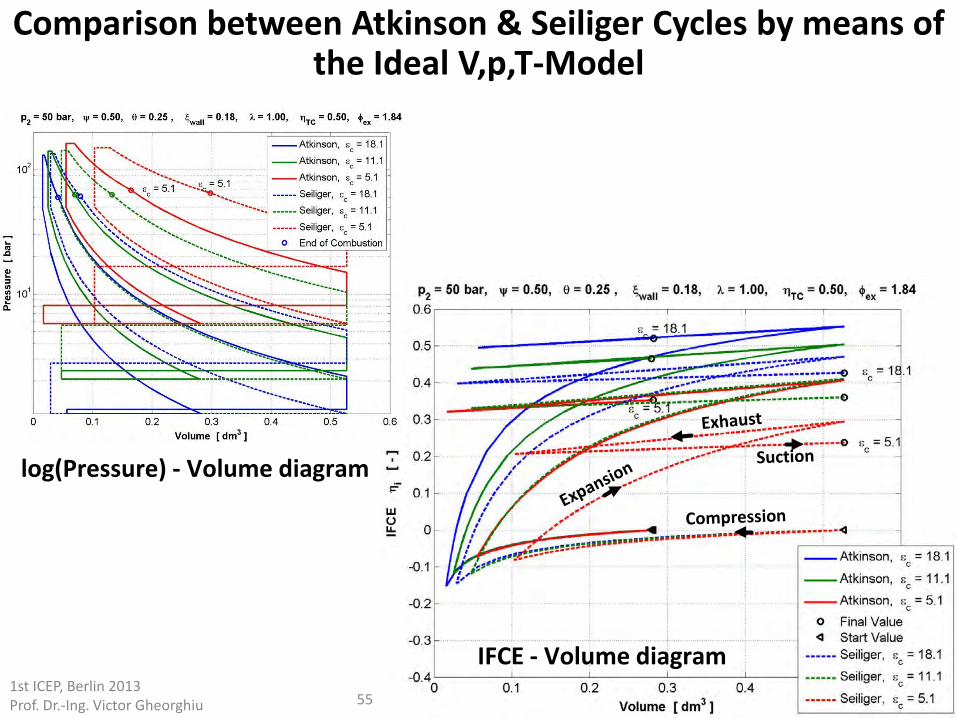
Comparison between Atkinson & Seiliger Cycles by means of the Ideal V,p,T-Model
1st ICEP, Berlin 2013 Prof. Dr.-Ing. Victor Gheorghiu
log(Pressure) - Volume diagram
IFCE - Volume diagram
56
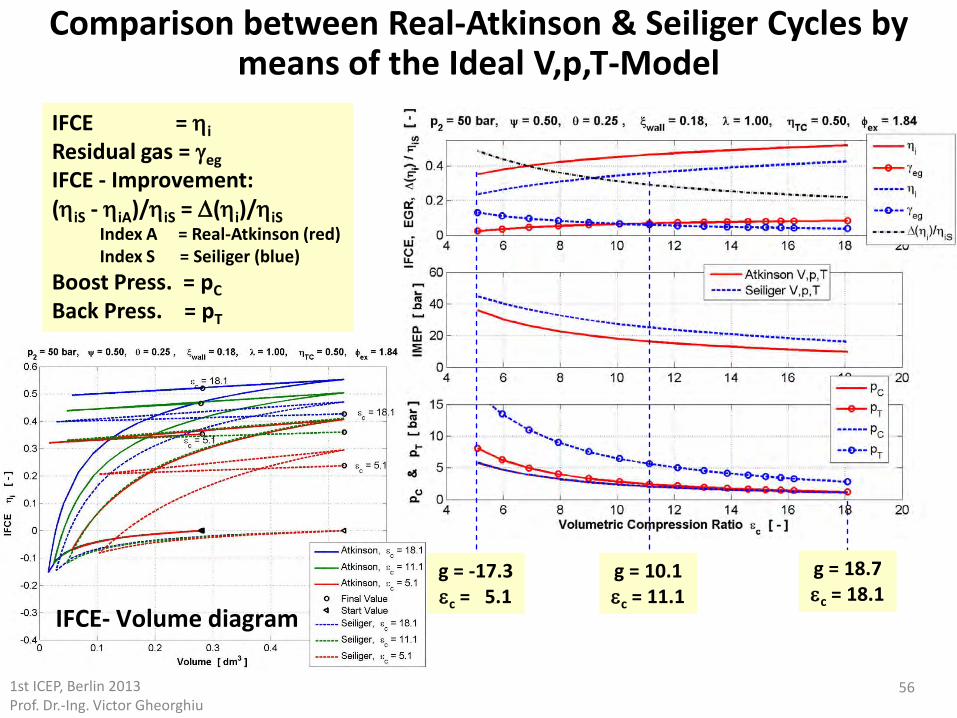
Comparison between Real-Atkinson & Seiliger Cycles by means of the Ideal V,p,T-Model
1st ICEP, Berlin 2013 Prof. Dr.-Ing. Victor Gheorghiu
g = -17.3 εc = 5.1
g = 10.1 εc = 11.1
g = 18.7 εc = 18.1
IFCE = ηi Residual gas = γeg IFCE - Improvement: (ηiS - ηiA)/ηiS = ∆(ηi)/ηiS
Index A = Real-Atkinson (red) Index S = Seiliger (blue)
Boost Press. = pC Back Press. = pT
IFCE- Volume diagram
57
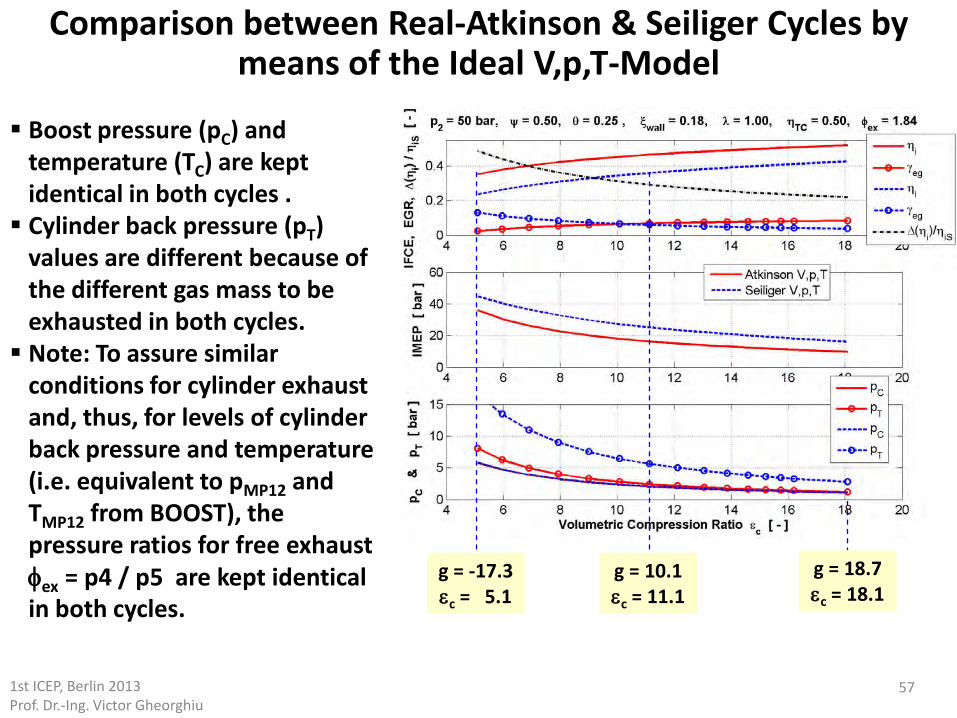
Comparison between Real-Atkinson & Seiliger Cycles by means of the Ideal V,p,T-Model
1st ICEP, Berlin 2013 Prof. Dr.-Ing. Victor Gheorghiu
g = -17.3 εc = 5.1
g = 10.1 εc = 11.1
g = 18.7 εc = 18.1
Boost pressure (pC) and temperature (TC) are kept identical in both cycles . Cylinder back pressure (pT)
values are different because of the different gas mass to be exhausted in both cycles. Note: To assure similar
conditions for cylinder exhaust and, thus, for levels of cylinder back pressure and temperature (i.e. equivalent to pMP12 and TMP12 from BOOST), the pressure ratios for free exhaust φex = p4 / p5 are kept identical in both cycles.
58
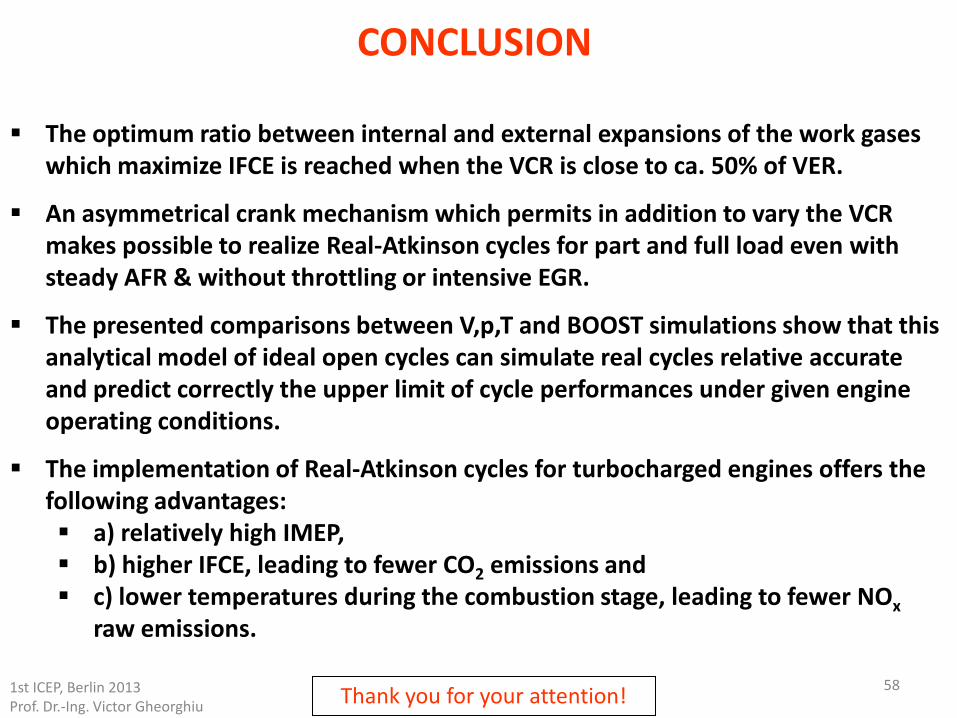
CONCLUSION
The optimum ratio between internal and external expansions of the work gases which maximize IFCE is reached when the VCR is close to ca. 50% of VER.
An asymmetrical crank mechanism which permits in addition to vary the VCR makes possible to realize Real-Atkinson cycles for part and full load even with steady AFR & without throttling or intensive EGR.
The presented comparisons between V,p,T and BOOST simulations show that this analytical model of ideal open cycles can simulate real cycles relative accurate and predict correctly the upper limit of cycle performances under given engine operating conditions.
The implementation of Real-Atkinson cycles for turbocharged engines offers the following advantages: a) relatively high IMEP, b) higher IFCE, leading to fewer CO2 emissions and c) lower temperatures during the combustion stage, leading to fewer NOx
raw emissions.
Thank you for your attention! 1st ICEP, Berlin 2013 Prof. Dr.-Ing. Victor Gheorghiu
59 1st ICEP, Berlin 2013, Prof. Dr.-Ing. Victor Gheorghiu
Contact Information
Victor GHEORGHIU Prof. PhD ME HAW Hamburg University of Applied Sciences Faculty TI, Engineering and Informatics Dpt. MP, Mechanical Engineering Berliner Tor 21 20099 Hamburg, Germany Tel.: + 49 40 42875-8636 Fax: + 49 40 42875-8799 [email protected] [email protected] www.haw-hamburg.de/pers/Gheorghiu www.victor-gheorghiu.de