Embed Size (px)
Citation preview
ULTRA-DOWNSIZING OF INTERNAL COMBUSTION ENGINES: SIMULTANEOUS
INCREASING OF THERMAL CONVERSSION EFFICIENCY AND POWER WHILE
REDUCING EMISSIONS
Victor GHEORGHIU*
Department of Mechanical Engineering,
Hamburg University of Applied Sciences, Germany,
E-mail: [email protected]
ABSTRACT
The Downsizing of internal combustion engines (ICE) is al-
ready recognized as a very suitable method for the concurrent
enhancement of the indicated fuel conversion efficiency
(IFCE) and lowering of the CO2 and NOx emissions [1], [2].
In this report the Ultra-Downsizing is introduced as a still
higher development stage of ICE. The Ultra-Downsizing will
be implemented here by means of real Atkinson cycles, using
asymmetrical crank mechanisms, combined with a very inten-
sive multistage high-pressure turbocharging with intensive
intercooling. This will allow an increase of ICE performance
while keeping the thermal and mechanical strain strength of
engine components within the current usual limits.
INTRODUCTION The scarcity of the available oil and gas reserves and the
global warming phenomenon urge together the automotive
industry toward a decrease in fuel consumption and thus a re-
duction of CO2 emissions. These factors will also determine the
future R&D trends for ICE.
Downsizing of ICE means the simultaneous decreasing of
the displaced volume (usually by reducing the number of cy-
linders) and increasing of the indicated mean pressure (IMEP)
by means of turbocharging [1], [2]. This allows the preservation
of power and torque performance while decreasing the engine
size. Thereby a) the mechanical and thermal losses are reduced,
b) the engine becomes lighter, leading to a drop in the overall
weight of the vehicle, and c) the engine operates more time
within its optimum fuel consumption zone. The advantages
offered by a) and b) hold true even for ICE used in hybrid pro-
pulsion systems, while the advantage c) is already a feature of
the full-hybrid vehicles.
The level of downsizing determines the strength of the
thermal and mechanical strains of the engine components. In
order to avoid exceeding the usual limits, either the boost pres-
sure or the volumetric compression ratio (VCR) must be re-
duced accordingly. As consequence, the whole potential of
downsizing are not achieved and the IFCE and IMEP remain at
low level.
The current ICEs have classical (symmetrical) crank me-
chanisms (i.e. with compression and expansion strokes of equal
length) and follow the Seiliger cycles. Real implemented
Atkinson cycles require unequal strokes featuring a shorter
compression stroke, which leads to a higher IFCE [3]. Atkinson
cycles have been used so far mostly with symmetrical crank
mechanisms, where the intake valves are closed very late in the
cycle [4]. Thus, a part of the charge sucked into cylinder is
push back to the intake pipes and the effective compression
stroke is decreased. This quasi implementation of Atkinson
cycles shows no noticeable improvements of the IFCE and,
hence, it will not be discussed in the course of this paper [3].
Real Atkinson cycles can be implemented only with the
help of asymmetrical crank mechanisms. This allows to use
concurrent very high boost pressures (to increase the IMEP)
and higher VCR (to enhance the IFCE) and to set them much
more independently of each other compared to Seiliger cycles
[3]. Because an important part of the fresh charge compression
takes place beyond the cylinder, the high compressed fresh
charge can be cooled intensively before it is sucked in cylinder.
The following moderate compression in the cylinder (i.e. with
relative lower VCR) lead to lower temperature peaks during the
combustion process and, consequently, to less NOx emissions.
This approach has already been proved in several previous
theoretically investigations based on ideal Seiliger and Atkin-
son cycles [3]. These investigations did not take into considera-
tion the effect of heat exchange and frictional losses on the
cycle in order to make it easier to check the solution and to
draw a comparison between the Seiliger and Atkinson cycles.
The performances achieved for IFCE and IMEP using this
method are therefore unrealistically high and serve only as a
general indication [3].
This Paper extends the previous investigations from [3] to
real Atkinson cycles by using the simulation tool BOOST
(AVL Co). This tool allows to take into consideration the true
geometrical dimensions of the engine components (cylinder,
valves, channels, pipes, manifolds, turbocharger, intercooler,
silencer etc.) and the losses caused by friction and heat transfer
along the intake and exhaust gas pipes. In addition, the power
balance of turbochargers determines the actual boost pressure
level of the engine.
The turbochargers (TC) are modeled for these investigation
in a simple manner. It describes the expansion process in the
turbines (Tx) by means of their discharge coefficients while the
air compaction in the compressors occurs up to a maximum
8th International Conference on Heat Transfer, Fluid Mechanics and Thermodynamics
230
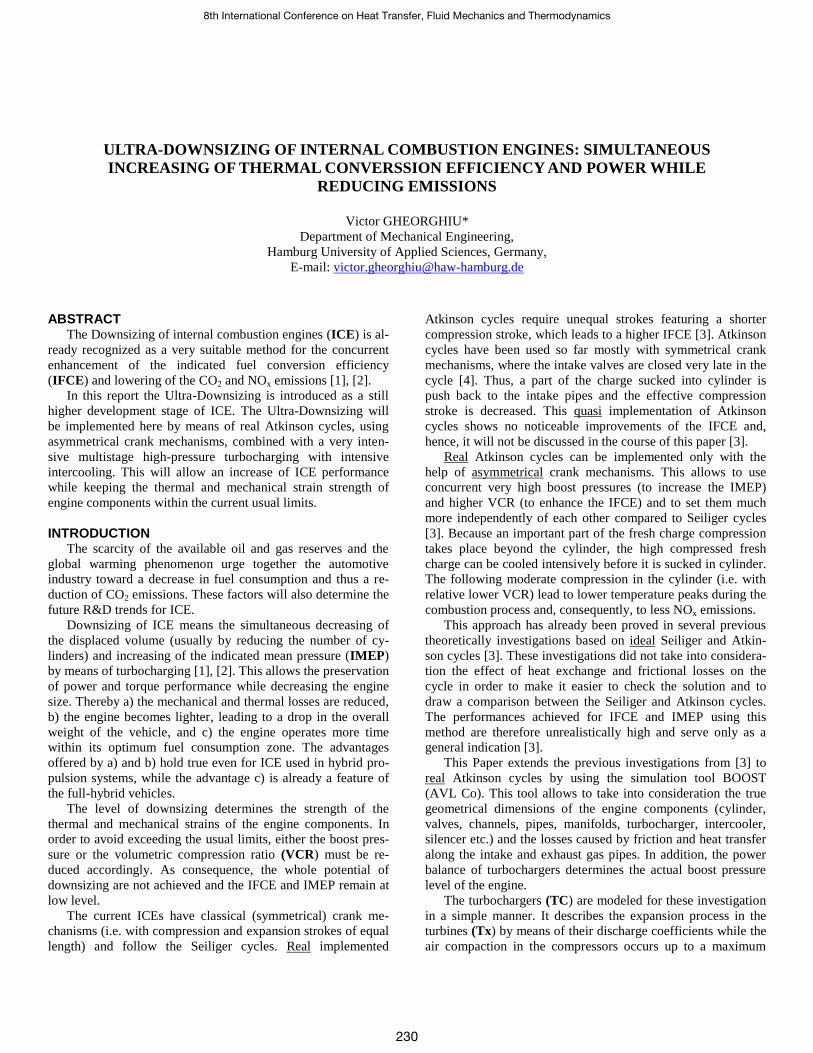
pressure ratio, which depends on the available turbine output.
To be able to simulate cycles with very high boost pressures as
well, three intercooled TC are placed in line (three-stage turbo-
charging, see Fig. 1). When the boost pressure required for
preserving the pressure limit on the cycle is low, the super-
fluous TC are kept in use (i.e. are not bypassed). The expansion
and compression ratios of the turbines and compressors tend
gradually toward 1, i.e. these TC switch off themselves ther-
modynamically.
Figure 1 BOOST Model of a four cylinder TC engine Simple number denote pipes, Cx = cylinder, COx = cooler, TCx = turbocharg-ers, PLx = plenum, Jx = junctions, CLx = cleaner, SBx = system boundaries,
Ex = engine and MPx = measuring points
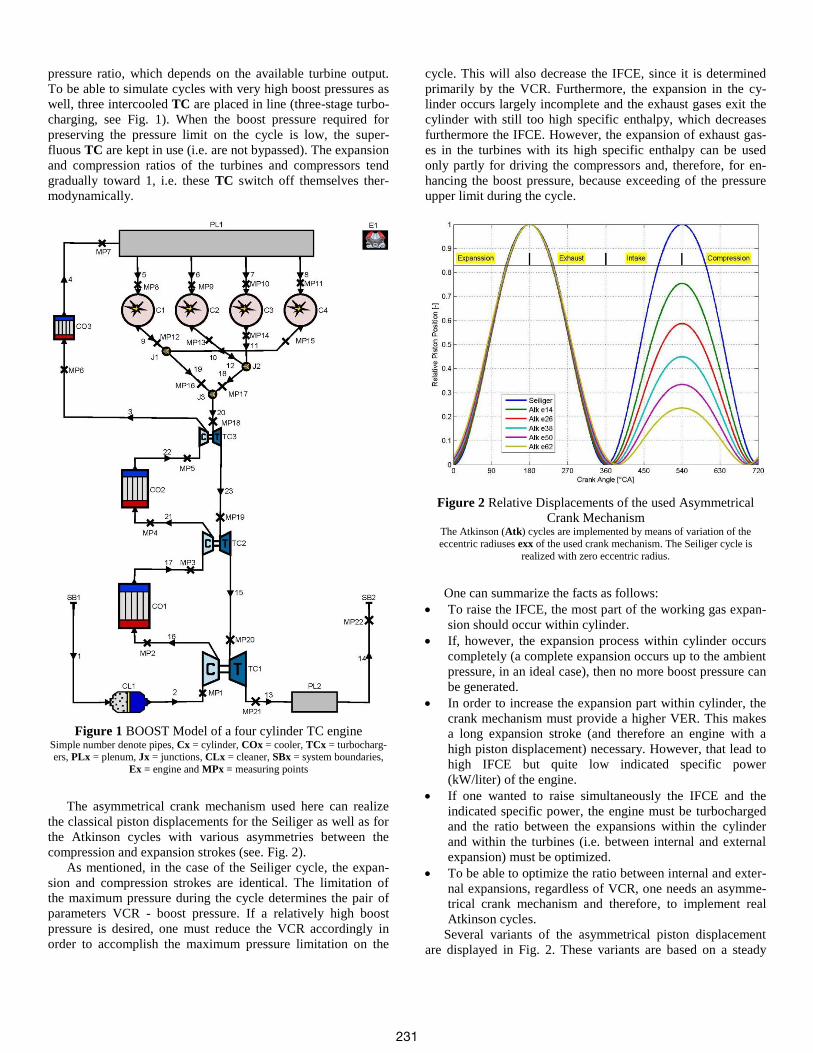
The asymmetrical crank mechanism used here can realize
the classical piston displacements for the Seiliger as well as for
the Atkinson cycles with various asymmetries between the
compression and expansion strokes (see. Fig. 2).
As mentioned, in the case of the Seiliger cycle, the expan-
sion and compression strokes are identical. The limitation of
the maximum pressure during the cycle determines the pair of
parameters VCR - boost pressure. If a relatively high boost
pressure is desired, one must reduce the VCR accordingly in
order to accomplish the maximum pressure limitation on the
cycle. This will also decrease the IFCE, since it is determined
primarily by the VCR. Furthermore, the expansion in the cy-
linder occurs largely incomplete and the exhaust gases exit the
cylinder with still too high specific enthalpy, which decreases
furthermore the IFCE. However, the expansion of exhaust gas-
es in the turbines with its high specific enthalpy can be used
only partly for driving the compressors and, therefore, for en-
hancing the boost pressure, because exceeding of the pressure
upper limit during the cycle.
Figure 2 Relative Displacements of the used Asymmetrical
Crank Mechanism The Atkinson (Atk) cycles are implemented by means of variation of the
eccentric radiuses exx of the used crank mechanism. The Seiliger cycle is
realized with zero eccentric radius.
One can summarize the facts as follows:
To raise the IFCE, the most part of the working gas expan-
sion should occur within cylinder.
If, however, the expansion process within cylinder occurs
completely (a complete expansion occurs up to the ambient
pressure, in an ideal case), then no more boost pressure can
be generated.
In order to increase the expansion part within cylinder, the
crank mechanism must provide a higher VER. This makes
a long expansion stroke (and therefore an engine with a
high piston displacement) necessary. However, that lead to
high IFCE but quite low indicated specific power
(kW/liter) of the engine.
If one wanted to raise simultaneously the IFCE and the
indicated specific power, the engine must be turbocharged
and the ratio between the expansions within the cylinder
and within the turbines (i.e. between internal and external
expansion) must be optimized.
To be able to optimize the ratio between internal and exter-
nal expansions, regardless of VCR, one needs an asymme-
trical crank mechanism and therefore, to implement real
Atkinson cycles.
Several variants of the asymmetrical piston displacement
are displayed in Fig. 2. These variants are based on a steady
231
VER and a varied VCR, which allows the modification of the
ratio between internal and external expansion. The goal of this
Paper is to look for the optimum ratio between internal and
external expansion, which leads simultaneously to maximizing
the IFCE and enabling sufficiently high values of IMEP.
SETTINGS OF THE SIMULATIONS The simulations of the piston displacements presented in
Fig. 2 are carried out using the BOOST model from Fig. 1. The
parameters and the performance of seven cycles are shown in
Table 1. Many of the parameters from all cycles were kept
identical in order to make comparison easier.
Most parameters of the BOOST model were selected for a
hypothetical engine and are kept unchanged for all simulations.
Among these are the following parameters:
All geometrical dimensions (with the exception of the
crank mechanism)
Valve timing
Wall temperatures, heat transfer coefficients, efficiencies
and pressure losses of the intercoolers, friction coefficients
in the pipes
Blow by gap size of cylinder, frictional characteristic curve
of the engine etc.
A simple Vibe function was selected in order to model the
combustion process. The different positions of the TDC in the
Atkinson and Seiliger cycles (see Fig. 2 and 5) are compensated
by choosing a suitable start of combustion (SOC), so that com-
bustion begins in all cycles uniformly at 5°CA before TDC.
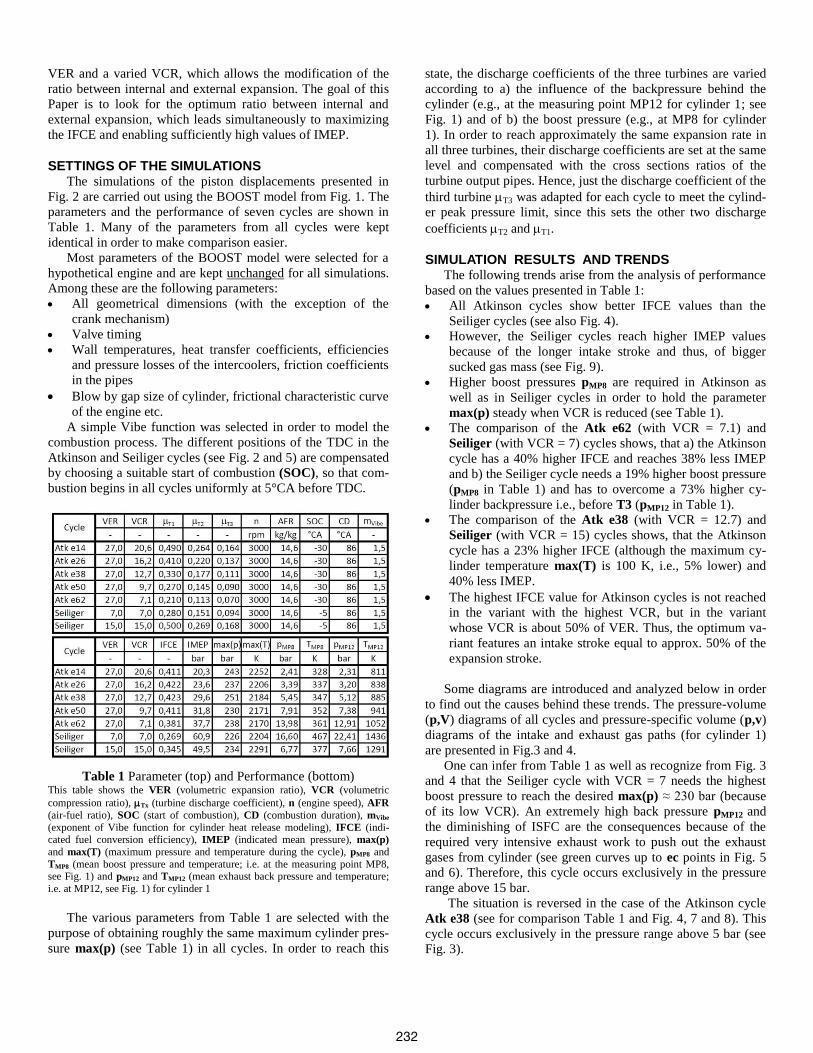
Table 1 Parameter (top) and Performance (bottom) This table shows the VER (volumetric expansion ratio), VCR (volumetric
compression ratio), Tx (turbine discharge coefficient), n (engine speed), AFR
(air-fuel ratio), SOC (start of combustion), CD (combustion duration), mVibe
(exponent of Vibe function for cylinder heat release modeling), IFCE (indi-cated fuel conversion efficiency), IMEP (indicated mean pressure), max(p)
and max(T) (maximum pressure and temperature during the cycle), pMP8 and
TMP8 (mean boost pressure and temperature; i.e. at the measuring point MP8, see Fig. 1) and pMP12 and TMP12 (mean exhaust back pressure and temperature;
i.e. at MP12, see Fig. 1) for cylinder 1
The various parameters from Table 1 are selected with the
purpose of obtaining roughly the same maximum cylinder pres-
sure max(p) (see Table 1) in all cycles. In order to reach this
state, the discharge coefficients of the three turbines are varied
according to a) the influence of the backpressure behind the
cylinder (e.g., at the measuring point MP12 for cylinder 1; see
Fig. 1) and of b) the boost pressure (e.g., at MP8 for cylinder
1). In order to reach approximately the same expansion rate in
all three turbines, their discharge coefficients are set at the same
level and compensated with the cross sections ratios of the
turbine output pipes. Hence, just the discharge coefficient of the
third turbine T3 was adapted for each cycle to meet the cylind-
er peak pressure limit, since this sets the other two discharge
coefficients T2 and T1.
SIMULATION RESULTS AND TRENDS The following trends arise from the analysis of performance
based on the values presented in Table 1:
All Atkinson cycles show better IFCE values than the
Seiliger cycles (see also Fig. 4).
However, the Seiliger cycles reach higher IMEP values
because of the longer intake stroke and thus, of bigger
sucked gas mass (see Fig. 9).
Higher boost pressures pMP8 are required in Atkinson as
well as in Seiliger cycles in order to hold the parameter
max(p) steady when VCR is reduced (see Table 1).
The comparison of the Atk e62 (with VCR = 7.1) and
Seiliger (with VCR = 7) cycles shows, that a) the Atkinson
cycle has a 40% higher IFCE and reaches 38% less IMEP
and b) the Seiliger cycle needs a 19% higher boost pressure
(pMP8 in Table 1) and has to overcome a 73% higher cy-
linder backpressure i.e., before T3 (pMP12 in Table 1).
The comparison of the Atk e38 (with VCR = 12.7) and
Seiliger (with VCR = 15) cycles shows, that the Atkinson
cycle has a 23% higher IFCE (although the maximum cy-
linder temperature max(T) is 100 K, i.e., 5% lower) and
40% less IMEP.
The highest IFCE value for Atkinson cycles is not reached
in the variant with the highest VCR, but in the variant
whose VCR is about 50% of VER. Thus, the optimum va-
riant features an intake stroke equal to approx. 50% of the
expansion stroke.
Some diagrams are introduced and analyzed below in order
to find out the causes behind these trends. The pressure-volume
(p,V) diagrams of all cycles and pressure-specific volume (p,v)
diagrams of the intake and exhaust gas paths (for cylinder 1)
are presented in Fig.3 and 4.
One can infer from Table 1 as well as recognize from Fig. 3
and 4 that the Seiliger cycle with VCR = 7 needs the highest
boost pressure to reach the desired max(p) ≈ 230 bar (because
of its low VCR). An extremely high back pressure pMP12 and
the diminishing of ISFC are the consequences because of the
required very intensive exhaust work to push out the exhaust
gases from cylinder (see green curves up to ec points in Fig. 5
and 6). Therefore, this cycle occurs exclusively in the pressure
range above 15 bar.
The situation is reversed in the case of the Atkinson cycle
Atk e38 (see for comparison Table 1 and Fig. 4, 7 and 8). This
cycle occurs exclusively in the pressure range above 5 bar (see
Fig. 3).
232
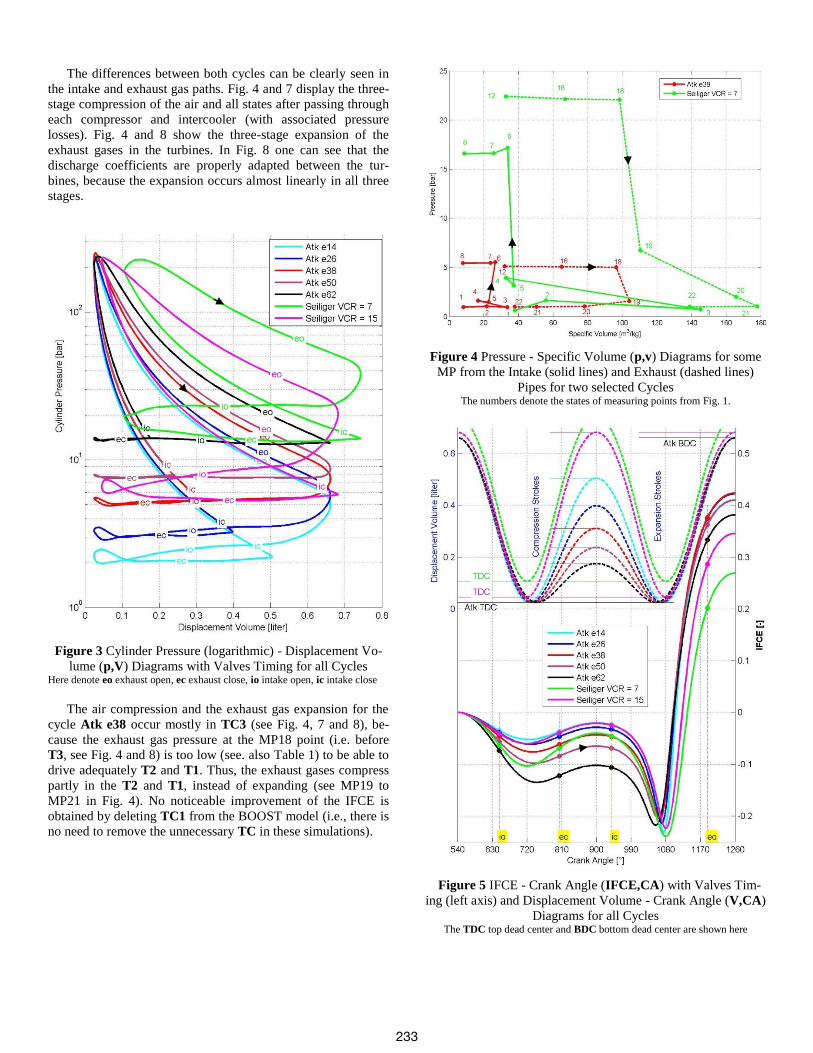
The differences between both cycles can be clearly seen in
the intake and exhaust gas paths. Fig. 4 and 7 display the three-
stage compression of the air and all states after passing through
each compressor and intercooler (with associated pressure
losses). Fig. 4 and 8 show the three-stage expansion of the
exhaust gases in the turbines. In Fig. 8 one can see that the
discharge coefficients are properly adapted between the tur-
bines, because the expansion occurs almost linearly in all three
stages.
Figure 3 Cylinder Pressure (logarithmic) - Displacement Vo-
lume (p,V) Diagrams with Valves Timing for all Cycles Here denote eo exhaust open, ec exhaust close, io intake open, ic intake close
The air compression and the exhaust gas expansion for the
cycle Atk e38 occur mostly in TC3 (see Fig. 4, 7 and 8), be-
cause the exhaust gas pressure at the MP18 point (i.e. before
T3, see Fig. 4 and 8) is too low (see. also Table 1) to be able to
drive adequately T2 and T1. Thus, the exhaust gases compress
partly in the T2 and T1, instead of expanding (see MP19 to
MP21 in Fig. 4). No noticeable improvement of the IFCE is
obtained by deleting TC1 from the BOOST model (i.e., there is
no need to remove the unnecessary TC in these simulations).
Figure 4 Pressure - Specific Volume (p,v) Diagrams for some
MP from the Intake (solid lines) and Exhaust (dashed lines)
Pipes for two selected Cycles The numbers denote the states of measuring points from Fig. 1.
Figure 5 IFCE - Crank Angle (IFCE,CA) with Valves Tim-
ing (left axis) and Displacement Volume - Crank Angle (V,CA)
Diagrams for all Cycles The TDC top dead center and BDC bottom dead center are shown here
233
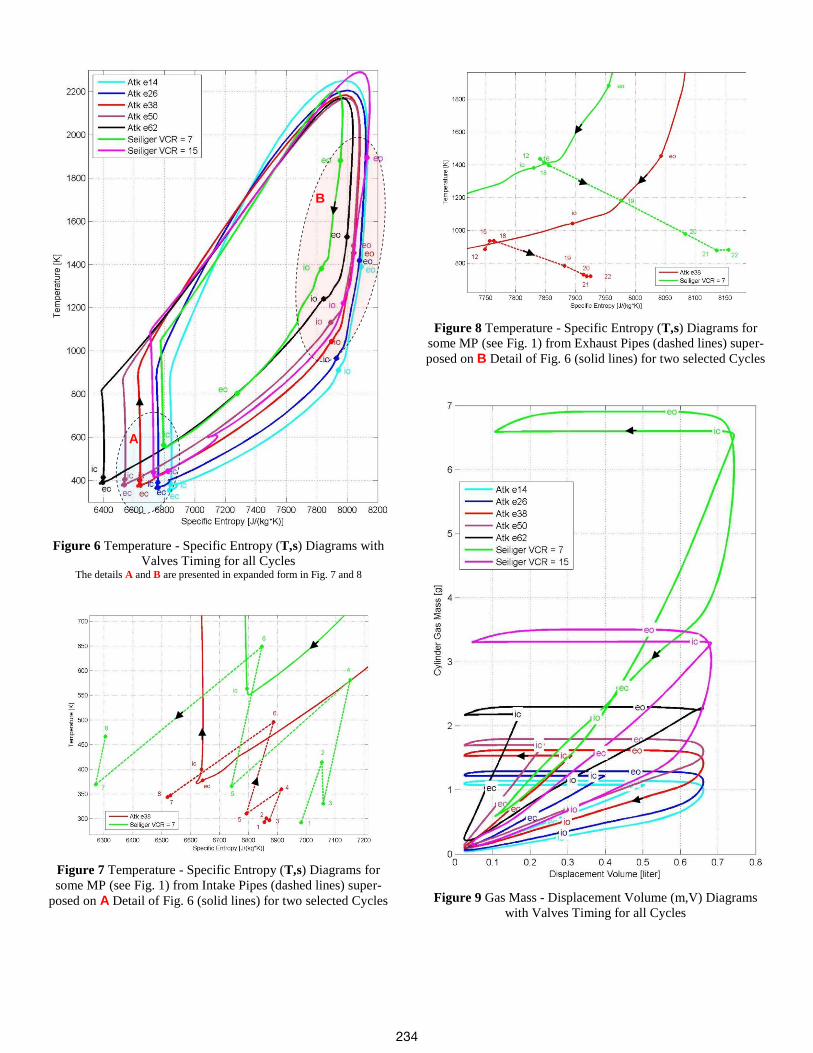
Figure 6 Temperature - Specific Entropy (T,s) Diagrams with
Valves Timing for all Cycles The details A and B are presented in expanded form in Fig. 7 and 8
Figure 7 Temperature - Specific Entropy (T,s) Diagrams for
some MP (see Fig. 1) from Intake Pipes (dashed lines) super-
posed on A Detail of Fig. 6 (solid lines) for two selected Cycles
Figure 8 Temperature - Specific Entropy (T,s) Diagrams for
some MP (see Fig. 1) from Exhaust Pipes (dashed lines) super-
posed on B Detail of Fig. 6 (solid lines) for two selected Cycles
Figure 9 Gas Mass - Displacement Volume (m,V) Diagrams
with Valves Timing for all Cycles
B
A
234
CONCLUSION The implementation of real Atkinson cycles for turbo-
charged engines using asymmetrical crank mechanisms offers
the following advantages: a) relatively high IMEP, b) higher
IFCE leading to few CO2 emissions and c) lower temperatures
during the combustion stage leading to few NOx emissions.
In order to achieve this, the engine requires the use of tur-
bocharger systems with at least two stages, which must be
adapted accordingly and controlled with the help of bypasses to
maximize their performance.
The optimum ratio between the internal (i.e. within cylind-
er) and external (i.e. within turbines) expansion of the exhaust
gases which maximize IFCE is reached when the VCR is close
to 50% of VER.
REFERENCES [1] R. Weinowski, A. Sehr, S. Wedowski, S. Heuer, T. Hamm,
C. Tiemann, Future downsizing of S.I. engines - potentials
and limits of 2- and 3-cylinder concepts, Vienna Motor
Symposium 2009
[2] V. Korte, G. Lumsden, N. Fraser, J. Hall, 30% higher effi-
ciency at 50% less displacement, MTZ 2010
[3] V. Gheorghiu, CO2 emission reduction by means of en-
hancement of the thermal conversion efficiency of ICE
cycles, HEFAT 2010
[4] Schutting, E, Neureiter, A, Fuchs, Ch., Schwarzenberger, T,
Klell, M, Eichlseder, H, Kammerdiener, T, Miller- and
Atkinson-Cycle for Supercharged Diesel Engines, MTZ 06 /
2007 (German)
235