Embed Size (px)
Citation preview
- ----------.,-".-------.,-".- --=0,,1
Plasi:ic Design of Multi-Story Frames
November, 1966
byLe-Wu Lu'Hassan Kamalvand
ULTIMATE STRENGTH OFLATERALLY LOADED COLUMNS
FRITZ ENGINEERINGLASORATORV LIB Y
Fri~z Engineering Laboratory Report: No. 273.52

----------------~ ._ - .._...•~ _~ _ _~ ~-- - - - -
Plastic Design of Multi-Story Frames
ULTIMATE STRENGTH OF LATERALLY LOADED COLUMNS
by
Le-Wu Luand
Hassan Kamalvand
This work has been carried out as part of an investigationsponsored jointly by the Welding Research Council and the Department of the Navy with funds furnished by the following:
American Iron and Steel Institute
American Institute of Steel Construction
Naval Ships Systems Command
Naval Facilities Engineering Command
Reproduction of this report in whole or in part is permittedfor any purpose of the United States Government.
Fritz Engineering LaboratoryDepartment of Civil Engineering
Lehigh UniversityBethlehem, Pennsylvania
November, 1966
Fritz Engineering Laboratory Report No. 273.52
SYNOPSIS
Analytical procedures are developed for computing the
maximum carrying, capacity of steel columns subject to combined
axial thrust and lateral load. It is assumed that the columns
are permitted to deflect only in the plane of the applied load
and that failure is always caused by excessive bending in the
same plane. Numerical results are obtained for four types of
columns with different loading and support conditions and are
presented in the form of interaction curves relating axial thrust,
lateral load and slenderness ratio. The analytically obtained
results are compared with the predictions based on an empirical
interaction formula and good agreement is observed.
-i-
TABLE OF CONTENTS
Page
SYNOPSIS i
1. INTRODUCTION 1
1.1 Previous Work 2
l.2 Scope of Investigation and Assumptions 2
2. GENERAL PROCEDURE OF NUMERICAL INTEGRATION 5
2.1 Integration Procedure 5
2.2 Moment-Curvature-Thrust Relationships 8
3. METHOD OF SOLUTION AND RESULTS FOR CASE ( a) 10
4. METHOD OF SOLUTION AND RESULTS FOR CASE (b) 15
5. METHOD OF SOLUTION AND RESULTS FOR CASE (c) 17
6. METHOD OF SOLUTION AND RESULTS FOR CASE Cd) 19
7 . COMPARISON OF RESULTS WITH INTERACTION FORMULAS 22
8 . SUMMARY AND CONCLUSIONS 25
9. ACKNOWLEDGMENTS 27
10. NOTATION 28
11. FIGURES 30
12. REFERENCES 40
-ii-
1. INTRODUCTION
Compression members subjected to lateral (or transverse)
loads occur frequently in building frames, bridge trusses and
other important engineering structures. They are. usually pro
portioned to satisfy some limiting stress criteria set by specifi
cations or codes. The stresses developed at any cross section in
such a member consist of (1) the axial stress caused by the com
pressive force, (2) the primary bending stress due to the lateral
load, and "(3) the secondary bending stress produced by the so-called
secondary moment, whlch is the product of the resulting deflection
of the section and the compressive force. The last stress intro
duces instability effect into the members and becomes particularly
important for columns with high slenderness ratios and carrying
large compressive forces. The procedures for computing the secondary
moments and stresses in elastic columns are described in books on
stability theory.l,2,3
Although elastic analysis has been used extensively in
design computations, it does not give accurate indications of the
true load-carrying capacity. Laterally loaded columns generally
fail by excessive bending after the stresses in some portions of
the member exceed the elastic limit. To determine the ultimate
strength of such a column, it is necessary to perform a stability
analysis that considers the elastic-plastic behavior of the various
sections. Unfortunately, the required analysis is often too complex
TABLE OF CONTENTS
Page
SYNOPSIS i
1. INTRODUCTION 1
1.1 Previous Work 2
1.2 Scope of Investigation and Assumptions 2
2. GENERAL PROCEDURE OF NUMERICAL INTEGRATION 5
2.1 Integration Procedure 5
2.2 Moment-Curvature-Thrust Relationships 8
3. METHOD OF SOLUTION AND RESULTS FOR CASE (a) 10
4. METHOD OF SOLUTION AND RESULTS FOR CASE (b) 15
5. METHOD OF SOLUTION AND RESULTS FOR CASE (c) 17
6 • METHOD OF SOLUTION AND RESULTS FOR CASE (d) 19
7. COMPARISON OF RESULTS WITH INTERACTION FORMULAS 22
8. SUMMARY AND CONCLUSIONS 25
9. ACKNOWLEDGMENTS 27
10. NOTATION 28
11. FIGURES 30
12. REFERENCES 40
-ii-
for practical applications, and recourse is sometimes made to
empirical formulas,3,4 (formulas providing approximate estimates
of the column strength).
The purpose of this paper is to develop efficient methods,
particularly adaptable to computer prograrruning,", for performing
elastic-plastic stability analysis for a variety of columns and to
present numerical results in a form suitable for design use.
1.1 PREVIOUS WORK
In contrast to the extensive work done on columns sub
jected to combined axial force and end moments,2,5,6,7,8 only a few
attempts have been made to study the strength of laterally loaded
columns. Wright developed an approximate formula for the case of
a column loaded by a concentrated load at the midspan [Case (a) in
this paper].9 The same case was also studied by Ketter who developed
" " f "f 1 6 A·" 1 hdlnteractlon curves or a varlety 0 co umns. n emplrlca met 0
for estimating the ultimate strength of laterally loaded columns
was proposed by Horne and Merchant using the modified Rankine For
mula. 3 The validity of the method has not been verified by com-
paring the estimated strength with "the strength determined either
from exact solutions or from laboratory experiments.
1.2 SCOPE OF INVESTIGATION AND ASSUMPTIONS
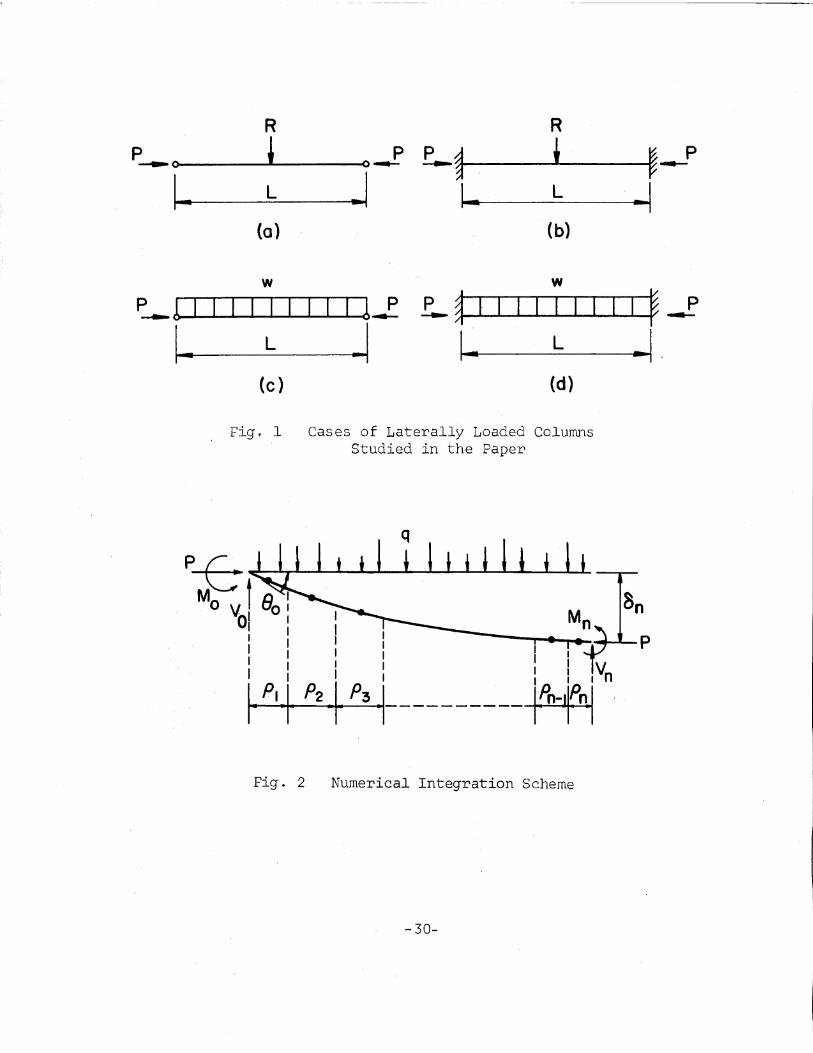
The loading and support conditions of the four cases of
-2-
laterally loaded columns investigated in the paper are shown in
Fig. 1. The columns are assumed to be prismatic and made of tf as-
rolled" wide-flange. shapes. In all the cases, the lateral load,
R or w, causes bending moment about the major axis of the cross
section.
For each case, a method of solution is first developed
and numerical results are then given for columns with slenderness
ratios ranging from 20 to 100. The results are presented as inter-
action curves. All computations were performed on A36 (yield stress =
36 ksi) steel columns, but the results can also be used for other
columns with different yield stress levels by the proper adjusting
of the slenderness ratio (see Summary and Conclusions). The COffi-
puted ultimate strength is compared with the ultimate strength. pre-
d~cted by the empirical interaction formula contained in the AISC
Specification.
The following assumptions are made in the solutions:
1. The stress-strain properties of the column material
are elastic and perfectly plastic and the effect of strain hardening
is neglected.
2. For a given combination 'of axial force and bending
final valuesof the axial force and bending moment and that the actual
history of loading does not affect the resulting curvature.
-3-
3. The effect of shear is small and can be neglected.
4.· Weak-axis buckling and lateral-torsional buckling
are. effectively prevented so that failure is always caused by
excessive bending in the plane of the applied lateral load.
In performing numerical calculations, it is further
assumed that the axial force P is applied first and maintained at
a constant value as the lateral load increases or decreases.
-4-
2 . GENERAL PROCEDURE OF NUMERICAL INTEGRATION
The methods of solution to be developed subsequently
for the individual cases utilize a common numerical integration
procedure. It was first used by von K~rman in his studies on
eccentrically loaded columnslO and was later modified by Chwalla,
Ojalvo, and others for use in the analysis of restrained columns. ll ,l2
It is further modified in this paper to take into account the effect
of lateral load and variation in end conditions.
2.1 I~TEGRATION PROCEDURE
Figure 2 shows a portion of a laterally loaded column
whose deformed. eonfiguration in the elastic and elastic-plastic
range is to be. determined. The applied forces consist of the axial'
force, P, lateral load, q, end moment, MO' and support reaction,
VO· They are considered as the known quantities in this discussion.
It is required to determine the deflection curve of the member when
the initial slope, eO' at the left end is assigned a specific value.
This can·be accomplished by applying a segment-by-segment integration
process, starting from the left ~nd. For the first segment, whose
length is chosen to be Pl , the deflection at its mid-point (shown
as a dot in Fig. 2) is approximately equal to
PI8al == eO 2
-5-
(1)

and the corresponding bending moment is
M = P6 V PI - M - I Moment Due to q oj (2)al al + 0 ~ 0 _Applied Over Pl/2
This moment is assumed to be the average moment of the entire
segment. The average curvature, ¢al,can be determined from the
moment-curvature-thrust (M-¢-P) relationship which includes both
13 14the elastic and inelastic range of cross sectional response. '
(The properties of the M-¢-P relationships used in this paper will
be briefly described later.) When 0al is known, the slope and
deflection at the end of the first segment can be computed from
the expressions
8I = 80 - 0alP I
and the corresponding bending moment is given by
M1
= po + V - M _ [Moment Due to q]I OP I 0 Applied Over PI
(3 ),
(4 )
(5)
·The values of 81
and 61 determined from Eqs. 3 and 4 will
be used as the initial values to start the integration for the
second segment. Again, the deflection and bending moment at the
mid-point of the segment are first computed
-6-
(6)
and
__ P 2 [Moment Due to q ]M Po a2 + VoCP 1 + -2) - MO -a2 Applied Over p 1 + P 2/ 2 (7)
The average curvature, ¢a2' of the segment is then found from the
M-¢-P relationship. The slope, deflection, and bending moment at
the end of the segment can then be determined from the equations
(8)
( 9')
and
M2
= po + V ( + p ) - M - [Moment Due to q ] ( 10 )2 a p 1 2 a Applied Over p 1 + P2
Repeated calculations can be carried out for as many
segments as necessary. The calculations may be terminated when
certain specified conditions are satisfied. For instance, in
analyzing columns with a given length, L, the integration may be
terminated when the total accumulated length is equal to L/2. It
-7-
is also possible to terminate the calculations when the slope of
the deflection curve becomes zero or "negative. If the integration
process is terminated after completing n segments (Fig. 2), the
last set of the numerical results gives the values of the slope,
"deflection, and bending moment of the point which is located at"
a distance PI + P + ---- p from the left end.2 n
-The procedure described above can be effectively pro-
grammed on a digital computer, and extensive computations can be
made for many columns with different loading and support conditions.
The initial conditions required to start the integration and the
criteria used to terminate it are, of course, somewhat different
for the different cases. They will be discussed in some detail
when the method of solution for each case is presented.
2.2 MOMENT-CURVAlURE-THRUST RELATIONSHIPS
The M-¢-P relationships used in the computations were de-
termined for the 8W31 section by a separate computer program. In
this program a moment vs. curvature curve was developed for a con-
stant axial thrust by dividing the cross section into a large number
of finite elements. The strains of the elements are related to the
curvature of the section and the stresses to the applied bending
moment. The relationship between the applied moment and the re
sulting curvature can therefore be found through equilibrium and
compatibility conditions of these elements. The details of the
-8-
method and the computer program are described elsewhere. 14
The basic program can be easily modified to take into
account the effect of residual stresses. In this study, only
residual stresses resulting from differential cooling rate are
considered. The distribution and magnitude of the residual stresses
adopted in the calculations are the same as those used in the pre
vious studies on beam-columns. 5 ,6,13 When the resulting M-¢-P
relationships are used in the numerical integration process, the
final results (deformations and ultimate strength) will automatically
include the influence of residual stresses.
Although the M-~-P curves and other cross sectional
properties used in the analysis were based on the SW3l section,
the numerical results obtained, after proper nondimensionalization;
are valid for other column sections also. It has been found in
another study that the M-¢-P curves of the 8W31 section are close
h M rn fIt· 15to t e average -p-P curves 0 most co umn sec lons.
-9-
3. METHOD OF SOLUTION AND RESULTS FOR CASE (a)
The problem to be solved for this case is as follows:
for a given column (with known length and cross sectional proper
ties) subjected to a specified axial force, determine the maximum
lateral load, R ,that can be safely carried by the member. Themax
first step in the solution is to find a systematic approach for
determining the response of the column to the varying lateral load.
The desired response is usually represented by a load versus center
deflection (R - 00) curve or a load versus end slope (R - 80 ) curve.
Once the complete response curve is obt~ined, the maximum load can
be easily determined from the peak of the curve.
Referring to Fig. 2, the special conditions applicable
Rto Case (a) are: MO = 0, q = 0, and Va = 2. With these conditions,
the integration process may proceed according to the scheme de-
scribed above after Rand 80 are assigned specific values. In
carrying out the actual numerical computations, it is convenient
to first specify a value of R and to perform repeated computations
for a number of selected eO values. The procedure is then repeated
for other R values. In all the computations, the integration is
terminated at a point where the slope of the deflection curve be-
comes zero. This is done because the actual deflection curve of
the column has a zero slope at the midspan. The distance from the
left end of the column to the point of zero slope obviously will
-10-
vary with the assumed initial slope, eO.
Since the purpose of the computations is to obtain nu-
merical results for several columns with specified slenderness
ratios, it is more convenient to select the segment lengths as
multiples or fractions of the radius of gyration of the cross sec-
tion. Both the slenderness ratio and the radius of gyration used
in the subsequent discussions are computed for the major axis.
In order to improve the accuracy of the final results, the length
selected for a given segment is varied according to the bending
moment found at the end of the previous segment. The following
criteria are used in the selection of segment length
p = 2r if
p = r if
o .:sIMI < 0.8 Mpc
0.8 M ' <IMI< 0.9 Mpc - pc
(lla)
(lIb)
p = O.II' if 0.9 M <IMI< M, pc - pc (lIe)
in which M is the reduced plastic moment corresponding to thepc
specified axial force. As an example, if at the end of the tenth
segment the bending moment MlO is found to be 0.85 Mpc ' then the
length for the eleventh segment should be PI1 = I'. Thus, starting
from the left end, the segment length decreases from 2r to rand
finally to O.lr, if the bending moment equals or exceeds 0.9 Mpc
For certain cases, in which the bending moment is always less than
-11-
0.9 M ,a segment le~gth equal to O.lr is also used -for the_ pc
last few increments before terminating the computations. This
adjustment permits a more precise determination of the location at
which the slope of the deflection curve becomes zero. When the
integration process carried out f9r a given case is completed, the~ ~
total distance included in the computations is usually given as a
mUltiple of r, say Ar.
To provide a systematic, way of specifying the value of
the lateral load, a reference load is used. This load, denoted
by Rpc20 ' is defined as the plastic load of the shortest column
(L/r = 20) considered in the computations and is given by
.,
Rpc20
4 M M= _--=--p_c _ pcL -sr (12)
In all the numerical computations, the lateral loads are always
specified as fractions of the reference load. In a similar manner,
the axial force, P, is specified as a fraction of the axial yield
load, P .y
Th~ results of. computations made for the case with
P = 0.4 P are shown in Fig. 3. Each curve gives the relationshipy .
between the initial slope, 80 , and the resulting zero-slope dis-
tance Ar (or A) for a specified value of R. Initially, an increase
in eo results in a corresponding increase in A. The rate of'in
crease in A is gradually reduced as eO increases; and, corresponding
-12-
to some assumed 80
, a maximum A is eventually reached. At this
point a further increase in eO causes a decrease in A. Although
the relationship between A and eO tends to reverse for larger eO
values, the bending moment MA at the point of zero slope is found
to increase continuously with 90 . For some specified initial slope,
say eop ' the bending moment in some segment may reach the reduced
plastic moment, M ,of the section before the slope of the de-pc
flection curve becomes zero. When this occurs, the integration
process is discontinued and no further computations will be per-
formed for larger assumed initial slopes. Each 8 0-A curve therefore
terminates at a maximum initial slope equal to eOp . A total of
twenty-three eO-A curves was prepared (sixteen are shown in Fig. 3)
from which the lateral load versus end slope relationships given in
Fig. 4 were obtained.
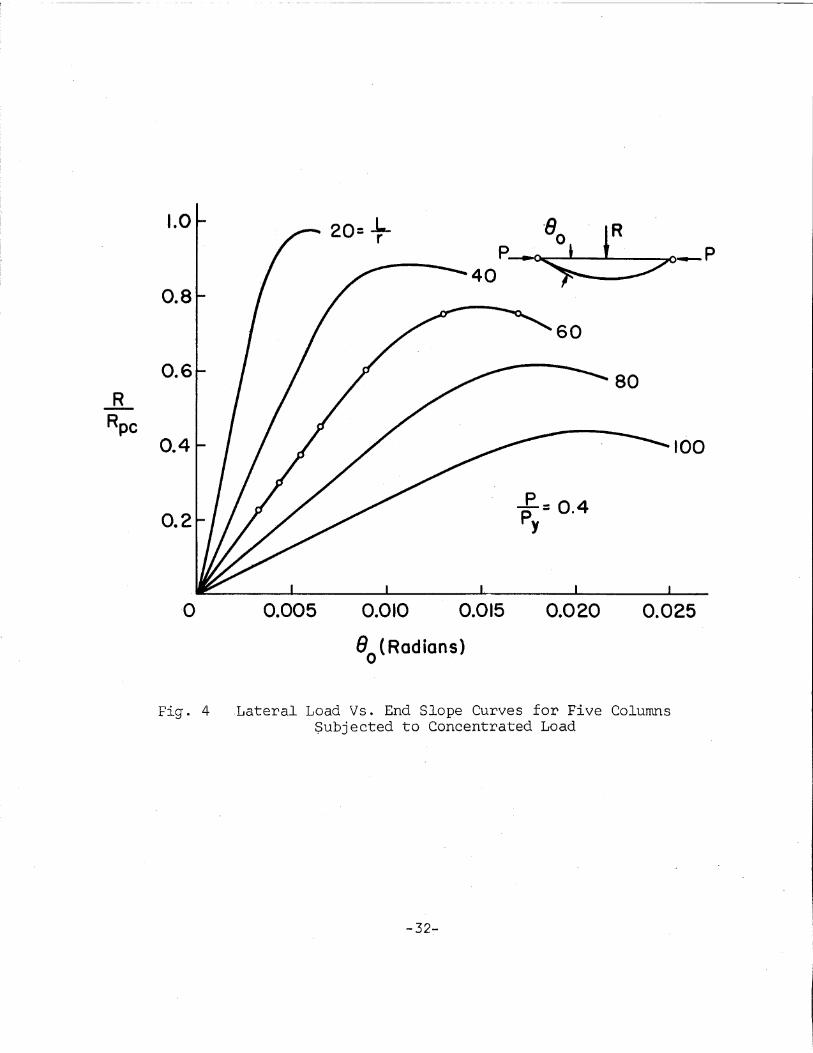
The procedure for determining the load-end slope cu~ves
is illustrated in Fig. 3 for a column with L/r ~ 60. A vertical
line is first drawn from the point where A equals 30. The points
of intersection of this line with the various 80-A curves give the
end slopes of the column when it is loaded by the specified lateral
loads. The results obtained are plotted as small circles in Fig. 4,
and, through these circles, the desired load-end slo~e curve
(labelled 60) can be constructed. The peak of the curve gives the
ultimate load of the column. The lateral load is nondimensionalized
with respect to the individual plastic load, Rpc ' not with respect
-13-
to the reference load Rpc20 ' as was done in Fig. 3•. This permits
a closer examination of the effect of instability on the strength
and behavio~ of the five cO,lumns.
The procedures described above for, obtaining the 80-A
charts and the RR - eo curves have been repeated 'for the followingpc
specified axial forces: p = 0.2 P , 0.6 P , 0.8 P , and 0.9 P .Y Y Y Y
The maximum lateral loads obtained for these cases together with
those determined from Fig. 4 are summarized in the form of ultimate
strength interaction curves in Fig. 5.. Each curve is for a par-
ticular column and gives the combinations of axial force and lateral
load that can be safely supported by the column. The lateral load
is now nondimensionalized with respect to the simple plastic load,
R , of the individual columns (assuming that no axial force is·p
applied to the columns). The interaction curves can be directly
used in analysis and design computations and also in checking the
validity of the existing design approximations. 3,4,9
-14~
4. METHOD OF SOLUTION AND RESULTS FOR CASE (b)
The numerical integration procedure illustrated in
Fig. 2 is again used to develop the load-deformation curves of
Case (b) columns by utilizing the appropriate boundary and load-
ing conditions. An elementary analysis will show that the bending
moment is" generally higher at the midspan than at the two ends.
The center portion of the column always yields first. Although
some yielding would also occur near the ends, no plastic hinges
have been found to form at these locations when the column is
loaded by the maximum lateral load. Hence, the appropriate con-
ditions to be used in the integration process are eo = 0, q = 0,
Rand Vo =2. The trying variable that must be assumed before start-
ing,the integration is the end moment MO.
For a specified value of R, a"number of MO values ate
first assumed and computations are carried out for each assumed
MO
to determine the zero-slope distance Ar. When the integration
process reaches the point of zero slope, the aeflection at that
point, 0A' is also determined. A chart, similar to that given in
Fig. 3, can then be prepared to give the relationships between 0A
and A for a series of specified R values. From this chart the
lateral load versus center deflection (R - 8 ) curves of the columnsc
can be determined. The maximum lateral loads that can be resisted
by the columns are again given by the peaks of the curves.
-15-
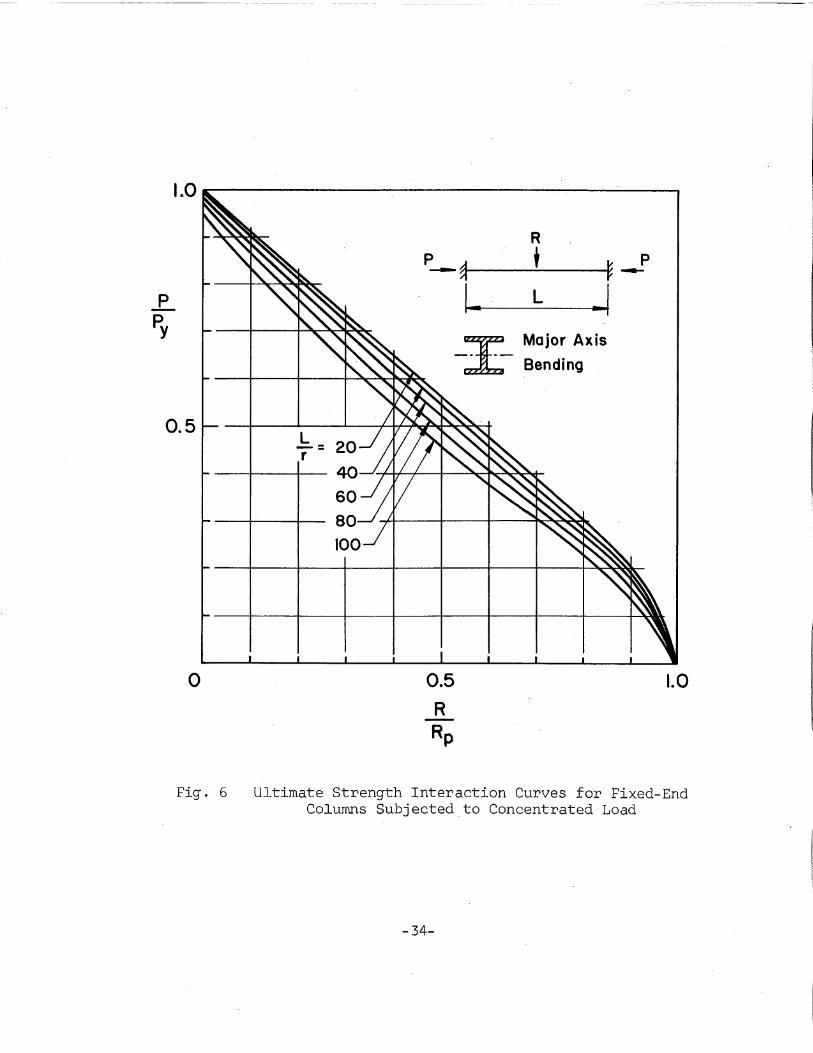
The maximum loads determined for the five selected
columns subjected to various specified axial loads are pre-
sented in Fig. 6. The lateral load is again nondimensionalized
w-ith respec,t to the simple plastic load of th'e individual member,
(13)
A comparison of the interaction curves of Fig. 6 with those of
Fig. 5 indicates that the effect of instability is less' pronounced
in fixed-end columns than in simply-supported columns. The fixed-
end columns are usually stiffer and have less deflections at the
maximum load. Consequently, the secondary moment which causes
the instability effect is also less.
-16-
5. METHOD OF SOLUTION AND RESULTS FOR CASE (c)
Because of the difference in loading condition, the
method developed previously for Case (a) columns is not directly
applicable to this case, although the basic numerical integration
procedure can still be used. In the present case, the reaction
Va at the left end depends not only on the lateral load, q, but
also on the span length, L. It is not possible to fully specify
Va and to start the integration without actually knowing the
zero-slope distance, Ar (which should be equal to L/2 if the
assumed initial slope eo is correct). For this reason, each
column has to be analyzed individually for a number of selected
lateral loads in order to determine its complete load-deformation
relationship.
Figure 7 shows the procedure used to obtain the end,
slopes of a given column when it is loaded by specified axial and
lateral loads. The slenderness ratio of the column is equal to
60, and the specified loads are P = 0.4 PaRd w = 0.66 w ,iny pc
which w is the plastic load of the member and is given bypc .
8Mw - pc
pc -7 (14)
To determine the end slopes, a number of trial eO values are first
-17-
selected and the numerical integration process is carried out
for each value. The appropriate conditions for integration are:
MO ~ 0, q ~ w, and Va = wL/2. In each ca~e, when the accumulated
length covered by the computations reaches L/2 or 30r, the in-
tegration is terminated and the slope 830 recorde~. Unless the
80 happens to be correct, 8 30 is usually different from zero.
When the assumed 80TS are plotted against the recorded 830
's, the
curve given in Fig. 7 is obtained. The correct end slopes for the
column are found to be 0.0144 rad. and 0.0224 rad. These results
determine two points on the load versus end slope curve (Fig. 8).
Additional points on the curve can be obtained by repeating the
procedure for other specified lateral loads. When all the five
columns are analyzed by this method, the ~ - 80 curves shown inwpcFig. 8 are obtained, from which the maximum lateral loads can be
determined.
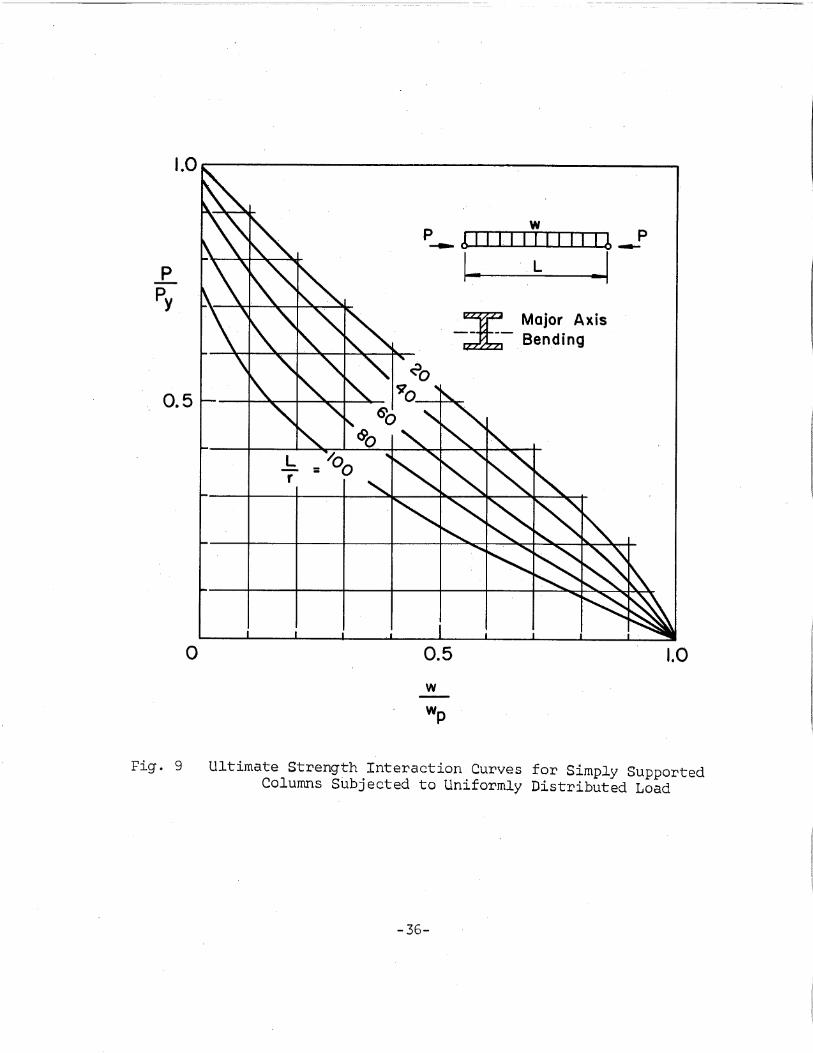
Figure 9 summarizes the results of ultimate strengtn
computations made for the five columns. The maximum lateral load
is nondimensionalized with respect to the simple plastic load, W ,P
which is determined from Eq. 14 by substituting M for M AP pc
close examination of the interaction curves given in Figs. 5 and 9
indicates that on a nondimensional basis the reduction in load-
carrying capacity due to instability is greater in Case (c) columns
than in Case (a) columns. This can again be attributed to the
difference in the resulting deflection produced by the two·types
of loading.
-18-
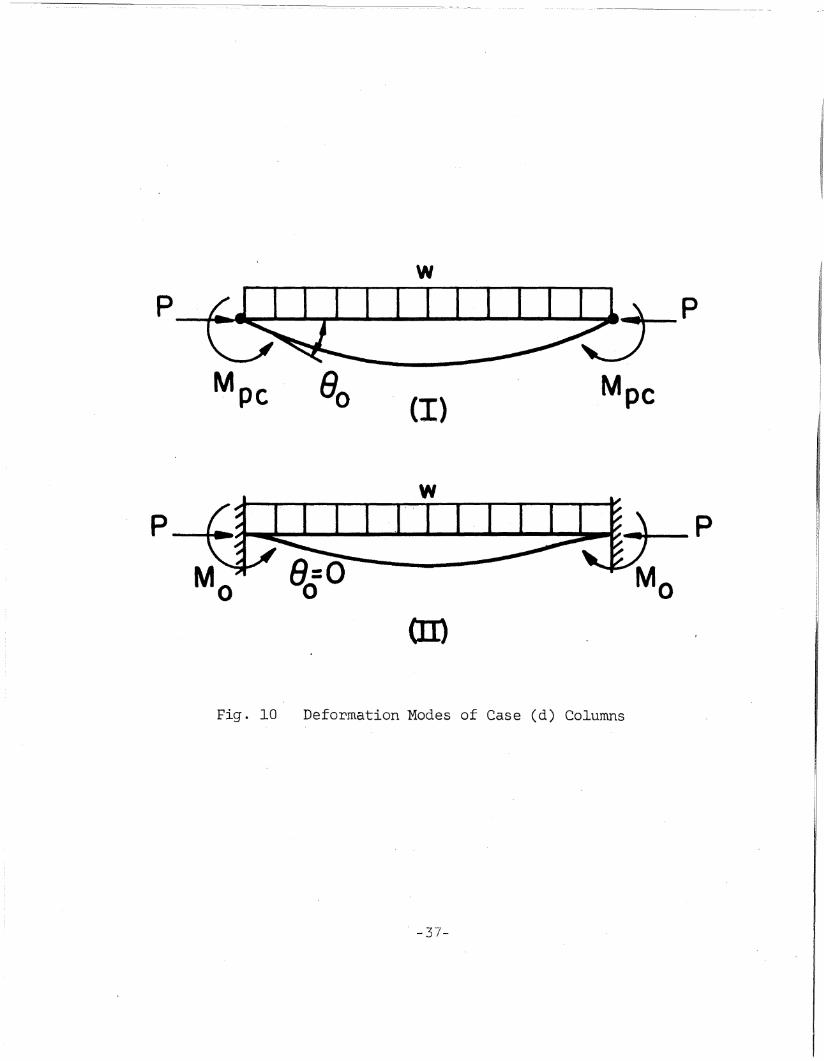
6. METHOD OF SOLUTION AND RESULTS FOR CASE Cd)
The determination of the ultimate strength of Case Cd)
columns is complicated by the fact that the columns may fail in
two different modes. For columns in which the bending moment is
caused primarily. by the lateral load, plastic hinges tend to form
at the ends prior to the attainment of the maximum load. This
. situation is shown as Case I in Fig. 10. The available conditions
to be used in the integration process are: MO = Mpc ' q = w, and
wLVo =:2' and the unknown quantity that must be determined by "trial
is the end slope eO. The problem is thus seen to.be the same as
that for Case (c) columns and the method of solution described
previously for that case can be directly applied.
In columns having high slenderness ratio and subjected\
to heavy axial load, the bending moment at the center may be ampli-
fied significantly by the secondary moment. As a result, the center
moment may become larger than the moment at the two ends, and initial
yielding is likely to occur near the midspan. Although in some
cases, limited yielding can also take place at the ends, no plastic
hinges are found to develop at these locations. Th-e ends of the
column can therefore be assumed to remain fixed for the purpose of
analysis. This case is shown as Case II in Fig. 10, and the known
conditions eO = 0,wL It be easilyare: q = w, and V =-. cana 2
recognized that apart from the difference in loading condition the
-19~
problem to be solved is essentially the same as that involved in
the analysis of Case (b) columns. For a given column subjected
to specified axial and lateral loads, the quantity to be determined
by the trial-and-error procedure is the end moment MO. A series of
trial MO values is first selected and numerical integration is
carried out for each selected value to determine the slope e atc
the midspan. A plot, similar to the 80 versus 8c plot given in
Fig. 7, can then be obtained between the trial MO value and the
resulting slope 8c . From this plot the correct MO value which pro
duces zero slope at the midspan can be determined.
For certain combinations of slenderness ratio and axial
force, it may be difficult to predict which case is the governing
case. In such situations, trial calculations must be performed
for both cases.
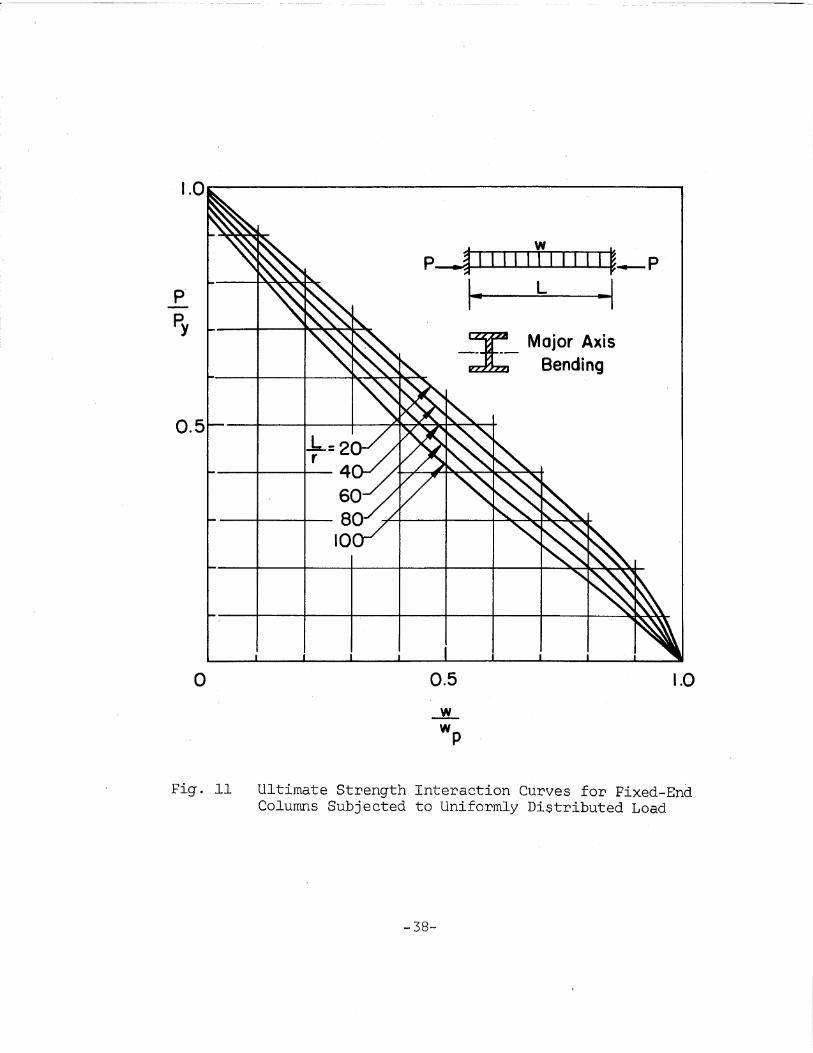
Figure 11 summarizes the numerical results obtained for
the five selected columns. The lateral lead is again nondimension-
alized with respect to the simple plastic load, w· , which is givenp
by
wp
16M=--p
12 (15)
The interaction curves presented in Fig. 11 can be compared with
those given in Fig. 6 to assess the effect of variation in loading
-20-
condition. The same. curves can also be compared. with the. inter
action curves in Fig. 9 to evaluate the influence of end restraint.
-21-
7. COMPARISON OF RESULTS 'WITH INTERACTION FORMULAS
In designing members carrying combined axial compression
and bending stresses, use is frequently made of the so-called
interaction formulas. Three such formulas are given in Part 1 of
the AISC Specification for use in allowable-stress design. A1-
though these formulas were originally developed for predicting the
stresses in the elastic range, studies have shown that they also
16 17provided good estimates of the ultimate strength.' These
studies were made primarily for columns which are loaded by com-
bined axial force and end moments. In the following, a similar
study will be made for the four cases of laterally loaded columns
analyzed in the paper.
The formula which will be used in the comparison is
Formula (7a) given in the Specification. It can be written in
terms of ultimate loads as
1.0 (16a)
for Case (a) and Case (b) columns, or as
Pew
+ m = 1.0p- ( p 'w
Cl' 1 - p) pe
-22-
(16b)

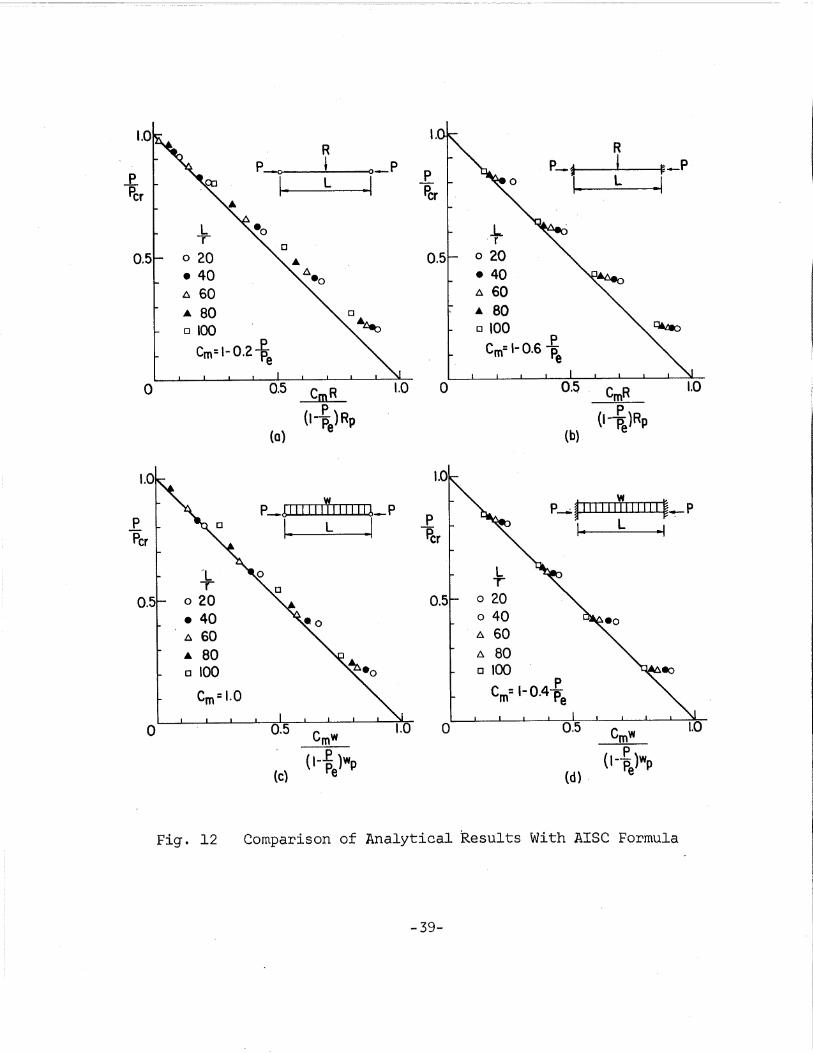
for Case (c) and Case Cd) columns. There are three new terms,
P P and C , in these equations; they are defined as follows:er' e' m
P = critical load of the member_loaded coneI'
centrically by axial force only. Fer the
columns under consideration, -it is the
buckling load about the strong axis.
P = elastic critical load for buckling in thee
plane of the lateral load.
C = a coefficient depending on loading andm
support conditions. It assumes the following
values for the cases of columns considered
herein
Case (a)
Case (b)
Case (c)
Case (d)
C 1 0.2 P= - p-m e
C 1 P= - 0.6 p-m e
C = 1.0m
C 1 P= - 0.4 -m Pe
(17a)
(17b)
(17c)
(17d)
The maximum loads determined by the analytical procedures
for the four types of columns are compared in Fig. 12 with the inter
action formula in a manner suggested by Mason, Fisher and Winter. 17 .
-23-
In general, the interaction formulas are seen to give good pre
dictions for all the case~ investigated. For Cases (a) and (c),
the formula tends to undere-stimate the carrying capacity in the
low axial force range, but the difference is usually small. The
same trend can also be observed for Case (b) and Case Cd) columns,
except that in these cases the difference (on conservative side)
seems to be somewhat larger for low slenderness ratio columns.
It may be concluded from this study that the AISC interaction
:formula is valid not only in predicting the elastic range stresses
but also in estimating the ultimate strength.
-24-
8 • SUMMARY ANP CONCLUSIONS
A general method for determining-the-load-deformation
relationships of laterally loaded columns in the elastic and
elastic-plastic range has been developed. It employs a segment
by-segment integration process, using the available moment-curvature
thrust data as the basic impact. By properly utilizing the boundary
and support conditions, th~ method can be effectively used to ob
tain solutions to a variety of column problems. Specific appli
cations have been made to the four cases of columns shown in
Fig. 1. For each case the general method was applied to obtain
ultimate strength solutions for five selected columns with slender
ness ratios ranging from 20 to 100. The results are given in
Figs. 5, 6, 9, and 11 in the form of interaction curves relating
the axial thrust, maximum lateral load and slenderness ratio.
All the results obtained in this study are for wide
flange columns subjected to lateral loads producing bending moment
about the major axis of the cross section. It has been assumed
that failure is always due to excessive bending in the plane of
the applied load and that lateral-torsional buckling or local buck
ling does not occur throughout the loading history. In all the
calculations the influence of cooling residual stresses were taken
into account through the use of the special moment-curvature-thrust
relationships that include the effect of these stresses. Although
the interaction curves were prepared for A36 steel with a nominal
-25-
yield stress of 36 ksi, they can be applied to steels of other
yield stress levels by substituting an equivalent slenderness
ratio:
'-'""1
(18)
This substitution will yield exact results if the residual stress
has the same distribution pattern over the cross section and the
same proportion of the yield stress for the different steels. 2
The maximum lateral loads determined by the analytical
procedures have been compared in Fig. 12 with the AISC interaction
formula and good agreement has been observed.
-26-
9. ACKNOWLEDGMENTS
The work described in this paper was first carried out
by the junior author, when he was a Byllesby Research Fellow in
the Fritz Engineering Laboratory, Department of Civil Engineering,
Lehigh University. The research was performed under the super
vision of the senior author who formulated the analytical procedures
and prepared portions of the computer program.
The senior author has been closely associated with a
general investigation on "Plastic Design of Multi-Story Frames",
from which the subject matter studied in the paper was developed.
The investigation is sponsored by the Welding Research Council and
the U. S. Navy Department. Funds are supplied by the American Iron
and Steel Institute, American Institute of Steel Construction,
Naval Ship Systems Command and Naval Facilities Engineering Command.
Technical guidance for the project is provided by the Lehigh Project
Subcommittee of the Structural Steel Committee of the Welding Re
search Council. Dr. T. R. Higgins is Chairman of the Lehigh Project
Subcorrunittee.
Dr. B. P. Parikh was responsible for the development of
the moment-curvature relationships used in the computations. His
assistance is gratefully acknowledged.
-27-
Cm
L
M
Ma
p
pcr
pe
py
q
R
=
=
==
=
==
=
==
10. NOTATION
a coefficient contained in the AISC interaction formula
length of column
bending moment
average bending moment of segment
axial force
critical load of column if axial force alone existed
elastic critical load about strong axis
axial yield load
general distributed lateral load
concentrated lateral load
R = maximum value of R according to plastic theory. Thepc
reduction in moment-carrying capacity due to axial force
is included, but the effect of column instability is not.
R = maximum value of R according to simple plastic theoryp
r = radius of gyration about major axis
v = shear force
Va = shear force at beginning of first segment = support reaction
w = uniformly distributed lateral load
w = maximum value of w according to plastic theory (See R )pc pc
w = maximum value of w according to simple plastic theoryp
0 = deflection
o = average deflection of segmenta
-28-
e = slope
Itj~t.
80
initial end slope:::
A = a parameter used to define zero-slope distance
p ::: length of segment
cr = yield stress of materialy
,0 ::: curvature
-29-
R Rp 1 p
e-.~ t ~~---0 O~
1- jL r. L ~(0) (b)
w wp p p p- ---- --- ---
1- L -I 1- L -I.(c) (d)
Fig, 1 Cases of Laterally Loaded ColurrmsStudied in the Paper
p£; ~------""'-~----"'-""-....a.--..L---I~""--L...-..-
Mo ' t ~VI I on01 I I
1- I I I PI I I :I I I I V.I ,I I I : I I n
~"r P3 -1-------- 1Fig. 2 Numerical Integration Scheme
-30-

I p = 0.4 IPy
ILNI-JI
0.040
0.035
0.03080
(Radi~ns)
0.025
0020
0.015
0.010
0.005
o 5 10 15 20
~~c?o
25 30 35 40
A45 50 55
Fig. 3 A Sample 80
- A Chart
l
·8 . R
40P~.~-p20= +-1.0
0.8
0.6
JLRpc
0.4 lao
0.2 : = 0.4Y
-0 0.005 0.010 0.015 0.020 0.025
Fig. 4 ,Lateral Load Vs. End Slope Curves for Five Columns$ubjected to Concentrated Load
-32;

1.0------------------------,
T Major Axis-~-Bending
1.0
-IL.
R
':.. uoo----,----o 21-
0.5
RRp
o
0.5
Fig. 5 Ultimate Strength Interaction Curves for SimplySupported Columns Subjected to Concentrated Load
-33-
1.0
Major Axis
Bending-1:-
0.5
RRp
L-=r
o
I~O ...-------------------.
0.5
Fig. 6 Ultimate Strength Interaction Curves for Fixed-EndColumns Subjected_to Concentrated Load
-34-

0.028
~ =0.4Y
-'=-- =60rJL =0.66wpc
0.016
0.012 '-0.0144
0.008
0~004
-0.004 -0.003 -0.002 -0.001, o 0.001 0.002
.830 ( Radians)
Fig.- 7 Determination of End Slopes of Simply SupportedColumn Subjected to Uniformly Distributed Load
l.0
80
60
w
~ =0.4Y
p-~-pa
40 0
0,008 0.012 0016 0.020 0,024 0,028 0.032
80
(Radians)
0.004o
0.6
0.8 .
0.4
0.2
Fig. 8 Lateral Load Vs. End Slope Curves for Simply Supported.Columns Subjected to Uniformly Distributed Load
-35-
1.0---------------------,
0.5
o
w pP rrrrr.-rrr-rrTl~ --
T .MO.jOr Axis-~- Ben,ding
0.5
w
1.0
Fig. 9 Ultimate Strength Interaction Curves for Simply SupportedColumns Subjected to Uniformly Distributed Load
-36-
w
(I)
an
Fig. 10 Deformation Modes of Case Cd) Columns
, - 37-
1.0
L
_T_ Major Axis~ Bending
0.5
P.......~L--I-~..&.....I-...I-.oI-...a....-...t-~~ p
-I
-'=-= 2r~----I-----+-- 4
60--+--+--- 80
10
o
1.0-------------------------,
0.5
Fig. 11 Ultimate Strength Interaction Curves for Fixed-EndColumns Subjected to Uniformly Distributed Load
-38-
l.R R
P--e I o-p p--~ I p_P~ I· L ·1
p0 I.. L ·1Per ~r
L ..LT . r
D
0.5 o 20 A 0.5 o 20• 40 .6.
0• 40
.6 60 A 60A 80 D A 80o 100
,o '00 ~
Cm:'-O.2i Cm: 1-0.6 ~e
0 0.5 CmR l.0 0 0.5 - CmR top P
(0)(1- Pe)Rp
(b)(1- PelRp
1.0
p~! II I II 11 I III 116-PVI
p__ ~ 1111111111111 ~_pP [] I. L .1
pI.. L .. IPcr ~r
~L 0 LT 0
T
0.5 o 20 0.5 o 20
• 40 o 40 .0
.6 60 /:}. 60A 80 6- 80o 100 ~·o o 100
em =1.0 em=1-0.4 ~e
0 Cmw 1.0 0 Cmw
(I-J: )wpP
(1- Pelwp(c) Pe (d) .
Fig. 12 Comparison of Analytical Results With AISC Formula
-39-

"C.----.-.- ------ ----.--..-.--- ..-.-....------------------------------_~~
12 • REFERENCES
1. Timoshenko, 8. P. and Gere, J. M.THEORY OF ELASTIC STABILITY, Chapter 1, 2nd Edition,McGraw-Hill Book Co., Inc., New York, 1961
2. Column Research CouncilGUIDE TO DESIGN CRITERIA FOR METAL COMPRESSION MEMBERS,Chapter 6, 2nd Edition, edited by B. G. Johnston,John Wiley & Sons, Inc., New York, 1966
3. Horne, M. R. and Merchant, W.THE STABILITY OF FRAMES, Pergamon Press Inc., New York,1965
4. AISCCOMMENTARY ON THE SPECIFICATION FOR THE DESIGN,FABRICATION, AND ERECTION OF STRUCTURAL STEEL FORBUILDINGS, AISC, New York, N. Y., 1963
5. Galambos, T. V. and Ketter, R. L.COLUMNS UNDER COMBINED BENDING AND THRUST, Trans.ASeE, Vol. 126, Part I, Proc. Paper 1990, 1961, p. I
6. Ketter, R. L.FURTHER STUDIES ON THE STRENGTH OF BEAM-COLUMNS,Journal of the Structural Division, ASCE, Vol. 87,No. ST6, Proc. Paper 2910, August 1961, p. 135
7. Ojalvo, M. and Fukumoto, Y.NOMOGRAPHS FOR THE SOLUTION OF BEAM-COLUMN PROBLEMS,Bulletin No. 78, Welding Research Council, New York,1962
8. VanKuren, T. C. and Galambos, T. V.BEAM-COLUMN EXPERIMENTS, Journal of the StructuralDivision, ASCE, Vol. 90, No. ST2, Proc. Paper 3876,April, 1964, p. 223
9. Wright, D. T.THE DESIGN OF COMPRESSED BEAMS, The Engineering Journal,Canada, Vol. 39, February, 1956, p. 127
-40-
10. von Karman, T. ..UNTERSUCHUNGEN DBER KNICKFESTIGKEIT, Mitteilungen uber .Fors chungsarbeiten , herausgegeben vom Verein DeutscherIngenieure, No. 81, Berlin, 1910
11. Chwalla, E.AUSSERMITTIG GEDRUCKTE BAUSTAHLSTABE MIT ELASTISCHEINGESPANNTEN ENDEN liND VERSCHIEDEN GROSSENANGRIFFSHEBELN, Der Stahlbau, Vol. 15, Nos. 7 and 8,
- 1937, pp. 49 ~nd 57
12. Oja1vo, M.RESTRAINED COLUMNS, Thesis presented to Lehigh University'at Bethlehem, Pa. in 1960 in partial fulfillment of therequirements for the degree of Doctor of Philosophy(University Microfilms, Inc., Ann Arbor, Mich.)
13. Ketter, R. L., Kaminsky, E. L., and Beedle, L. S.P~ASTIC DEFORMATION OF WIDE-FLANGE BEAM-COLUMNS,Transaction, ASCE, Vol. 120, 1955, p. 1028
14. Parikh, B. P.ELASTIC-PLASTIC ANALYSIS AND DESIGN OF UNBRACED MULTISTORY STEEL FRAMES, Thesis presented to Lehigh Universityat Bethlehem, Pa., in 1966, in partial fulfillment of therequirements for the degree of Doctor of Philosophy(University Microfilms, Inc-, Ann Arbor, Mich.)
15. Lu, L. W.COLUMNS, Lecture No.4, in Lecture Notes on "PLASTICDESIGN OF MULTI-STORY FRAMES," Lehigh University, 1965
16. Galambos, T. V.COMBINED BENDING AND COMPRESSION, Chapter 11, inffSTRUCTURAL STEEL DESIGN," Ronald Press, New York,1964
17. Mason, R. E., Fisher, G. P., and Winter, G.ECCENTRICALLY LOADED, HINGED STEEL COLUMNS, Journalof the Engineering Mechanics Division, ASCE, Vol. 84,No. EM4, Prac. Paper 1792, October, 1958, pp. 1792-1
-41-


![[10] Buckling and Ultimate Strength](https://img.pdfslide.us/doc/110x75/577cdce11a28ab9e78aba484/10-buckling-and-ultimate-strength.jpg)