Embed Size (px)
Citation preview
ULT 2.0 TUToriaL
1 ULT 2.0 Tutorial 2010.01
ULT 2.0TUToriaL
2010.01
ULT 2.0 TUToriaL
2 ULT 2.0 Tutorial 2010.01
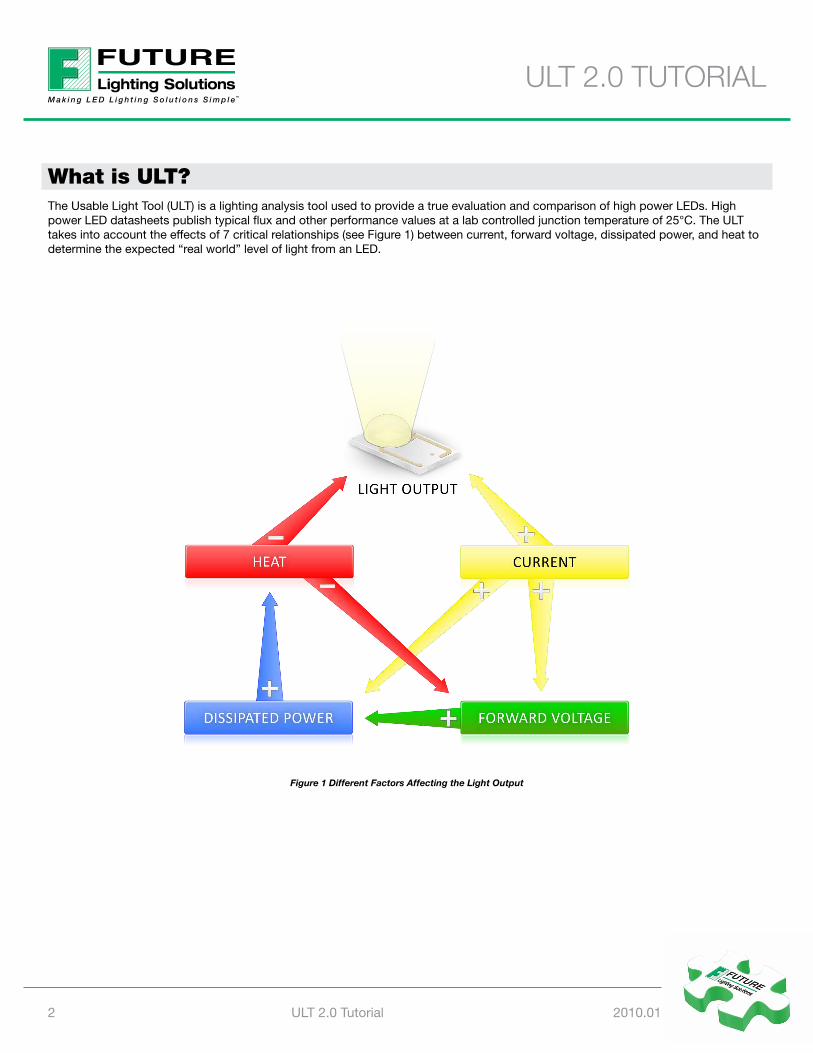
What is ULT?The Usable Light Tool (ULT) is a lighting analysis tool used to provide a true evaluation and comparison of high power LEDs. High power LED datasheets publish typical flux and other performance values at a lab controlled junction temperature of 25°C. The ULT takes into account the effects of 7 critical relationships (see Figure 1) between current, forward voltage, dissipated power, and heat to determine the expected “real world” level of light from an LED.
Figure 1 Different Factors Affecting the Light Output
ULT 2.0 TUToriaL
3 ULT 2.0 Tutorial 2010.01
Working PrinciplesThe Usable Light Tool automatically determines the optimal drive current to maximize the usable light output of an LED, while respecting the maximum junction temperature. However, it is important to note that the “optimal” current may not necessarily be maximum current. The models created for each LED are based on values obtained directly from the LED manufacturer’s datasheets. The ULT uses 3 major sources of data to optimize the analysis:
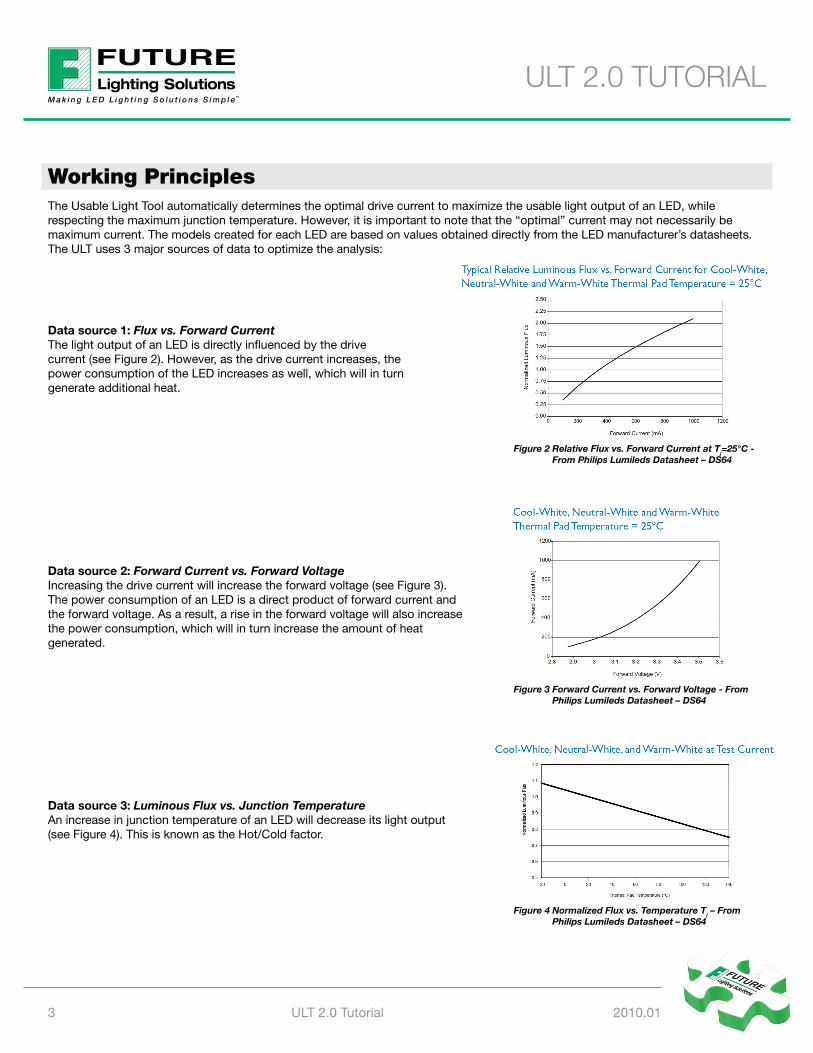
Data source 1: Flux vs. Forward Current The light output of an LED is directly influenced by the drive current (see Figure 2). However, as the drive current increases, the power consumption of the LED increases as well, which will in turn generate additional heat.
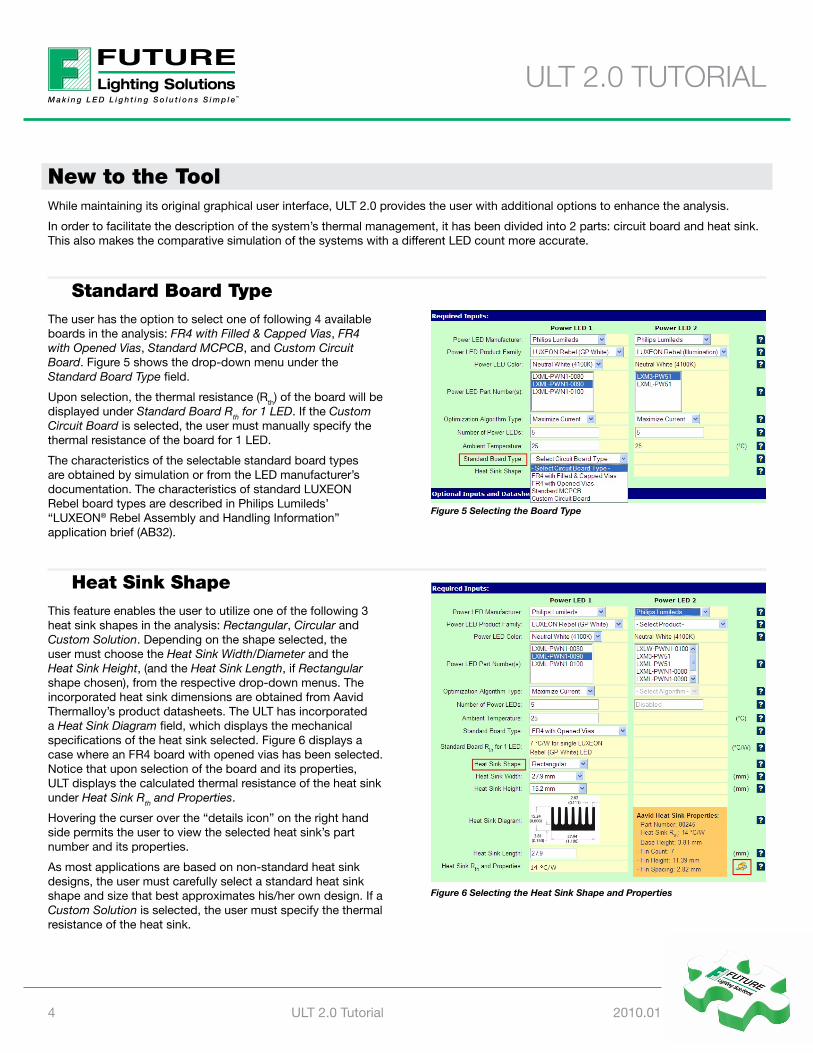
Data source 2: Forward Current vs. Forward Voltage Increasing the drive current will increase the forward voltage (see Figure 3). The power consumption of an LED is a direct product of forward current and the forward voltage. As a result, a rise in the forward voltage will also increase the power consumption, which will in turn increase the amount of heat generated.
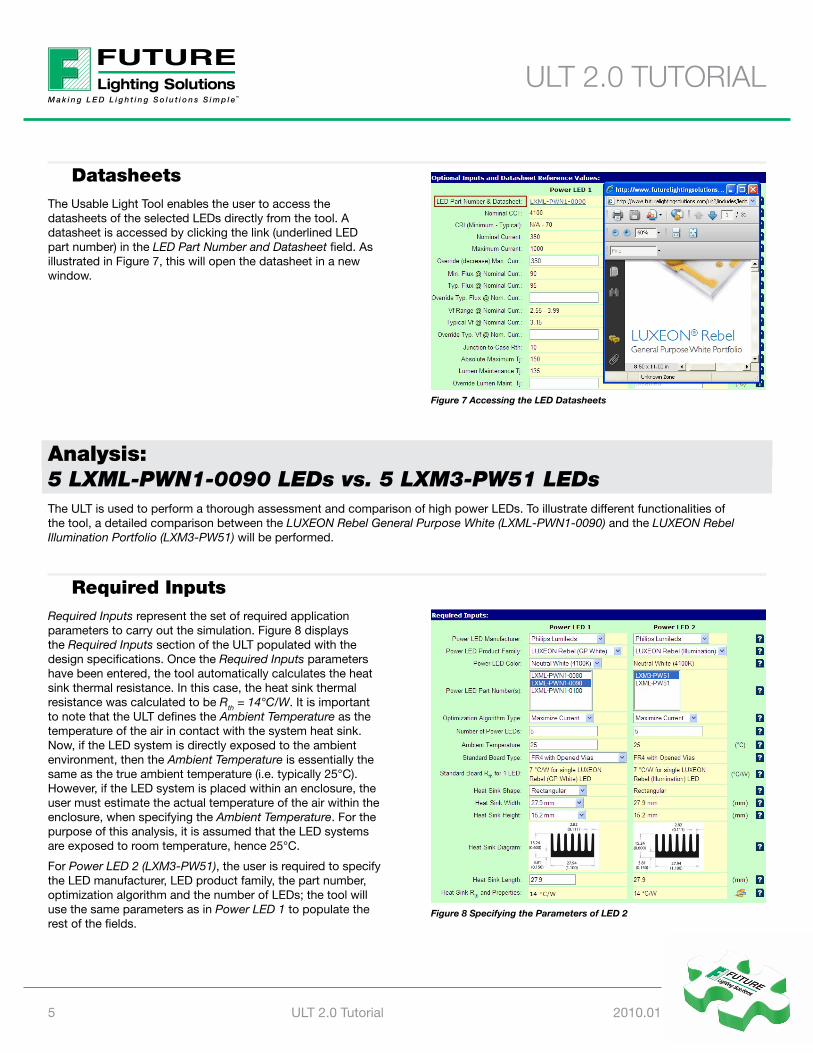
Data source 3: Luminous Flux vs. Junction Temperature An increase in junction temperature of an LED will decrease its light output (see Figure 4). This is known as the Hot/Cold factor.
Figure 2 Relative Flux vs. Forward Current at Tj=25°C - From Philips Lumileds Datasheet – DS64
Figure 3 Forward Current vs. Forward Voltage - From Philips Lumileds Datasheet – DS64
Figure 4 Normalized Flux vs. Temperature Tj – From Philips Lumileds Datasheet – DS64
ULT 2.0 TUToriaL
4 ULT 2.0 Tutorial 2010.01
New to the ToolWhile maintaining its original graphical user interface, ULT 2.0 provides the user with additional options to enhance the analysis.
In order to facilitate the description of the system’s thermal management, it has been divided into 2 parts: circuit board and heat sink. This also makes the comparative simulation of the systems with a different LED count more accurate.
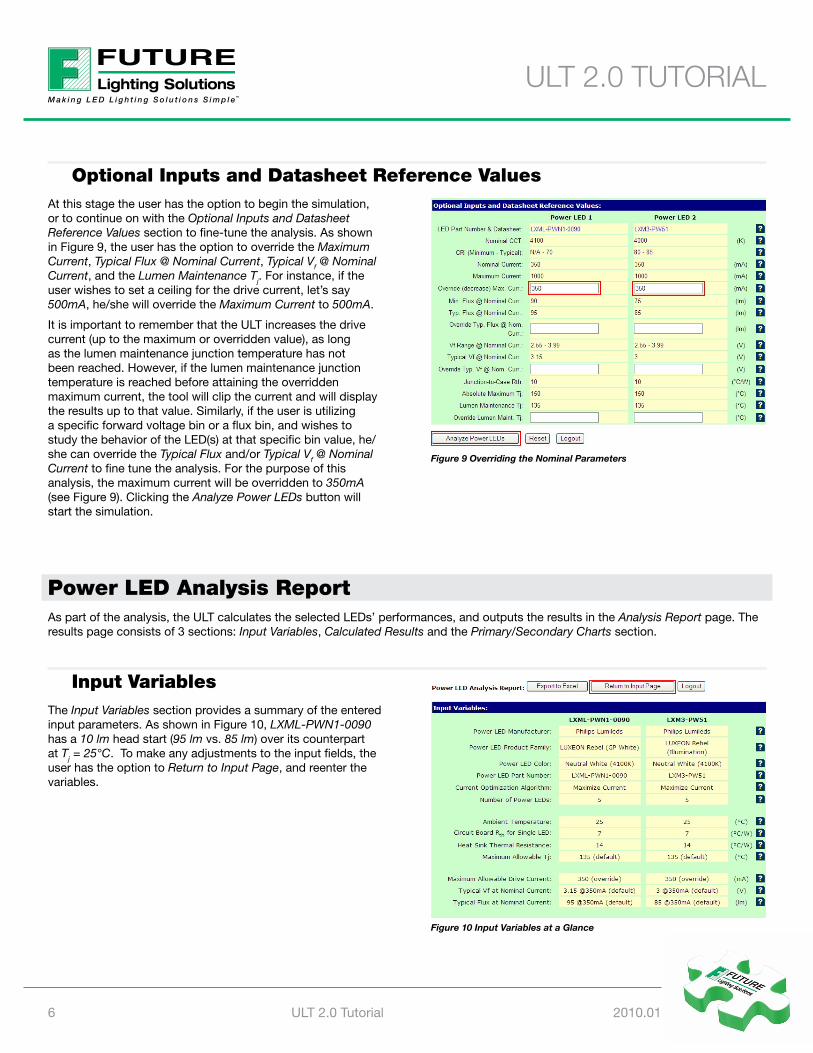
Standard Board TypeThe user has the option to select one of following 4 available boards in the analysis: FR4 with Filled & Capped Vias, FR4 with Opened Vias, Standard MCPCB, and Custom Circuit Board. Figure 5 shows the drop-down menu under the Standard Board Type field.
Upon selection, the thermal resistance (Rth) of the board will be displayed under Standard Board Rth for 1 LED. If the Custom Circuit Board is selected, the user must manually specify the thermal resistance of the board for 1 LED.
The characteristics of the selectable standard board types are obtained by simulation or from the LED manufacturer’s documentation. The characteristics of standard LUXEON Rebel board types are described in Philips Lumileds’ “LUXEON® Rebel Assembly and Handling Information” application brief (AB32).
Heat Sink ShapeThis feature enables the user to utilize one of the following 3 heat sink shapes in the analysis: Rectangular, Circular and Custom Solution. Depending on the shape selected, the user must choose the Heat Sink Width/Diameter and the Heat Sink Height, (and the Heat Sink Length, if Rectangular shape chosen), from the respective drop-down menus. The incorporated heat sink dimensions are obtained from Aavid Thermalloy’s product datasheets. The ULT has incorporated a Heat Sink Diagram field, which displays the mechanical specifications of the heat sink selected. Figure 6 displays a case where an FR4 board with opened vias has been selected. Notice that upon selection of the board and its properties, ULT displays the calculated thermal resistance of the heat sink under Heat Sink Rth and Properties.
Hovering the curser over the “details icon” on the right hand side permits the user to view the selected heat sink’s part number and its properties.
As most applications are based on non-standard heat sink designs, the user must carefully select a standard heat sink shape and size that best approximates his/her own design. If a Custom Solution is selected, the user must specify the thermal resistance of the heat sink.
Figure 5 Selecting the Board Type
Figure 6 Selecting the Heat Sink Shape and Properties
ULT 2.0 TUToriaL
5 ULT 2.0 Tutorial 2010.01
DatasheetsThe Usable Light Tool enables the user to access the datasheets of the selected LEDs directly from the tool. A datasheet is accessed by clicking the link (underlined LED part number) in the LED Part Number and Datasheet field. As illustrated in Figure 7, this will open the datasheet in a new window.
analysis: 5 LXML-PWN1-0090 LEDs vs. 5 LXM3-PW51 LEDsThe ULT is used to perform a thorough assessment and comparison of high power LEDs. To illustrate different functionalities of the tool, a detailed comparison between the LUXEON Rebel General Purpose White (LXML-PWN1-0090) and the LUXEON Rebel Illumination Portfolio (LXM3-PW51) will be performed.
required inputsRequired Inputs represent the set of required application parameters to carry out the simulation. Figure 8 displays the Required Inputs section of the ULT populated with the design specifications. Once the Required Inputs parameters have been entered, the tool automatically calculates the heat sink thermal resistance. In this case, the heat sink thermal resistance was calculated to be Rth = 14°C/W. It is important to note that the ULT defines the Ambient Temperature as the temperature of the air in contact with the system heat sink. Now, if the LED system is directly exposed to the ambient environment, then the Ambient Temperature is essentially the same as the true ambient temperature (i.e. typically 25°C). However, if the LED system is placed within an enclosure, the user must estimate the actual temperature of the air within the enclosure, when specifying the Ambient Temperature. For the purpose of this analysis, it is assumed that the LED systems are exposed to room temperature, hence 25°C.
For Power LED 2 (LXM3-PW51), the user is required to specify the LED manufacturer, LED product family, the part number, optimization algorithm and the number of LEDs; the tool will use the same parameters as in Power LED 1 to populate the rest of the fields.
Figure 7 Accessing the LED Datasheets
Figure 8 Specifying the Parameters of LED 2
ULT 2.0 TUToriaL
6 ULT 2.0 Tutorial 2010.01
optional inputs and Datasheet reference ValuesAt this stage the user has the option to begin the simulation, or to continue on with the Optional Inputs and Datasheet Reference Values section to fine-tune the analysis. As shown in Figure 9, the user has the option to override the Maximum Current, Typical Flux @ Nominal Current, Typical Vf @ Nominal Current, and the Lumen Maintenance Tj. For instance, if the user wishes to set a ceiling for the drive current, let’s say 500mA, he/she will override the Maximum Current to 500mA.
It is important to remember that the ULT increases the drive current (up to the maximum or overridden value), as long as the lumen maintenance junction temperature has not been reached. However, if the lumen maintenance junction temperature is reached before attaining the overridden maximum current, the tool will clip the current and will display the results up to that value. Similarly, if the user is utilizing a specific forward voltage bin or a flux bin, and wishes to study the behavior of the LED(s) at that specific bin value, he/she can override the Typical Flux and/or Typical Vf @ Nominal Current to fine tune the analysis. For the purpose of this analysis, the maximum current will be overridden to 350mA (see Figure 9). Clicking the Analyze Power LEDs button will start the simulation.
Power LED analysis reportAs part of the analysis, the ULT calculates the selected LEDs’ performances, and outputs the results in the Analysis Report page. The results page consists of 3 sections: Input Variables, Calculated Results and the Primary/Secondary Charts section.
input VariablesThe Input Variables section provides a summary of the entered input parameters. As shown in Figure 10, LXML-PWN1-0090 has a 10 lm head start (95 lm vs. 85 lm) over its counterpart at Tj = 25°C. To make any adjustments to the input fields, the user has the option to Return to Input Page, and reenter the variables.
Figure 9 Overriding the Nominal Parameters
Figure 10 Input Variables at a Glance
ULT 2.0 TUToriaL
7 ULT 2.0 Tutorial 2010.01
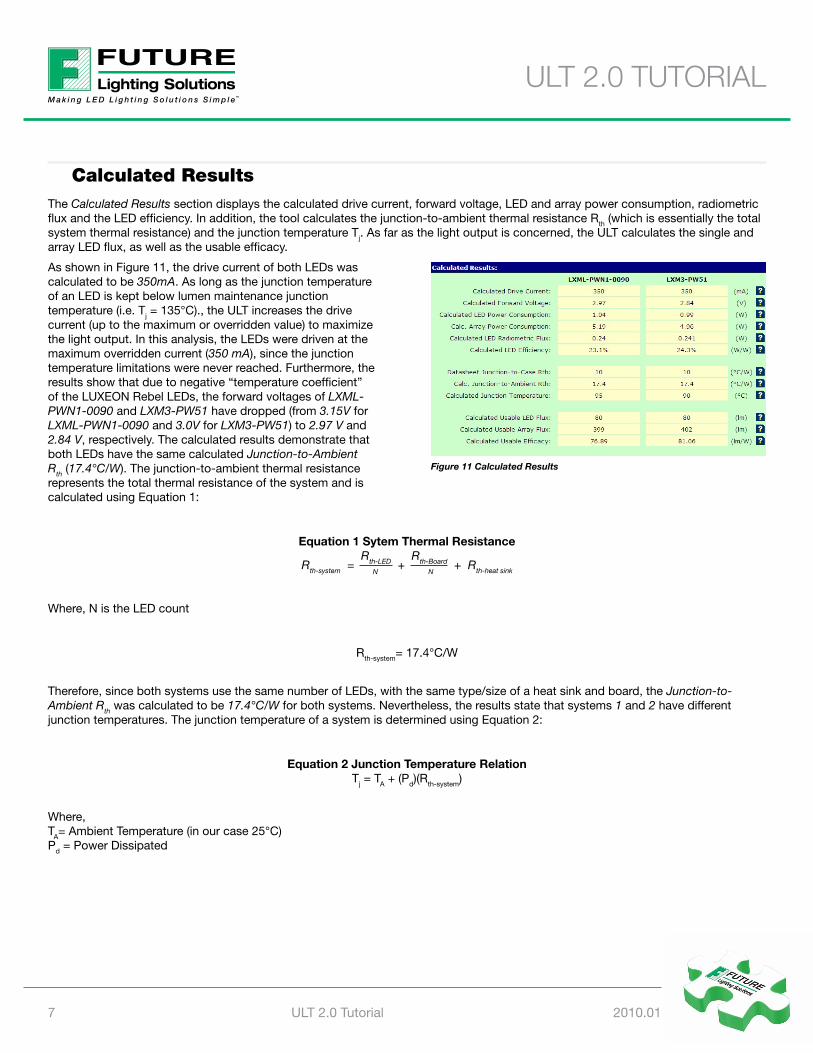
Calculated resultsThe Calculated Results section displays the calculated drive current, forward voltage, LED and array power consumption, radiometric flux and the LED efficiency. In addition, the tool calculates the junction-to-ambient thermal resistance Rth (which is essentially the total system thermal resistance) and the junction temperature Tj. As far as the light output is concerned, the ULT calculates the single and array LED flux, as well as the usable efficacy.
As shown in Figure 11, the drive current of both LEDs was calculated to be 350mA. As long as the junction temperature of an LED is kept below lumen maintenance junction temperature (i.e. Tj = 135°C)., the ULT increases the drive current (up to the maximum or overridden value) to maximize the light output. In this analysis, the LEDs were driven at the maximum overridden current (350 mA), since the junction temperature limitations were never reached. Furthermore, the results show that due to negative “temperature coefficient” of the LUXEON Rebel LEDs, the forward voltages of LXML-PWN1-0090 and LXM3-PW51 have dropped (from 3.15V for LXML-PWN1-0090 and 3.0V for LXM3-PW51) to 2.97 V and 2.84 V, respectively. The calculated results demonstrate that both LEDs have the same calculated Junction-to-Ambient Rth (17.4°C/W). The junction-to-ambient thermal resistance represents the total thermal resistance of the system and is calculated using Equation 1:
Equation 1 Sytem Thermal Resistance
Rth-system = Rth-LED
+ Rth-Board + Rth-heat sinkN N
Where, N is the LED count
Rth-system= 17.4°C/W
Therefore, since both systems use the same number of LEDs, with the same type/size of a heat sink and board, the Junction-to-Ambient Rth was calculated to be 17.4°C/W for both systems. Nevertheless, the results state that systems 1 and 2 have different junction temperatures. The junction temperature of a system is determined using Equation 2:
Equation 2 Junction Temperature Relation Tj = TA + (Pd)(Rth-system)
Where, TA= Ambient Temperature (in our case 25°C)Pd = Power Dissipated
Figure 11 Calculated Results
ULT 2.0 TUToriaL
8 ULT 2.0 Tutorial 2010.01
The dissipated power is the amount of the consumed power that is not converted into light. In the past, the amount of the power converted into light was not a significant factor to consider, since most of the LED’s consumed power was converted into heat. However, recent improvements in LED efficiency have necessitated the need to distinguish the amount of power that is converted into light versus heat. In this analysis, the Calculated LED Efficiency was calculated via complex and recursive algorithms to be 23.1% and 24.3% for systems 1 and 2, respectively. In other words, 76.9% of system 1’s input power and 75.7% of system 2’s input power has been converted into heat.
Therefore, following Equation 2:
Tj-system 1= 25°C + [(5.19 W * 0.769) * 17.4°C/W ]Tj-system 1= 95°C
Similarly,
Tj-system 2= 25°C + [(4.96 W * 0.757) * 17.4°C/W ]Tj-system 2= 90°C
It is important to note that both LEDs have a calculated junction temperature below lumen maintenance junction temperature (i.e. Tj = 135°C). This means that the LXML-PWN1-0090 and the LXM3-PW51 LEDs can both be driven at a higher current while maintaining a junction temperature of 135°C or below.
As previously stated, the light output decreases as the junction temperature increases. The light output degradation is a direct function of the junction temperature. Nonetheless, depending on the test environment and the epitaxial technology used, LEDs are affected differently by the change of temperature. LXML-PWN1-0090 and LXM3-PW51 have typical flux values of 95 lm and 85 lm at a junction temperature of 25°C, respectively. Nevertheless, simulated in a “real-life” environment, the ULT calculates the Usable LED Flux to be 80 lm for both LEDs.
The results also illustrate that Systems 1 and 2 have different usable efficacies as they consume different amounts of power. System 1 has produced a total usable array flux of 399 lm consuming 5.19 W (efficacy = 399/5.19 = 76.89 lm/W), while system 2 produced a total usable array flux of 402 lm consuming 4.96W (efficacy = 81.06 lm/W).
Note: The discrepancy between the calculated total array luminous flux (399lm and 402 for systems 1 and 2, respectively) and the theoretical value (5 * 80lm/LED = 400lm) is due to the fact that the ULT rounds off the calculation results.
ULT 2.0 TUToriaL
9 ULT 2.0 Tutorial 2010.01
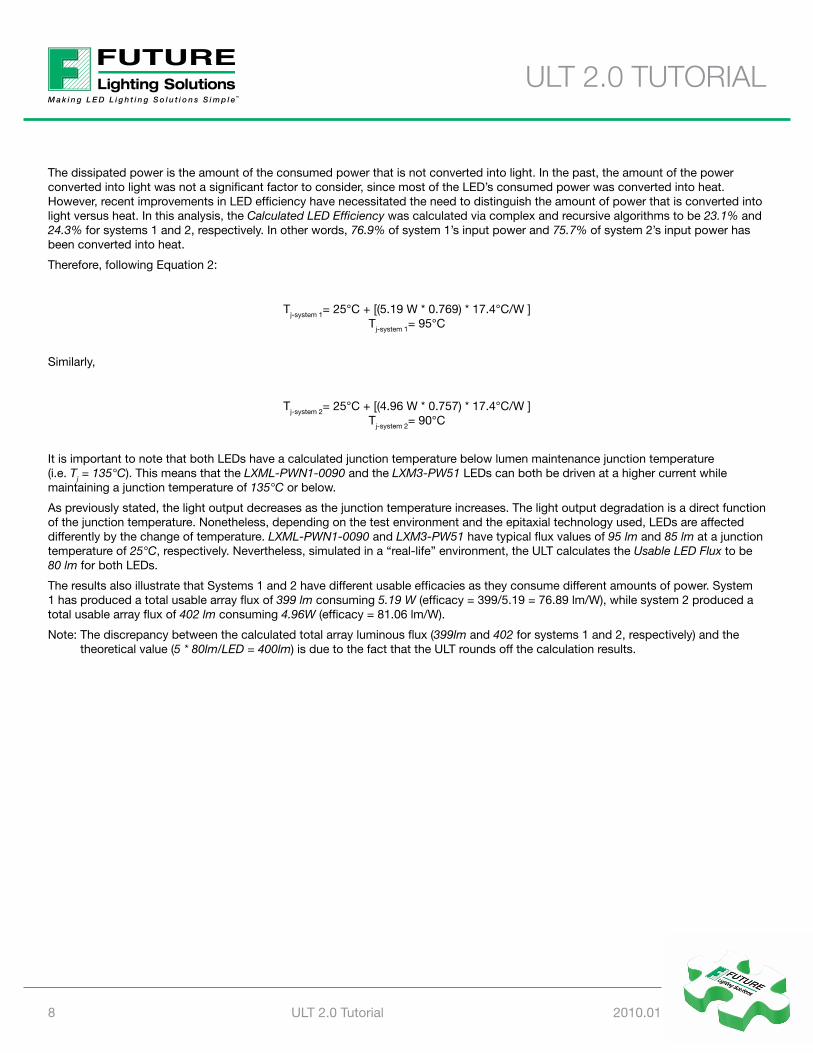
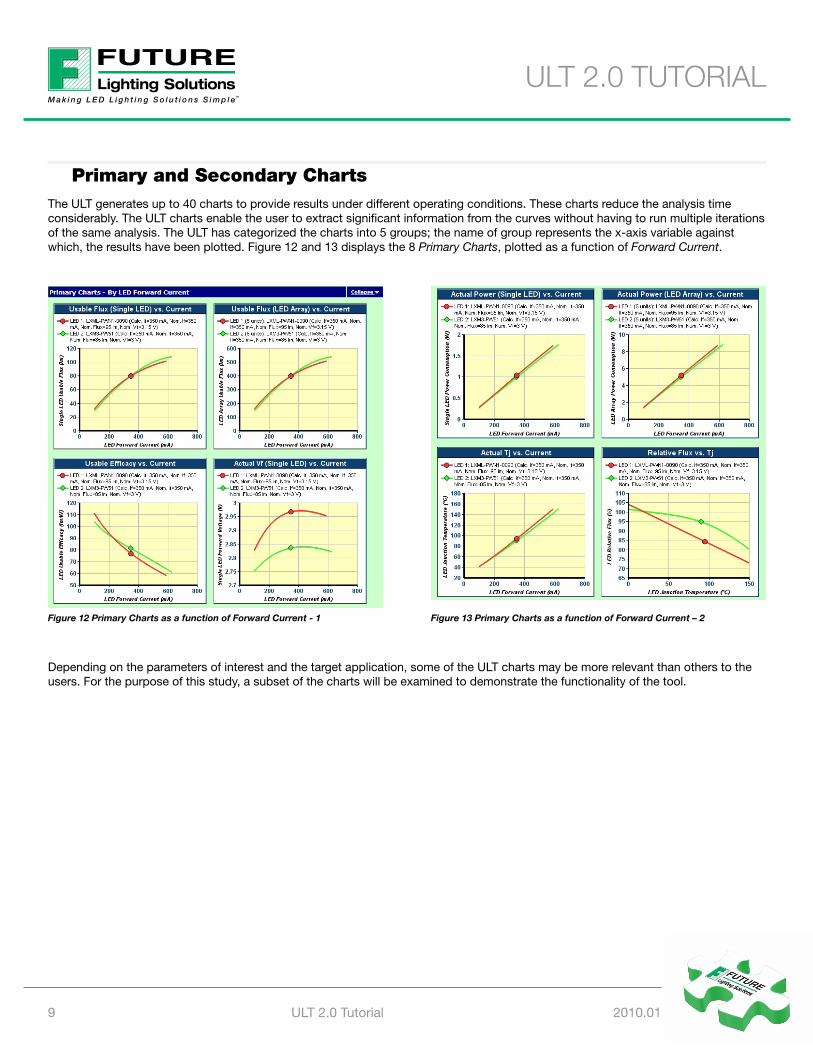
Primary and Secondary ChartsThe ULT generates up to 40 charts to provide results under different operating conditions. These charts reduce the analysis time considerably. The ULT charts enable the user to extract significant information from the curves without having to run multiple iterations of the same analysis. The ULT has categorized the charts into 5 groups; the name of group represents the x-axis variable against which, the results have been plotted. Figure 12 and 13 displays the 8 Primary Charts, plotted as a function of Forward Current.
Depending on the parameters of interest and the target application, some of the ULT charts may be more relevant than others to the users. For the purpose of this study, a subset of the charts will be examined to demonstrate the functionality of the tool.
Figure 12 Primary Charts as a function of Forward Current - 1 Figure 13 Primary Charts as a function of Forward Current – 2
ULT 2.0 TUToriaL
10 ULT 2.0 Tutorial 2010.01
Primary Charts – By LED Forward CurrentThe ULT charts display the results from 100 mA, and increases the drive current until the LED reaches the absolute maximum junction temperature. The absolute maximum junction temperature of the LUXEON Rebel InGaN white LEDs is 150°C. Therefore, the ULT will clip the current plot right before the LED reaches a junction temperature of 150°C. It is absolutely NOT recommended to operate the LEDs anywhere near the maximum junction temperature. Operating at such high temperatures will affect the lifetime and the light output of the LEDs significantly. In addition, it can lead to transient thermal overstress, which may result in a catastrophic failure.
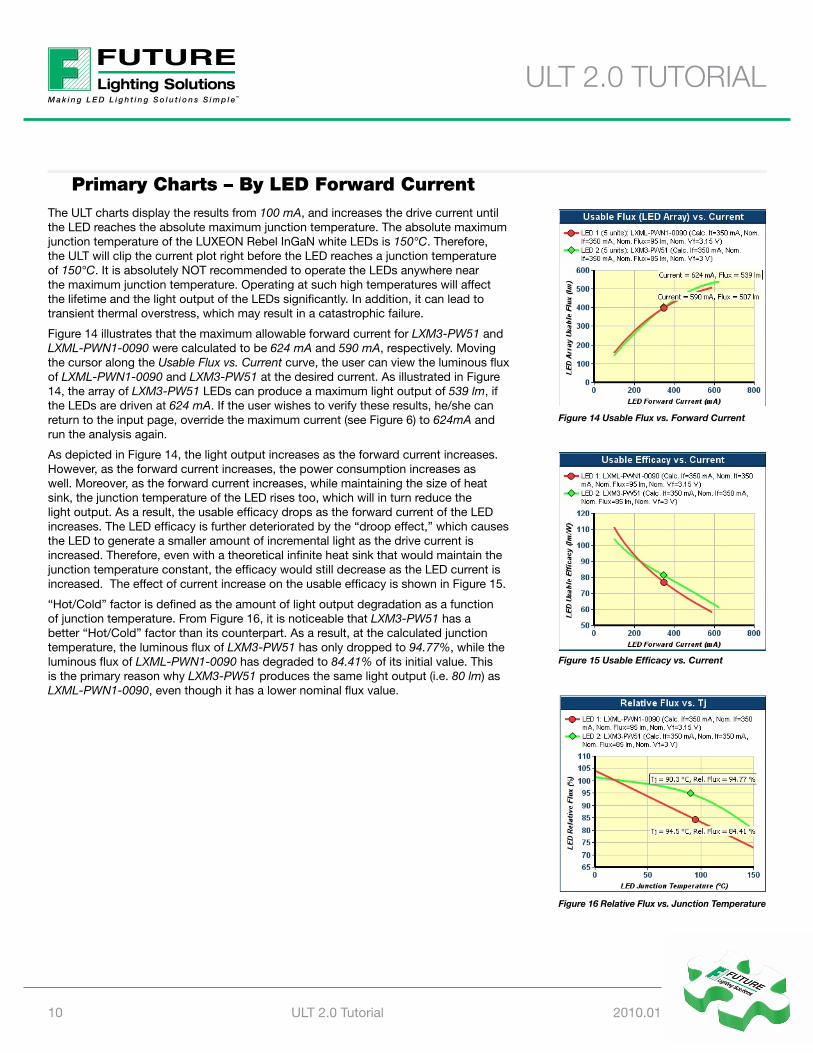
Figure 14 illustrates that the maximum allowable forward current for LXM3-PW51 and LXML-PWN1-0090 were calculated to be 624 mA and 590 mA, respectively. Moving the cursor along the Usable Flux vs. Current curve, the user can view the luminous flux of LXML-PWN1-0090 and LXM3-PW51 at the desired current. As illustrated in Figure 14, the array of LXM3-PW51 LEDs can produce a maximum light output of 539 lm, if the LEDs are driven at 624 mA. If the user wishes to verify these results, he/she can return to the input page, override the maximum current (see Figure 6) to 624mA and run the analysis again.
As depicted in Figure 14, the light output increases as the forward current increases. However, as the forward current increases, the power consumption increases as well. Moreover, as the forward current increases, while maintaining the size of heat sink, the junction temperature of the LED rises too, which will in turn reduce the light output. As a result, the usable efficacy drops as the forward current of the LED increases. The LED efficacy is further deteriorated by the “droop effect,” which causes the LED to generate a smaller amount of incremental light as the drive current is increased. Therefore, even with a theoretical infinite heat sink that would maintain the junction temperature constant, the efficacy would still decrease as the LED current is increased. The effect of current increase on the usable efficacy is shown in Figure 15.
“Hot/Cold” factor is defined as the amount of light output degradation as a function of junction temperature. From Figure 16, it is noticeable that LXM3-PW51 has a better “Hot/Cold” factor than its counterpart. As a result, at the calculated junction temperature, the luminous flux of LXM3-PW51 has only dropped to 94.77%, while the luminous flux of LXML-PWN1-0090 has degraded to 84.41% of its initial value. This is the primary reason why LXM3-PW51 produces the same light output (i.e. 80 lm) as LXML-PWN1-0090, even though it has a lower nominal flux value.
Figure 14 Usable Flux vs. Forward Current
Figure 16 Relative Flux vs. Junction Temperature
Figure 15 Usable Efficacy vs. Current
ULT 2.0 TUToriaL
11 ULT 2.0 Tutorial 2010.01
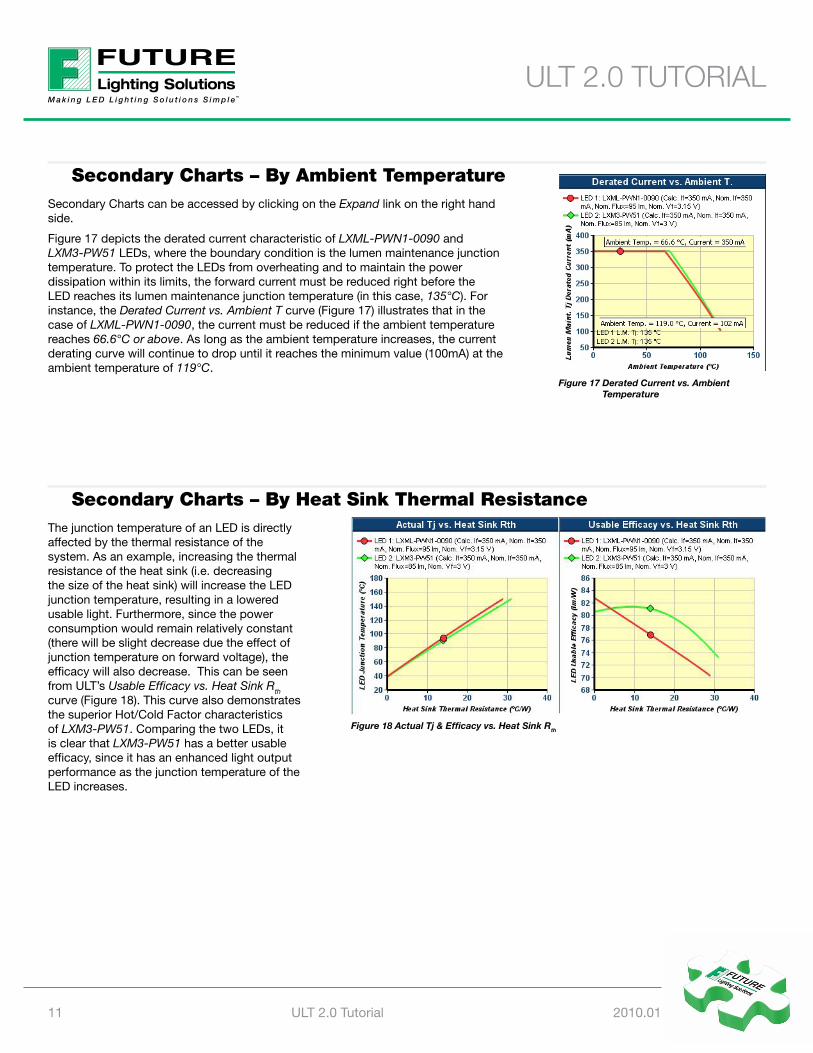
Secondary Charts – By ambient TemperatureSecondary Charts can be accessed by clicking on the Expand link on the right hand side.
Figure 17 depicts the derated current characteristic of LXML-PWN1-0090 and LXM3-PW51 LEDs, where the boundary condition is the lumen maintenance junction temperature. To protect the LEDs from overheating and to maintain the power dissipation within its limits, the forward current must be reduced right before the LED reaches its lumen maintenance junction temperature (in this case, 135°C). For instance, the Derated Current vs. Ambient T curve (Figure 17) illustrates that in the case of LXML-PWN1-0090, the current must be reduced if the ambient temperature reaches 66.6°C or above. As long as the ambient temperature increases, the current derating curve will continue to drop until it reaches the minimum value (100mA) at the ambient temperature of 119°C.
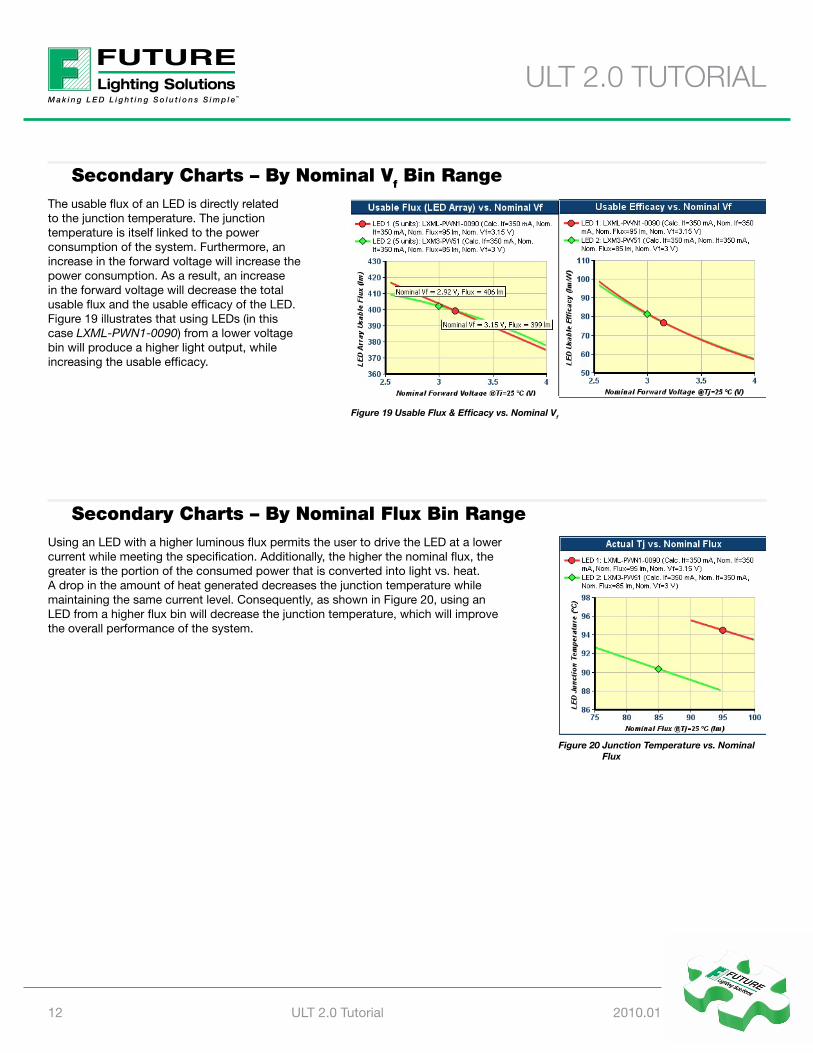
Secondary Charts – By Heat Sink Thermal resistanceThe junction temperature of an LED is directly affected by the thermal resistance of the system. As an example, increasing the thermal resistance of the heat sink (i.e. decreasing the size of the heat sink) will increase the LED junction temperature, resulting in a lowered usable light. Furthermore, since the power consumption would remain relatively constant (there will be slight decrease due the effect of junction temperature on forward voltage), the efficacy will also decrease. This can be seen from ULT’s Usable Efficacy vs. Heat Sink Rth curve (Figure 18). This curve also demonstrates the superior Hot/Cold Factor characteristics of LXM3-PW51. Comparing the two LEDs, it is clear that LXM3-PW51 has a better usable efficacy, since it has an enhanced light output performance as the junction temperature of the LED increases.
Figure 17 Derated Current vs. Ambient Temperature
Figure 18 Actual Tj & Efficacy vs. Heat Sink Rth
ULT 2.0 TUToriaL
12 ULT 2.0 Tutorial 2010.01
Secondary Charts – By Nominal Vf Bin rangeThe usable flux of an LED is directly related to the junction temperature. The junction temperature is itself linked to the power consumption of the system. Furthermore, an increase in the forward voltage will increase the power consumption. As a result, an increase in the forward voltage will decrease the total usable flux and the usable efficacy of the LED. Figure 19 illustrates that using LEDs (in this case LXML-PWN1-0090) from a lower voltage bin will produce a higher light output, while increasing the usable efficacy.
Secondary Charts – By Nominal Flux Bin rangeUsing an LED with a higher luminous flux permits the user to drive the LED at a lower current while meeting the specification. Additionally, the higher the nominal flux, the greater is the portion of the consumed power that is converted into light vs. heat. A drop in the amount of heat generated decreases the junction temperature while maintaining the same current level. Consequently, as shown in Figure 20, using an LED from a higher flux bin will decrease the junction temperature, which will improve the overall performance of the system.
Figure 19 Usable Flux & Efficacy vs. Nominal Vf
Figure 20 Junction Temperature vs. Nominal Flux
ULT 2.0 TUToriaL
13 ULT 2.0 Tutorial 2010.01
Closing remarksThe Usable Light Tool 2.0 (ULT) developed by Future Lighting Solutions is a lighting analysis tool used to provide a true evaluation and comparison of high power LEDs in “real-world” application conditions. The tool takes into account the significant effects of current, forward voltage, dissipated power, and heat to determine the expected “real world” level of light from an LED. As part of the analysis, the Usable Light Tool generates various charts to provide results under different operating conditions. The ULT charts enable the user to extract significant information from the curves without having to run multiple iterations of the same analysis. Depending on the parameters of interest and the application in hand, the user can make use of different charts to suit his/her design requirements. In this analysis, a detailed comparison between the LUXEON Rebel General Purpose White Portfolio (LXML-PWN1-0090) and the LUXEON Rebel Illumination Portfolio (LXM3-PW51) was performed. Using the calculation results/charts, it was illustrated that the light output performance of an LED is directly affected by different factors such as, the drive current, forward voltage, junction temperature and the Hot/Cold factor.
CoNTaCT iNFormaTioN
www.FutureLightingSolutions.com
In North America: 1-888-LUXEON2
In Europe: 00-800-44FUTURE
In Asia: +800-LUMILEDS
In Japan: +81-0120-667-013
Future Electronics and Future Lighting Solutions make no representation or warranty, express or implied, as to the accuracy, completeness, reliability or timeliness of the information provided herein. Any and all information is furnished on an “as is” basis and only as an accommodation to customers and not based upon any legal or contractual obligation to do so. Conclusions drawn from or actions undertaken on the basis of such information are the sole responsibility of the user. Future Electronics and Future Lighting Solutions specifically disclaim any liability or responsibility for any information provided herein or for any loss or damage resulting from the use of or reliance upon any such information.