Embed Size (px)
Citation preview
Slide 1© ABB
Ulrich Spiesshofer, CEO ABB; Eric Elzvik, CFO ABB, April 20th, 2016
Progress in challenging marketsABB 2016 Q1 Results
Slide 2© ABB
Important notices
This presentation includes forward-looking information and statements including statements concerning the outlook for ourbusinesses. These statements are based on current expectations, estimates and projections about the factors that may affectour future performance, including global economic conditions, and the economic conditions of the regions and industries thatare major markets for ABB Ltd. These expectations, estimates and projections are generally identifiable by statementscontaining words such as “expects,” “believes,” “estimates,” “targets,” “plans,” “outlook” or similar expressions.
There are numerous risks and uncertainties, many of which are beyond our control, that could cause our actual results todiffer materially from the forward-looking information and statements made in this presentation and which could affect ourability to achieve any or all of our stated targets. The important factors that could cause such differences include, amongothers:
business risks associated with the volatile global economic environment and political conditions costs associated with compliance activities raw materials availability and prices market acceptance of new products and services changes in governmental regulations and currency exchange rates, and such other factors as may be discussed from time to time in ABB Ltd’s filings with the U.S. Securities and Exchange
Commission, including its Annual Reports on Form 20-F.
Although ABB Ltd believes that its expectations reflected in any such forward-looking statement are based upon reasonableassumptions, it can give no assurance that those expectations will be achieved.
This presentation contains non-GAAP measures of performance. Definitions of these measures and reconciliations between these measures and their US GAAP counterparts can be found in the ‘Supplemental reconciliations and definitions’ section of “Financial Information” under “Financial results & presentations” – “Quarterly results & annual reports” on our website at www.abb.com/investorrelations
April 20, 2016

Slide 3© ABB
Q1 2016 – Progress in challenging markets
April 20, 2016
Next Level Strategy delivers
Business-led Collaboration
Relentless Execution
Profitable Growth
Base orders steady1, total orders -7% reflect challenging Q1-15 comparisonOrder backlog +4%; book-to-bill 1.17x, all divisions >1.0xPIE2 showing positive results mitigating market headwindsStrategic portfolio review of Power Grids on track
Operational EBITA margin up 0.9pts to 12.0%; Op. earnings per share +3%3
White Collar productivity and cost-out measures yielding resultsPower Grids division in target margin corridorCash flow from operating activities up ~$200 mn due to improved working capital mgmt.
New market focused organization in place driving a culture of collaborationCollaborative sales platform, salesforce.com, operational in 86 countriesProven leadership appointed for leading operating model implementation
1Changes in orders, revenues and order backlog are on a comparable basis; 2PIE: Penetration, Innovation, Expansion; 3 Comparable operational EPS growth is in constant currency (2014 exchange rates)

Slide 4© ABB
Q1 2016
1 On a comparable basis; 2 Operational EPS growth is in constant currency (2014 foreign exchange rates)April 20, 2016
Key figures
Orders Base orders Revenues
$9.3 bn-7%1
$7.6 bnsteady1
$7.9 bn-2%1
Operational EPS Cash flow from operating activities
$0.28+3%2
$252 mn+199 mn
Op. EBITA margin
12.0%+0.9 pts.

Slide 5© ABB
Steady base order development
April 20, 2016
Total order growth impacted by high large orders in Q1 2015
2016 Q1 total order growth by region
Canada -9%
China -2%
Germany +5%
India -2%
Italy -1%
Norway +1%
Saudi Arabia +17%
Spain +27%
Sweden +3%
Turkey +24%
UK -11%
US -12%
Change on a comparable basis
2016 Q1 base order growth2
Change on a comparable basis
1AMEA: Asia, Middle East and Africa; 2Selected countries from among ABB’s Top 20 countries by total order volume; PIE: penetration, innovation and expansion
AmericasBase orders
USCanadaBrazil
Total-13%-9%-6%
ChinaIndiaSaudi Arabia
+16%-3%
+11%
EuropeBase orders
GermanyUKSwedenTurkey
Total-19%+34%+8%
+27%-10%
-13%
AMEA1
+6%
-7%
Base orders
Total
+3%
-2%

Slide 6© ABB
Q1 2016 performance by division
April 20, 2016
Key figures
ABB Group Electrification Products
Discrete Automation and Motion
Process Automation
Power Grids
Orders 9.3 2.3 2.3 1.8 3.3
Comparable -7% -4% -6% -17% -8%
Revenues 7.9 2.1 2.1 1.6 2.5
Comparable -2% 0% -5% -3% -2%
Op. EBITA % 12.0% 15.0% 13.2% 12.0% 8.0%
+0.9 pts. -0.2 pts. -1.0 pts. -0.3 pts. +2.1 pts.
$ bnunless otherwise stated

Slide 7© ABB
Op. EBITA margin increased to 12.0%
April 20, 2016
Driving Relentless Execution
11.1% op. EBITA margin
12.0% op. EBITA margin
Net savings
Net volume
OtherProject margins
Mix ForexOp. EBITAQ1 2015
Op. EBITAQ1 2016
943
-50
-26
+43 -58+85
949
0
Operational EBITA bridge Q1 2015 to Q1 2016
$ mn
Slide 8© ABB
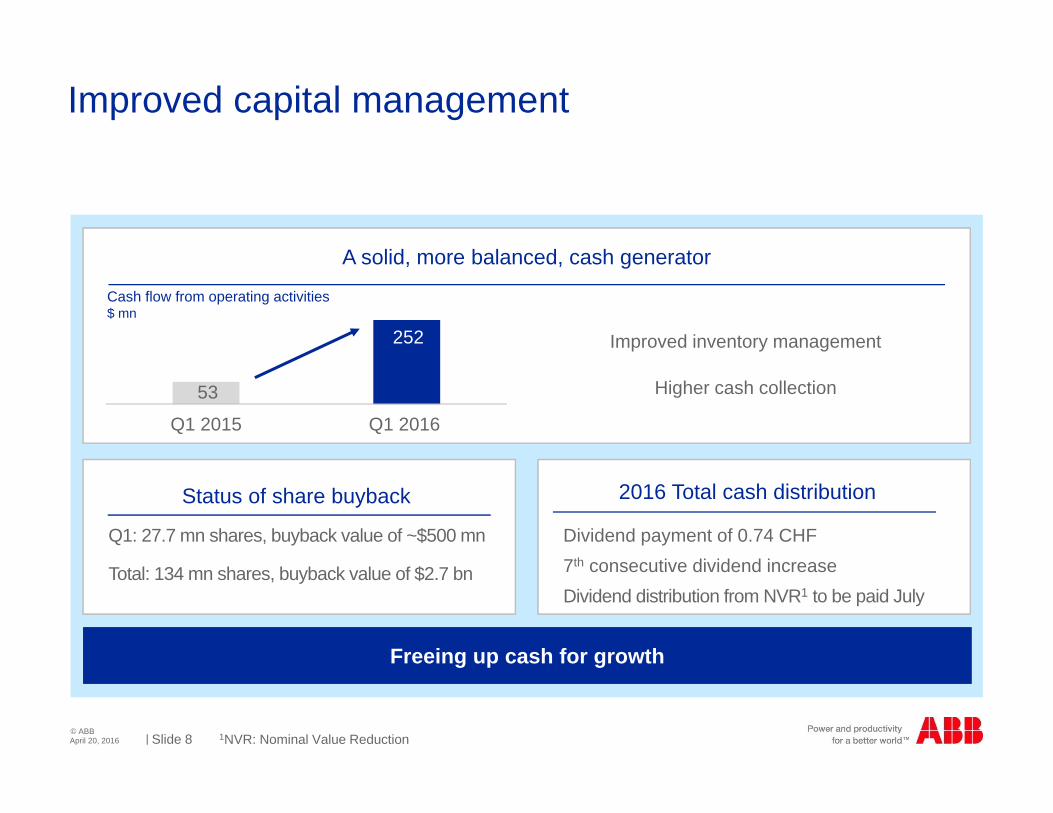
Improved capital management
1NVR: Nominal Value ReductionApril 20, 2016
Improved inventory management
Higher cash collection
Cash flow from operating activities$ mn
Q1 2015 Q1 2016
53
252
Dividend payment of 0.74 CHF7th consecutive dividend increaseDividend distribution from NVR1 to be paid July
Q1: 27.7 mn shares, buyback value of ~$500 mn
Total: 134 mn shares, buyback value of $2.7 bn
2016 Total cash distributionStatus of share buyback
Freeing up cash for growth Freeing up cash for growth
A solid, more balanced, cash generator
Slide 9© ABB
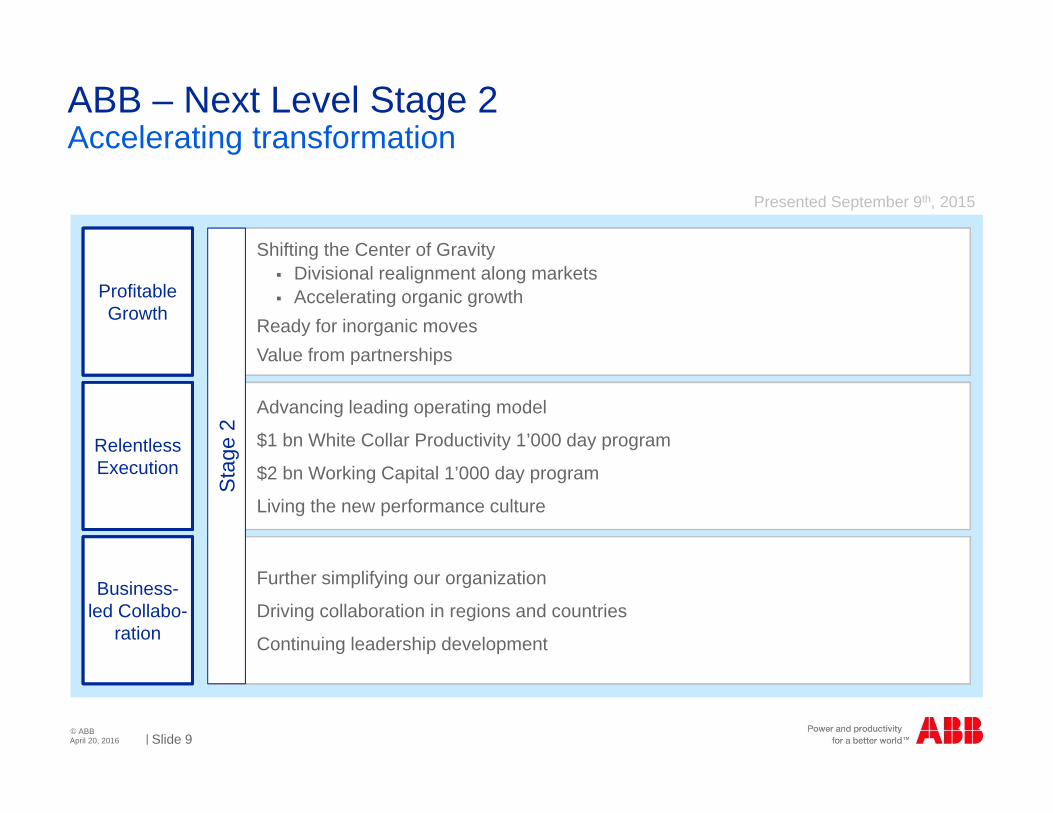
Further simplifying our organization
Driving collaboration in regions and countries
Continuing leadership development
Shifting the Center of Gravity Divisional realignment along markets Accelerating organic growth
Ready for inorganic movesValue from partnerships
Advancing leading operating model
$1 bn White Collar Productivity 1’000 day program
$2 bn Working Capital 1’000 day program
Living the new performance culture
ABB – Next Level Stage 2
April 20, 2016
Accelerating transformation
Profitable Growth
Relentless Execution
Business-led Collabo-
ration
Sta
ge 2
Presented September 9th, 2015

Slide 10© ABB
Q1 2016: Profitable Growth
April 20, 2016
Shifting the Center of Gravity – strengthening competitiveness
Relentless Execution
Business-led
Collabo-ration
Power & Automation “for the grid” Power & Automation “for the site”
First digital substation in the UK for SP Energy Networks
Container terminal automation for APM Terminals Maasvlakte 2 Terminal
1IoTSP: Internet of Things, Services and People
IoTSP1
Digitalization
Customer value: Integration of renewables, improved
control, safety, reduced maintenance cost
Customer value: Safer, greener and more productive
container terminal operations
Examples
Profitable Growth

Slide 11© ABB
Q1 2016: Profitable Growth
April 20, 2016
Profitable Growth
Relentless Execution
Business-led
Collabo-ration
Examples
Shifting the Center of Gravity – driving organic growth
PIE
6% base order growth
Large orders wins
Organizational realignment yielding results
Smart sensing solutions at Hannover Fair
Enable remote monitoring of motors
Increased uptime and energy efficiency
Dynamic AC concept for cruise ships
Reduce annual fuel consumption up to 6%
Pene
trat
ion
Inno
vatio
nEx
pans
ion
Europe
Smart devices
Electrical power systems
Slide 12© ABBApril 20, 2016
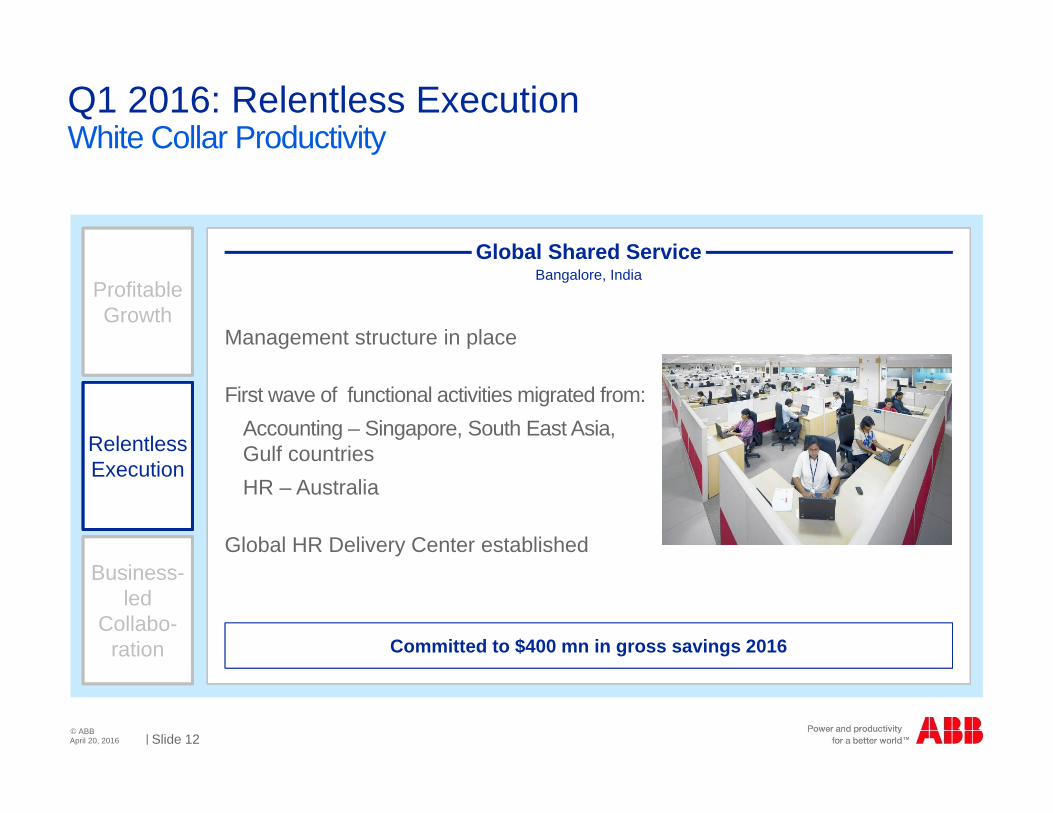
White Collar ProductivityQ1 2016: Relentless Execution
Profitable Growth
Relentless Execution
Business-led
Collabo-ration
Management structure in place
First wave of functional activities migrated from: Accounting – Singapore, South East Asia, Gulf countriesHR – Australia
Global HR Delivery Center established
Global Shared ServiceBangalore, India
Committed to $400 mn in gross savings 2016

Slide 13© ABBApril 20, 2016
Working Capital improvements drove improved cash flowQ1 2016: Relentless Execution
Profitable Growth
Relentless Execution
Business-led
Collabo-ration
Q1 2015 Q1 2016
5.3
6.0
$ bn
Freeing up approx. $600 mn in cash for growth in last twelve months
NWC Approach

Slide 14© ABB
Q1 2016: Business-led Collaboration
April 20, 2016
Divisional realignment seeing initial results
Profitable Growth
Relentless Execution
Business-led
Collabo-ration
Electrification ProductsPower Grids
One stop shop for electrification
Common channel management with distributors
Ease of business and increased speed
Single face to customers
Internal collaboration
Operational synergies in SCM, engineering and R&D

Slide 15© ABB
Q1 2016 summary and outlook
1Constant currencyApril 20, 2016
Mixed short-term picture, uncertainty remains
Modest growth in Europe, slower growth in China; Continued market growth in US
Oil price effects to continue
Long-term demand outlook remains positive –growth drivers in place for utility, industry, transportation & infrastructure
Profitability and cash flow up through execution of Next Level Strategy
Base orders steady; total orders reflect challenging Q1 comparison; book to bill 1.17x
Revenues -2% on short cycle volumes and timing of order backlog
Op. EBITA margin up 0.9 pts. to 12.0%
Power Grids margin in target corridor, strategic portfolio review on track
Op. earnings per share +3%1
Cash flow from operating activities up ~$200 mn
Q1 results Outlook
ABB Capital Markets Day October 4, 2016ABB Capital Markets Day October 4, 2016
Slide 16© ABB
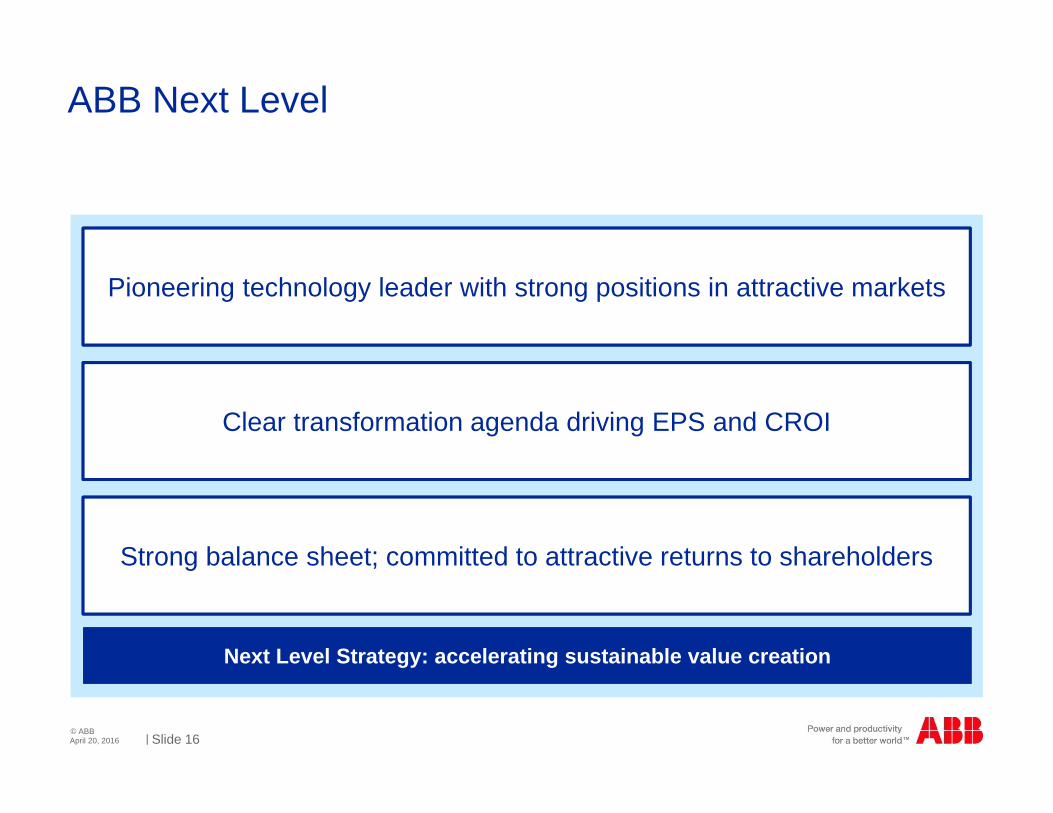
ABB Next Level
April 20, 2016
Strong balance sheet; committed to attractive returns to shareholders
Pioneering technology leader with strong positions in attractive markets
Clear transformation agenda driving EPS and CROI
Next Level Strategy: accelerating sustainable value creationNext Level Strategy: accelerating sustainable value creation


Slide 18© ABB
Key figures Q1 2016
1Calculated before roundingApril 20, 2016
Q1 16 Q1 15 Change$ mn unless otherwise indicated $ Local currency Comparable
Orders 9,253 10,404 -11% -7% -7%
Order backlog (end March) 25,978 25,491 +2% +2% +4%
Revenues 7,903 8,555 -8% -3% -2%
Operational EBITA 943 949 -1% +2% +2%
as % of operational revenues 12.0% 11.1% +0.9 pts
Income from operations 784 859 -9%
as % of revenues 10.0% 10.0% 0 pts
Net income 500 564 -11%
Basic earnings per share ($) 0.23 0.25 -9%1
Cash flow from operating activities 252 53 +199

Slide 19© ABB
Order backlog by division
April 20, 2016
Q1 2016 Q1 2015 Change %Order backlog (end March)$ mn $ Comparable
Electrification Products 3,168 3,027 +5% +7%
Discrete Automation and Motion 4,619 4,596 +1% +1%
Process Automation 6,392 6,643 -4% -4%
Power Grids 13,787 13,076 +5% +10%
Corporate and Other(incl. Inter-division eliminations) (1,988) (1,851)
Total Group 25,978 25,491 +2% +4%

Slide 20© ABB
Third party base orders by division
April 20, 2016
Q1 2016 Q1 2015 Change%Third-party base orders$ mn Comparable
Electrification Products 2,181 2,347 -2%
Discrete Automation and Motion 2,021 2,204 -5%
Process Automation 1,403 1,508 -2%
Power Grids 2,024 1,957 +9%
Corporate and other 13 19
Total Group 7,642 8,035 +0%

Slide 21© ABB
Cash flow from operating activities by division
April 20, 2016
Q1 2016 Q1 2015 Change %Cash flow from operating activities$ mn $
Electrification Products 33 56 -41%
Discrete Automation and Motion 114 182 -37%
Process Automation 48 21 +129%
Power Grids 83 (122) n.a.
Corporate and other (26) (84)
Total Group 252 53 $199

Slide 22© ABB
Operational EPS analysis
April 20, 2016
Q1 2016 Q1 2015
mn $, except per share data in $ EPS1 EPS1 2
Net income (attributable to ABB) 500 0.23 564 0.25 -9%
Restructuring and restructuring-related expenses3 (including WCP implementation costs) 51 0.02 19 0.01
Gains and losses on sale of businesses, acquisition-related expenses and certain non-operational items4 2 0.00 8 0.00
FX/commodity timing differences in income from operations3 11 0.01 (21) (0.01)
Acquisition–related amortization3 51 0.02 59 0.03
Operational net income / Operational EPS 615 0.28 629 0.28 +3%5
1EPS amounts are computed individually, therefore the sum of the per share amounts may not equal to the total; 2Calculated on earnings per share before rounding; 3Net of tax at the Adjusted Group effective tax rate; 4Net of tax at the Adjusted Group effective tax rate, except for gains and losses on sale of businesses and certain other non-operational items, which are net of the actual related provision for taxes; 5Operational EPS growth rate is in constant currency (2014 foreign exchange rates)

Slide 23© ABB
Regional share of total orders and revenues by division
April 20, 2016
Q1 2016
Electricfication Products
Discrete Automation and
Motion
Process Automation
Power Grids
Ord
ers
Rev
enue
s
36% 38%
26%
35%38%
27%
31% 38%
31%
35%48%
17%
44%35%
21%
31% 34%
35%
44% 34%
22%
41% 31%
28%
Europe Americas Asia, Middle East and Africa

Slide 24© ABB
Electrification Products
In $ mn, y-o-y change comparableApril 20, 2016
Q1 2016O
rder
sR
even
ues
Op.
EB
ITA
&
mar
gin
Q1 15 Q1 16
Q1 15 Q1 16
Q1 15 Q1 16
-4%
0%
15.0%
2,555 2,327
2,229 2,125
340 318
15.2%
Order declines in US, China and Brazil were partially offset by growth in Europe
Medium Voltage products business was affected by weaker industrial demand
Revenues were steady compared to the same quarter a year ago
Operational EBITA margin impacted by unfavorable mix
Actions to address capacity and geographic shift in demand were implemented in the quarter

Slide 25© ABB
Discrete Automation & Motion
In $ mn, y-o-y change comparableApril 20, 2016
Q1 2016O
rder
sR
even
ues
Op.
EB
ITA
&
mar
gin
Q1 15 Q1 16
Q1 15 Q1 16
Q1 15 Q1 16
-6%
-5%
13.2%
2,569 2,317
2,271 2,079
318 274
14.2%
Total orders were lower due to weaker demand in oil and gas, minerals and mining
Strong orders for robotics in Europe could not compensate lower orders in US and China
Revenues were lower on short-cycle business as well as the timing of the order backlog
Operational EBITA margin decreased as a result of lower volumes and capacity utilization
Initial results of capacity and productivity measures are starting to drive profitability

Slide 26© ABB
Process Automation
In $ mn, y-o-y change comparableApril 20, 2016
Q1 2016O
rder
sR
even
ues
Op.
EB
ITA
&
mar
gin
Q1 15 Q1 16
Q1 15 Q1 16
Q1 15 Q1 16
Total orders declined due to the substantial large order decline resulting from lower spending in process industries, primarily in oil and gas and related sectors
Revenues were lower as steady performance in service revenues and marine business partially offset the decrease in discretionary spending in the oil and gas sector
Operational EBITA margin was lower in the quarter due to an unfavorable mix
Partly offset by cost out and productivity measures
-17%
-3%
12.0%
2,272 1,784
1,764 1,621
216 196
12.3%

Slide 27© ABB
Power Grids
In $ mn, y-o-y change comparableApril 20, 2016
Q1 2016O
rder
sR
even
ues
Op.
EB
ITA
&
mar
gin
Q1 15 Q1 16
Q1 15 Q1 16
Q1 15 Q1 16
-8%
-2%
8.0%
3,741 3,307
2,772 2,518
164 199
5.9%
Solid large and third party base order intake in the quarter could not compensate the exceptionally large Nordlink HVDC order in the prior year
Revenues were slightly lower reflecting the timing of project milestones
The operational EBITA margin was significantly higher as a result of ongoing ‘step change’ efforts, improvements in project margins and continued cost out measures

Slide 28© ABB
2015-2020 targets
September 9, 2015
Group targets and divisional Operational EBITA margin targets effective January 2016
Group
Revenue growth1 3-6%
Operational EBITA %2 11-16%
Operational EPS CAGR3 10-15%
FCF conversion to net income >90%
CROI %4 Mid-teens
Divisions
Electrification Products 15-19%
Discrete Automation and Motion 14-19%
Process Automation 11-15%
Power Grids 8-12%
1Average annual revenue growth on a like-for-like basis over 6 years, base year 2014;2Target is on a full-year basis; 3CAGR = Compound annual growth rate, base year is 2014 and assuming constant exchange rates; 4Temporary reduction possible in the event of larger acquisitions
Slide 29© ABB
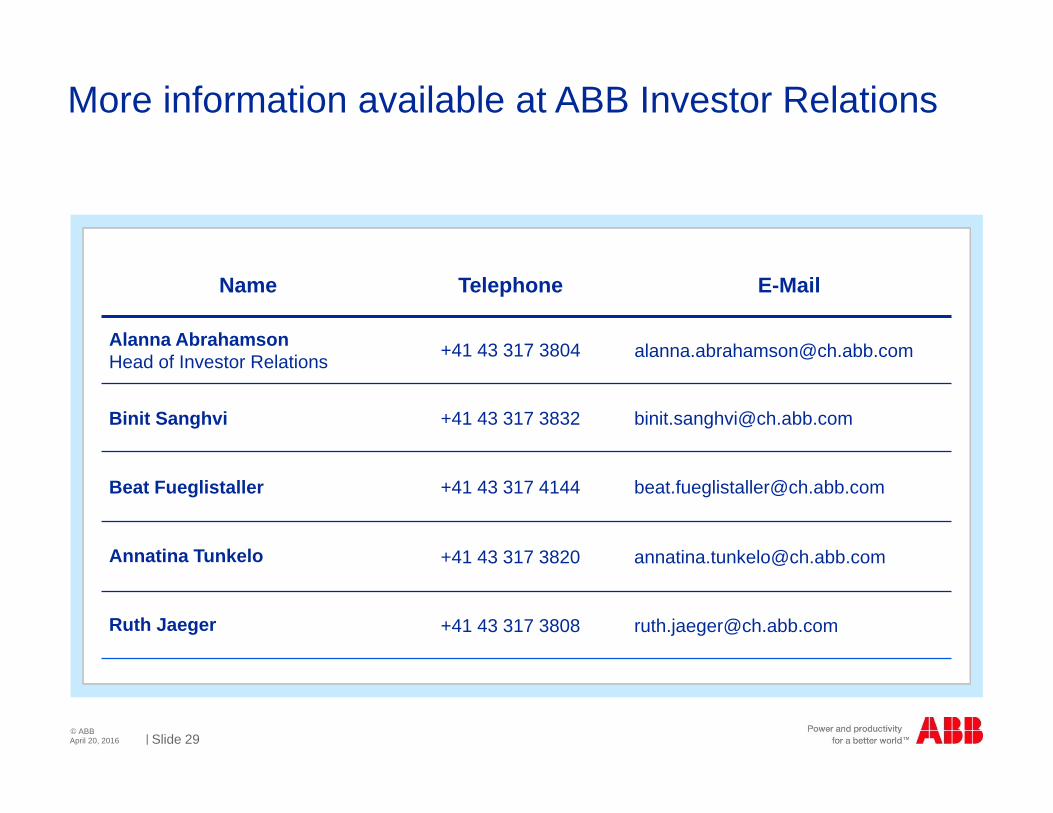
More information available at ABB Investor Relations
April 20, 2016
Name Telephone E-Mail
Alanna AbrahamsonHead of Investor Relations +41 43 317 3804 [email protected]
Binit Sanghvi +41 43 317 3832 [email protected]
Beat Fueglistaller +41 43 317 4144 [email protected]
Annatina Tunkelo +41 43 317 3820 [email protected]
Ruth Jaeger +41 43 317 3808 [email protected]