Embed Size (px)
Citation preview

11th Global Conference of Actuaries
ULIPS IN THE INDIAN INSURANCE INDUSTRY:STATUS, CHALLENGES AND THE WAY FORWARD
D N K L N K Chakravarthi In The Present Times We Are Witnessing A Serious Global Financial Crisis And Economic Meltdown Which Started With The Bankruptcy Of Lehman Brother’s(USA). The Stock Markets Across The World Are Witnessing A Severe Fall And The Indian Stock Market Is No Exception. The Domestic Stock Market Has Been Extremely Volatile During The Last Few Months Leading To Growing Concern About Wealth Erosion. On The Insurance Front , The ULIP, Which Has Been Torch Bearer In Terms Of Business And Customer Attraction For The Last Few Years, Is At The Receiving End Which Is Obviously Because Of Its Huge Exposure To Equity Market When Compared With The Conventional Business. This Paper Focuses On The Growth Of The ULIP Business In The Country Together With Some Comparisons Amongst The Insurers Operating In The Country And Also The Prospects Of ULIP Business In The Indian Insurance Industry. The Paper Is Structured Into Following Sections:
Brief Introduction About The Unit Linked Product Growth Of Unit Linked Business In India (Overall & New Business) Unit Linked Single Premium Business Surrenders Lapses Investment Mathematical Reserve Guarantees Road Ahead
For The Above Purpose, Data Of 18 Companies Was Considered Which was Later Divided Into 3 Groups. In Most Of The Places, The Data Refers To Individual Buisness. Brief Introduction About The Unit Linked Product: A Unit Linked Product Is Typically A Combination Of Risk Cover And An Investment Where The Policyholder Bears The Investment Risk. The Unit Linked Policy Has Provided An Alternative To The Conventional Policies To Both Insurer Who Are Finding It Increasingly Difficult To Meet The Guaranteed Benefits On Their Traditional Policies And The Policyholder Who Is In Pursuit Of Higher Real Returns. The Dynamics Of The Capital Market Have A Direct Bearing On The Performance Of The Ulips. Key Advantages To The Insurer And The Policyholder: Policyholder
• Transparency And Flexibility • Direct Participation In The Asset Management • Expected Higher Return Than A Conventional Policy Apart From Life Cover
Insurer • Shift Of Investment Risk To The Policyholder
Page 1 of 31

11th Global Conference of Actuaries
• Less Capital Absorbance (Less Solvency Capital) And Hence Very Capital Efficient Growth Of Unit Linked Business In India: India Has Seen A Tremendous Growth On The Unit Linked Front Over The Recent Years. The Growth Has Been Fuelled By The Booming Stock Markets & Lower Interest Rates. Before The Introduction Of The Unit Linked Product, The Prospects/Policyholders Who Are Interested In Investing In Stock Markets Either Had To Purchase The Stocks On Their Own In The Primary/Secondary Or Invest In Mutual Funds. With The Introduction Of The Unit Linked Product , The Prospect Has An Option To Invest In The Stock Market Via Purchase Of A Unit Linked Life Insurance Policy In Addition To The Life Insurance Cover. A Unit Linked Policy Scores Over Mutual Fund Via Tax Advantages And Life Cover(Now Sips Can Offer Life Cover As Per Recent SEBI Guidelines). Also, As Per The Recent SEBI Guidelines Exits Under Closed Ended Schemes Are Not Permitted. The Graphs Below Shows Group-Wise Comparison Of Unit Linked And Non-Linked Products And Their Contribution To The Total Premium In The Year 2008.. It Is Also Interesting To Note That Even Though Group-1 & 2 Have Almost Same Number Of Linked Products, The Contribution Of Group 1(83.82%) Is Much Higher Than The Contribution Of Group 2(12.02%) To The Total Linked Premium.
Group-wise comparision of products (Linked vs NonLinked)
0
100
200
300
400
500
Group
Num
ber o
f pro
duct
s
Linked
Non-linked
Linked 122 114 82 318
Non-linked 174 133 128 435
Group 1 Group 2 Group 3 Industry
As Per The Graph Below, Group 1 Which Has 16.2% Linked & 23.1% Non-Linked Of The Total Products Contribute 38.64% & 52.54% Respectively To The Total Premium Which Sums To 91.18% Of The Total Premium. It Is Also Observed That Linked Business Is A Major Contributor To The Total Premium For Most(15) Of The Companies
Page 2 of 31

11th Global Conference of Actuaries
Group-wise contribution of L/NL as a % of the total products to the Total Premium
0.00%
20.00%
40.00%
60.00%
Linked/Non-Linked
% o
f L/N
L pr
oduc
ts
Group 1
Group 2
Group 3
Group 1 16.20% 38.64% 23.11% 52.54%
Group 2 15.14% 5.54% 17.66% 0.97%
Group 3 10.89% 1.92% 17.00% 0.39%
Linked Non-Linked
Growth Of Unit Linked Business In India The Next Few Pages Discuss About The Overall Growth Including The New Business Growth Of The Unit-Linked Business In India And A Comparison Is Made With Non-Linked Business Wherever Relevant. Overall Growth Policy-Wise The Unit-Linked Business, In Respect Of The Industry As A Whole, Which Was 4%(96% For Non-Linked) Of The Total Policies In The Year 2006 Grew To 21.76%(Non-Linked Fell To 78.24%) In The Year 2008. The Graph Below Shows How The Unit Linked Policies Progressed Policy Wise (Year On Year) Across Groups. As Can Be Seen From The Graph, Group 1 Is A Major Contributor To The Total Number Policies In Both Linked & Non-Linked Business. However, Group 1’s Share In The Of Total Linked Policies Increased In The Year 2006-07 But Has Decreased Marginally In The Year 2007-08 While Group’s 2 & 3 Has Shown The Reverse Trend. It Is Important To Note That Groups 1 & 2 Have Minimum Exposure To Non-Linked Business On The Policy Count And Almost The Total Business Comes From Group 1. It Is Also Observed That Linked Business Is A Major Contributor To The Total Policies For Most(13) Of The Companies In The Year 2008.
Page 3 of 31

11th Global Conference of Actuaries
Contribution of the groups to the total L/NL policies
0.00%
20.00%
40.00%
60.00%
80.00%
100.00%
Linked/Non-Linked
Perc
enat
ge o
f L/N
L po
licie
s
Group 1
Group 2
Group 3
Group 1 85.17% 99.01% 91.09% 98.74% 90.09% 98.53%
Group 2 12.75% 0.73% 7.05% 0.94% 7.47% 1.11%
Group 3 2.08% 0.26% 1.86% 0.32% 2.45% 0.36%
L NL L NL L NL
2005-06 2006-07 2007-08
Sum Assured-Wise The Unit-Linked Business, In Respect Of The Industry As A Whole, Which Was 7.1%(92.9% For Non-Linked) Of The Total SA In The Year 2006 Grew To 28.68%(Non-Linked Fell To 71.32%) In The Year 2008. The Graph Below Shows How The Unit Linked Business Progressed SA Wise (Year On Year) Across Groups. As Can Be Seen From The Graph, Group 1 Is A Major Contributor To The Total SA In Both Linked & Non-Linked Business. The Share Of Group 1 Which Was 60.09% Of The Total Linked SA In The Year 2006 Grew To 72.83% In The Year 2008 While The Shares Of Groups 1 & 2 Which Were 32.35% & 7.56% Fell To 19.65% & 7.53% Respectively. It Is Also Observed That Linked Business Is A Major Contributor To The Total SA For Most(14) Of The Companies In The Year 2008.
Page 4 of 31

11th Global Conference of Actuaries
Contribution of the groups to the total L/NL SA
0.00%
20.00%
40.00%
60.00%
80.00%
100.00%
Linked/Non-linked
Perc
enat
ge o
f L/N
L SA
Group 1
Group 2
Group 3
Group 1 60.09% 96.34% 72.87% 95.71% 72.83% 95.37%
Group 2 32.35% 2.55% 20.81% 3.08% 19.65% 3.36%
Group 3 7.56% 1.11% 6.32% 1.21% 7.53% 1.27%
L NL L NL L NL
2005-06 2006-07 2007-08
Premium –Wise The Unit-Linked Business, In Respect Of The Industry As A Whole, Which Was 20.36%(79.34% For Non-Linked) Of The Total Premium In The Year 2006 Grew To 46.1%(Non-Linked Fell To 53.9%) In The Year 2008. The Graph Below Shows How The Unit Linked Business Progressed Premium Wise (Year On Year) Across Groups. As Can Be Seen From The Graph, Group 1 Is A Major Contributor To The Total Premium In Both Linked & Non-Linked Business. The Share Of Group 1 Which Was 84.91% Of The Total Linked Premium In The Year 2006 Fell Marginally To 83.82% In The Year 2008 While The Shares Of Groups 1 & 2 Which Were 11.52% & 3.57% Grew To 12.02% & 4.16% Respectively. It Is Also Observed That Linked Business Is A Major Contributor To The Total Premium For Most(15) Of The Companies In The Year 2008.
Page 5 of 31

11th Global Conference of Actuaries
Contribution of groups to total L/NL premiums
0.00%
20.00%
40.00%
60.00%
80.00%
100.00%
Perc
enta
ge o
f L/N
L pr
emiu
ms
Group 1
Group 2
Group 3
Group 1 84.91% 97.87% 87.80% 97.70% 83.82% 97.47%
Group 2 11.52% 1.51% 9.09% 1.61% 12.02% 1.80%
Group 3 3.57% 0.62% 3.12% 0.69% 4.16% 0.73%
L NL L NL L NL
2005-06 2006-07 2007-08
Percentage of the total premium for the Industry(Linked vs Non-Linked)
0.00%
20.00%
40.00%
60.00%
80.00%
100.00%
Year
Perc
enta
ge
Linked
Non-Linked
Linked 20.36% 35.31% 46.10%
Non-Linked 79.64% 64.69% 53.90%
2005-06 2006-07 2007-08
New-Business Growth: The Graphs Below Shows The New Business Progression Of The Unit Linked Business Across The Groups On All The 3 Counts. As Can Be Seen From The Graphs Below, The New Business Volumes As A Percentage Of The Total Linked & Non-Linked Business Has Substantially Increased With The Year 2007 Witnessing A Huge Increase On All The 3 Counts (Premium,SA,Policies).
Page 6 of 31

11th Global Conference of Actuaries
Policy-Wise
Contribution of the groups to the total L/NL new policies
0.00%
20.00%
40.00%
60.00%
80.00%
100.00%
Linked/Non-Linked
Perc
enta
ge o
f L/N
L ne
w p
olic
ies
Group 1
Group 2
Group 3
Group 1 84.73% 97.01% 92.92% 94.98% 88.05% 94.68%
Group 2 12.30% 2.24% 5.33% 3.92% 8.79% 4.12%
Group 3 2.97% 0.75% 1.74% 1.10% 3.16% 1.19%
L NL L NL L NL
2005-06 2006-07 2007-08
As Per The Above Graph, The Shares Of Group 1 & 3 Which Were 84.73%& 2.97% Of The Total New Linked Policies In The Year 2006 Grew To 88.05% & 3.16% In The Year 2008 While The Share Of Groups 2 Which Were 12.3% Fell To 8.79%. It Is Also Observed That Linked Business Is A Major Contributor To The Total New Premium For Most(16) Of The Companies In The Year 2008. SA-Wise
Contribution of the groups to the total L/NL new SA
0.00%
20.00%
40.00%
60.00%
80.00%
100.00%
Linked/Non-Linked
Perc
enta
ge o
f L/N
L ne
wSA
Group 1
Group 2
Group 3
Group 1 63.66% 94.15% 77.74% 91.45% 69.08% 92.19%
Group 2 26.03% 4.32% 15.76% 6.64% 20.53% 5.93%
Group 3 10.31% 1.53% 6.50% 1.91% 10.40% 1.88%
L NL L NL L NL
2005-06 2006-07 2007-08
Page 7 of 31

11th Global Conference of Actuaries
As Per The Above Graph, The Shares Of Group 1 & 3 Which Were 63.66%& 10.31% Of The Total New Linked Policies In The Year 2006 Grew To 69.08% & 10.4% In The Year 2008 While The Share Of Groups 2 Which Was 26.03% Fell To 20.53%. The Same Trend Is Observed Policy-Wise Also. It Is Also Observed That Linked Business Is A Major Contributor To The Total New SA For Most(15) Of The Companies In The Year 2008. Premium-Wise
Contribution of the groups to the total L/NL new premium
0.00%
20.00%
40.00%
60.00%
80.00%
100.00%
Linked/Non-Linked
Perc
enta
ge o
f L/N
L ne
w p
rem
ium
Group 1
Group 2
Group 3
Group 1 86.12% 95.81% 89.22% 96.43% 85.47% 94.19%
Group 2 9.89% 2.98% 7.56% 2.61% 10.35% 4.19%
Group 3 4.00% 1.20% 3.23% 0.95% 4.18% 1.62%
L NL L NL L NL
2005-06 2006-07 2007-08
As Per The Above Graph, The Share Of Group 1 Which Were 86.12% Of The Total New Linked Policies In The Year 2006 Fell To 85.47% In The Year 2008 While The Shares Of Groups 2 & 3 Which Were 9.89% & 4% Grew To 10.35% & 4.18%. It Is Also Observed That Linked Business Is A Major Contributor To The Total New SA For Most(17) Of The Companies In The Year 2008. The Graph Below Shows The New Business Progression On The Premium Count For The Entire Industry Both For Linked & Non-Linked Business. As Can Be Seen From The Graph, The Linked Premium Income Which Was 50.41% As % Of The Total New Business Premium In The Year 2006 Grew To 86.23% By The Year 2008 Indicating The Growing Popularity Of The Unit Linked Business In The Country. At The Same Time, The % Of Non-Linked Total New Premium Declined Year On Year.
Page 8 of 31

11th Global Conference of Actuaries
Percentage of the total new premium(Linked vs Non-linked)
0.00%
20.00%
40.00%
60.00%
80.00%
100.00%
Year
Perc
enta
ge
Linked
Non-Linked
Linked 50.41% 67.83% 86.23%
Non-Linked 49.59% 32.17% 13.77%
2005-06 2006-07 2007-08
Group-Wise Of Linked And Non-Linked Portfolio On All The 3 Counts(Over All) The Graphs Below Shows The Portfolio Of Linked & Non-Linked Business On All The 3 Counts Across The Groups And For The Industry As Well. Portfolio( Policy-Wise)- As Per The Graph Below,Group 1 Has 80:20 (Non-Linked To Linked) Portfolio , Groups 2 & 3 Almost Have A Similar Portfolio Of 35:65 With The Industry As A Whole Having A Portfolio Of 78:22. Amongst The Companies, If We Assume 85% As The Benchmark For Linked/Non-Linked Business On Policy Count, 4 Companies Have Exceeded The Benchmark On The Linked Count And 1 On Non-Linked Count.
Group-wise portfolio of Total Policies(Linked vs Non-Linked)
0%
20%
40%
60%
80%
100%
Year
Perc
enta
ge o
f Tot
al P
olic
ies
Industry
Group 3
Group 2
Group 1
Industry 3.75% 96.25% 12.68% 87.32% 21.76% 78.24%
Group 3 23.62% 76.38% 45.82% 54.18% 65.30% 34.70%
Group 2 40.62% 59.38% 52.15% 47.85% 65.24% 34.76%
Group 1 3.25% 96.75% 11.81% 88.19% 20.27% 79.73%
Linked Non-LinkedLinked Non-LinkedLinked Non-Linked
2005-06 2006-07 2007-08
Page 9 of 31

11th Global Conference of Actuaries
Portfolio( SA-Wise)- As Per The Graph Below , Group 1 Has 77:24 (Non-Linked To Linked) Portfolio , Groups 2 & 3 Almost Have A Similar Portfolio Of 30:70 With The Industry As A Whole Having A Portfolio Of 71:29. Amongst The Companies, If We Assume 85% As The Benchmark For Linked/Non-Linked Business On SA Count, 4 Companies Have Exceeded The Benchmark On The Linked Count And 2 On The Non-Linked Count.
Group-wise portfolio of Total SA(Linked vs Non-Linked)
0%
20%
40%
60%
80%
100%
Year
Perc
enta
ge o
f Tot
al S
A
Industry
Group 3
Group 2
Group 1
Industry 7.10% 92.90% 18.10% 81.90% 28.68% 71.32%
Group 3 34.30% 65.70% 53.57% 46.43% 70.47% 29.53%
Group 2 49.19% 50.81% 59.89% 40.11% 70.14% 29.86%
Group 1 4.55% 95.45% 14.40% 85.60% 23.49% 76.51%
Linked Non-LinkedLinked Non-LinkedLinked Non-Linked
2005-06 2006-07 2007-08
Portfolio( Premium-wise)- As Per The Graph Below , Group 1 Has 58:42 (Non-Linked To Linked) Portfolio , Groups 2 Has A 15:85 & Group 3 Has A Portfolio Of 17:83 With The Industry As A Whole Having A Portfolio Of 54:46. Amongst The Companies, If We Assume 85% As The Benchmark For Linked/Non-Linked Business On SA Count, 9 Companies Have Exceeded The Benchmark On The Linked Count And 2 On The Non-Linked Count.
Page 10 of 31

11th Global Conference of Actuaries
Group-wise portfolio of Total Premium(Linked vs Non-Linked)
0%
20%
40%
60%
80%
100%
Year
Perc
enta
ge o
f Tot
al P
rem
ium
Industry
Group 3
Group 2
Group 1
Industry 20.36% 79.64% 35.31% 64.69% 46.10% 53.90%
Group 3 59.59% 40.41% 71.02% 28.98% 82.98% 17.02%
Group 2 66.13% 33.87% 75.52% 24.48% 85.07% 14.93%
Group 1 18.15% 81.85% 32.91% 67.09% 42.38% 57.62%
Linked Non-LinkedLinked Non-LinkedLinked Non-Linked
2005-06 2006-07 2007-08
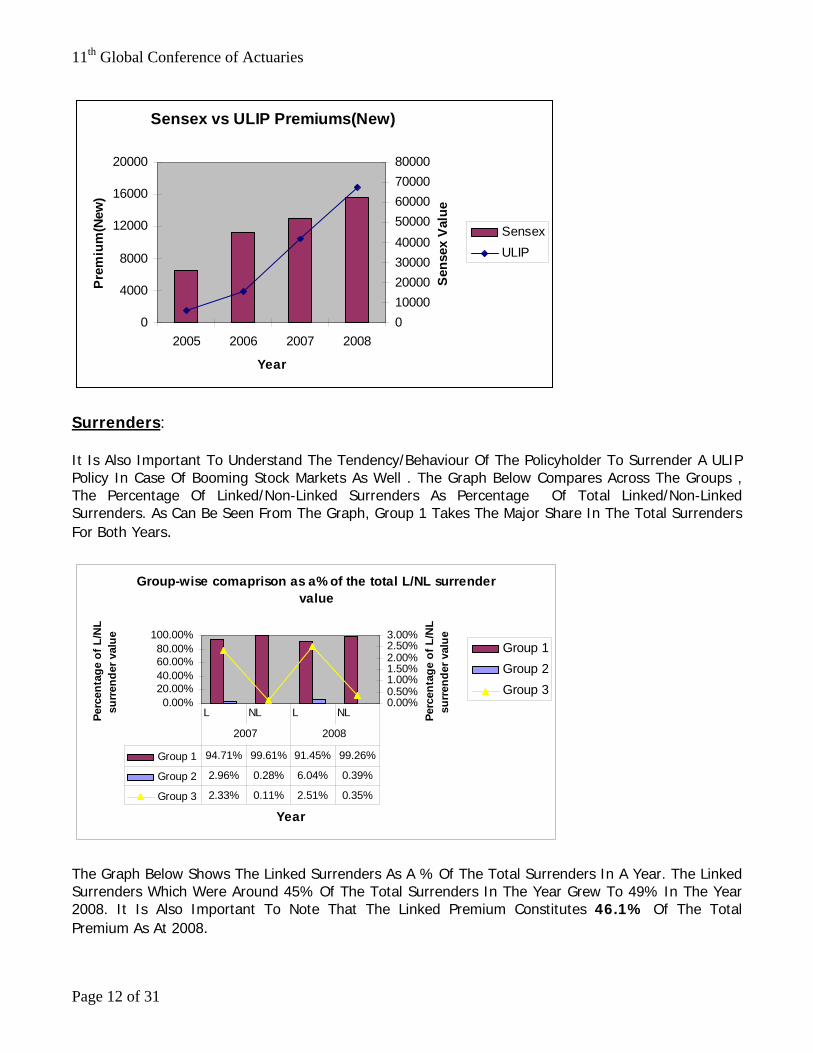
Critical Areas: Unit Linked Single Premium Business As Can Be Seen From The Graphs, The Unit Linked New Single Premium Shares A Decisive Portion Both In Terms Of Number Of Policies And Premium Amount, Which Also Boosted The Unit Linked Sales In India. This May Be Because That The Investors May Be Viewing The Unit Linked Policy As A More Of Investment Than A Protection Product. As Much As 42% Of The Total New Linked Premium In The Year 2008 Has Come From The Single Premium Mode. At The Same Time, We Have To Note That The Above Policies Are Particularly Sensitive And Also Perhaps Correlated With The Movements In The Stock Markets. The Graph Below Between Sensex/Nifty Vs ULIP Sales Which Shows A Positive Correlation Of Around 1 Supports Our Above Argument. The Indian Stock Market Has Witnessed A Fall Of More Than 50% During The Last 3 Months. Just As The Investors May Want To Book Profits In A Booming Stock Market , They May As Well Want To Limit Their Losses When Markets Decline. This May Also Be The Case With The Unit Linked Single Premium Business With Huge Exposure To Stock Markets Business As The Policyholders May Also Surrender Their Policies To Limit The Losses Or If They Are In Urgent Financial Need, Which In Turn May Effect The New Business As Well. This Is Clearly Evident From The Fact That The Single Premium Unit Linked Business (On The Premium Count) Has Already Shown A Negative Growth Of 17% As At Sep’08 When Compared With The Last Year’s Business. The Traditional Business Scores Here As There May Not Be A Wealth Erosion As Is With A Unit Linked Policy(Perhaps May Effect The Bonus Under A Participating Policy) In Case Of Falling Stock Markets.
Page 11 of 31
11th Global Conference of Actuaries
Sensex vs ULIP Premiums(New)
0
4000
8000
12000
16000
20000
2005 2006 2007 2008
Year
Pre
miu
m(N
ew)
01000020000300004000050000600007000080000
Sens
ex V
alue
SensexULIP
Surrenders: It Is Also Important To Understand The Tendency/Behaviour Of The Policyholder To Surrender A ULIP Policy In Case Of Booming Stock Markets As Well . The Graph Below Compares Across The Groups , The Percentage Of Linked/Non-Linked Surrenders As Percentage Of Total Linked/Non-Linked Surrenders. As Can Be Seen From The Graph, Group 1 Takes The Major Share In The Total Surrenders For Both Years.
Group-wise comaprison as a% of the total L/NL surrender value
0.00%20.00%40.00%60.00%80.00%
100.00%
Year
Perc
enta
ge o
f L/N
L su
rren
der v
alue
0.00%0.50%1.00%1.50%2.00%2.50%3.00%
Perc
enta
ge o
f L/N
L su
rren
der v
alue Group 1
Group 2Group 3
Group 1 94.71% 99.61% 91.45% 99.26%
Group 2 2.96% 0.28% 6.04% 0.39%
Group 3 2.33% 0.11% 2.51% 0.35%
L NL L NL
2007 2008
The Graph Below Shows The Linked Surrenders As A % Of The Total Surrenders In A Year. The Linked Surrenders Which Were Around 45% Of The Total Surrenders In The Year Grew To 49% In The Year 2008. It Is Also Important To Note That The Linked Premium Constitutes 46.1% Of The Total Premium As At 2008.
Page 12 of 31

11th Global Conference of Actuaries
Linked Surrenders as a % of the total surrenders for the Industry
0.00%
20.00%
40.00%
60.00%
80.00%
100.00%
Year
perc
enta
ge o
f the
link
ed
surr
ende
rs
Linked Surrenders
LinkedSurrenders
45.43% 48.99%
2007 2008
Amongst The Companies, In Case Of 15 Companies, Linked Surrenders Takes The Major Portion Of The Total Surrenders And 3 Vice-Varsa. The Graph Below Compares The Group-Wise Linked Surrenders As A % Of The Total Linked Premium And For The Industry As Well.
Linked surreders as a % of the Total Linked Premium
0.00%
5.00%
10.00%
15.00%
20.00%
Group
Perc
enta
ge
2006-07
2007-08
2006-07 15.83% 4.78% 10.96% 14.68%
2007-08 12.69% 5.84% 7.03% 11.63%
Group 1 Group 2 Group 3 Industry
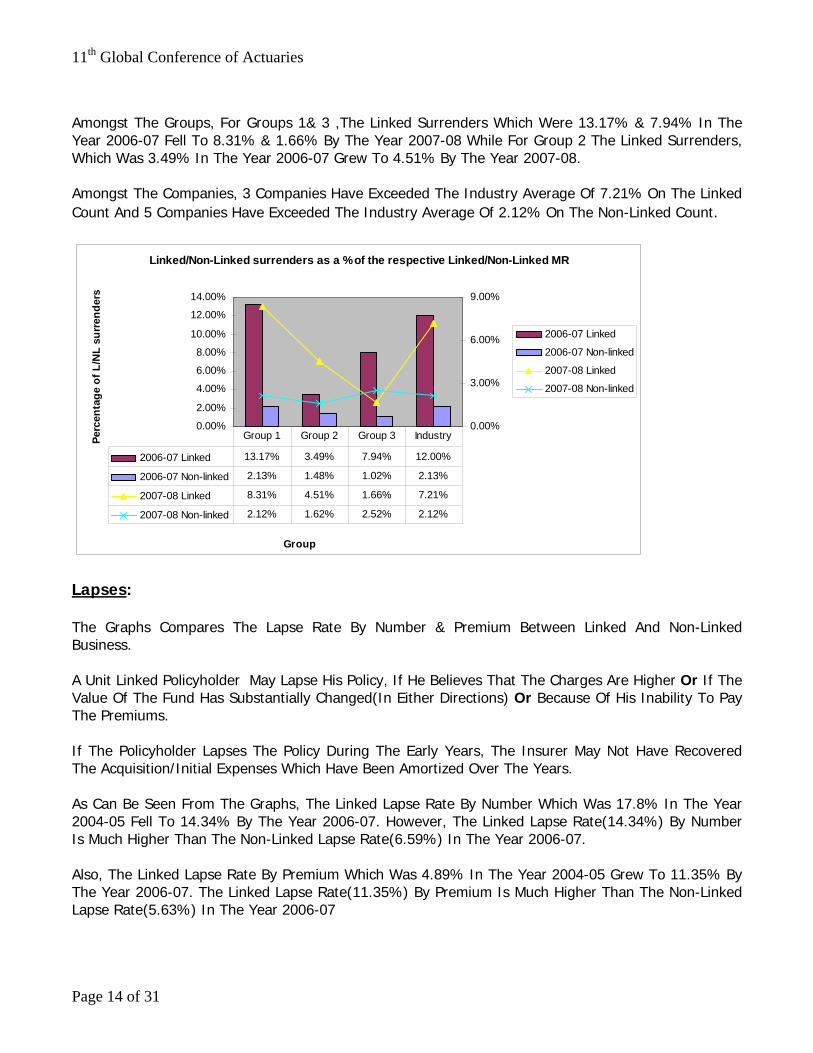
As can be seen from the graph, linked surrenders which was 14.68% of the total linked premium in the Year 2007 Reduced To 11.63% In The Year 2008. The Group 1 Has Exceeded The Industry Average Of 11.63% In The Year 2008. Amongst The Companies , 4 Companies Have Exceeded The Industry Average Of 11.63% In The Year 2008. The Graph Below Shows The Group-Wise And For The Industry As Well , The Linked/Non-Linked Surrenders As % Of The Respective Linked/Non-Linked Mathematical Reserve(MR). As Can Be Seen From The Graph, The Linked/Non-Linked Surrenders For The Industry Which Was 12% & 2.13% In The Year 2006-07 Fell To 7.21% & 2.12% By The Year 2007-08.
Page 13 of 31
11th Global Conference of Actuaries
Amongst The Groups, For Groups 1& 3 ,The Linked Surrenders Which Were 13.17% & 7.94% In The Year 2006-07 Fell To 8.31% & 1.66% By The Year 2007-08 While For Group 2 The Linked Surrenders, Which Was 3.49% In The Year 2006-07 Grew To 4.51% By The Year 2007-08. Amongst The Companies, 3 Companies Have Exceeded The Industry Average Of 7.21% On The Linked Count And 5 Companies Have Exceeded The Industry Average Of 2.12% On The Non-Linked Count.
Linked/Non-Linked surrenders as a % of the respective Linked/Non-Linked MR
0.00%
2.00%
4.00%
6.00%
8.00%
10.00%
12.00%
14.00%
Group
Perc
enta
ge o
f L/N
L su
rren
ders
0.00%
3.00%
6.00%
9.00%
2006-07 Linked
2006-07 Non-linked
2007-08 Linked
2007-08 Non-linked
2006-07 Linked 13.17% 3.49% 7.94% 12.00%
2006-07 Non-linked 2.13% 1.48% 1.02% 2.13%
2007-08 Linked 8.31% 4.51% 1.66% 7.21%
2007-08 Non-linked 2.12% 1.62% 2.52% 2.12%
Group 1 Group 2 Group 3 Industry
Lapses: The Graphs Compares The Lapse Rate By Number & Premium Between Linked And Non-Linked Business. A Unit Linked Policyholder May Lapse His Policy, If He Believes That The Charges Are Higher Or If The Value Of The Fund Has Substantially Changed(In Either Directions) Or Because Of His Inability To Pay The Premiums. If The Policyholder Lapses The Policy During The Early Years, The Insurer May Not Have Recovered The Acquisition/Initial Expenses Which Have Been Amortized Over The Years. As Can Be Seen From The Graphs, The Linked Lapse Rate By Number Which Was 17.8% In The Year 2004-05 Fell To 14.34% By The Year 2006-07. However, The Linked Lapse Rate(14.34%) By Number Is Much Higher Than The Non-Linked Lapse Rate(6.59%) In The Year 2006-07. Also, The Linked Lapse Rate By Premium Which Was 4.89% In The Year 2004-05 Grew To 11.35% By The Year 2006-07. The Linked Lapse Rate(11.35%) By Premium Is Much Higher Than The Non-Linked Lapse Rate(5.63%) In The Year 2006-07
Page 14 of 31

11th Global Conference of Actuaries
Comparison of lapse rates by number(Linked vs Non-Linked)
0.00%
10.00%
20.00%
30.00%
Year
Perc
enta
ge
L
NL
L 17.80% 26.09% 14.34%
NL 7.69% 7.48% 6.59%
2004-05 2005-06 2006-07
Comparison of lapse rates by Premium(Linked vs Non-Linked)
0.00%
5.00%
10.00%
15.00%
Year
Perc
enta
ge
L
NL
L 4.89% 8.54% 11.35%
NL 6.04% 6.19% 5.63%
2004-05 2005-06 2006-07
Investment As Stated Above, The Prospects/Policyholders May View The Unit Linked Product As An Investment Rather Than A Protection Product. When A Policyholder Takes Out A Unit Linked Policy He Pays A Premium . The Policyholder Can Either Pay The Premium Regularly Or By Way Of Single Premium. The Insurer Recovers Charges From This Premium And The Rest Is Available For Investment , Which Is Invested In The Funds As Per The Choice Made By The Policyholder At The Inception Of The Policy With A Flexibility To Switch Between The Funds As Per The Terms And Conditions Of That Particular Policy. It Is Also Important To Note That The Insurance Sector Is The Largest Investor In The Indian Stock Market. Most Insurers Offer A Wide Range Of Funds To Suit One’s Investment Objectives, Risk Profile And Time Horizons. Different Funds Have Different Risk Profiles. The Potential For Returns Also Varies From Fund
Page 15 of 31

11th Global Conference of Actuaries
To Fund. The Following Are Some Of The Common Types Of Funds Available Along With An Indication Of Their Risk Characteristics. General Description Nature Of Investments Risk
Category
Equity Funds Primarily Invested In Company Stocks With The General Aim Of Capital Appreciation
Medium To High
Income, Fixed Interest And Bond Funds
Invested In Corporate Bonds, Government Securities And Other Fixed Income Instruments
Medium
Cash Funds Sometimes Known As Money Market Funds — Invested In Cash, Bank Deposits And Money Market Instruments
Low
Balanced Funds Combining Equity Investment With Fixed Interest Instruments
Medium
The Graphs Below Indicate Group-Wise Year On Year Progression Of Unit And Non-Unit Linked Fund Investments As A Percentage Of The Total Investments Of That Particular Year. As Can Be Seen From The Graphs, The Unit Linked Fund(Ulf) Of Group 1 Which Was 76.51% Of The Total Ulf Investment In The Year 2006 Grew To 84.3% In The Year 2008 While The Shares Of Groups 1 & 2 Which Were 18.33% & 5.16% Fell To 11.75% & 3.95% Respectively. At The Same Time, , The Traditional Fund(Tf) Of Group 1 Which Was 99.48% Of The Total Tf Investment In The Year 2006 Fell Marginally To 98.58%% By The Year 2008 While The Shares Of Groups 1 & 2 Which Were 0.34% & 0.18% Grew To 0.89% & 0.53% Respectively. The Unit Linked Fund Investment For The Entire Industry As A Percentage Of The Total Investment Which Was Only 1.76% In 2005 Grew To 18.39% In The Year 2008, Which Clearly Indicates The Growing Popularity Of The Unit Linked Business.
Page 16 of 31

11th Global Conference of Actuaries
Group-wise progression of ULF
0.00%
20.00%
40.00%
60.00%
80.00%
100.00%
Year
Perc
enta
ge o
f ULF
Group 1
Group 2
Group 3
Group 1 76.51% 83.26% 86.20% 84.30%
Group 2 18.33% 12.60% 10.40% 11.75%
Group 3 5.16% 4.14% 3.39% 3.95%
2005 2006 2007 2008
Group-wise progression of TF
0.00%20.00%40.00%60.00%80.00%
100.00%120.00%
Year
Perc
enta
ge o
f TF
Group 1
Group 2
Group 3
Group 1 99.48% 99.22% 98.96% 98.58%
Group 2 0.34% 0.50% 0.66% 0.89%
Group 3 0.18% 0.28% 0.39% 0.53%
2005 2006 2007 2008
The Graph Below Shows The Comparison Of AI(Approved Investments) & OTAI(Other Than Approved Investments) For The Industry Between Traditional & ULIP Fund Investments. The AI For The Industry As A Percentage Of The Total Linked Investments Which Was 89.43% In The Year 2005 Fell To 85.89% By The Year 2007 . At The Same Time, The AI For The Industry As A Percentage Of The Total Non-Linked Investments Which 93.73% In The Year 2005 Grew To 94.41% By The Year 2007. As Per The Regulations, The Investments Under OTAI Shall Not Exceed 25% Of The Total Investments Of The ULIP Fund Investment. Amongst The Companies, No Company Has Exceeded The Stipulated Limit(25%). The Highest Exposure To OTAI Of Any Company Is 19.74% With One Of The Companies Having A Least Exposure Of 5.68% To OTAI.
Page 17 of 31

11th Global Conference of Actuaries
Apporoved vs Other than approved investments for the Industry(ULIP Fund)
0%
20%
40%
60%
80%
100%
2005 2006 2007
Year
Am
ount
(in c
rore
s)
OTAI
AI
Apporoved vs Other than approved investments for the Industry(Traditional Fund)
0%
20%
40%
60%
80%
100%
2005 2006 2007
Year
Am
ount
(in c
rore
s)
OTAI
AI
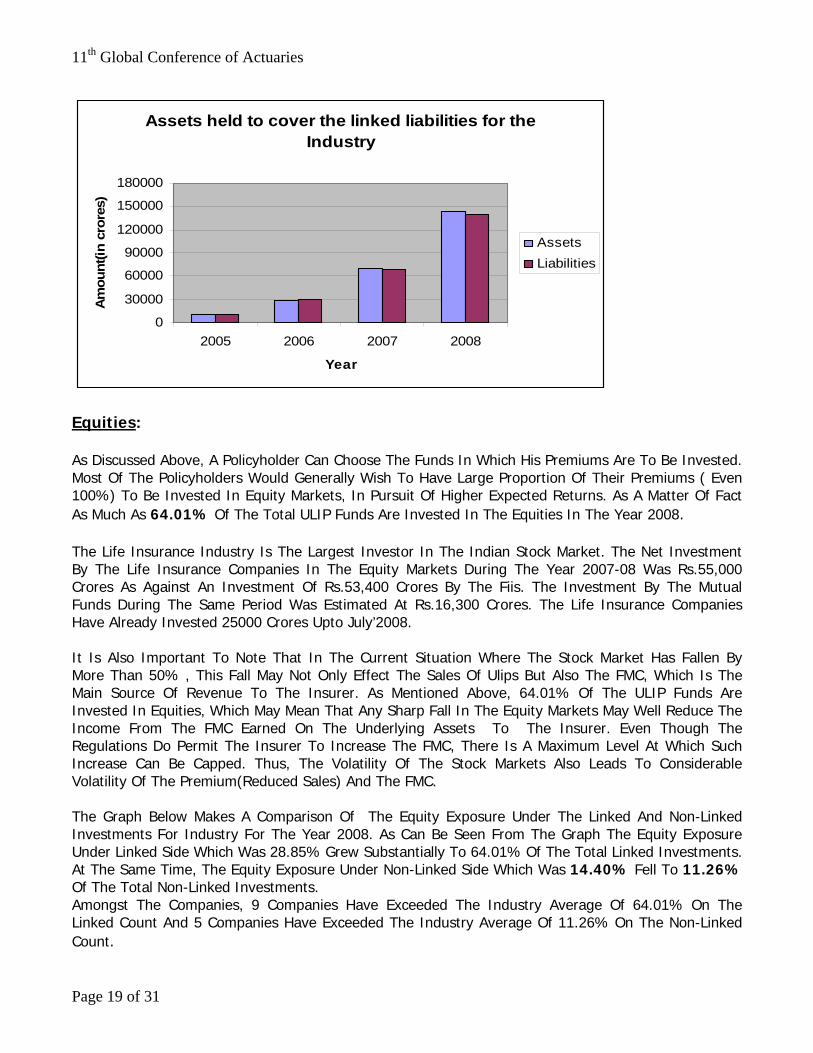
The Graph Below Shows The Mapping Of Assets Held To Cover The Linked Liabilities. In The Current Year 2008, The Assets Exceeded The Liabilities By 2%.
Page 18 of 31
11th Global Conference of Actuaries
Assets held to cover the linked liabilities for the Industry
0
30000
60000
90000
120000
150000
180000
2005 2006 2007 2008
Year
Am
ount
(in c
rore
s)
AssetsLiabilities
Equities: As Discussed Above, A Policyholder Can Choose The Funds In Which His Premiums Are To Be Invested. Most Of The Policyholders Would Generally Wish To Have Large Proportion Of Their Premiums ( Even 100%) To Be Invested In Equity Markets, In Pursuit Of Higher Expected Returns. As A Matter Of Fact As Much As 64.01% Of The Total ULIP Funds Are Invested In The Equities In The Year 2008. The Life Insurance Industry Is The Largest Investor In The Indian Stock Market. The Net Investment By The Life Insurance Companies In The Equity Markets During The Year 2007-08 Was Rs.55,000 Crores As Against An Investment Of Rs.53,400 Crores By The Fiis. The Investment By The Mutual Funds During The Same Period Was Estimated At Rs.16,300 Crores. The Life Insurance Companies Have Already Invested 25000 Crores Upto July’2008. It Is Also Important To Note That In The Current Situation Where The Stock Market Has Fallen By More Than 50% , This Fall May Not Only Effect The Sales Of Ulips But Also The FMC, Which Is The Main Source Of Revenue To The Insurer. As Mentioned Above, 64.01% Of The ULIP Funds Are Invested In Equities, Which May Mean That Any Sharp Fall In The Equity Markets May Well Reduce The Income From The FMC Earned On The Underlying Assets To The Insurer. Even Though The Regulations Do Permit The Insurer To Increase The FMC, There Is A Maximum Level At Which Such Increase Can Be Capped. Thus, The Volatility Of The Stock Markets Also Leads To Considerable Volatility Of The Premium(Reduced Sales) And The FMC. The Graph Below Makes A Comparison Of The Equity Exposure Under The Linked And Non-Linked Investments For Industry For The Year 2008. As Can Be Seen From The Graph The Equity Exposure Under Linked Side Which Was 28.85% Grew Substantially To 64.01% Of The Total Linked Investments. At The Same Time, The Equity Exposure Under Non-Linked Side Which Was 14.40% Fell To 11.26% Of The Total Non-Linked Investments. Amongst The Companies, 9 Companies Have Exceeded The Industry Average Of 64.01% On The Linked Count And 5 Companies Have Exceeded The Industry Average Of 11.26% On The Non-Linked Count.
Page 19 of 31

11th Global Conference of Actuaries
Equity exposure (Linked vs Non-Linked) for the
Industry
0.00%20.00%40.00%60.00%80.00%
100.00%
Year
Perc
enta
ge
Linked
Non-Linked
Linked 28.85% 55.37% 53.14% 64.01%
Non-Linked 14.40% 19.79% 17.67% 11.26%
2005 2006 2007 2008
The Graph Below Makes A Comparison Of The Equity Exposure Under The Non-Linked Side Across The Groups For The Year 2008. As Can Be Seen From The Graph, The Equity Exposure Of Group 1 Has Exceeded The Industry Average Of 11.26%.
Equity exposure as a % of the total non-linked investments in the year 2008
0.00%
20.00%
40.00%
60.00%
80.00%
Group
Perc
enta
ge
Non-Linked
Non-Linked 11.34% 3.27% 9.17% 11.26%
Group 1 Group 2 Group 3 Industry
The Graph Below Makes A Comparison Of The Equity Exposure Under The Linked Side Across The Groups For The Year 2008. As Can Be Seen From The Graph, The Equity Exposure Of Group 1 Has Exceeded The Industry Average Of 64.01% While The Exposure Of Group 3 Is Very Close To The Industry Average.
Page 20 of 31

11th Global Conference of Actuaries
Equity exposure as a % of the total linked investments in the year 2008
0.00%
20.00%
40.00%
60.00%
80.00%
Group
Perc
enta
ge
Linked
Linked 65.09% 56.34% 63.70% 64.01%
Group 1 Group 2 Group 3 Industry
Share of each group in the equity investments of the total ULF/TF of the respective group
0.00%
20.00%
40.00%
60.00%
80.00%
100.00%
Linked
Non-Linked
Linked 85.73% 10.34% 3.93%
Non-Linked 99.31% 0.26% 0.43%
Group 1 Group 2 Group 3
Mathematical Reserves: As Per The Regulations Unit Reserves Are To Be Calculated In Respect Of The Units Allocated To The Policies In Force At The Valuation Date Using The Unit Values At The Valuation Date. The Graph Below Shows The Progression Of The Total Linked MR Across The Groups. As Can Be Seen From The Graph, Group 1 Is The Major Contributor To The Total Linked MR. The Shares Of Group 1&2 Which Were 84.59% & 11.61% Of The Total Linked MR In The Year 2006 Fell To 79.4% & 9.66% In The Year 2008 While The Share Of Groups 3 Which Was Only 3.81% % In The Year 2006 Grew To 10.94% By The Year 2008.
Page 21 of 31

11th Global Conference of Actuaries
Amongst The Companies, In Case Of 16 Companies ,The Linked Reserve Takes The Major Portion Of The Total MR.
Progression of linked reserve as % of total linked MR
0.00%
20.00%
40.00%
60.00%
80.00%
100.00%
Year
Perc
enta
ge o
f LR
Group 1
Group 2
Group 3
Group 1 84.59% 86.29% 79.40%
Group 2 11.61% 10.19% 9.66%
Group 3 3.81% 3.52% 10.94%
2006 2007 2008
The Graph Below Shows The Progression Of The Total Non-Linked MR Across The Groups. As Can Be Seen From The Graph, Group 1 Is The Major Contributor To The Total Non- Linked MR. The Shares Of Group 1 Which Was 99.55% Of The Total Linked MR In The Year 2006 Fell Marginally To 99.20% By The Year 2008 While The Shares Of Groups 2 & 3 Which Were 0.28% & 0.17% % In The Year 2006 Grew Marginally To 0.51% & 0.29% By The Year 2008. Amongst The Companies, In Case Of 2 Companies ,The Non-Linked Reserve Takes The Major Portion Of The Total MR.
Progression of Non-linked reserve as % of total Non-linked MR
0.00%
50.00%
100.00%
150.00%
Year
Perc
enta
ge o
f NLR
Group 1
Group 2
Group 3
Group 1 99.55% 99.36% 99.20%
Group 2 0.28% 0.40% 0.51%
Group 3 0.17% 0.24% 0.29%
2006 2007 2008
Page 22 of 31

11th Global Conference of Actuaries
As Can Be Seen From The Graph Below, Linked Mathematical Reserve As % Of The Total Reserve Is Increasing Year On Year. The Linked Reserve For The Industry Which Was 6.72% In The Year 2006 Grew To 21.99% By The Year 2008. At The Same Time, The Non- Linked Reserve For The Industry Which Was 93.28% In The Year 2006 Fell To 78.01% In The Year 2008
Mathematical reserve(Linked vs Non-Linked)
0.00%
20.00%
40.00%
60.00%
80.00%
100.00%
Year
Per
cent
age
LinkedNon-Linked
Linked 6.72% 12.86% 21.99%
Non-Linked 93.28% 87.14% 78.01%
2006 2007 2008
Guarantees: The Stock Markets Which Are Witnessing A Severe Fall During The Last Few Months Also Resulted In Wealth Erosion On The ULIP Polices Particularly On The Funds Which Have Large Exposure To Equity. The ULIP Policies Have Traditionally Offered Higher Returns To A Policyholder In Booming Stock Markets . However, In The Prevailing Situation The Policyholder Is At The Receiving End As The Investment Risk Under A ULIP Is Typically Borne By Him. To Draw A Comparison, Even Mutual Funds Are Also Feeling The Heat Perhaps More Than Ulips. The Financial Market Uncertainties May Push Investors Away From The Tailor Made ULIP Products Where The Entire Risk Is Borne By The Policyholder. This Has Shifted The Focus To ULIP Products That Offer Guarantees As The Customer Has Began To Look At Security And Guarantees Under Ulips Policies As Well. The Investors Now Intend To Have Both The Exposure To Growth Assets As Well As Downside Protections Ie, A Minimum Guarantee. In India There Are About 11 Companies Offering Guaranteed UL Products And The Sale Of These Policies Are Not As Aggressive As It Should Be. The Guaranteed UL Policies Partly Shifts The Risk To The Insurer Also. The Following Are The Guarantees That Are Typically Being Offered By The Indian Insurers:
• Investment Return Of X% Per Annum On The End Fund Payable At Maturity Or • Capital Guarantee • A Guaranteed % Of The FYP At Maturity Etc.,
The Graph Below Shows Unit Linked Guaranteed(ULG) Products As A Percentage Of The Total Linked Products In The Respective Group. The Proportion Of The ULG Products For The Industry Is
Page 23 of 31

11th Global Conference of Actuaries
17.3%. Amongst The Companies,3 Companies Have Exceeded The Industry Average Of 17.3% And Have A Guaranteed Linked Products Of More Than 30% .
Proportion of ULG prodcuts out of the total linked products in the respective group
0%
20%
40%
60%
80%
100%
Group 1 Group 2 Group 3 Industry
Group
Perc
enta
ge
GLP
TLP
The Graph Below Shows The Guaranteed Linked Mathematical Reserve(GLMR) As A Proportion Of The Total Linked Mathematical Reserve(TLMR) In The Respective Group . The GLMR Constitutes 3.60% Of The TLMR For The Industry. Amongst The Companies, 2 Companies Have A GLMR Of More Than 30 % Of Their TLMR With One Of The Companies Having A GLMR Of 83.33% .
Percentage of the GLMR out of the TLMR of the respective group
0.00%
20.00%
40.00%
60.00%
80.00%
Group
% o
f GLM
R
GLMR
GLMR 2.18% 9.54% 51.21%
Group 1 Group 2 Group 3
As Per The Graph Below, Group 1 Assumes Maximum Share (43.76%)In The Total GLMR.
Page 24 of 31

11th Global Conference of Actuaries
Share of each group in the total GLMR
0.00%
10.00%
20.00%
30.00%
40.00%
50.00%
Group
Perc
enta
ge o
f tot
al G
LMR
GLMR 43.76% 25.62% 30.63%
Group 1 Group 2 Group 3
The Graph Below Compares The Equity Exposure( As % Of The Total Unit Linked Fund Investment Of The Respective Group) And The GLMR (As A Percentage Of TLMR Of The Respective Group). As Can Be Seen From The Graph Group 3, Which Has The Highest Proportion Of GLMR Of 51.21% , Has An Equity Exposure Of 63.70% And This May Make Group 3 Vulnerable To The Fall In Equity Market.
Equity exposure(as a % of the Unit linked fund of the respective group) vs GLMR(as a% of the TLMR of the respective group)
0.00%
20.00%
40.00%
60.00%
80.00%
Group
Perc
enta
ge
Equity exposure
GLMR
Equity exposure 65.09% 56.34% 63.70%
GLMR 2.18% 9.54% 51.21%
Group 1 Group 2 Group 3
We Have, To Examine Effect Of The Above, Analysed The Performance Of All The Funds Of 4 Companies Which Have An Equity Exposure Of 10% & Above For The Period Between 01/07/2008 And 25/10/2008 And Which Have Guaranteed Products In Their Portfolio. All The Funds Of Theses Companies Have Shown A Negative Growth During This Period Which Is Normally Not Expected For The Companies Which Has GLMR. We Have However Observed That For These Companies, The Guarantees Mostly Will Only Apply At Original Maturity Date Selected By The Client Which May Significantly Reduce The Risk. Amongst The Companies, Only 2 Companies Have GLMR(As Percentage Of The Respective TLMR) Of More Than 30% And All Other Companies Have A GLMR Of Less Than 5% Of Respective TLMR
Page 25 of 31

11th Global Conference of Actuaries
It May Not Be Out Of Context To Produce A Graph, Which Shows The Weighted Average Solvency Ratio Of Each Group & The Industry As Well Where The Weights Are The Policyholders Funds In Order To Understand Whether The Insurers Are Financially Sound & Capable To Meet The Existing Liabilities Of The Policies In Their Respective Books.
Weighted Average Solvency ratio with Policyholders Funds as weights
0.00
1.00
2.00
3.00
4.00
Group
Solv
ency
Rat
io
Solvency Ratio
Solvency Ratio 1.57 2.89 2.30 1.61
Group 1 Group 2 Group 3 Industry
As Can Be Seen From The Above Graph, The Solvency Ratio Of Groups 2& 3 Have Exceeded The Industry Average Of 1.61 While Group 1 Is Slightly Below The Industry Average. Amongst The Companies, All The Companies Have A Solvency Ratio Of More Than The Stipulated Ratio Of 1.5 As Per Regulations With 14 Companies Having A Solvency Ratio Of More Than 2. Guarantees (International Scenario): The Guaranteed Unit Linked Products Have Been A Huge Success In US, UK, Japan, Korea, Italy, Ireland . Adding Guarantees Has Become Common In Developed Markets In North America, Japan & Europe. Basically, There Are Three Types Of Adding The Guarantees To The ULIP Products Which Are In Existence In The Above Markets And These Are Explained As Under: Traditional/Conservative Funds: In This Type Of Products, The Customer Will Not Have The Investment Flexibility And Only Has A Limited Fund Choice And Hence Minimum Investment Risk Is Borne By The Customer. This Can Give Unsatisfactory Results In Certain Market Conditions And Also Has A Limited Upside Fund Movement. Structured Funds: These Products Offer A Link To A Financial Instrument, Typically An Index Or A Basket Of Equity Stocks,Over A Fixed Period The Return Is Linked To The Financial Instrument, Usually Being Capped At A Certain Level, But With A Guaranteed Platform, For Example 105% Of The Original Investment The Underlying Structure Combines An Option Related To The Index And Fixed Interest Stocks To Provide The Guaranteed Return At Maturity The Products Do Offer Clients Security But Typically With Restricted Surrender Options, A Fixed End Date (Limited Entry)And No Investment Flexibility.
Page 26 of 31

11th Global Conference of Actuaries
Variable Annuities: A Variable Type Of Annuity Stipulates A Fixed Periodic Payment To The Annuity Holder Beginning Immediately Or At Some Point In Future. The ‘Variable’ Portion Of The Annuity Exists Due To The Investments That Are Made As Per The Choice Of The Investor For Ex: In Stocks, Bonds Tec., These Products Provides The Customer With The Combination Of Upside Exposure In The Fund And Downside Protection. These Products Also Offer A Variety Of Additional Guarantees, Effectively As Riders To The Existing Contract, Paid For By An Additional Management Charge One Or More Guarantee May Be Offered From A Client-Selected “Menu” The Same Or Similar Funds May Be Offered In The VA Product As On Existing UL, Or It Could Be Index-Based Products Are Long Term And Offer Multiple Payment Possibilities. These Type Of Annuities Have Dominated US, Europe, Even Parts Of Asian Markets. There Are Broadly Four Types Of Guarantees That Are Available On VA Products
• Guaranteed Minimum Death Benefit(GMDB) • Guaranteed Minimum Accumulation Benefit (GMAB) • Guaranteed Minimum Income Benefit (GMIB) • Guaranteed Minimum Withdrawal Benefit (GMWB)
The Above Guarantees Can Be Offered On A Stand-Alone Basis Or Combinations, And On A ‘Menu’ Basis For The Client. There Are About 40 Such Products In America. In UK The VA Product Has Started In The Year 2005 And Is Now Flooded With Such Products.A Brief Description Of The Above Guarantees Is As Under GMDB: This Involves An Additional Payment To The Beneficiary Equal To The Difference Between The Guaranteed Value Of The Fund And The Market Value Of The Fund That Is Originally Payable. This Guarantee Gives Asset Protection On Death. GMAB: This Involves An Additional Payment In The Form Of A Top Up To The Beneficiary On A Specific Date Or After A Specified Waiting Period If The Market Value Of The Fund Id Lower Than A Pre-Determined Guarantee Level. This Payment Is Equal To The Difference Between The Guarantee Value Of The Fund And The Market Value Of The Fund That Is Originally Payable. This Guarantee Gives Asset Protection On Market Decrease. GMIB: This Involves A Guarantee To The Policy Holder That A Minimum Income Stream On The Vesting Of The Annuity Regardless Of How Well Their Fund As Performed And The Annuity Rates Prevailing At That Time. This Guarantee Gives Protection Against Under Performing Assets. GMWB: This Involves A Guarantee To The Policy Holder That They Will Not Outlive Their Assets Regardless Of Market Performance. The Policy Holder Continues To Receive The Payments Even After The Market Value Of The Fund Falls To Zero. There Is No Requirement To Annuitize Thus Surrender Option And Death Benefit To Beneficiary Remains. . This Guarantee Gives Protection Against Under Performing Assets. Pricing Of The Guarantees: The Pricing As Well As Managing & Reserving For These Guarantees Is Highly Complex And Intensive. The Premium Differs By The Type Of Guarantee, Type Of Fund, Level Of Guarantee Etc. It Is Helpful To Start With An Acceptable Premium Range And Then Develop The
Page 27 of 31

11th Global Conference of Actuaries
Guarantee. However To Determine A Proper Market Price To Charge The Client There Can Be A Large Risk Exposure To The Insurer. Risks Under Guaranteed Products: There Are Certain Risks Involved In Pricing The Guarantees. Some Of Them Are
• Financial Risk: This Is The Risk That The Fund Value Might Be Lower Than The Investment Guarantee And The Difference To Be Met By The Insurer. This Is The Main Risk For Pricing The Guarantees.
• Mis-Pricing Risk: This Is The Risk That The Guarantee Provided Might Not Be Adequate. • Policy Holder Behaviour Risk: The Insurer Might Have Priced The Product Based On The Some
Assumptions About The Policyholders Behaviour In Different Market Scenarios. This Is The Risk That Such Assumptions Are Proved To Be Wrong/Not Conservative Enough, Thereby Exposing The Insurer To Risk.
• Actuarial Risks: These Are The Risks Relating To Mortality, Longevity, Expenses Etc Assumptions Going Wrong Or The Model Used May Not Be Appropriate.
• Captital Market Risks Risk Mitigation Process: Some Of The Ways In Which The Above Risks Can Be Mitigated.
• Basically All The Above Risks Can Be Mitigated By Smart Product Design. • Use Of Reinsurance • Purchasing Options From Investments Banks • Setting A Side An Additional Reserve For Guarantees • Sophisticated Internal Asset Management So As To Manage The Portfolios Effectively • Trained Marketing Personnel • Dynamic Hedging
Dynamic Hedging Is An Approach Where In Addition To The Usual Funds Associated With A Unit Linked Contract, A Hedge Portfolio Is Purchased And Actively Managed In Such A Way That All Shortfalls Arising From An Investment Guarantee Can Be Financed By This Portfolio Under All Possible Financial Market Situations. The Current Best Approach For Valuing ULG Products Is To Use Stochastic Simulation:
• Produce A Sufficiently Large Set Of Market-Consistent Scenarios Describing All Relevant Market Parameters.
• Determine The Cost Of The Option For Each Scenario. • The (Potentially Weighted) Average Value Over All Scenarios Is Then An Estimation For The
Value Of The Option. Guarantees (Indian Scenario): In India, There Is A Compulsory Minimum Guaranteed Death Benefit, Which Is Largely Taken Care By The Mortality Expenses Charged For The Death Cover. Other Guarantees Available In India Are Discussed Above. These Guarantees Are Being Usually Priced Either Implicitly By Way Loading In The Expense Charges Or Explicitly With The Cost Of Guarantee Being Modeled Stochastically. The Calculation Of Guaranteed Reserves Either Involves An Explicit Provision To Meet The Cost Of Guarantee Or The Cost Of Guarantee Considered As X% Per Assets Per Annum. The Insurer Usually
Page 28 of 31

11th Global Conference of Actuaries
Arrive At This Percentage After Extensive Stochastic Testing Of The Business( Surprisingly There Are Insurers Who Are Modeling The Guarantees Deterministically). For The Products Which Have Maturity Guarantees, Investment Risk Is Explicitly Modeled And A Special Reserve (Which Is Held Back To Meet The Cost Of Guarantee Till The Maturity) Is Maintained To Cover The Maturity Guarantee A Stochastic Model Based On Real World Assumptions Is Used For Asset-Liability Matching Exercise. As Stated Above, The Guaranteed ULIP Products Are Not So Aggressive In India And GLMR Constitutes Only 3.60% Of The TLMR. Road Ahead: Pre-Global Financial Crisis: World Scenario:The Insurance Sector Through Out The World Registered A Good Growth And As Can Be Seen From The Graph Almost All The Regions Exceeded The World Average Of 5%.
Growth rate in 2007 across the world
0.0%2.0%4.0%6.0%8.0%
10.0%12.0%14.0%16.0%18.0%
Indu
stria
lised
cou
ntrie
s
Nor
th A
mer
ica
Wes
tern
Eur
ope
Japa
n an
d ne
wly
indu
stria
lised
Asi
anec
onom
ies
Oce
ania
Emer
ging
mar
kets
Sout
h an
d Ea
st A
sia
Latin
Am
eric
a an
d C
arib
bean
Cen
tral a
nd E
aste
rn E
urop
e
Afric
a
Mid
dle
East
and
Cen
tral A
sia
Wor
ld
Region
Perc
enta
ge
Series1
At The Same Time, Indian Insurance Business Grew At 13% (Adjusted Fro Inflation) Ulips Front: UK Which Is The Most Developed Unit Linked Market In Europe , The Demand For Unit Linked Product Remained Strong And The Growth Was Mainly Driven By Individual Pension Market And Offshore Bonds Which Attracted Growing Interest From Wealthy Customers. French Unit Linked Business However Declined By 1% In 2007. In Italy Unit Linked Premium Registered Growth In An Overall Declining Individual Life Insurance Market. Similarly Irish International Market Also Registered A Strong Growth. Germany, Brazil, Switzerland, Hungary, Poland, Spain Have Also Registered Growth In Unit Linked Business. Post Global Financial Crisis:
Page 29 of 31

11th Global Conference of Actuaries
General Scenario: Now, These Are Challenging Times For All Financial Sectors, Not Least The Insurance Market. Amid The Economic Challenges, Financial Services, And Within Them Insurance, Also Remain A Key Focus In Its Drive To Create A Better Regulated, More Integrated Single Market. The Life Insurance New Business Across The World Is Already Effected Because Of The Drop In Unit Linked And Single Premium Business. Demand For Life Insurance Has Slowed Across The World. The Greatest Impact Will On Products Which Are Discretionary In Nature And Unit Linked Products, Due To The Poor Returns And Continuing High Volatility Of The Stock Markets. The On-Going Financial Crisis May Also Negatively Effect The Profitability Of The Providers Of The Variable Annuity Products As The Fall In The Equity Prices May Significantly Reduce The Future, Which Is Based On The Fund Values . The Same May Be The Case For Traditional Unit Linked Products. The Challenges Being Faced By The Life Sector From A Slowing Economy And Continuing Volatility In The Financial Markets Are Likely To Last For Some Time. Profitability, Therefore Will Continue To Be Negatively Effected Due To The Pressures From The Declining Sales, Lower Investment Returns, Lower FMC From Unit-Linked Business, Higher Hedging Cost Of Guarantees And Possible High Surrenders On Some Products. Indian Scenario: In India, Unit Linked Business Is Well Regulated As Under
• Through Unit Linked Guidelines, Which Aim At Provision Of Fair Insurance Coverage, Disclosures To Facilitate Informed Decisions By The Policyholders As The Investment Risks Are Borne By Them And Preserving Long Term Nature Of The Insurance Products.
• Benefit Illustrations, To Be Demonstrated To The Policyholder/Prospect, Which Aims At Providing All Relevant Information Regarding The Amounts Deducted Towards Various Charges So That The Policyholder/Prospect Can Take An Informed Decision.
• Through Investments Regulations For Ex: Restricting The Investments In Other Than Approved Securities To A Maximum Of 25%, Restriction The Concentration In One Particular Sector To 10%
For A Unit Linked Product To Continue To Be Successful, Insurers Must Ensure That They Make It Easy For The Policyholder/Prospect To Access The Information Relevant To Their Investment Decisions And Which Enables Them To Make Comparisons With The Other Providers. The Sales Literature Must Disclose All The Key Elements Which Are Essential To Enable The Policyholder/Prospect To Make Effective And Informed Choices. It Is Also Important To Note That The Level Of Information/Disclosure Should Match The Customer Needs. At The Same Time, An Overload Of Information May Prevent Consumers From Making An Appropriate Assessment Of A Product And Therefore Just Adding Additional Disclosures May Not Be The Solution. Thus, Under A Unit Linked Policy The Disclosures Should Give The Customers Confidence That Their Funds Are Managed Fairly In Line With Their Expectations So That They Can Take Effective And Informed Decisions. The Big Question Now Is Whether The India Insurance Industry Can With Stand The Current Challenges And Sustain The Growth In Life Insurance Business In General And Unit Linked Business, In Particular?.
Page 30 of 31

11th Global Conference of Actuaries
Page 31 of 31
The Answer To The Above Question Should Be Yes, If The Insurers Come Out With More Innovative Products, Make Proper And Thorough Disclosures To Both Policyholders And The Regulators, Continue To Manage Their Investment More Effectively, Have A Minimum Level Of Conventional Business In Their Portfolio, Continue To Address The Above Discussed Critical Areas More Effectively. About The Author: Mr.DNKLNK Chakravarthi Is Working As Assistant Director(Actuarial) With Insurance Regulatory Development Authority(IRDA) ,Hyderabad. Mr.Chakravarthi Has Over 15 Years Of Experience In The Life Insurance Industry. Mr.Chakravarthi Is A Fellow Of Insurance Institute Of India And Also Holds Certificate In Actuarial Techniques From IAI, Mumbai. Disclaimer: The Views Expressed In This Paper Are Purely Personal And Not In Anyway Related To Those Of The Employer. Although Care Has Been Taken To Ensure The Accuracy Of The Data, The Author Is Not Responsible In Any Way For The Accuracy/Consistency Of The Data And Use Of This Data For Analysis That May Be Made By Others.