Embed Size (px)
Citation preview
I
nHlTIIBIH Ul'llVERSITY
OF SCIENCE HUD TECHNOLOGY
FACULTY OF HEALTH AND APPLIED SCIENCES
DEPARTME NT OF MATHEMATICS AND STATISTICS
QUALIFICATION: Bachelor of Science in Applied Mathematics and Statistics
QUALIFICATION CODE: O7BAMS LEVEL: 5
COURSE CODE: PBT501$ COURSE NAME: PPROBABILITY THEORY 1
SESSION: JUNE 2017 PAPER: THEORY
DURATION: 3 HOURS MARKS: 100
FIRST OPPORTUNITY EXAMINATION QUESTION PAPER
EXAMINER: Mr. D. Ntirampeba
Mr. H. Swartz
MODERATOR:Mr. A. Roux
INSTRUCTIONS
1. Answer ALL the questions in the booklet provided.
2. Show clearly all the steps used in the calculations.
3. All written work must be done in blue or black ink and sketches must
be done in pencil.
PERMISSIBLE MATERIALS
1. Non-programmable calculator without a cover.
THIS QUESTION PAPER CONSISTS OF 3 PAGES (excluding this front page)
QUESTION 1 (20 Marks]
1.1. Consider the eventsA = {1,3,4}, B = {2,5,7}, and C = {6,7,8} over a possibility
space S = {1,2,3,4,5,6,7,8}. With reasons, state whether true or false:
1.1.1 Events A, B, and C are mutually exhaustive. [2]
1.1.2. {A, B, C} is a partition of the sample space S [3]
1.1.3. The size of the sample space is 8 [2]
1.1.4. B and C are identical [2]
1.2. How many different ways can we arrange the letters ABEACDEAACCB? [4]
1.3. Consider a probability mass function ofX given by
3 3 _
P (x) = {(X)0.5 , x _ 0,1,2,3
O, elsewhere
1.3.1. Find cumulative distribution function F(x) [5]
1.3.2. Find the median [2]
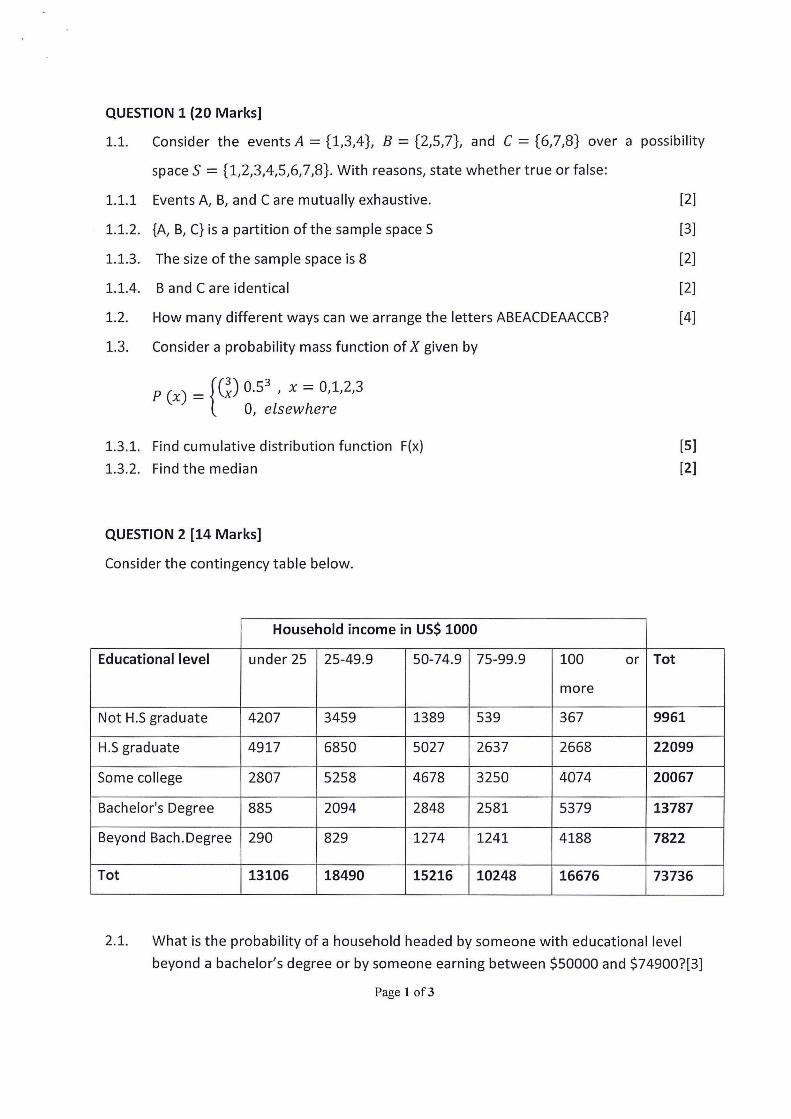
QUESTION 2 [14 Marks]
Consider the contingency table below.
Household income in US$ 1000
Educational level under 25 25—49.9 50-74.9 75—999 100 or Tot
more
Not H.S graduate 4207 3459 1389 539 367 9961
H.S graduate 4917 6850 5027 2637 2668 22099
Some college 2807 5258 4678 3250 4074 20067
Bachelor's Degree 885 2094 2848 2581 5379 13787
Beyond Bach.Degree 290 829 1274 1241 4188 7822
Tot 13106 18490 15216 10248 16676 73736
2.1. What is the probability of a household headed by someone with educational level
beyond a bachelor’s degree or by someone earning between $50000 and $74900?[3]
Page 1 of3
2.2.
2.3.
2.4.
What is the probability of a household headed by someone with a bachelor’s degree
earning $100,000 or more? [3]
What is the probability of a household headed by someone who is not a high school
graduate? [3]
If a household with income under $25000 is selected at random, what is the
probability that it is headed by someone with a bachelor’s degree? [5]
QUESTION 3 [15 Marks]
3.1.
3.1.1.
3.1.2.
3.1.3.
3.2.
Research has shown that, for a certain company, 7% of plant A products are
defective, 92% of plant B products are non-defective, 10% of plant C products are
defective, and 95% of plant D products are non—defective. Of all the products
manufactured by this company, 25% come from plant A, 15% from plant B, and 12%
from plant C. An inspector has just randomly selected one product from the
warehouse of this company.
What is the probability that it is non-defective? [4]
If it is non-defective, what is the probability that it came from plant B? [3]
If it is defective, what is the probability that it came from plant D? [3]
An electronic device consists of two components, A and B. The probability that
component A will fail within the guarantee period is 0.2. There is also a 15 % chance
that the component B will fail within the guarantee period. Assume the components
operate entirely independently of each other. What is the probability that
component A will fail within the guarantee period given that component B has failed
already within the guarantee period? [5]
QUESTION 4[15 Marks]
The probability mass function of a discrete random variable X is given by
4.1.
4.2.
k
pm: m)”1345
0, elsewhere
Find the value of a constant k [4]
Construct a probability mass table for X [3]
Page 2 of3
4.3. Find the mean ofX [3]
4.4. Find the variance ofX [5]
QUESTION 5[36 Marks]
5.1. Many employers are finding that some of the people they hire are not who and what
they claim to be. Detecting job applicants who falsify their application information
has created some new businesses. Suppose that you hire five new employees last
week and that the probability that a single employee would falsify the information
on his or her application form is 0.35.
5.1.1. What is the probability that at least four have falsified the information on their
application forms? [4]
5.1.2. Find the mean number of people who have falsified the information on their
application forms [2]
5.1.3. Compute the standard deviation of number of people who have falsified the
information on their application forms. [3]
5.2. Research has shown that 12 students call the NUST library helpdesk every 30
minutes. What is the probability that:
5.2.1. exactly 15 students call the NUST library helpdesk in the next 30 minutes time? [3]
5.2.2. at most 5 students call the NUST library helpdesk in the next 10 minutes time? [5]
5.2.3. at least 10 students call the NUST library helpdesk in the next 1 hour time? [5]
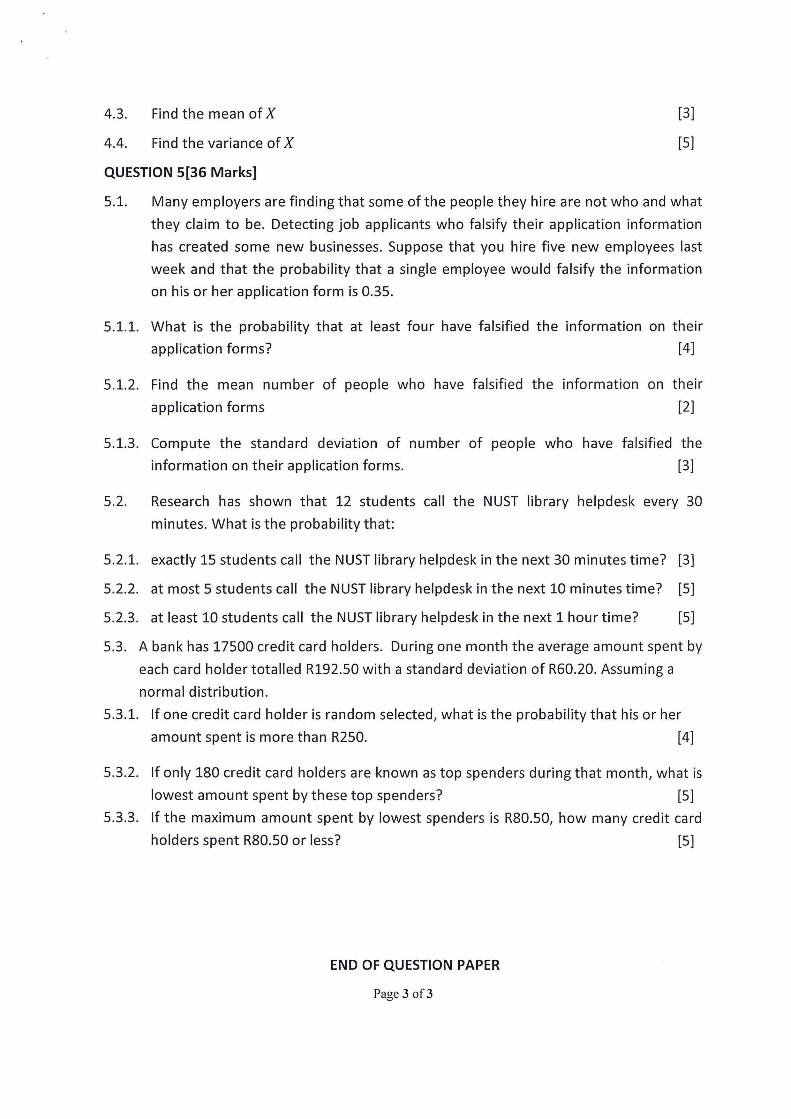
5.3. A bank has 17500 credit card holders. During one month the average amount spent by
each card holder totalled R192.50 with a standard deviation of R60.20. Assuming a
normal distribution.
5.3.1. If one credit card holder is random selected, what is the probability that his or her
amount spent is more than R250. [4]
5.3.2. If only 180 credit card holders are known as top spenders during that month, what is
lowest amount spent by these top spenders? [5]
5.3.3. If the maximum amount spent by lowest spenders is R8050, how many credit card
holders spent R80.50 or less? [5]
END OF QUESTION PAPER
Page 3 of 3
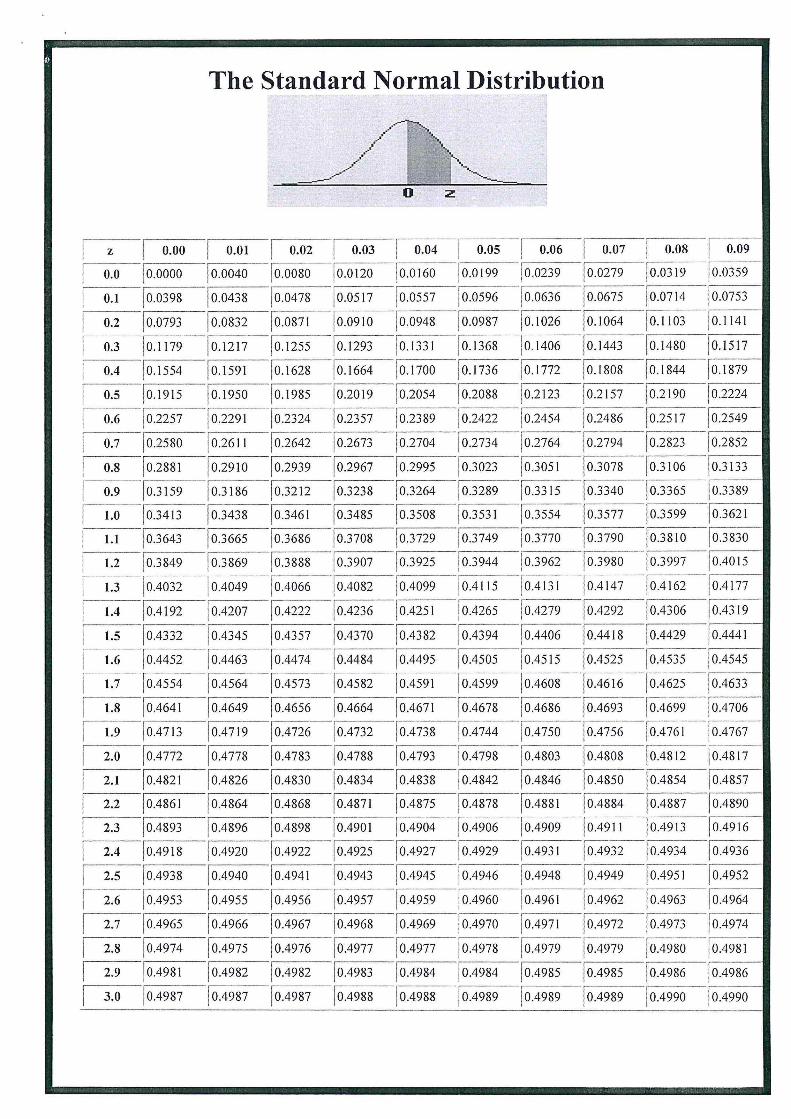
The Standard Normal Distribution
1 0.00 1 0.01 | 0.02 1 0.03 1 0.04 . 1 0.06 1 0.08 1 0.09
10.0000 10.0040 10.0080 10.0120 10.0160 . 10.0239 10.0319 10.0359
10.0398 10.0438 10.0478 10.0517 10.0557 . 10.0636 @1714 10.0753
10.0793 10.0832 10.0871 10.0910 10.0948 . 10.1026 10.1103 10.1141
10.1179 10.1217 10.1255 10.1293 10.1331 . 10.1406 10.1480 10.151710.1554 10.1591 10.1628 10.1664 10.1700 . 10.1772 10.1844 10.187910.1915 10.1950 10.1985 10.2019 10.2054 . 10.2123 10.2190 10.2224
10.2257 10.2291 10.2324 10.2357 10.2389 . 10.2454 10.2517 10.2549
10.2580 10.2611 10.2642 10.2673 10.2704'
. 10.2764 10.2823 10.2852
10.2881 10.2910 10.2939 10.2967 10.2995 . 10.3051 10.3106 10.31330.3159 10.3186 10.3212 10.3238 10.3264 . 10.3315 10.3365 10.3389
10.3413 0.3438 10.3461 10.3485 10.3508 . 10.3554 10.3599 0.3621
10.3643 0.3665 10.3686 10.3708 10.3729 . 10.3770 10.3810 10.3830
10.3849 10.3869 10.3888 10.3907 10.3925 . 10.3962 10.3997 10.4015
10.4032 10.4049 10.4066 10.4082 10.4099 . 10.4131 10.4162 10.4177
10.4192 10.4207'
. 10.4236 10.4251 . 10.4279 10.4306 10.4319.
10.4332 10.4345 . 10.4370 10.43821
. 10.4406 10.4429 10.444110.4452 10.4463 . 10.4484 10.4495 . 10.4515 10.4535 10.454510.4554 10.4564 . 10.4582 10.4591 . 10.4608 10.4625 10.463310.4641 10.4649 . 10.4664 10.4671 . 10.4686 10.4699 10.470610.4713 10.4719 . 10.4732 10.4738 . 10.4750 10.4761 10.4767
10.4772 10.4778 . 10.4788 10.4793 . 10.4803 10.4812 10.4817
10.4821 10.4826 . 10.4834 10.4838 . 10.4846 10.4854 10.4857
10.4861 10.4864 . 10.4871 10.4875 . 10.4881 E14887 10.489010.4893 10.4896 . 10.4901 10.4904 . 10.4909 10.4913 10.4916
10.4918 10.4920 . 10.4925 10.4927 . 10.4931 10.4934 10.4936
10.4938 10.4940 . 10.4943 10.4945 . 10.4948 10.4951 10.4952
10.4953 10.4955 . 10.4957 10.4959.
. 10.4961 10.4963 10.4964
10.4965 10.4966 . 10.4968 10.4969 . 10.4971 17114973 “110497410.4974 10.4975 . 10.4977 10.4977
'
. 10.4979 10.4980 10.498110.4981 10.4982 . 10.4983 10.4984 . 10.4985 10.4986 10.498610.4987 10.4987 . 10.4988 10.4988 10.4989 10.4989 10.4990 10.4990
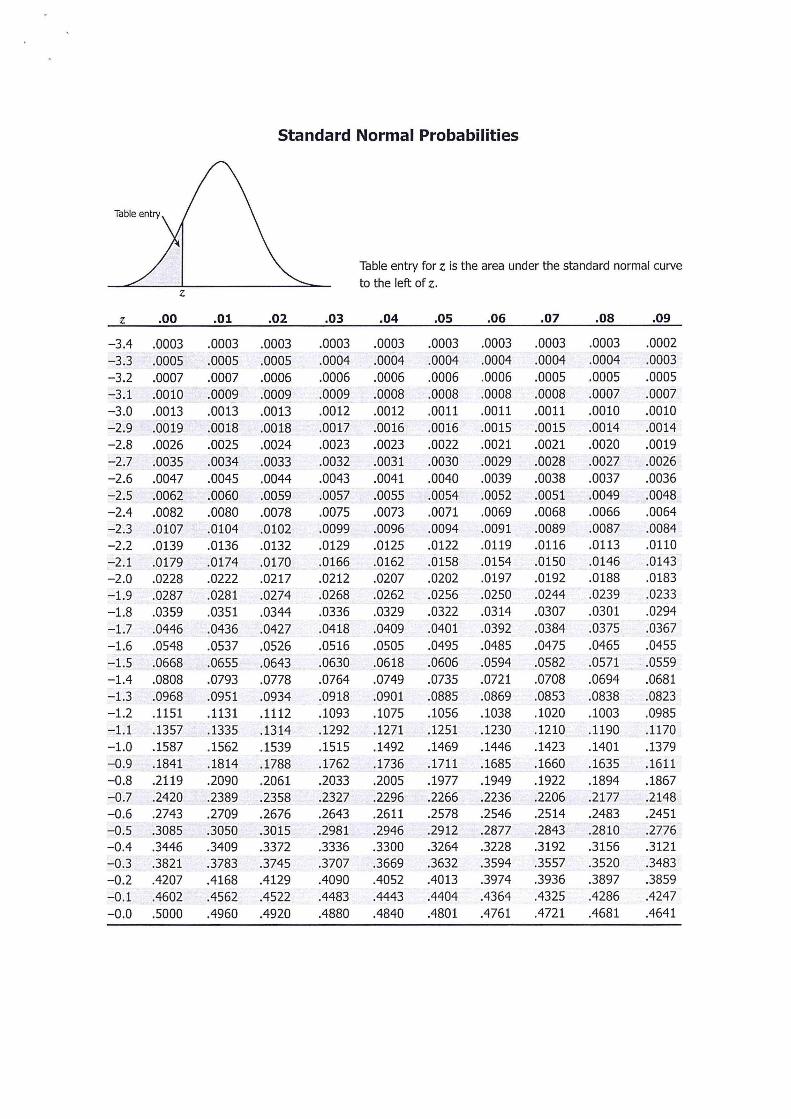
Standard Normal Probabilities
Table entry
Table entry for z is the area under the standard normal curve
z
to the left of z.
z .00 .01 .02 .03 .04 .05 .06 .07 .08 .09
—3.4 .0003 .0003 .0003 .0003 .0003 .0003 .0003 .0003 .0003 .0002
—3.3 .0005 .0005 .0005 .0004 .0004 .0004 .0004 .0004 .0004 .0003
—3.2 .0007 .0007 .0006 .0006 .0006 .0006 .0006 .0005 .0005 .0005
—3.1 .0010 .0009 .0009 .0009 .0008 .0008 .0008 .0008 .0007 .0007
—3.0 .0013 .0013 .0013 .0012 .0012 .0011 .0011 .0011 .0010 .0010
—2.9 .0019 .0018 .0018 .0017 .0016 .0016 .0015 .0015 .0014 .0014
—2.8 .0026 .0025 .0024 .0023 .0023 .0022 .0021 .0021 .0020 .0019
—2.7 .0035 .0034 .0033 .0032 .0031 .0030 .0029 .0028 .0027 .0026
—2.6 .0047 .0045 .0044 .0043 .0041 .0040 .0039 .0038 .0037 .0036
—2.5 .0062 .0060 .0059 .0057 .0055 .0054 .0052 .0051 .0049 .0048
—2.4 .0082 .0080 .0078 .0075 .0073 .0071 .0069 .0068 .0066 .0064
—2.3 .0107 .0104 .0102 .0099 .0096 .0094 .0091 .0089 .0087 .0084
-2.2 .0139 .0136 .0132 .0129 .0125 .0122 .0119 .0116 .0113 .0110
—2.1 .0179 .0174 .0170 .0166 .0162 .0158 .0154 .0150 .0146 .0143
—2.0 .0228 .0222 .0217 .0212 .0207 .0202 .0197 .0192 .0188 .0183
—1.9 .0287 .0281 .0274 .0268 .0262 .0256 .0250 .0244 .0239 .0233
—1.8 .0359 .0351 .0344 .0336 .0329 .0322 .0314 .0307 .0301 .0294
—1.7 .0446 .0436 .0427 .0418 .0409 .0401 .0392 .0384 .0375 .0367
—1.6 .0548 .0537 .0526 .0516 .0505 .0495 .0485 .0475 .0465 .0455
—1.5 .0668 .0655 .0643 .0630 .0618 .0606 .0594 .0582 .0571 .0559
—1.4 .0808 .0793 .0778 .0764 .0749 .0735 .0721 .0708 .0694 .0681
—1.3 .0968 .0951 .0934 .0918 .0901 .0885 .0869 .0853 .0838 .0823
—1.2 .1151 .1131 .1112 .1093 .1075 .1056 .1038 .1020 .1003 .0985
—1.1 .1357 .1335 .1314 .1292 .1271 .1251 .1230 .1210 .1190 .1170
—1.0 .1587 .1562 .1539 .1515 .1492 .1469 .1446 .1423 .1401 .1379
—0.9 .1841 .1814 .1788 .1762 .1736 .1711 .1685 .1660 .1635 .1611
—0.8 .2119 .2090 .2061 .2033 .2005 .1977 .1949 .1922 .1894 .1867
—O.7 .2420 .2389 .2358 .2327 .2296 .2266 .2236 .2206 .2177 .2148
—0.6 .2743 .2709 .2676 .2643 .2611 .2578 .2546 .2514 .2483 .2451
—0.5 .3085 .3050 .3015 .2981 .2946 .2912 .2877 .2843 .2810 .2776
—0.4 .3446 .3409 .3372 .3336 .3300 .3264 .3228 .3192 .3156 .3121
—0.3 .3821 .3783 .3745 .3707 .3669 .3632 .3594 .3557 .3520 .3483
—0.2 .4207 .4168 .4129 .4090 .4052 .4013 .3974 .3936 .3897 .3859
—0.1 .4602 .4562 .4522 .4483 .4443 .4404 .4364 .4325 .4286 .4247
—0.0 .5000 .4960 .4920 .4880 .4840 .4801 .4761 .4721 .4681 .4641
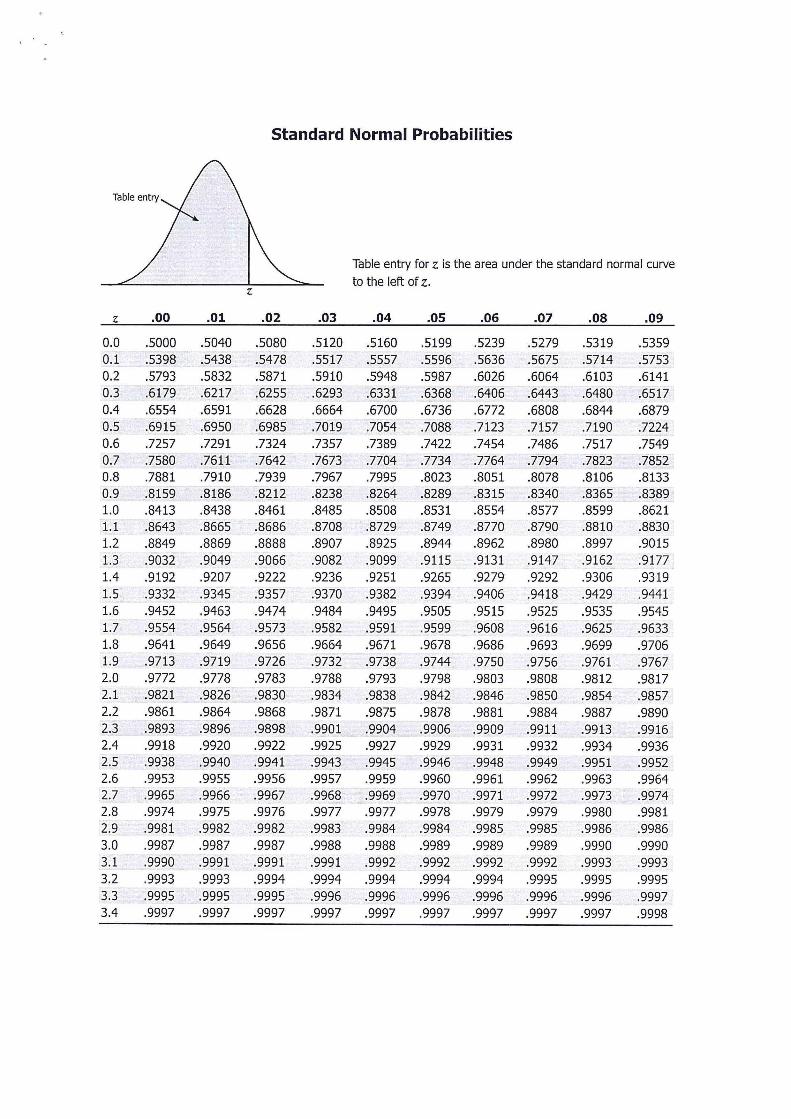
Standard Normal Probabilities
Table entry
Table entry for z is the area under the standard normal curve
to the left of z.
z .00 .01 .02 .03 .04 .05 .06 .07 .08 .09
0.0 .5000 .5040 .5080 .5120 .5160 .5199 .5239 .5279 .5319 .5359
0.1 .5398 .5438 .5478 .5517 .5557 .5596 .5636 .5675 .5714 .5753
0.2 .5793 .5832 .5871 .5910 .5948 .5987 .6026 .6064 .6103 .6141
0.3 .6179 .6217 .6255 .6293 .6331 .6368 .6406 .6443 .6480 .6517
0.4 .6554 .6591 .6628 .6664 .6700 .6736 .6772 .6808 .6844 .6879
0.5 .6915 .6950 .6985 .7019 .7054 .7088 .7123 .7157 .7190 .7224
0.6 .7257 .7291 .7324 .7357 .7389 .7422 .7454 .7486 .7517 .7549
0.7 .7580 .7611 .7642 .7673 .7704 .7734 .7764 .7794 .7823 .7852
0.8 .7881 .7910 .7939 .7967 .7995 .8023 .8051 .8078 .8106 .8133
0.9 .8159 .8186 .8212 .8238 .8264 .8289 .8315 .8340 .8365 .8389
1.0 .8413 .8438 .8461 .8485 .8508 .8531 .8554 .8577 .8599 .8621
1.1 .8643 .8665 .8686 .8708 .8729 .8749 .8770 .8790 .8810 .8830
1.2 .8849 .8869 .8888 .8907 .8925 .8944 .8962 .8980 .8997 .9015
1.3 .9032 .9049 .9066 .9082 .9099 .9115 .9131 .9147 .9162 .9177
1.4 .9192 .9207 .9222 .9236 .9251 .9265 .9279 .9292 .9306 .9319
1.5 .9332 .9345 .9357 .9370 .9382 .9394 .9406 .9418 .9429 .9441
1.6 .9452 .9463 .9474 .9484 .9495 .9505 .9515 .9525 .9535 .9545
1.7 .9554 .9564 .9573 .9582 .9591 .9599 .9608 .9616 .9625 .9633
1.8 .9641 .9649 .9656 .9664 .9671 .9678 .9686 .9693 .9699 .9706
1.9 .9713 .9719 .9726 .9732 .9738 .9744 .9750 .9756 .9761 .9767
2.0 .9772 .9778 .9783 .9788 .9793 .9798 .9803 .9808 .9812 .9817
2.1 .9821 .9826 .9830 .9834 .9838 .9842 .9846 .9850 .9854 .9857
2.2 .9861 .9864 .9868 .9871 .9875 .9878 .9881 .9884 .9887 .9890
2.3 .9893 .9896 .9898 .9901 .9904 .9906 .9909 .9911 .9913 .9916
2.4 .9918 .9920 .9922 .9925 .9927 .9929 .9931 .9932 .9934 .9936
2.5 .9938 .9940 .9941 .9943 .9945 .9946 .9948 .9949 .9951 .9952
2.6 .9953 .9955 .9956 .9957 .9959 .9960 .9961 .9962 .9963 .9964
2.7 .9965 .9966 .9967 .9968 .9969 .9970 .9971 .9972 .9973 .9974
2.8 .9974 .9975 .9976 .9977 .9977 .9978 .9979 .9979 .9980 .9981
2.9 .9981 .9982 .9982 .9983 .9984 .9984 .9985 .9985 .9986 .9986
3.0 .9987 .9987 .9987 .9988 .9988 .9989 .9989 .9989 .9990 .9990
3.1 .9990 .9991 .9991 .9991 .9992 .9992 .9992 .9992 .9993 .9993
3.2 .9993 .9993 .9994 .9994 .9994 .9994 .9994 .9995 .9995 .9995
3.3 .9995 .9995 .9995 .9996 .9996 .9996 .9996 .9996 .9996 .9997
3.4 .9997 .9997 .9997 .9997 .9997 .9997 .9997 .9997 .9997 .9998


![07BECO LEVEL: 7 COURSECODE:IMI611S ...exampapers.nust.na/greenstone3/sites/localsite...d) Monopolisticcompetition [5 marks] QUESTIONFOUR [20MARKS] a) Explainhowinformationonprices](https://img.pdfslide.us/doc/110x75/604435d43a6e6c77e51df407/07beco-level-7-coursecodeimi611s-d-monopolisticcompetition-5-marks.jpg)

![OF SCIENCE ANDTECHNOLOGYexampapers.nust.na/greenstone3/sites/localsite/collect... · 2019-02-14 · (d) Namethe2 autoregressive modelswhichare rationalisations ofthe Koyckmodel? [2]](https://img.pdfslide.us/doc/110x75/5e69207fde429478f829a9eb/of-science-and-2019-02-14-d-namethe2-autoregressive-modelswhichare-rationalisations.jpg)


![NAMIBIA UNIVERSITY OF SCIENCE ANDTECHNOLOGYexampapers.nust.na/greenstone3/sites/localsite... · Question6[16marks] 6.1 Quality managementisboth an organizational and an individual](https://img.pdfslide.us/doc/110x75/5e890a46a9de5e3e2c0717b2/namibia-university-of-science-and-question616marks-61-quality-managementisboth.jpg)