Embed Size (px)
Citation preview
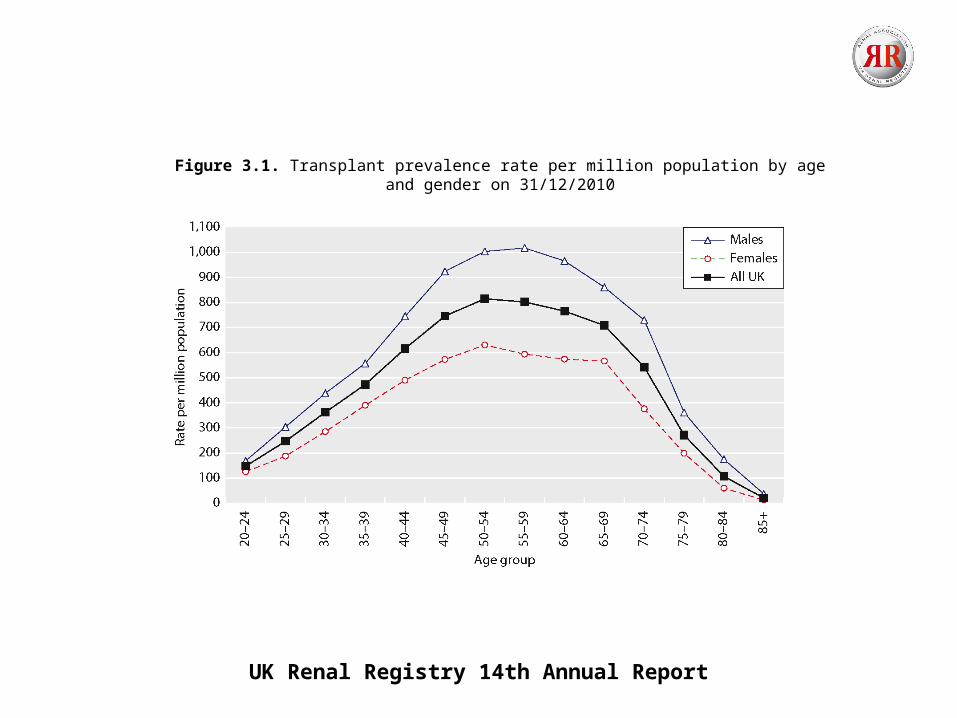
UK Renal Registry 14th Annual Report
Figure 3.1. Transplant prevalence rate per million population by ageand gender on 31/12/2010
UK Renal Registry 14th Annual Report
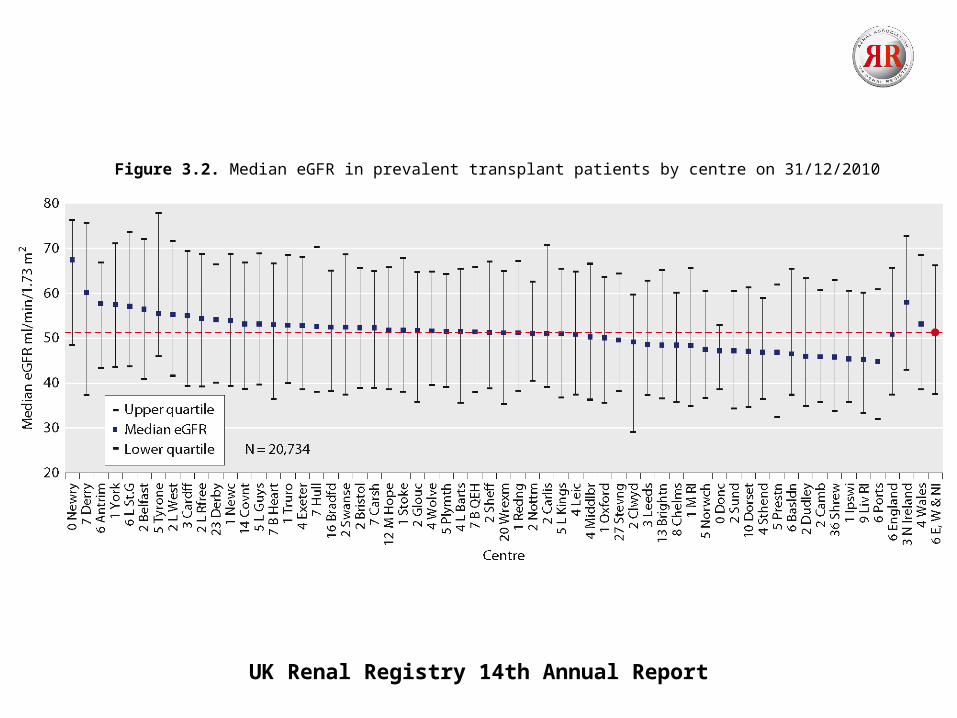
Figure 3.2. Median eGFR in prevalent transplant patients by centre on 31/12/2010
UK Renal Registry 14th Annual Report
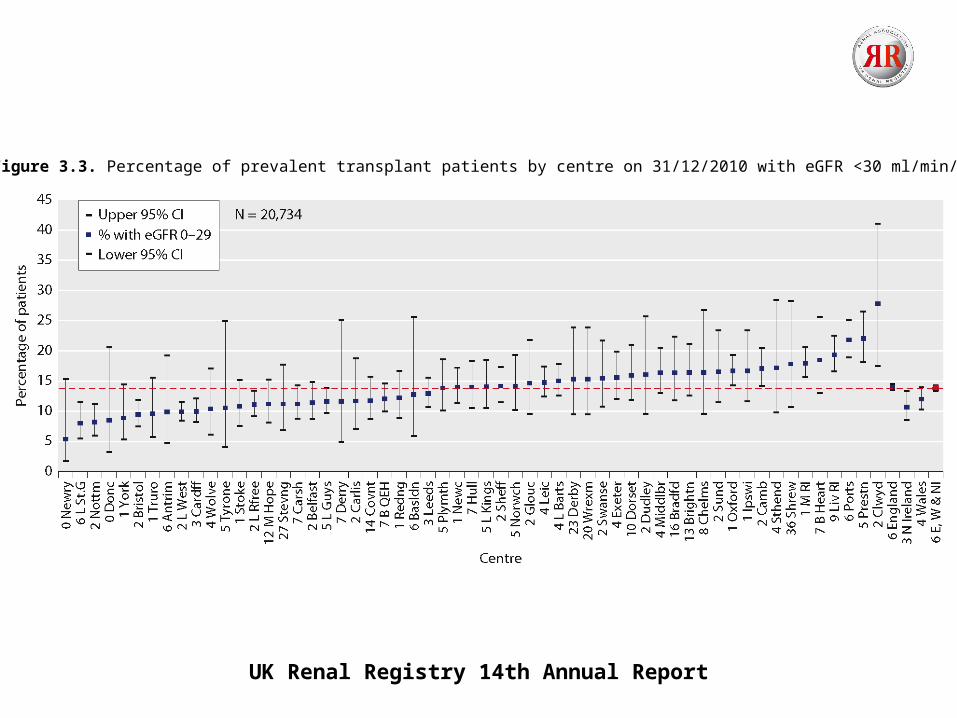
Figure 3.3. Percentage of prevalent transplant patients by centre on 31/12/2010 with eGFR <30 ml/min/1.73 m 2
UK Renal Registry 14th Annual Report
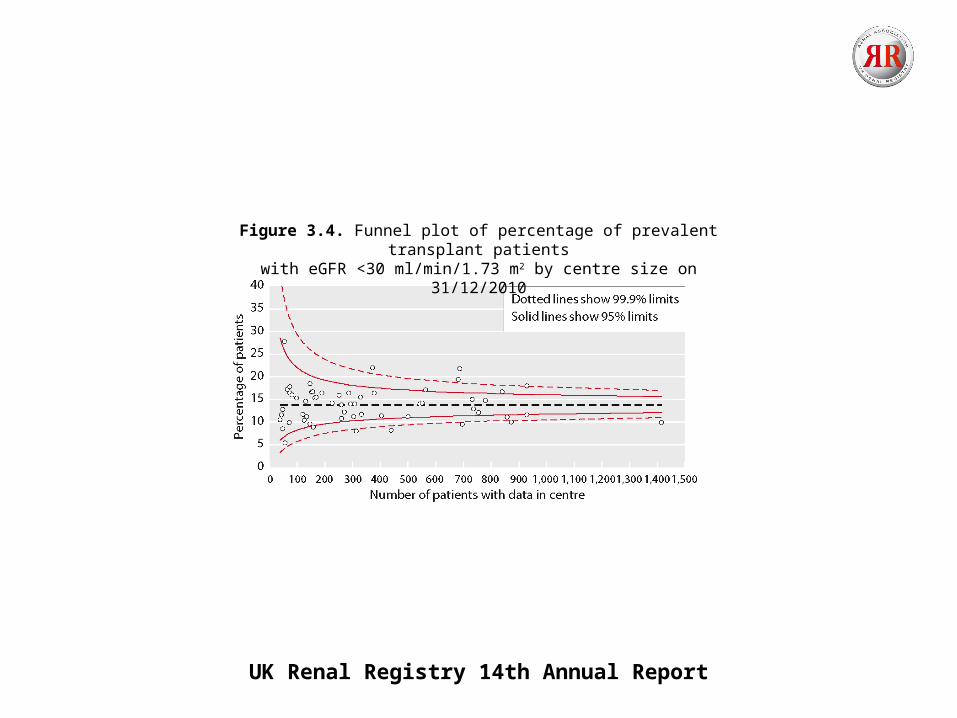
Figure 3.4. Funnel plot of percentage of prevalent transplant patientswith eGFR <30 ml/min/1.73 m2 by centre size on 31/12/2010
UK Renal Registry 14th Annual Report
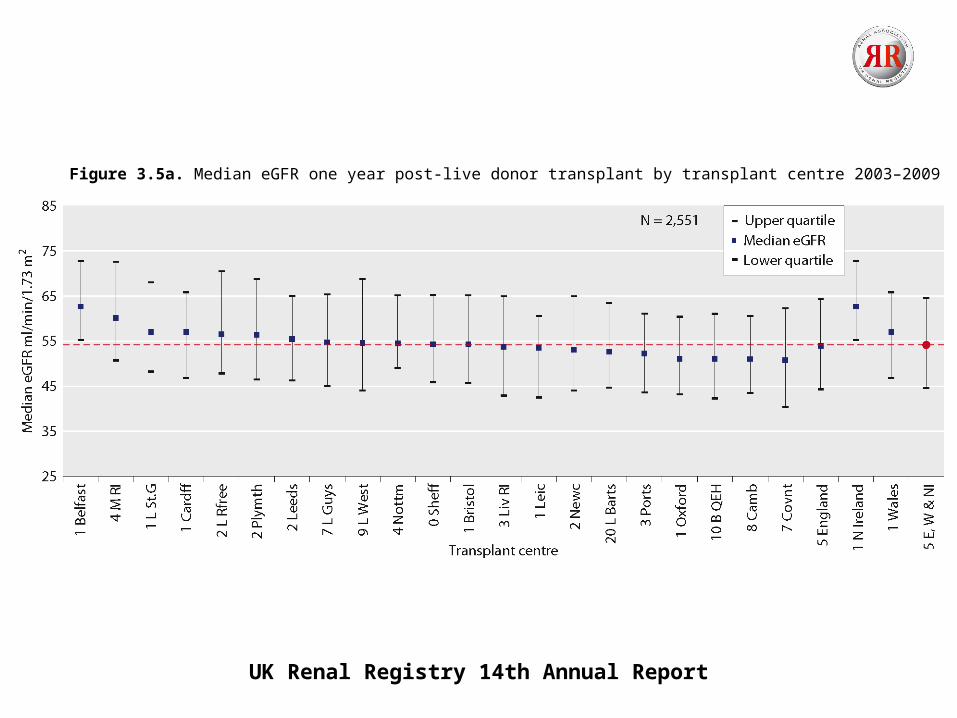
Figure 3.5a. Median eGFR one year post-live donor transplant by transplant centre 2003–2009
UK Renal Registry 14th Annual Report
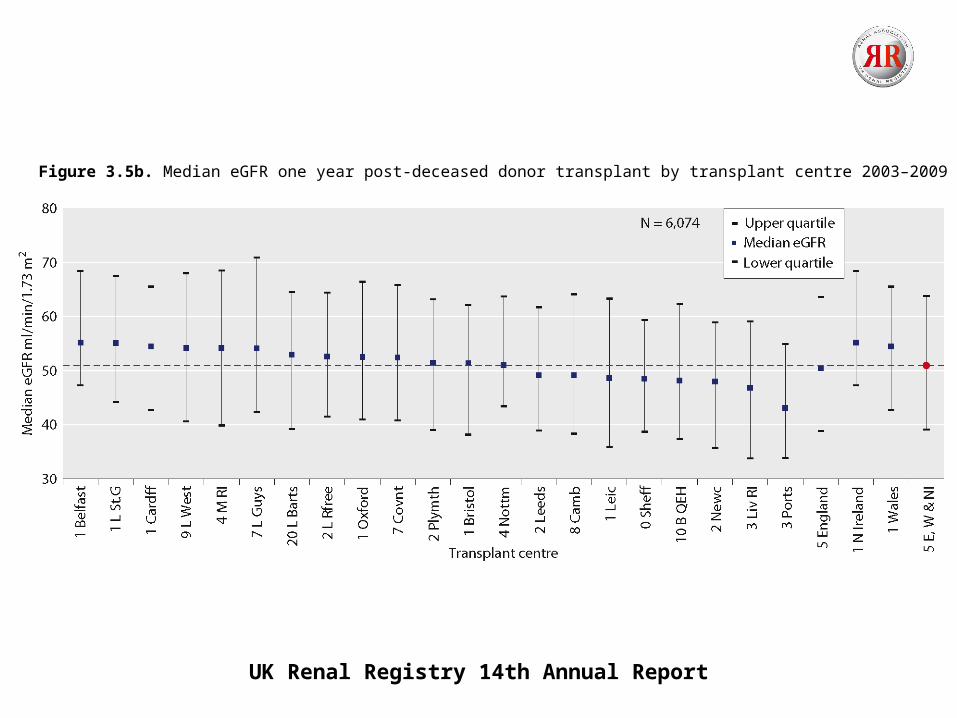
Figure 3.5b. Median eGFR one year post-deceased donor transplant by transplant centre 2003–2009
UK Renal Registry 14th Annual Report
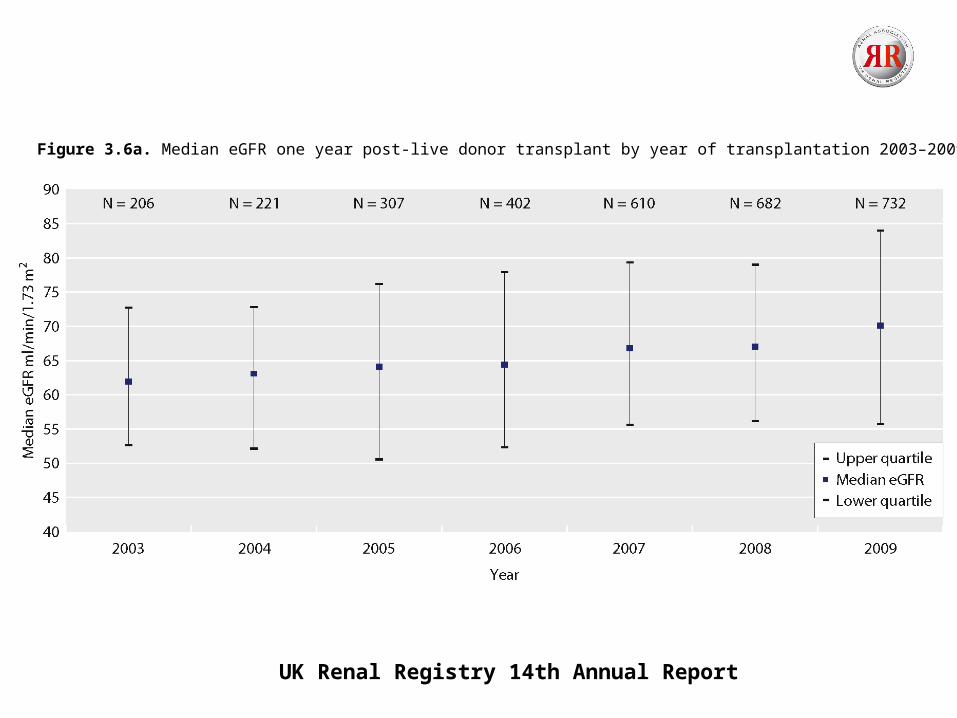
Figure 3.6a. Median eGFR one year post-live donor transplant by year of transplantation 2003–2009
UK Renal Registry 14th Annual Report
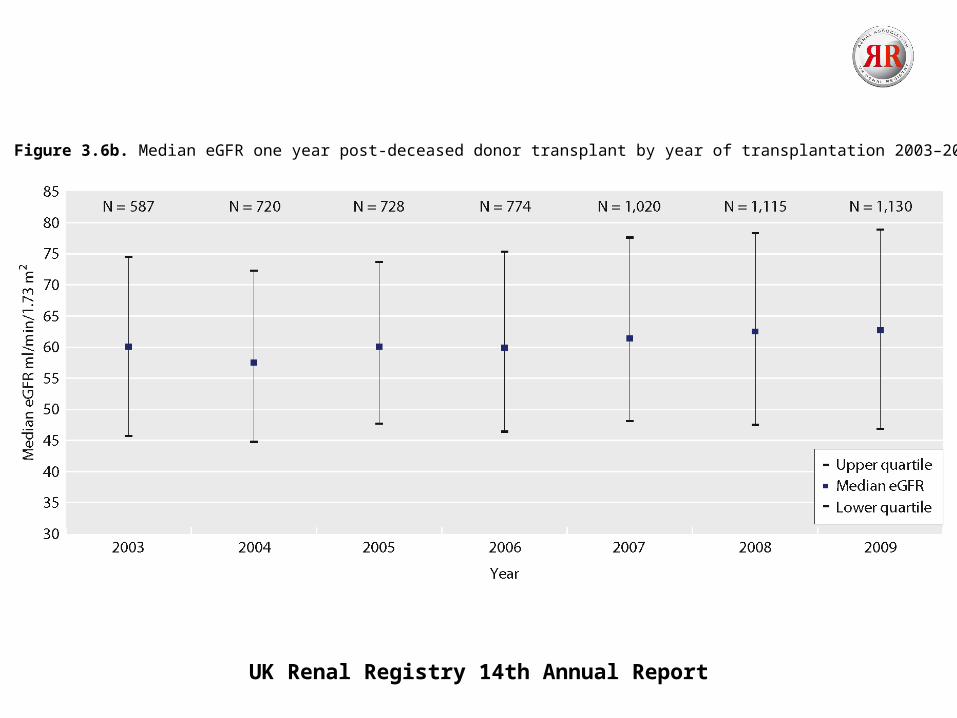
Figure 3.6b. Median eGFR one year post-deceased donor transplant by year of transplantation 2003–2009
UK Renal Registry 14th Annual Report
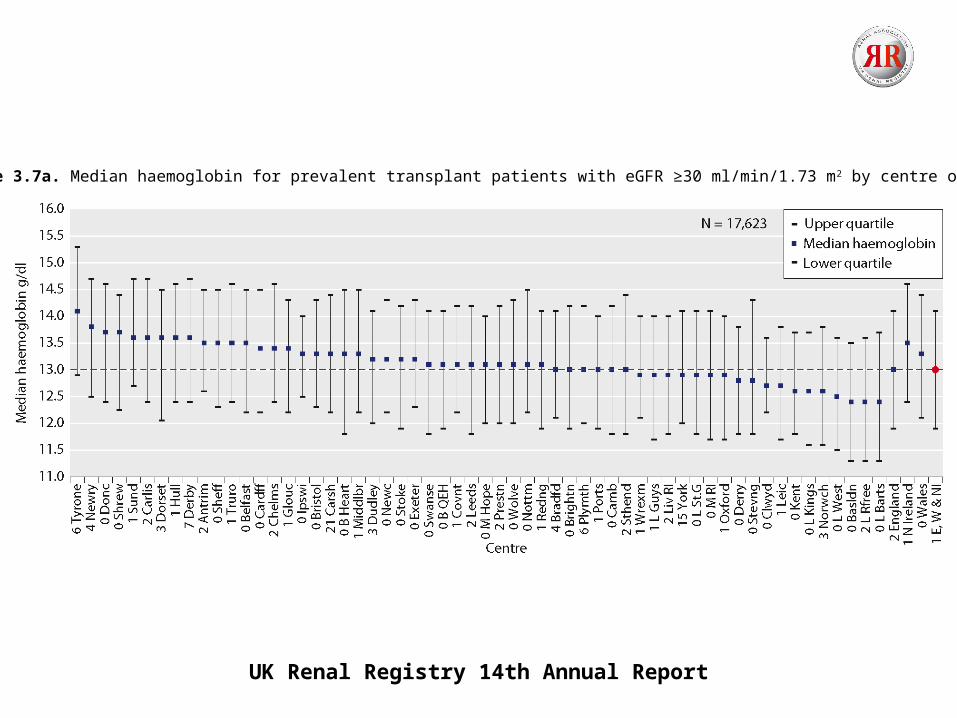
Figure 3.7a. Median haemoglobin for prevalent transplant patients with eGFR ≥30 ml/min/1.73 m2 by centre on 31/12/2010
UK Renal Registry 14th Annual Report
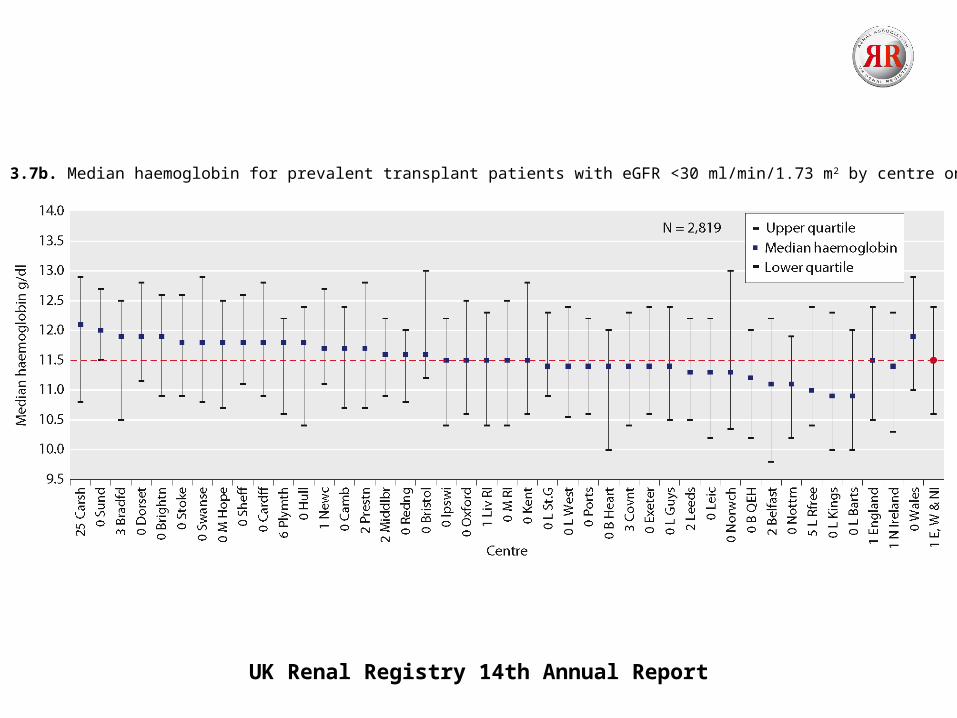
Figure 3.7b. Median haemoglobin for prevalent transplant patients with eGFR <30 ml/min/1.73 m2 by centre on 31/12/2010
UK Renal Registry 14th Annual Report
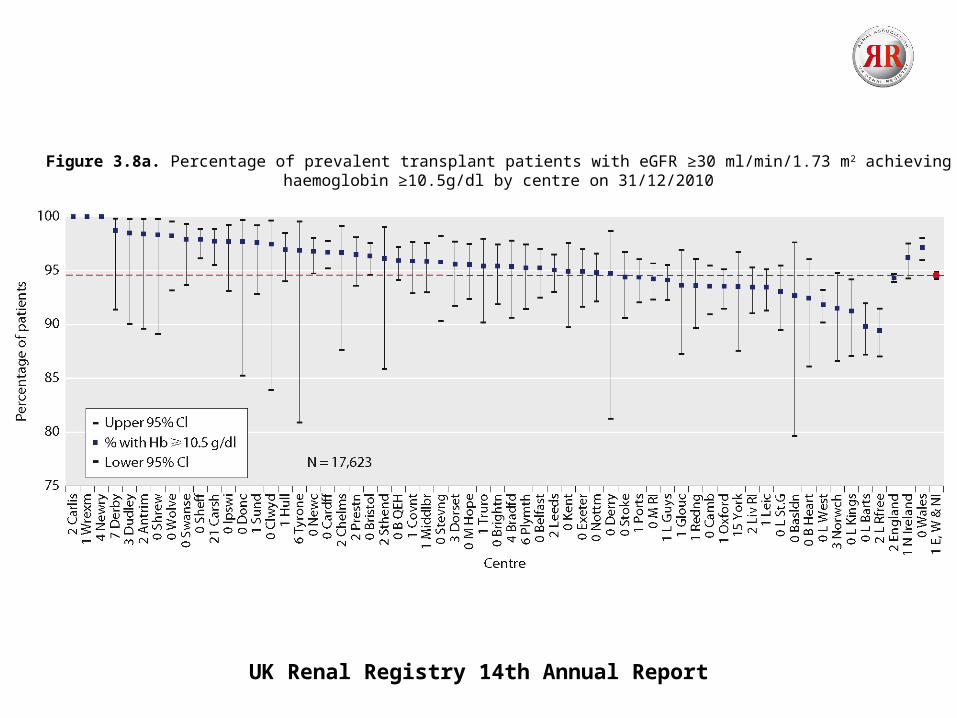
Figure 3.8a. Percentage of prevalent transplant patients with eGFR ≥30 ml/min/1.73 m2 achievinghaemoglobin ≥10.5g/dl by centre on 31/12/2010
UK Renal Registry 14th Annual Report
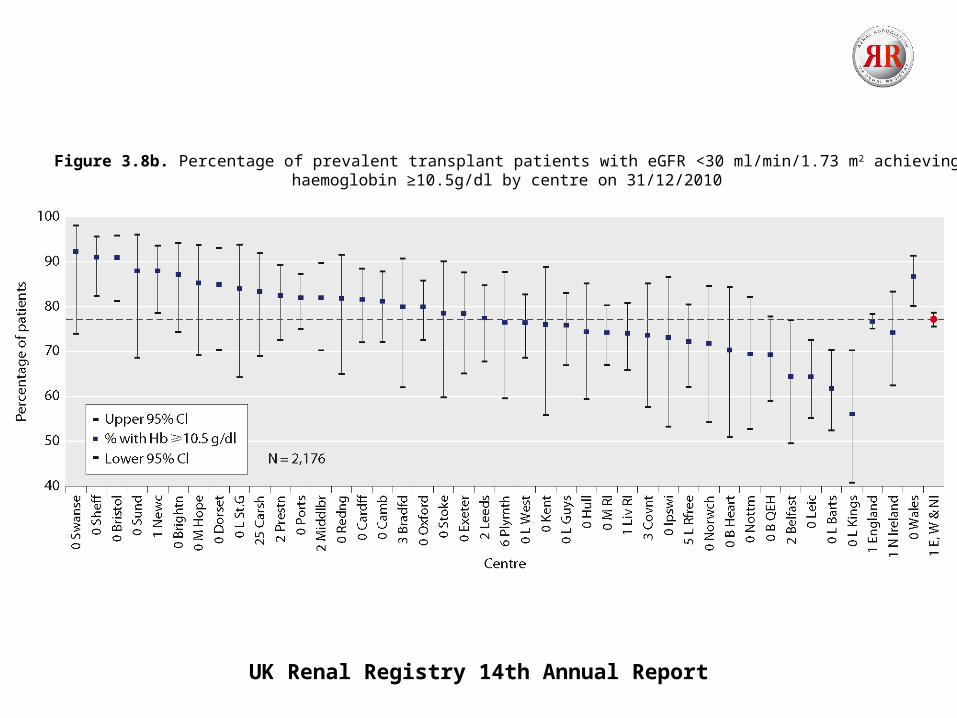
Figure 3.8b. Percentage of prevalent transplant patients with eGFR <30 ml/min/1.73 m2 achievinghaemoglobin ≥10.5g/dl by centre on 31/12/2010
UK Renal Registry 14th Annual Report
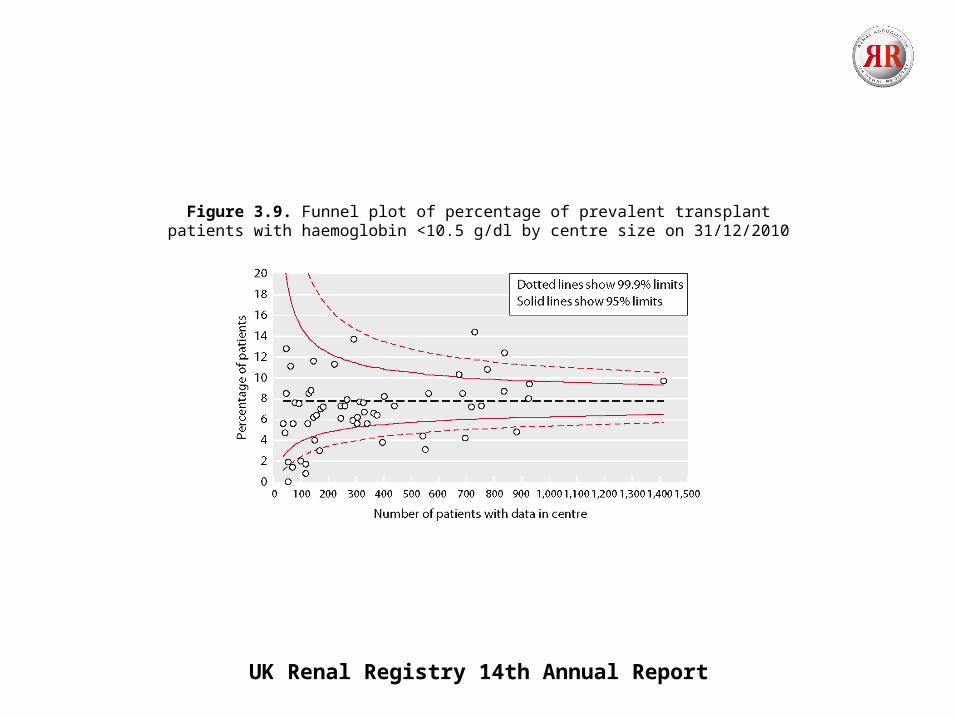
Figure 3.9. Funnel plot of percentage of prevalent transplantpatients with haemoglobin <10.5 g/dl by centre size on 31/12/2010
UK Renal Registry 14th Annual Report
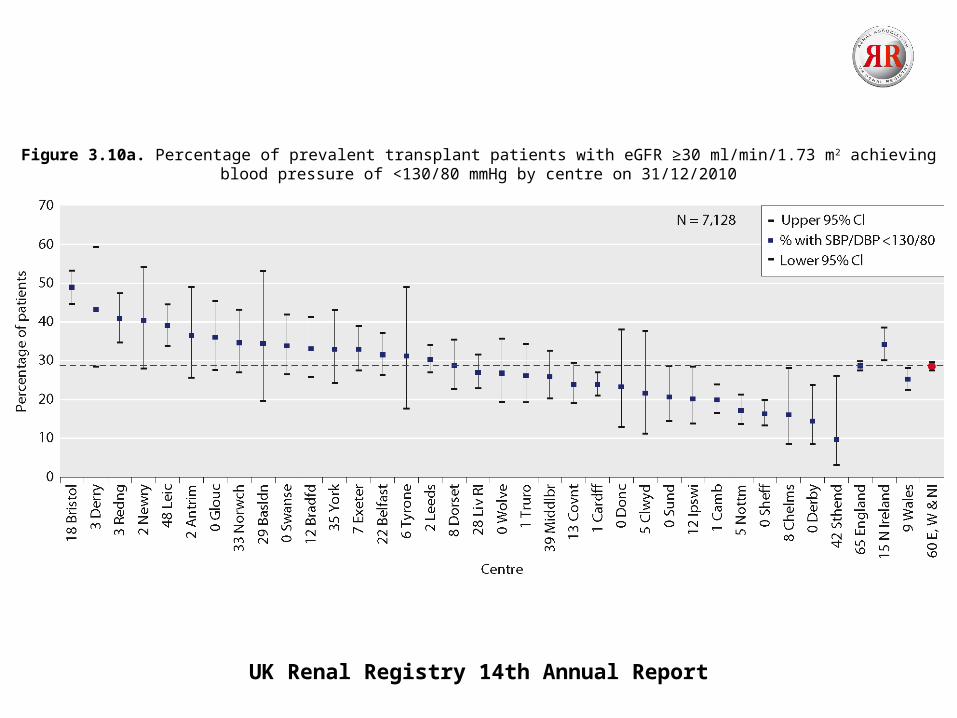
Figure 3.10a. Percentage of prevalent transplant patients with eGFR ≥30 ml/min/1.73 m2 achievingblood pressure of <130/80 mmHg by centre on 31/12/2010
UK Renal Registry 14th Annual Report
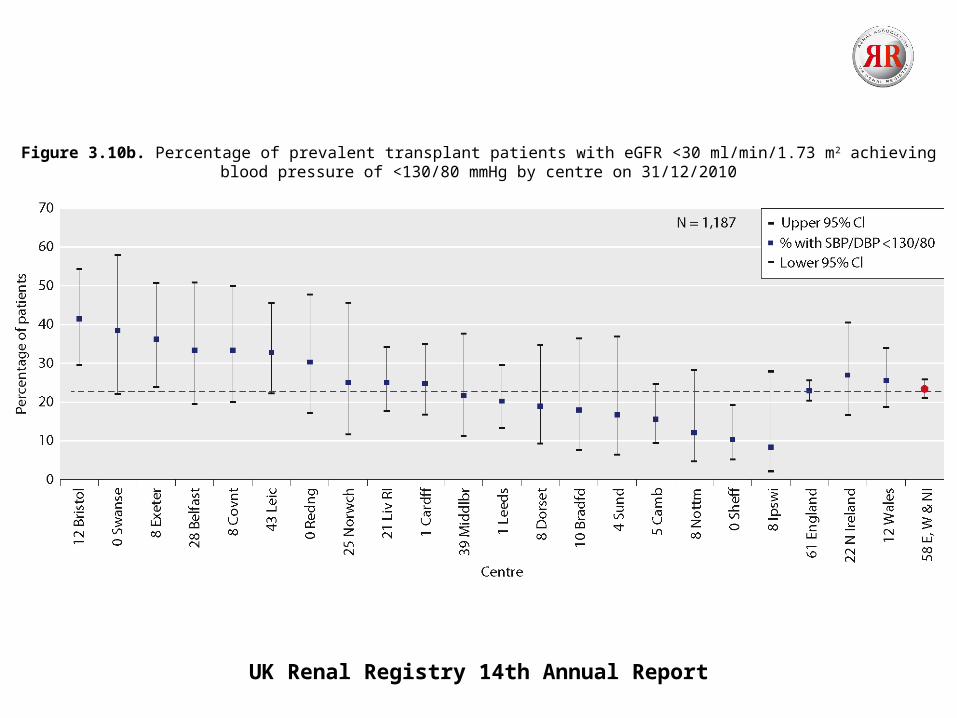
Figure 3.10b. Percentage of prevalent transplant patients with eGFR <30 ml/min/1.73 m2 achievingblood pressure of <130/80 mmHg by centre on 31/12/2010
UK Renal Registry 14th Annual Report
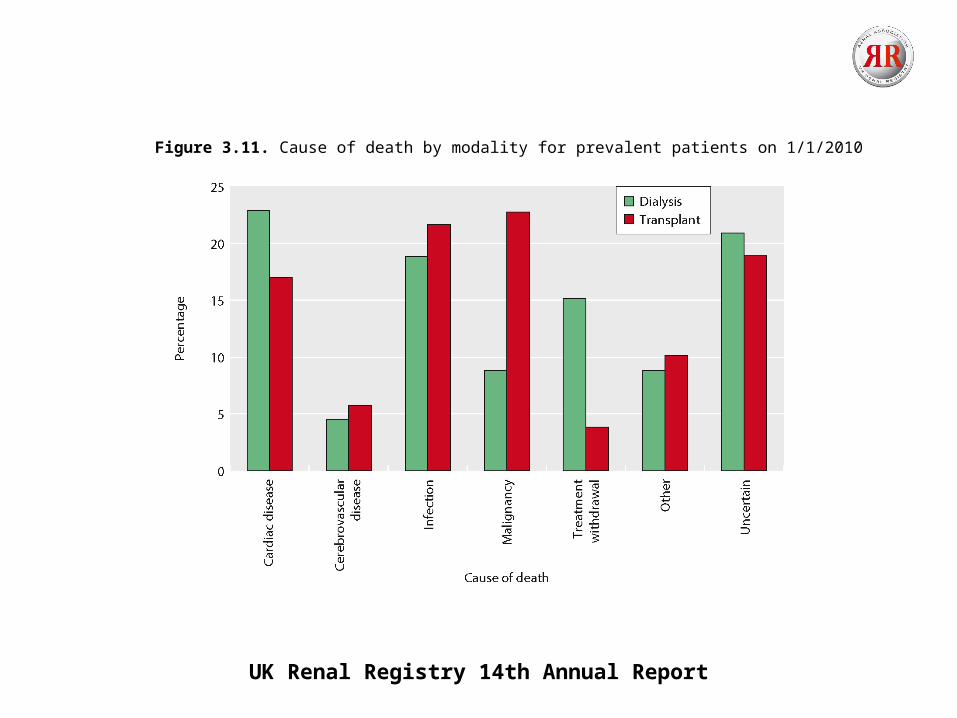
Figure 3.11. Cause of death by modality for prevalent patients on 1/1/2010