Embed Size (px)
DESCRIPTION
Fig 8.1 Median haemoglobin for incident dialysis patients at start of dialysis treatment. UK Renal Registry 10th Annual Report 2007. Fig 8.2 Percentage of incident dialysis patients with Hb ≥10g/dl at start of dialysis treatment. UK Renal Registry 10th Annual Report 2007. - PowerPoint PPT Presentation
Citation preview
UK Renal Registry 10th Annual Report 2007
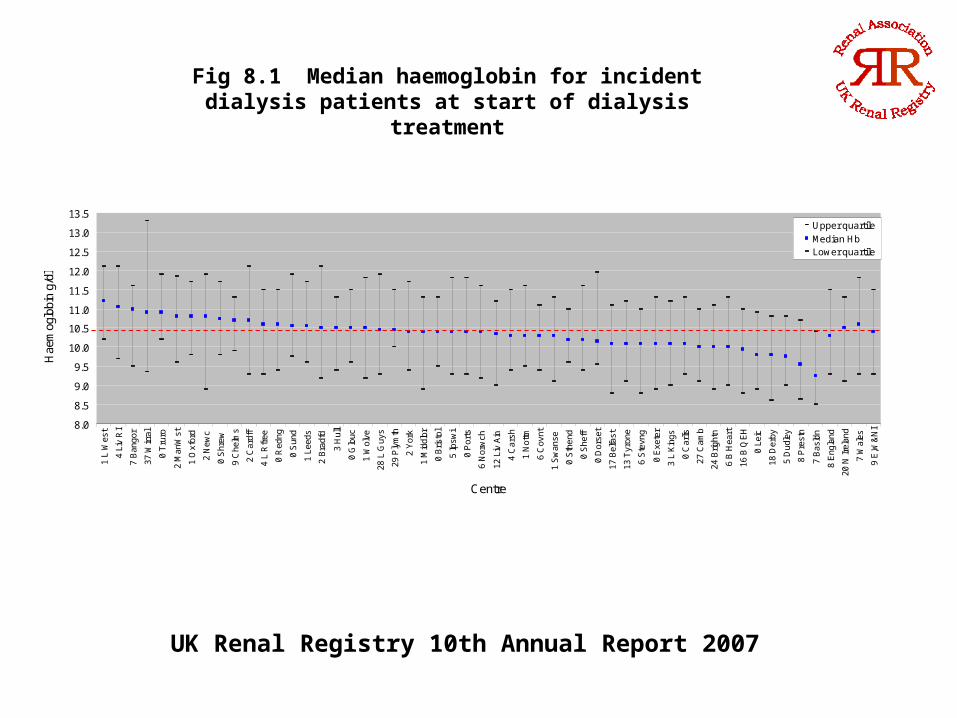
Fig 8.1 Median haemoglobin for incident dialysis patients at start of dialysis treatment
8.0
8.5
9.0
9.5
10.0
10.5
11.0
11.5
12.0
12.5
13.0
13.5
1 L
Wes
t
4 L
iv R
I
7 B
ango
r
37 W
irral
0 T
ruro
2 M
anW
st
1 O
xfor
d
2 N
ewc
0 S
hrew
9 C
helm
s
2 C
ardf
f
4 L
Rfr
ee
0 R
edng
0 S
und
1 L
eeds
2 B
radf
d
3 H
ull
0 G
louc
1 W
olve
28 L
Guy
s
29 P
lym
th
2 Y
ork
1 M
iddl
br
0 B
risto
l
5 Ip
swi
0 P
orts
6 N
orw
ch
12 L
iv A
in
4 C
arsh
1 N
ottm
6 C
ovnt
1 S
wan
se
0 S
then
d
0 S
heff
0 D
orse
t
17 B
elfa
st
13 T
yron
e
6 S
tevn
g
0 E
xete
r
3 L
Kin
gs
0 C
arlis
27 C
amb
24 B
right
n
6 B
Hea
rt
16 B
QE
H
0 L
eic
18 D
erby
5 D
udle
y
8 P
rest
n
7 B
asld
n
8 E
ngla
nd
20 N
Irel
and
7 W
ales
9 E
,W&
NI
Centre
Hae
mog
lobi
n g/
dl
Upper quartile
Median HbLower quartile
N = 4,643
UK Renal Registry 10th Annual Report 2007
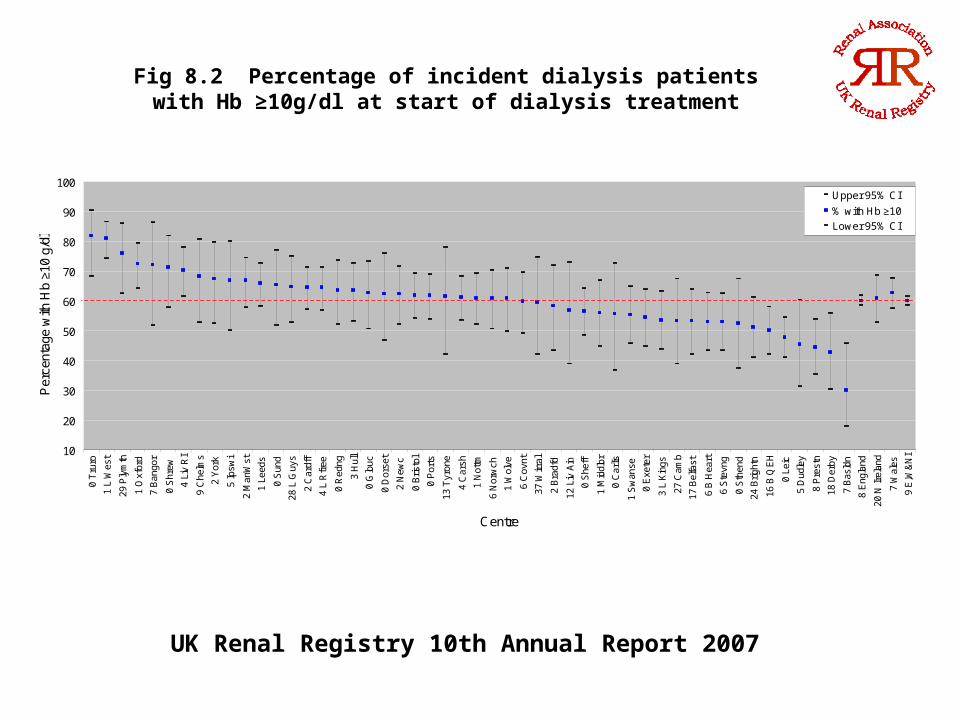
Fig 8.2 Percentage of incident dialysis patients with Hb ≥10g/dl at start of dialysis treatment
10
20
30
40
50
60
70
80
90
100
0 T
ruro
1 L
Wes
t
29 P
lym
th
1 O
xfor
d
7 B
ango
r
0 S
hrew
4 L
iv R
I
9 C
helm
s
2 Y
ork
5 Ip
swi
2 M
anW
st
1 L
eeds
0 S
und
28 L
Guy
s
2 C
ardf
f
4 L
Rfr
ee
0 R
edng
3 H
ull
0 G
louc
0 D
orse
t
2 N
ewc
0 B
risto
l
0 P
orts
13 T
yron
e
4 C
arsh
1 N
ottm
6 N
orw
ch
1 W
olve
6 C
ovnt
37 W
irral
2 B
radf
d
12 L
iv A
in
0 S
heff
1 M
iddl
br
0 C
arlis
1 S
wan
se
0 E
xete
r
3 L
Kin
gs
27 C
amb
17 B
elfa
st
6 B
Hea
rt
6 S
tevn
g
0 S
then
d
24 B
right
n
16 B
QE
H
0 L
eic
5 D
udle
y
8 P
rest
n
18 D
erby
7 B
asld
n
8 E
ngla
nd
20 N
Irel
and
7 W
ales
9 E
,W&
NI
Centre
Per
cent
age
with
Hb
≥10
g/dl
Upper 95% CI
% with Hb ≥10
Lower 95% CI
N = 4,643
UK Renal Registry 10th Annual Report 2007
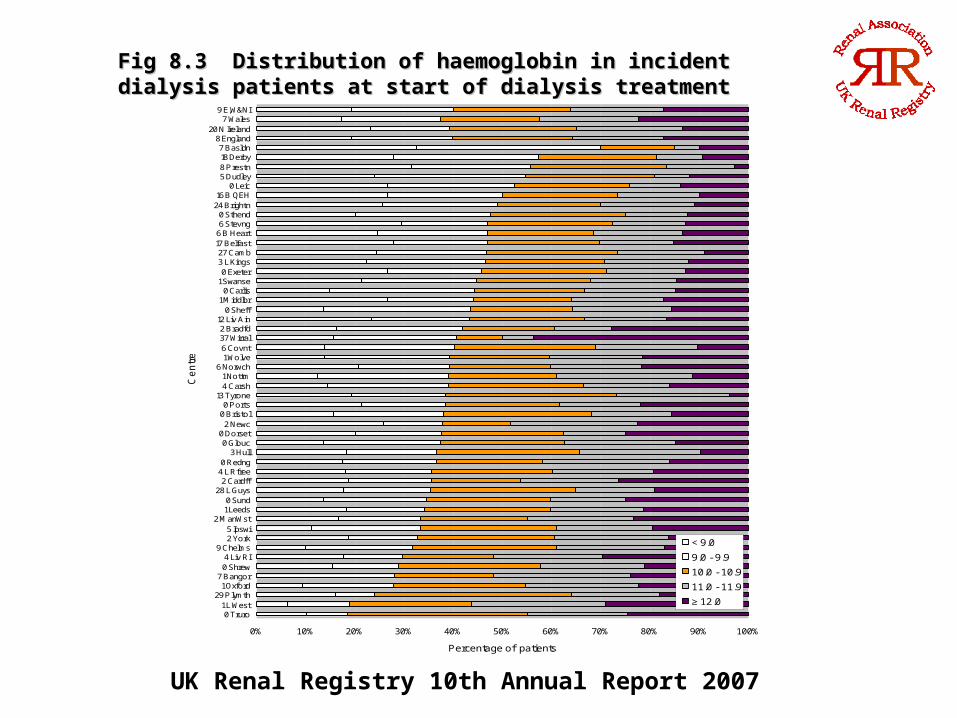
Fig 8.3 Distribution of haemoglobin in incident dialysis patients Fig 8.3 Distribution of haemoglobin in incident dialysis patients at start of dialysis treatmentat start of dialysis treatment
0% 10% 20% 30% 40% 50% 60% 70% 80% 90% 100%
0 Truro 1 L West
29 Plymth 1 Oxford
7 Bangor 0 Shrew 4 Liv RI
9 Chelms 2 York 5 Ipswi
2 ManWst 1 Leeds 0 Sund
28 L Guys 2 Cardff
4 L Rfree 0 Redng
3 Hull 0 Glouc
0 Dorset 2 Newc
0 Bristol 0 Ports
13 Tyrone 4 Carsh 1 Nottm
6 Norwch 1 Wolve 6 Covnt37 Wirral 2 Bradfd12 Liv Ain
0 Sheff 1 Middlbr 0 Carlis
1 Swanse 0 Exeter
3 L Kings27 Camb17 Belfast 6 B Heart 6 Stevng 0 Sthend
24 Brightn16 B QEH
0 Leic 5 Dudley 8 Prestn18 Derby
7 Basldn 8 England
20 N Ireland 7 Wales
9 E,W&NI
Ce
ntr
e
Percentage of patients
< 9.0
9.0 - 9.9
10.0 - 10.9
11.0 - 11.9
≥ 12.0
UK Renal Registry 10th Annual Report 2007
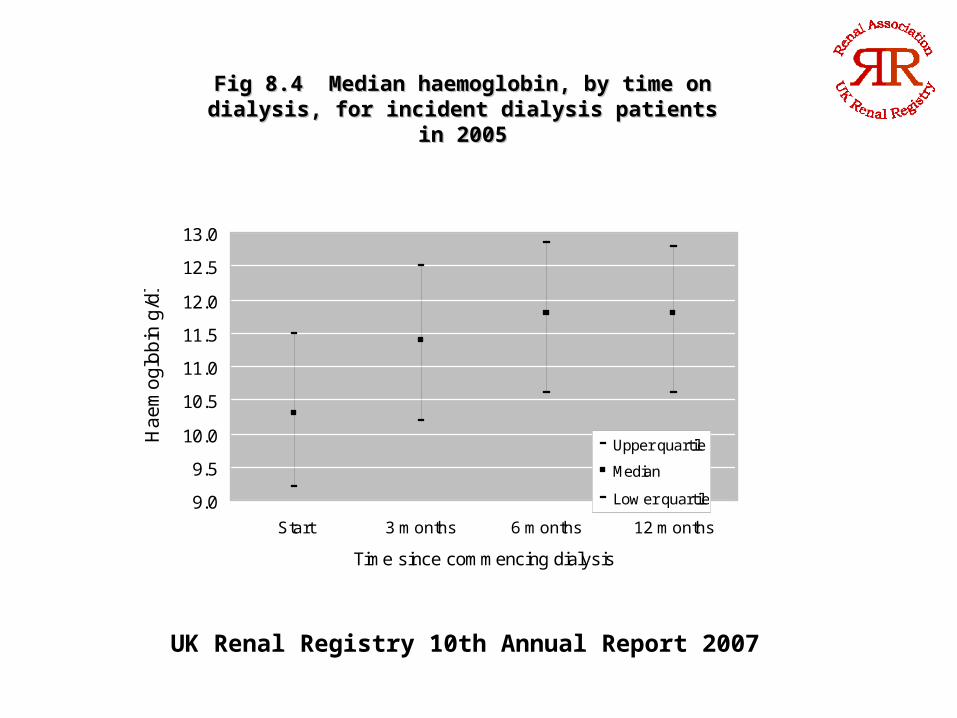
Fig 8.4 Median haemoglobin, by time on dialysis, Fig 8.4 Median haemoglobin, by time on dialysis, for incident dialysis patients in 2005for incident dialysis patients in 2005
9.0
9.5
10.0
10.5
11.0
11.5
12.0
12.5
13.0
Start 3 months 6 months 12 months
Time since commencing dialysis
Ha
em
og
lob
in g
/dl
Upper quartile
Median
Low er quartile
UK Renal Registry 10th Annual Report 2007
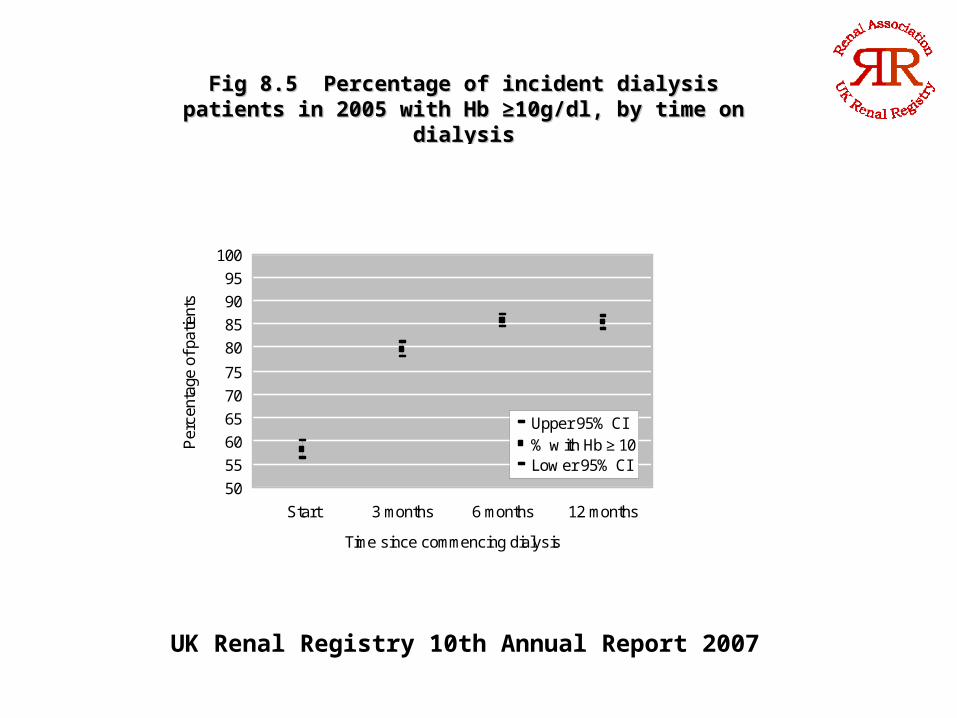
Fig 8.5 Percentage of incident dialysis patients in 2005 Fig 8.5 Percentage of incident dialysis patients in 2005 with Hb ≥10g/dl, by time on dialysiswith Hb ≥10g/dl, by time on dialysis
50
55
60
65
70
75
80
85
90
95
100
Start 3 months 6 months 12 months
Time since commencing dialysis
Per
cent
age
of p
atie
nts
Upper 95% CI% w ith Hb ≥ 10Low er 95% CI
UK Renal Registry 10th Annual Report 2007
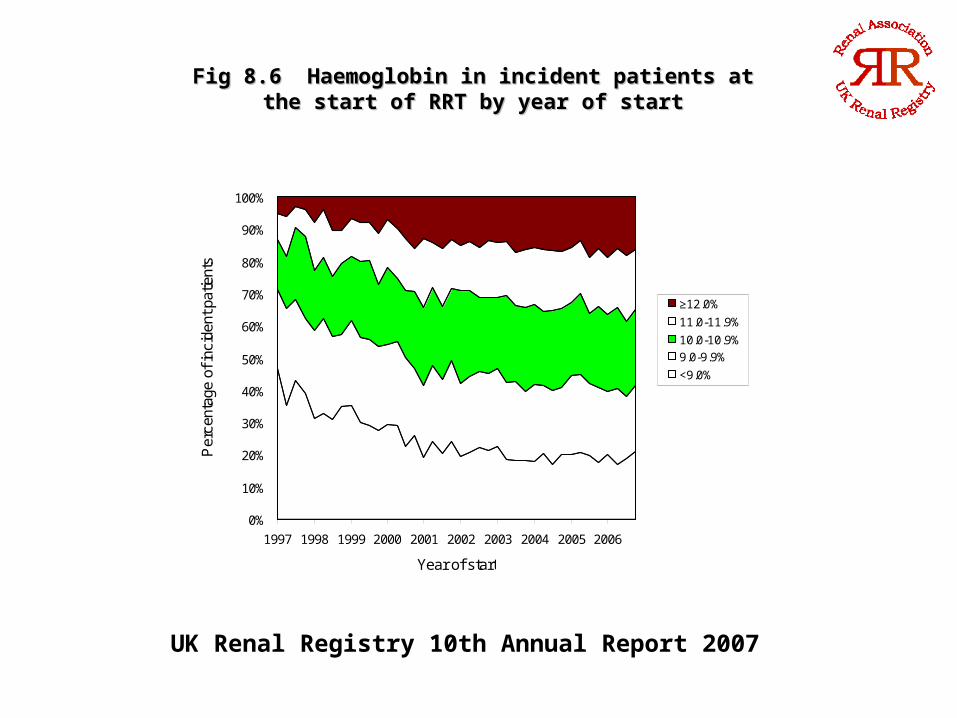
Fig 8.6 Haemoglobin in incident patients at the start of RRT Fig 8.6 Haemoglobin in incident patients at the start of RRT by year of startby year of start
0%
10%
20%
30%
40%
50%
60%
70%
80%
90%
100%
1997 1998 1999 2000 2001 2002 2003 2004 2005 2006
Year of start
Per
cent
age
of in
cide
nt p
atie
nts
≥12.0%
11.0-11.9%
10.0-10.9%
9.0-9.9%
<9.0%

UK Renal Registry 10th Annual Report 2007
Fig 8.7 Median haemoglobin: HDFig 8.7 Median haemoglobin: HD
9.0
9.5
10.0
10.5
11.0
11.5
12.0
12.5
13.0
13.5
14.0
19 C
hest
r 3
Liv
RI
1 Y
ork
1 W
olve
1 A
irdrie
2 E
dinb
1 L
eeds
0 N
ewc
4 D
&Gal
l 0
Bra
dfd
13 L
Rfre
e 1
L W
est
8 C
lwyd
3 A
ntrim
4 T
yron
e 1
Lei
c 1
Oxf
ord
3 B
QEH
2 D
unfn
0 In
vern
s 5
Car
lis 2
Car
dff
2 D
unde
e 0
Shr
ew 5
Wirr
al 1
Mid
dlbr
2 A
brdn
5 B
elfa
st 0
Glo
uc 0
Red
ng 1
Sw
anse
2 G
lasg
w 1
Klm
arnk
1 N
ottm
0 B
risto
l12
L G
uys
0 L
Kin
gs 1
She
ff 3
Sun
d 4
Nor
wch
19 M
anW
st 2
Che
lms
3 L
iv A
in 8
B H
eart
3 B
ango
r 1
New
ry 1
Tru
ro 1
Hul
l 1
Por
ts 3
Pre
stn
2 D
orse
t16
Car
sh 0
Ipsw
i 7
Ply
mth
0 U
lste
r17
Ste
vng
34 C
amb
2 B
asld
n 1
Der
by 1
Exe
ter
2 C
ovnt
1 S
then
d15
Dud
ley
0 L
Bar
ts27
Brig
htn
5 E
ngla
nd 6
N Ir
elan
d 2
Sco
tland
12 W
ales
5 U
K
Centre
Hae
mog
lobi
n g/
dL
Upper quartileMedianLower quartile
N = 15,386
UK Renal Registry 10th Annual Report 2007
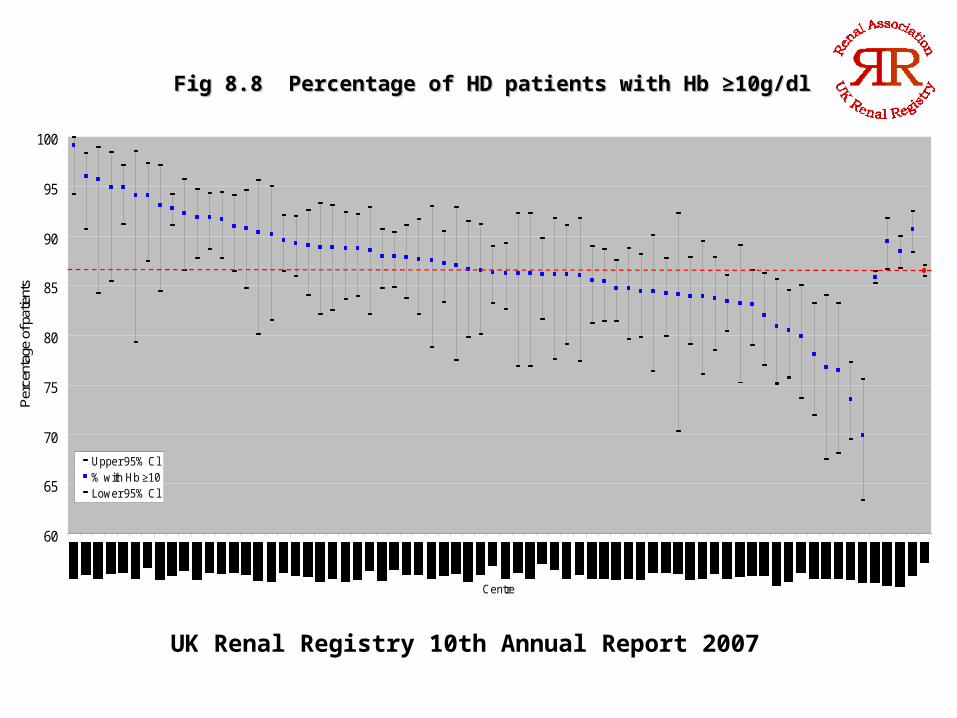
Fig 8.8 Percentage of HD patients with Hb ≥10g/dlFig 8.8 Percentage of HD patients with Hb ≥10g/dl
60
65
70
75
80
85
90
95
100
Centre
Per
cent
age
of p
atie
nts
Upper 95% Cl% with Hb ≥10Lower 95% Cl
N = 15,386
UK Renal Registry 10th Annual Report 2007
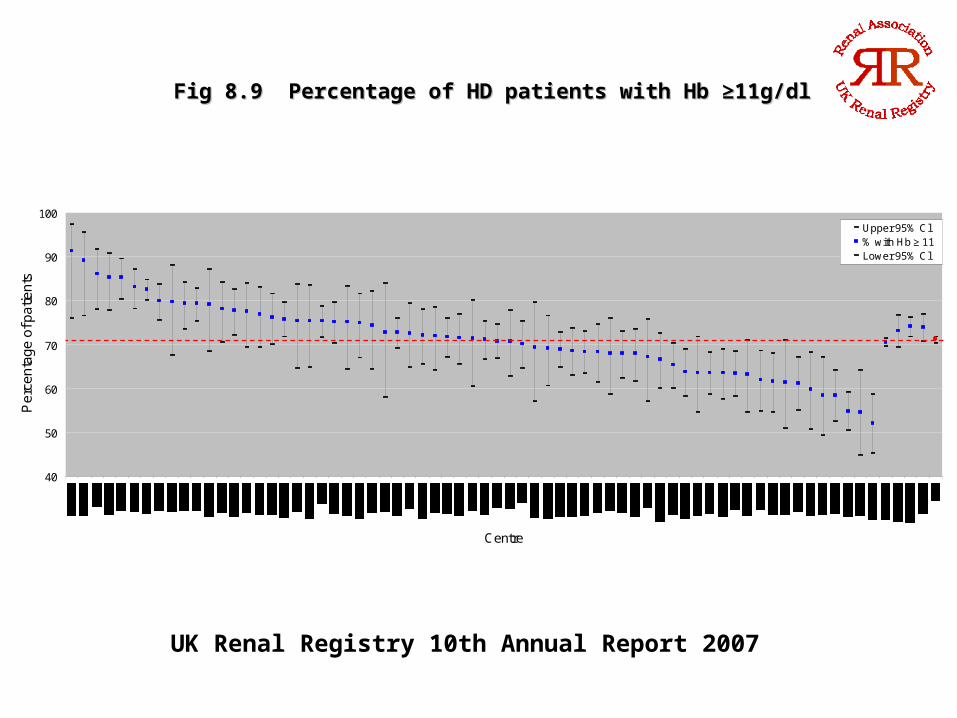
Fig 8.9 Percentage of HD patients with Hb ≥11g/dlFig 8.9 Percentage of HD patients with Hb ≥11g/dl
40
50
60
70
80
90
100
Centre
Pe
rce
nta
ge
of p
atie
nts
Upper 95% Cl% with Hb ≥ 11Lower 95% Cl

UK Renal Registry 10th Annual Report 2007
Fig 8.10 Distribution of haemoglobin in patients on HDFig 8.10 Distribution of haemoglobin in patients on HD
0% 10% 20% 30% 40% 50% 60% 70% 80% 90% 100%
3 Antrim 0 Shrew
4 D&Gall 8 Clwyd 2 Edinb
19 Chestr 1 York
0 Inverns 1 L West 1 Truro
1 Swanse 3 Liv RI 1 Wolve 0 Newc 1 Airdrie
3 Bangor 2 Chelms
1 Leeds 2 Cardff 0 Redng
1 Klmarnk 0 Bradfd
4 Norwch 5 Belfast
3 Sund13 L Rfree
1 Sheff 1 Nottm 2 Abrdn
3 Liv Ain 1 Newry
1 Oxford 5 Carlis
2 Dundee 0 Glouc
1 Leic 0 Bristol 4 Tyrone
1 Hull 0 Ipswi
2 Dorset 2 Dunfn
3 P restn12 L Guys 2 Glasgw 1 Middlbr 0 L Kings
5 Wirral 1 P orts 0 Ulster
17 Stevng 7 P lymth 1 Exeter
3 B QEH 1 Sthend16 Carsh 2 Covnt
19 ManWst 8 B Heart
1 Derby34 Camb15 Dudley 2 Basldn 0 L Barts
27 Brightn 5 England
6 N Ireland 2
12 Wales 5 UK
Ce
ntr
e
Percentage of patients
<9.0
9-9.9
10-10.9
11-11.9
≥12
UK Renal Registry 10th Annual Report 2007
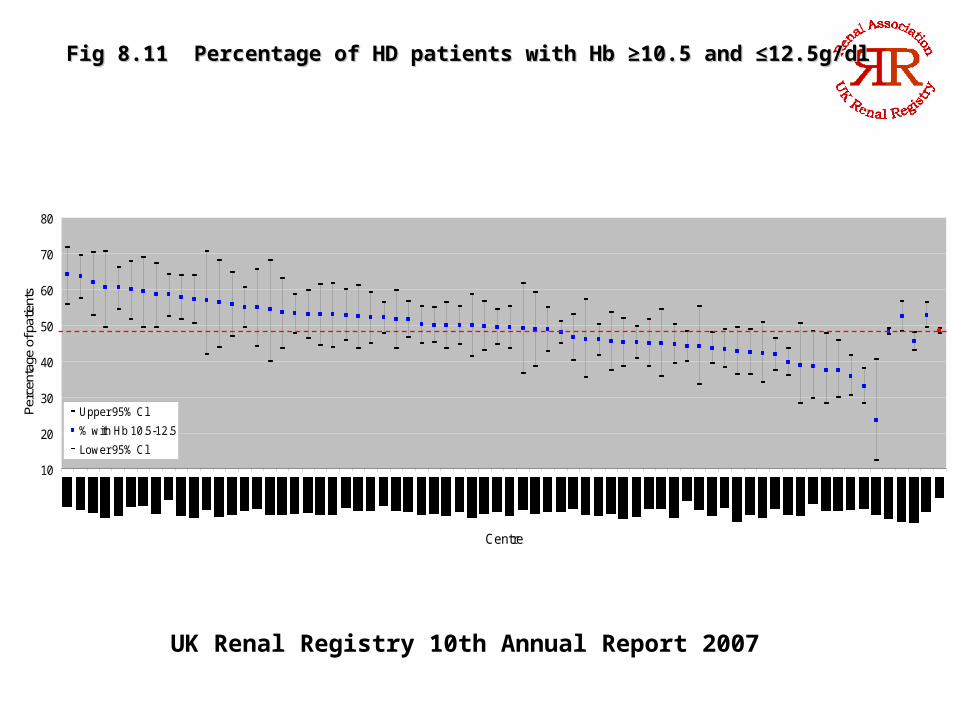
Fig 8.11 Percentage of HD patients with Hb ≥10.5 and ≤12.5g/dlFig 8.11 Percentage of HD patients with Hb ≥10.5 and ≤12.5g/dl
10
20
30
40
50
60
70
80
Centre
Per
cent
age
of p
atie
nts
Upper 95% Cl
% with Hb 10.5-12.5
Lower 95% Cl N = 15,386

UK Renal Registry 10th Annual Report 2007
Fig 8.12 Funnel plot for percentage of HD patients with Fig 8.12 Funnel plot for percentage of HD patients with Hb ≥10.5 and ≤12.5g/dlHb ≥10.5 and ≤12.5g/dl
20
30
40
50
60
70
0 100 200 300 400 500 600 700 800 900 1,000 1,100
Number of patients w ith haemoglobin measurement in each centre
Pe
rce
nta
ge
with
Hb
≥1
0 a
nd
≤1
2.5
g/d
l
% with Hb ≥10 and ≤12.5g/dL+3 SD+2 SDMean-2 SD-3 SD

UK Renal Registry 10th Annual Report 2007
Fig 8.13 Funnel plot for percentage of HD patients Fig 8.13 Funnel plot for percentage of HD patients with Hb ≥10g/dlwith Hb ≥10g/dl
65
70
75
80
85
90
95
100
0 100 200 300 400 500 600 700 800 900 1,000 1,100
Number of patients w ith haemoglobin measurement in each centre
Per
cent
age
with
Hb
≥10
g/dl
% with Hb ≥10g/dL
+3 SD
+2 SD
Mean
-2 SD
-3 SD
UK Renal Registry 10th Annual Report 2007
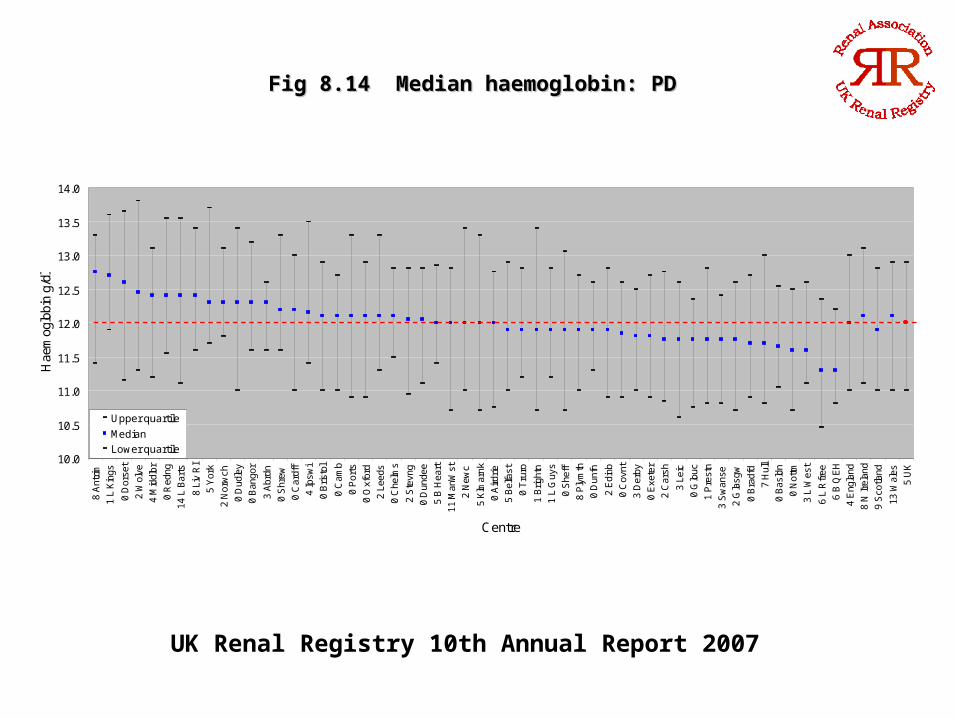
Fig 8.14 Median haemoglobin: PDFig 8.14 Median haemoglobin: PD
10.0
10.5
11.0
11.5
12.0
12.5
13.0
13.5
14.0
8 A
ntrim
1 L
Kin
gs
0 D
orse
t
2 W
olve
4 M
iddl
br
0 R
edng
14 L
Bar
ts
8 L
iv R
I
5 Y
ork
2 N
orw
ch
0 D
udle
y
0 B
ango
r
3 A
brdn
0 S
hrew
0 C
ardf
f
4 Ip
swi
0 B
risto
l
0 C
amb
0 P
orts
0 O
xfor
d
2 L
eeds
0 C
helm
s
2 S
tevn
g
0 D
unde
e
5 B
Hea
rt
11 M
anW
st
2 N
ewc
5 K
lmar
nk
0 A
irdrie
5 B
elfa
st
0 T
ruro
1 B
right
n
1 L
Guy
s
0 S
heff
8 P
lym
th
0 D
unfn
2 E
dinb
0 C
ovnt
3 D
erby
0 E
xete
r
2 C
arsh
3 L
eic
0 G
louc
1 P
rest
n
3 S
wan
se
2 G
lasg
w
0 B
radf
d
7 H
ull
0 B
asld
n
0 N
ottm
3 L
Wes
t
6 L
Rfr
ee
6 B
QE
H
4 E
ngla
nd
8 N
Irel
and
9 S
cotla
nd
13 W
ales
5 U
K
Centre
Hae
mog
lobi
n g/
dl
Upper quartile
Median
Lower quartileN = 3,703

UK Renal Registry 10th Annual Report 2007
Fig 8.15 Percentage of PD patients with Hb ≥10g/dllFig 8.15 Percentage of PD patients with Hb ≥10g/dll
65
70
75
80
85
90
95
100
8 A
ntrim
4 Ip
swi
2 N
orw
ch 0
Shr
ew 5
B H
eart
0 C
amb
2 W
olve
0 D
unde
e 8
Liv
RI
0 R
edng
0 B
risto
l 1
L K
ings
2 L
eeds
0 T
ruro
0 C
helm
s 5
Bel
fast
4 M
iddl
br 2
Ste
vng
0 P
orts
0 C
ovnt
0 C
ardf
f 2
Gla
sgw
2 E
dinb
0 G
louc
5 Y
ork
0 O
xfor
d 3
Der
by 3
L W
est
5 K
lmar
nk 2
Car
sh 3
Abr
dn 3
Sw
anse
1 L
Guy
s 0
Not
tm 1
Pre
stn
14 L
Bar
ts 0
Dud
ley
0 D
unfn
0 B
ango
r 0
Dor
set
0 A
irdrie
2 N
ewc
1 B
right
n11
Man
Wst
7 H
ull
0 B
radf
d 0
She
ff 0
Bas
ldn
3 L
eic
0 E
xete
r 8
Ply
mth
6 B
QE
H 6
L R
free
4 E
ngla
nd 8
N Ir
elan
d 9
Sco
tland
13 W
ales
5 U
K
Centre
Per
cent
age
of p
atie
nts
Upper 95% Cl
% with Hb ≥10g/dL
Lower 95% Cl N = 3,703
UK Renal Registry 10th Annual Report 2007
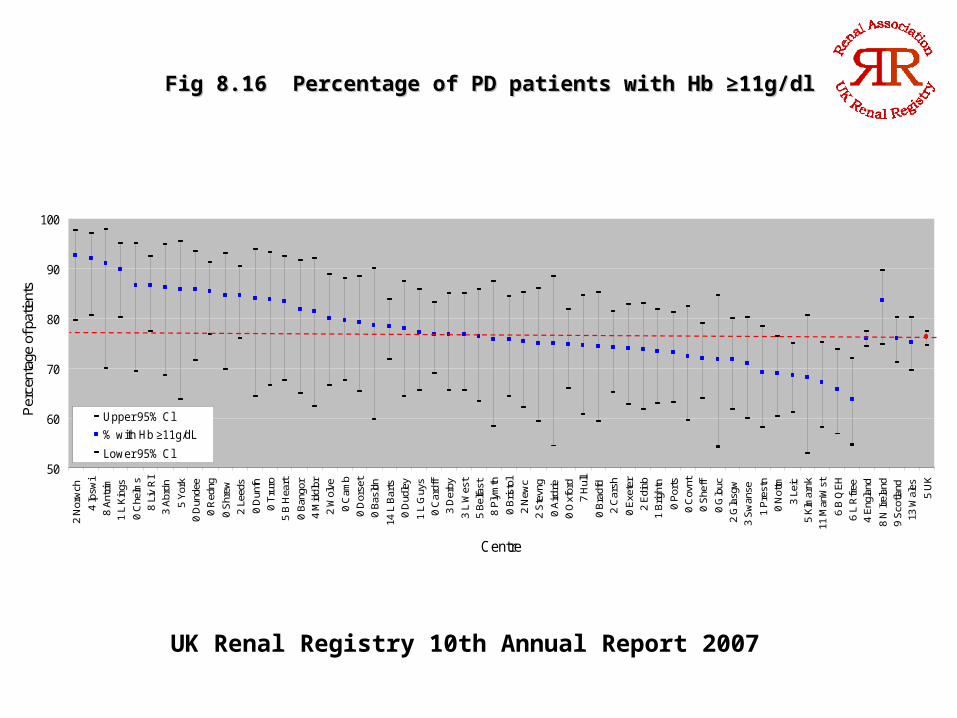
Fig 8.16 Percentage of PD patients with Hb ≥11g/dlFig 8.16 Percentage of PD patients with Hb ≥11g/dl
50
60
70
80
90
100
2 N
orw
ch
4 Ip
swi
8 A
ntrim
1 L
Kin
gs
0 C
helm
s 8
Liv
RI
3 A
brdn
5 Y
ork
0 D
unde
e 0
Red
ng
0 S
hrew
2 L
eeds
0 D
unfn
0 T
ruro
5 B
Hea
rt
0 B
ango
r 4
Mid
dlbr
2 W
olve
0 C
amb
0 D
orse
t 0
Bas
ldn
14 L
Bar
ts 0
Dud
ley
1 L
Guy
s 0
Car
dff
3 D
erby
3 L
Wes
t 5
Bel
fast
8 P
lym
th
0 B
risto
l 2
New
c 2
Ste
vng
0 A
irdrie
0 O
xfor
d 7
Hul
l
0 B
radf
d 2
Car
sh
0 E
xete
r 2
Edi
nb 1
Brig
htn
0 P
orts
0 C
ovnt
0 S
heff
0 G
louc
2 G
lasg
w 3
Sw
anse
1 P
rest
n 0
Not
tm
3 L
eic
5 K
lmar
nk11
Man
Wst
6 B
QE
H 6
L R
free
4 E
ngla
nd
8 N
Irel
and
9 S
cotla
nd13
Wal
es
5 U
K
Centre
Per
cent
age
of p
atie
nts
Upper 95% Cl
% with Hb ≥11g/dL
Lower 95% ClN = 3,703
UK Renal Registry 10th Annual Report 2007
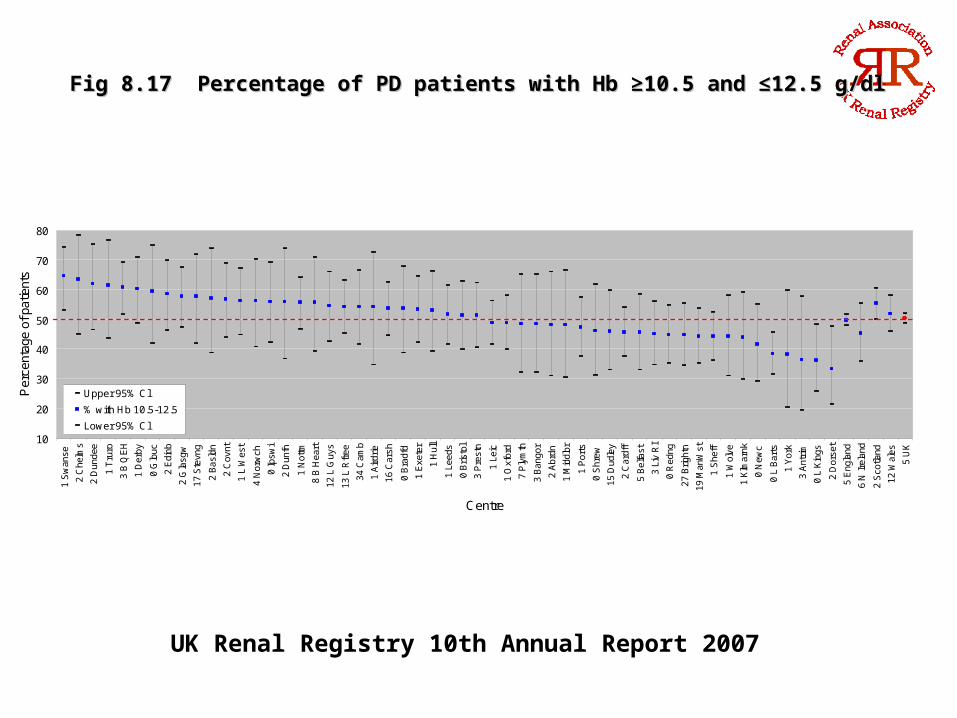
Fig 8.17 Percentage of PD patients with Hb ≥10.5 and ≤12.5 g/dlFig 8.17 Percentage of PD patients with Hb ≥10.5 and ≤12.5 g/dl
10
20
30
40
50
60
70
80
1 S
wan
se
2 C
helm
s
2 D
unde
e
1 T
ruro
3 B
QE
H
1 D
erby
0 G
louc
2 E
dinb
2 G
lasg
w
17 S
tevn
g
2 B
asld
n
2 C
ovnt
1 L
Wes
t
4 N
orw
ch
0 Ip
swi
2 D
unfn
1 N
ottm
8 B
Hea
rt
12 L
Guy
s
13 L
Rfr
ee
34 C
amb
1 A
irdrie
16 C
arsh
0 B
radf
d
1 E
xete
r
1 H
ull
1 L
eeds
0 B
risto
l
3 P
rest
n
1 L
eic
1 O
xfor
d
7 P
lym
th
3 B
ango
r
2 A
brdn
1 M
iddl
br
1 P
orts
0 S
hrew
15 D
udle
y
2 C
ardf
f
5 B
elfa
st
3 L
iv R
I
0 R
edng
27 B
right
n
19 M
anW
st
1 S
heff
1 W
olve
1 K
lmar
nk
0 N
ewc
0 L
Bar
ts
1 Y
ork
3 A
ntrim
0 L
Kin
gs
2 D
orse
t
5 E
ngla
nd
6 N
Irel
and
2 S
cotla
nd
12 W
ales
5 U
K
Centre
Per
cent
age
of p
atie
nts
Upper 95% Cl
% with Hb 10.5-12.5
Lower 95% Cl N = 3,703

UK Renal Registry 10th Annual Report 2007
Fig 8.18 Distribution of haemoglobin in patients on PD Fig 8.18 Distribution of haemoglobin in patients on PD
0% 10% 20% 30% 40% 50% 60% 70% 80% 90% 100%
8 Antrim 4 Ipswi
2 Norwch 0 Shrew
5 B Heart 0 Camb 2 Wolve
0 Dundee 8 Liv R I
0 Redng 0 B ristol 1 L Kings 2 Leeds 0 Truro
0 Chelms 5 Belfast
4 M iddlbr 2 Stevng
0 Ports 0 Covnt 0 Cardff
2 Glasgw 2 Edinb 0 Glouc 5 Y ork
0 Oxford 3 Derby
3 L West 5 Klmarnk
2 Carsh 3 Abrdn
3 Swanse 1 L Guys 0 Nottm 1 Prestn
14 L Barts 0 Dudley 0 Dunfn
0 Bangor 0 Dorset 0 A irdrie
2 Newc 1 B rightn
11 M anWst 7 Hull
0 B radfd 0 Sheff
0 Basldn 3 Leic
0 Exeter 8 Plymth 6 B QEH 6 L R free
4 England 8 N Ireland
9 Sctland13 Wales
5 UK
Ce
ntr
e
Percentage of patients
<9.0
9.0-9.9
10.0-10.9
11.0-11.9
≥12
UK Renal Registry 10th Annual Report 2007
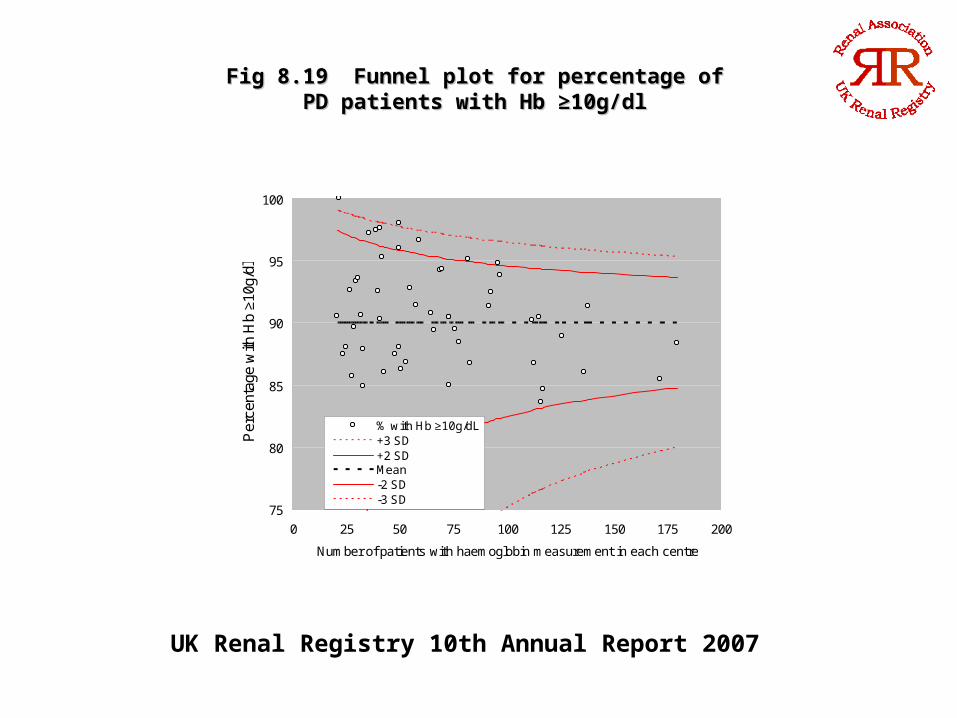
Fig 8.19 Funnel plot for percentage of PD patients Fig 8.19 Funnel plot for percentage of PD patients with Hb ≥10g/dlwith Hb ≥10g/dl
75
80
85
90
95
100
0 25 50 75 100 125 150 175 200
Number of patients with haemoglobin measurement in each centre
Per
cent
age
with
Hb
≥10g
/dl
% with Hb ≥10g/dL+3 SD+2 SDMean-2 SD-3 SD

UK Renal Registry 10th Annual Report 2007
Fig 8.20 Percentage of new and prevalent dialysis Fig 8.20 Percentage of new and prevalent dialysis patients with Hb ≥10g/dlpatients with Hb ≥10g/dl
0
10
20
30
40
50
60
70
80
90
100
Ba
sld
nG
lasg
w
De
rby
Pre
stn
Du
dle
yL
eic
B Q
EH
Bri
gh
tnS
the
nd
Ste
vng
B H
ea
rt
Be
lfast
Ca
mb
L K
ing
sE
xete
r
Sw
an
seC
arl
isM
idd
lbr
Sh
eff
Liv
Ain
Bra
dfd
Wir
ral
Co
vnt
Wo
lve
No
rwch
No
ttmC
ars
hT
yro
ne
Po
rts
Bri
sto
lN
ew
c
Do
rse
tG
lou
cH
ull
Re
dn
g
L R
fre
eC
ard
ff
L G
uys
Su
nd
Le
ed
sIp
swi
Ma
nW
st
Yo
rkC
he
lms
Liv
RI
Sh
rew
Ba
ng
or
Oxf
ord
Ply
mth
L W
est
Tru
ro
En
gla
nd
N Ir
ela
nd
Sco
tlan
dW
ale
s
UK
Centre
Per
cen
tag
e o
f p
atie
nts
New dialysis patientsPrevalent dialysis patients

UK Renal Registry 10th Annual Report 2007
Fig 8.21 Percentage of patients with Hb ≥10g/dl plotted Fig 8.21 Percentage of patients with Hb ≥10g/dl plotted against median haemoglobin: HDagainst median haemoglobin: HD
50
60
70
80
90
100
10.5 11.0 11.5 12.0 12.5 13.0
Median Hb g/dl
Per
cent
age
Hb
≥10g
/dl

UK Renal Registry 10th Annual Report 2007
Fig 8.22 Percentage of patients with Hb ≥11g/dl plotted Fig 8.22 Percentage of patients with Hb ≥11g/dl plotted against median haemoglobin: HDagainst median haemoglobin: HD
50
60
70
80
90
100
10.5 11.0 11.5 12.0 12.5 13.0
Median Hb g/dl
Per
cent
age
Hb
≥11g
/dl
UK Renal Registry 10th Annual Report 2007
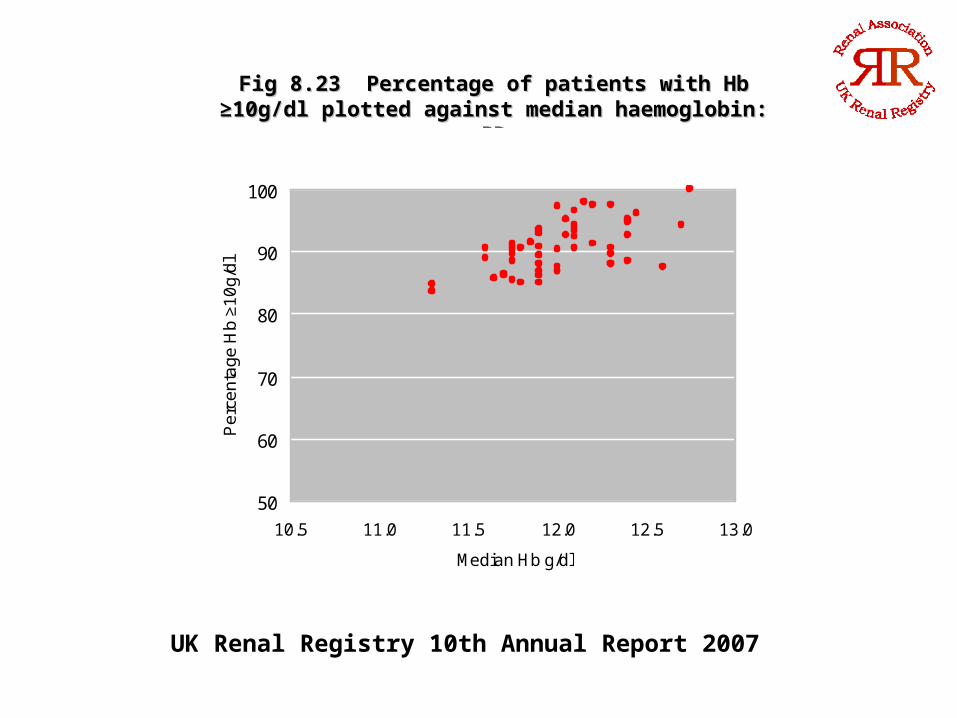
Fig 8.23 Percentage of patients with Hb ≥10g/dl plotted Fig 8.23 Percentage of patients with Hb ≥10g/dl plotted against median haemoglobin: PDagainst median haemoglobin: PD
50
60
70
80
90
100
10.5 11.0 11.5 12.0 12.5 13.0
Median Hb g/dl
Pe
rce
nta
ge
Hb
≥1
0g
/dl
UK Renal Registry 10th Annual Report 2007
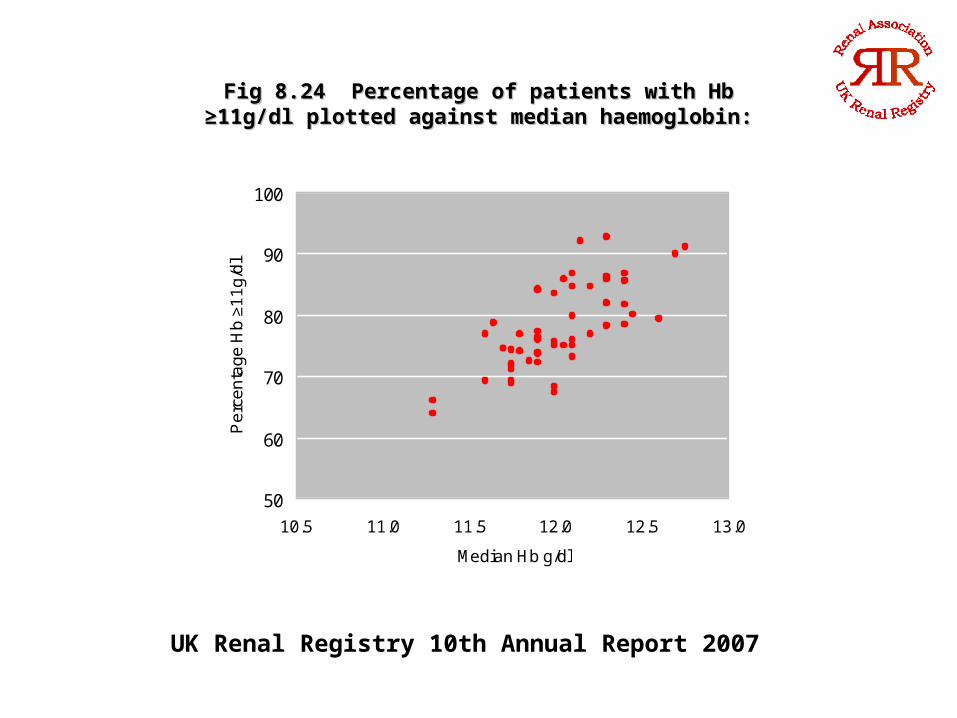
Fig 8.24 Percentage of patients with Hb ≥11g/dl plotted Fig 8.24 Percentage of patients with Hb ≥11g/dl plotted against median haemoglobin: PDagainst median haemoglobin: PD
50
60
70
80
90
100
10.5 11.0 11.5 12.0 12.5 13.0
Median Hb g/dl
Pe
rce
nta
ge
Hb
≥1
1g
/dl

UK Renal Registry 10th Annual Report 2007
Fig 8.25 Percentage of prevalent HD and PD patients with Fig 8.25 Percentage of prevalent HD and PD patients with Hb ≥10g/dl: 1997-2006Hb ≥10g/dl: 1997-2006
50
55
60
65
70
75
80
85
90
95
100
1997
1998
1999
2000
2001
2002
2003
2004
2005
2006
1997
1998
1999
2000
2001
2002
2003
2004
2005
2006
Per
cent
age
Hb
≥10
g/dl
Upper 95% CI
% with Hb ≥10g/dL
Lower 95% CI
Haemodialysis Peritoneal dialysis

UK Renal Registry 10th Annual Report 2007
Fig 8.26 Percentage of incident and prevalent dialysis patients Fig 8.26 Percentage of incident and prevalent dialysis patients with Hb ≥10g/dl: 1998-2006with Hb ≥10g/dl: 1998-2006
30
40
50
60
70
80
90
100
1998
1999
2000
2001
2002
2003
2004
2005
2006
1998
1999
2000
2001
2002
2003
2004
2005
2006
Pe
rce
nta
ge
Hb
≥1
0 g
/dl Upper 95% CI
% with Hb ≥10g/dL
Lower 95% CI
Incident patients Prevalent patients

UK Renal Registry 10th Annual Report 2007
Fig 8.27 Median haemoglobin by length Fig 8.27 Median haemoglobin by length of time on RRT: HDof time on RRT: HD
9.5
10.0
10.5
11.0
11.5
12.0
12.5
<6 months 6m-1year 1-2 years >2 years All
Time on RRT
Hb
g/d
l
HD 1999
HD 2000
HD 2001
HD 2002
HD 2003
HD 2004
HD 2005
HD 2006

UK Renal Registry 10th Annual Report 2007
Fig 8.28 Median haemoglobin by length Fig 8.28 Median haemoglobin by length of time on RRT: PDof time on RRT: PD
9.5
10.0
10.5
11.0
11.5
12.0
12.5
<6 months 6m-1year 1-2 years >2 years All
Time on RRT
Hb
g/d
l
PD 1999
PD 2000
PD 2001
PD 2002
PD 2003
PD 2004
PD 2005
PD 2006

UK Renal Registry 10th Annual Report 2007
Fig 8.29 Median serum ferritin: HDFig 8.29 Median serum ferritin: HD
0
100
200
300
400
500
600
700
800
900
1000
Centre
Fer
ritin
µg/
L
Upper quartile
Median ferritin
Lower quartile
N = 13,612

UK Renal Registry 10th Annual Report 2007
Fig 8.30 Median serum ferritin: PDFig 8.30 Median serum ferritin: PD
0
100
200
300
400
500
600
700
800
2 N
orw
ch
12 R
edng
3 B
ango
r
8 B
right
n
0 B
radf
d
0 Y
ork
2 L
Rfr
ee
13 H
ull
0 N
ewc
0 N
ottm
11 M
iddl
br
49 L
Bar
ts
2 L
eeds
0 S
heff
39 D
erby
12 M
anW
st
3 S
hrew
8 P
lym
th
5 B
elfa
st
2 D
orse
t
3 S
wan
se
7 L
eic
3 C
helm
s
4 L
Wes
t
0 B
risto
l
2 L
iv R
I
0 P
rest
n
12 Ip
swi
12 P
orts
1 L
Guy
s
0 C
amb
3 G
louc
3 C
ovnt
2 C
ardf
f
0 W
olve
8 B
QE
H
5 B
Hea
rt
0 T
ruro
0 B
asld
n
0 L
Kin
gs
4 D
udle
y
0 A
ntrim
2 O
xfor
d
0 E
xete
r
4 C
arsh
12 S
tevn
g
8 E
ngla
nd
5 N
Irel
and
14 W
ales
17 E
,W&
NI
Centre
Fer
ritin
µg/
L
Upper quartileMedian ferritinLower quartile
N = 3,214

UK Renal Registry 10th Annual Report 2007
Fig 8.31 Percentage of HD patients with serum ferritin ≥100µg/LFig 8.31 Percentage of HD patients with serum ferritin ≥100µg/L
65
70
75
80
85
90
95
100
1 N
ewry
0 U
lste
r 5
Wirr
al 8
Clw
yd 1
Che
lms
3 B
ango
r 3
Sun
d 6
Bel
fast
1 N
ottm
6 R
edng
5 C
arlis
1 W
olve
0 N
ewc
1 H
ull
0 L
Wes
t 3
Nor
wch
1 Y
ork
2 T
ruro
3 B
QE
H49
Tyr
one
3 A
ntrim
1 B
radf
d 1
Sw
anse
6 L
Bar
ts 4
Car
dff
1 L
eeds
0 S
tevn
g 3
Ply
mth
0 P
rest
n37
Brig
htn
43 M
anW
st 0
L K
ings
5 L
iv R
I 1
She
ff 0
Bris
tol
10 L
Guy
s 2
Exe
ter
9 L
iv A
in 0
Dor
set
23 C
amb
2 S
then
d 3
Oxf
ord
16 C
arsh
3 C
ovnt
1 Ip
swi
0 D
erry
3 P
orts
14 L
Rfr
ee 1
Glo
uc10
Der
by13
Lei
c 1
Bas
ldn
4 M
iddl
br 2
Shr
ew26
Dud
ley
8 B
Hea
rt 7
Eng
land
10 N
12 W
ales
16 U
K
Centre
Per
cent
age
ferr
itin
≥100
µg/
L
Upper 95% CI
% with ferritin ≥ 100
Lower 95% CI N = 13,612
UK Renal Registry 10th Annual Report 2007
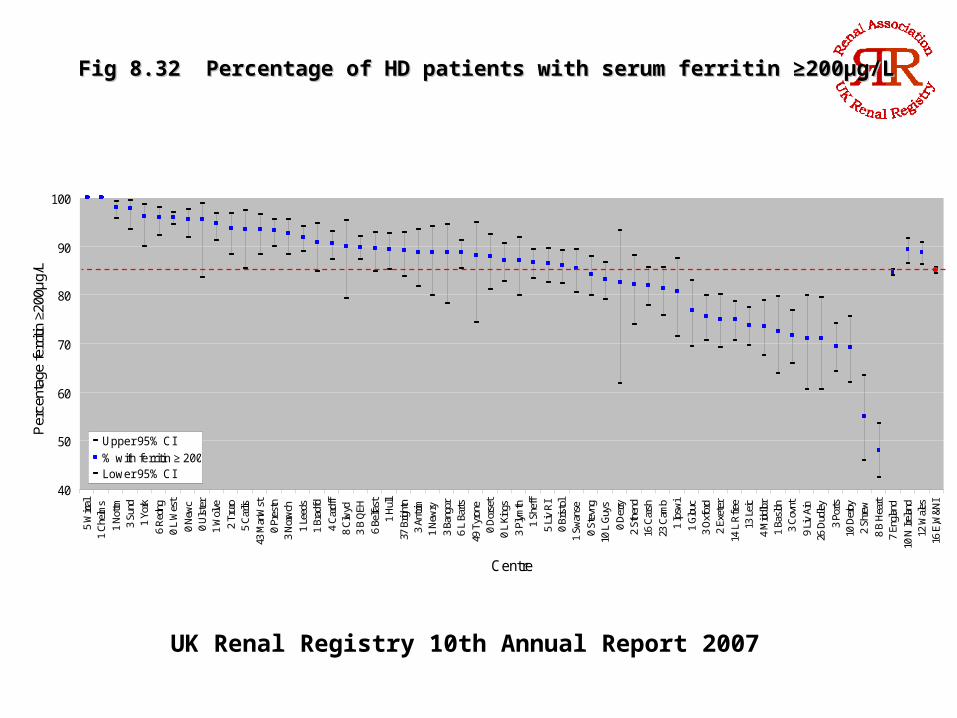
Fig 8.32 Percentage of HD patients with serum ferritin ≥200µg/LFig 8.32 Percentage of HD patients with serum ferritin ≥200µg/L
40
50
60
70
80
90
100
5 W
irral
1 C
helm
s 1
Not
tm 3
Sun
d 1
Yor
k 6
Red
ng 0
L W
est
0 N
ewc
0 U
lster
1 W
olve
2 T
ruro
5 C
arlis
43 M
anW
st 0
Pre
stn
3 N
orwc
h 1
Lee
ds 1
Bra
dfd
4 C
ardf
f 8
Clw
yd 3
B Q
EH 6
Belf
ast
1 H
ull37
Brig
htn
3 A
ntrim
1 N
ewry
3 B
ango
r 6
L B
arts
49 T
yron
e 0
Dor
set
0 L
King
s 3
Plym
th 1
She
ff 5
Liv
RI 0
Bris
tol
1 S
wans
e 0
Ste
vng
10 L
Guy
s 0
Der
ry 2
Sth
end
16 C
arsh
23 C
amb
1 Ip
swi
1 G
louc
3 O
xfor
d 2
Exe
ter
14 L
Rfre
e13
Leic
4 M
iddlbr
1 B
asldn
3 C
ovnt
9 L
iv Ai
n26
Dud
ley 3
Por
ts10
Der
by 2
Shr
ew 8
B H
eart
7 E
nglan
d10
N Ir
eland
12 W
ales
16 E
,W&N
I
Centre
Per
cent
age
ferr
itin
≥200
µg/
L
Upper 95% CI
% with ferritin ≥ 200Lower 95% CI
N = 13,612
UK Renal Registry 10th Annual Report 2007
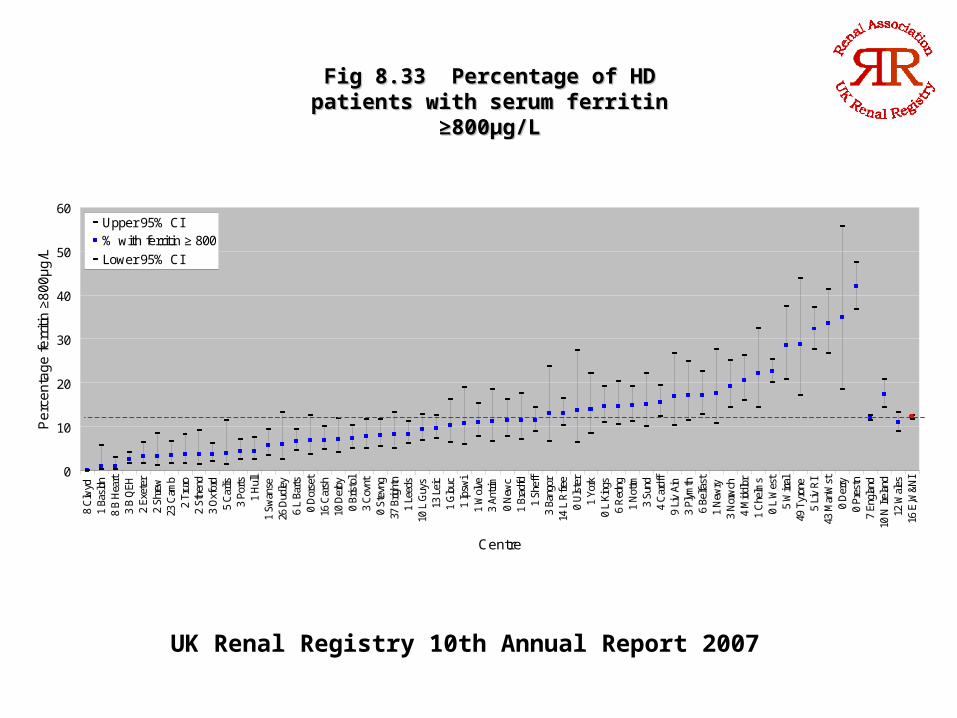
Fig 8.33 Percentage of HD patients with Fig 8.33 Percentage of HD patients with serum ferritin ≥800µg/Lserum ferritin ≥800µg/L
0
10
20
30
40
50
60
8 C
lwyd
1 B
asld
n 8
B H
eart
3 B
QEH
2 E
xete
r 2
Shr
ew23
Cam
b 2
Tru
ro 2
Sth
end
3 O
xfor
d 5
Car
lis 3
Por
ts 1
Hul
l 1
Sw
anse
26 D
udle
y 6
L B
arts
0 D
orse
t16
Car
sh10
Der
by 0
Bris
tol
3 C
ovnt
0 S
tevn
g37
Brig
htn
1 L
eeds
10 L
Guy
s13
Lei
c 1
Glo
uc 1
Ipsw
i 1
Wol
ve 3
Ant
rim 0
New
c 1
Bra
dfd
1 S
heff
3 B
ango
r14
L R
free
0 U
lste
r 1
Yor
k 0
L K
ings
6 R
edng
1 N
ottm
3 S
und
4 C
ardf
f 9
Liv
Ain
3 P
lym
th 6
Bel
fast
1 N
ewry
3 N
orw
ch 4
Mid
dlbr
1 C
helm
s 0
L W
est
5 W
irral
49 T
yron
e 5
Liv
RI
43 M
anW
st 0
Der
ry 0
Pre
stn
7 E
ngla
nd10
N Ir
elan
d12
Wal
es16
E,W
&NI
Centre
Pe
rce
nta
ge
fe
rriti
n ≥
80
0µ
g/L
Upper 95% CI% with ferritin ≥ 800
Lower 95% CI
N = 13,612
UK Renal Registry 10th Annual Report 2007
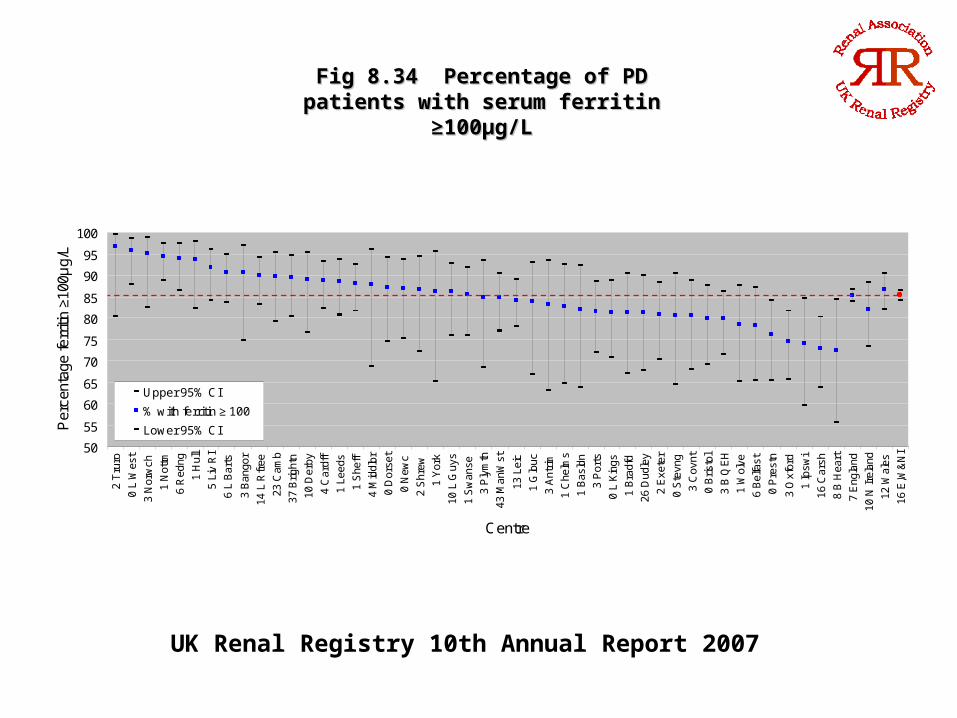
Fig 8.34 Percentage of PD patients with Fig 8.34 Percentage of PD patients with serum ferritin ≥100µg/Lserum ferritin ≥100µg/L
50
55
60
65
70
75
80
85
90
95
100
2 T
ruro
0 L
Wes
t
3 N
orw
ch
1 N
ottm
6 R
edng
1 H
ull
5 L
iv R
I
6 L
Bar
ts
3 B
ango
r
14 L
Rfr
ee
23 C
amb
37 B
right
n
10 D
erby
4 C
ardf
f
1 L
eeds
1 S
heff
4 M
iddl
br
0 D
orse
t
0 N
ewc
2 S
hrew
1 Y
ork
10 L
Guy
s
1 S
wan
se
3 P
lym
th
43 M
anW
st
13 L
eic
1 G
louc
3 A
ntrim
1 C
helm
s
1 B
asld
n
3 P
orts
0 L
Kin
gs
1 B
radf
d
26 D
udle
y
2 E
xete
r
0 S
tevn
g
3 C
ovnt
0 B
risto
l
3 B
QE
H
1 W
olve
6 B
elfa
st
0 P
rest
n
3 O
xfor
d
1 Ip
swi
16 C
arsh
8 B
Hea
rt
7 E
ngla
nd
10 N
Irel
and
12 W
ales
16 E
,W&
NI
Centre
Per
cent
age
ferr
itin
≥100
µg/
L
Upper 95% CI
% with ferritin ≥ 100
Lower 95% CIN = 3,214
UK Renal Registry 10th Annual Report 2007
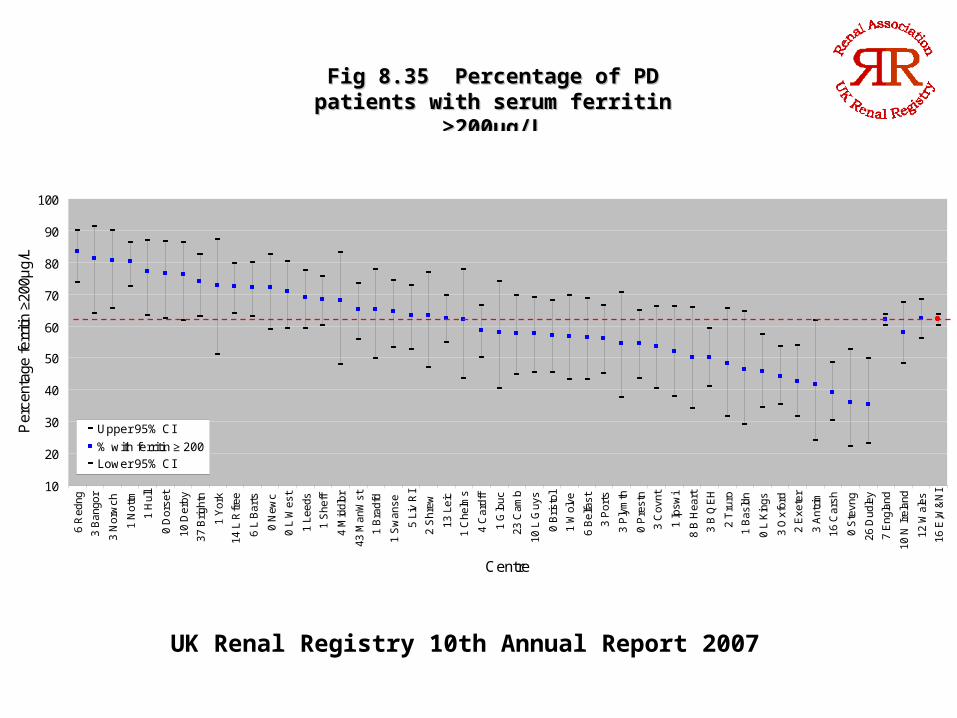
Fig 8.35 Percentage of PD patients Fig 8.35 Percentage of PD patients with serum ferritin ≥200µg/Lwith serum ferritin ≥200µg/L
10
20
30
40
50
60
70
80
90
100
6 R
edng
3 B
ango
r
3 N
orw
ch
1 N
ottm
1 H
ull
0 D
orse
t
10 D
erby
37 B
right
n
1 Y
ork
14 L
Rfr
ee
6 L
Bar
ts
0 N
ewc
0 L
Wes
t
1 L
eeds
1 S
heff
4 M
iddl
br
43 M
anW
st
1 B
radf
d
1 S
wan
se
5 L
iv R
I
2 S
hrew
13 L
eic
1 C
helm
s
4 C
ardf
f
1 G
louc
23 C
amb
10 L
Guy
s
0 B
risto
l
1 W
olve
6 B
elfa
st
3 P
orts
3 P
lym
th
0 P
rest
n
3 C
ovnt
1 Ip
swi
8 B
Hea
rt
3 B
QE
H
2 T
ruro
1 B
asld
n
0 L
Kin
gs
3 O
xfor
d
2 E
xete
r
3 A
ntrim
16 C
arsh
0 S
tevn
g
26 D
udle
y
7 E
ngla
nd
10 N
Irel
and
12 W
ales
16 E
,W&
NI
Centre
Per
cent
age
ferr
itin
≥200
µg/
L
Upper 95% CI
% with ferritin ≥ 200
Lower 95% CI
N = 3,214
UK Renal Registry 10th Annual Report 2007
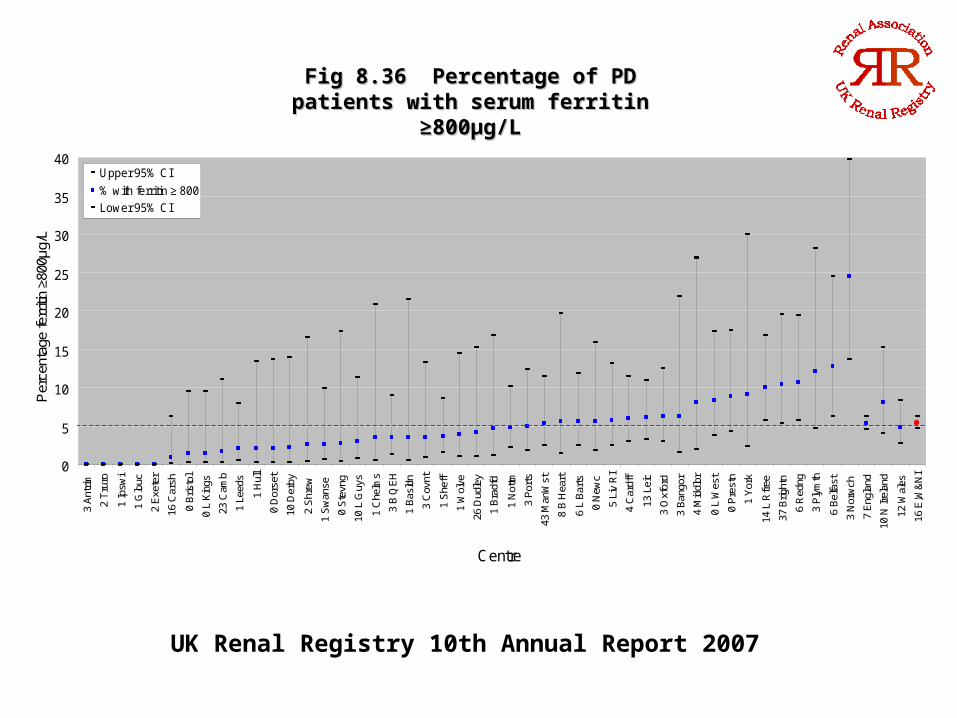
Fig 8.36 Percentage of PD patients with Fig 8.36 Percentage of PD patients with serum ferritin ≥800µg/Lserum ferritin ≥800µg/L
0
5
10
15
20
25
30
35
40
3 A
ntrim
2 T
ruro
1 Ip
swi
1 G
louc
2 E
xete
r
16 C
arsh
0 B
risto
l
0 L
Kin
gs
23 C
amb
1 L
eeds
1 H
ull
0 D
orse
t
10 D
erby
2 S
hrew
1 S
wan
se
0 S
tevn
g
10 L
Guy
s
1 C
helm
s
3 B
QE
H
1 B
asld
n
3 C
ovnt
1 S
heff
1 W
olve
26 D
udle
y
1 B
radf
d
1 N
ottm
3 P
orts
43 M
anW
st
8 B
Hea
rt
6 L
Bar
ts
0 N
ewc
5 L
iv R
I
4 C
ardf
f
13 L
eic
3 O
xfor
d
3 B
ango
r
4 M
iddl
br
0 L
Wes
t
0 P
rest
n
1 Y
ork
14 L
Rfr
ee
37 B
right
n
6 R
edng
3 P
lym
th
6 B
elfa
st
3 N
orw
ch
7 E
ngla
nd
10 N
Irel
and
12 W
ales
16 E
,W&
NI
Centre
Per
cent
age
ferr
itin
≥800
µg/L
Upper 95% CI
% with ferritin ≥ 800
Lower 95% CI
N = 3,214
UK Renal Registry 10th Annual Report 2007
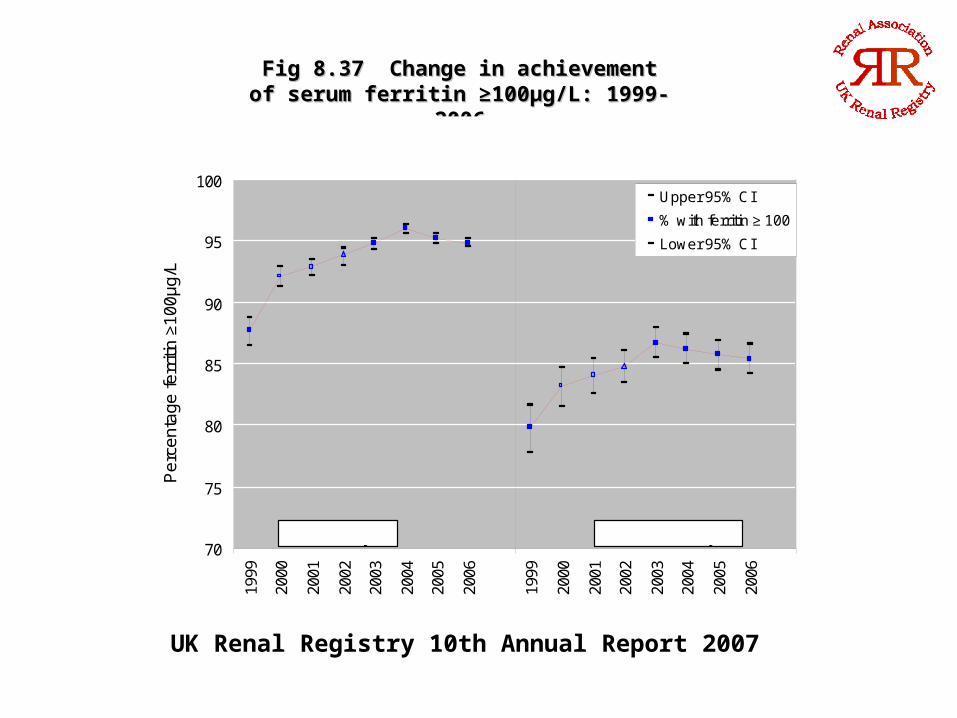
Fig 8.37 Change in achievement of serum Fig 8.37 Change in achievement of serum ferritin ≥100µg/L: 1999-2006ferritin ≥100µg/L: 1999-2006
70
75
80
85
90
95
100
1999
2000
2001
2002
2003
2004
2005
2006
1999
2000
2001
2002
2003
2004
2005
2006
Per
cent
age
fer
ritin
≥1
00µ
g/L
Upper 95% CI
% with ferritin ≥ 100
Lower 95% CI
Haemodialysis Peritoneal dialysis
UK Renal Registry 10th Annual Report 2007
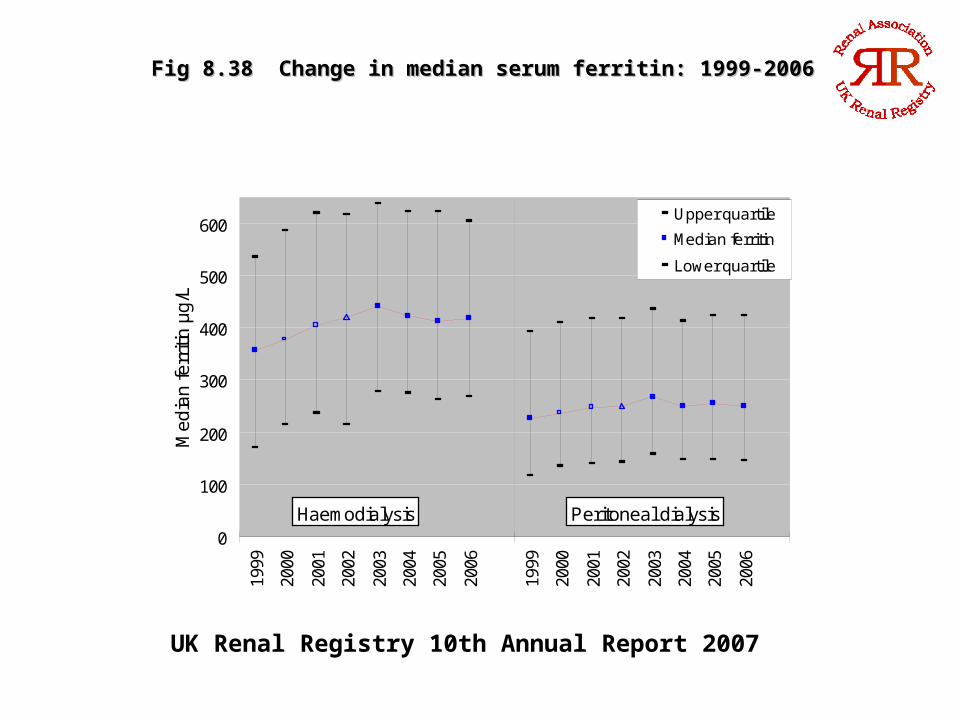
Fig 8.38 Change in median serum ferritin: 1999-2006Fig 8.38 Change in median serum ferritin: 1999-2006
0
100
200
300
400
500
600
1999
2000
2001
2002
2003
2004
2005
2006
1999
2000
2001
2002
2003
2004
2005
2006
Me
dia
n f
err
itin
µg
/L
Upper quartile
Median ferritin
Lower quartile
Haemodialysis Peritoneal dialysis

UK Renal Registry 10th Annual Report 2007
Fig 8.39 Median serum ferritin by Fig 8.39 Median serum ferritin by length of time on RRT: HDlength of time on RRT: HD
0
100
200
300
400
500
600
700
<6 months 6m-1year 1-2 years >2 years All
Time
Ser
um fe
rriti
n µg
/L
Upper quartileMedianLow er quartile

UK Renal Registry 10th Annual Report 2007
Fig 8.40 Median serum ferritin by Fig 8.40 Median serum ferritin by length of time on RRT: PDlength of time on RRT: PD
0
50
100
150
200
250
300
350
400
450
500
<6 months 6m-1year 1-2 years >2 years All
Time
Ser
um fe
rriti
n µg
/L
Upper quartileMedianLower quartile
UK Renal Registry 10th Annual Report 2007
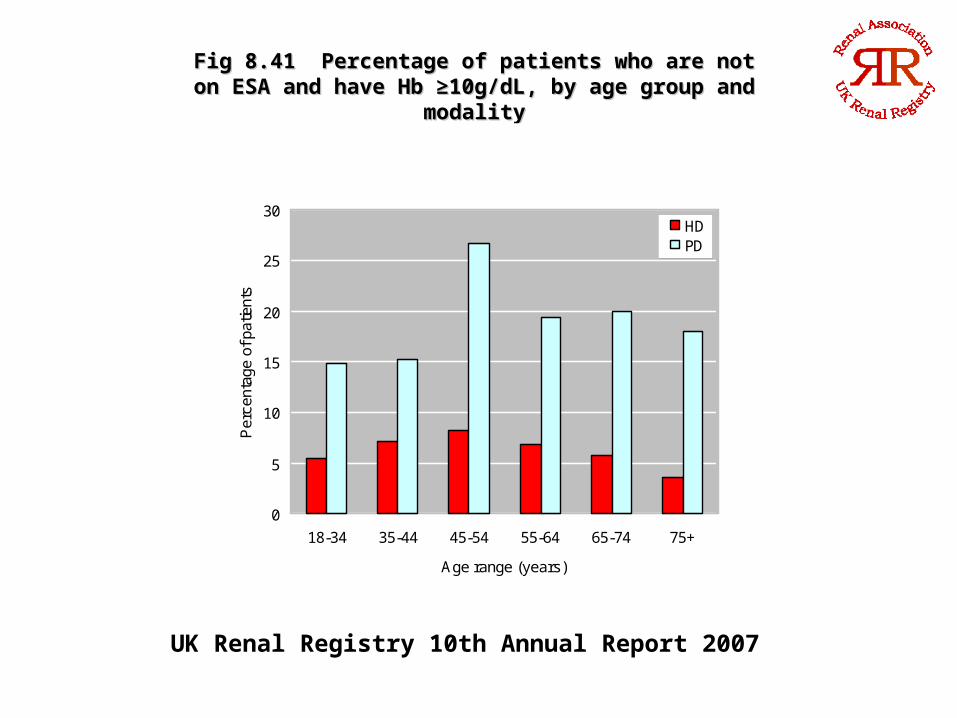
Fig 8.41 Percentage of patients who are not on ESA and Fig 8.41 Percentage of patients who are not on ESA and have Hb ≥10g/dL, by age group and modalityhave Hb ≥10g/dL, by age group and modality
0
5
10
15
20
25
30
18-34 35-44 45-54 55-64 65-74 75+
Age range (years)
Per
cent
age
of p
atie
nts
HDPD

UK Renal Registry 10th Annual Report 2007
Fig 8.42 Percentage of dialysis patients on ESA, Fig 8.42 Percentage of dialysis patients on ESA, by age group and modality by age group and modality
50
60
70
80
90
100
18-34 35-44 45-54 55-64 65-74 75+
Age range (years)
Per
cent
age
of p
atie
nts
HD
PD
UK Renal Registry 10th Annual Report 2007
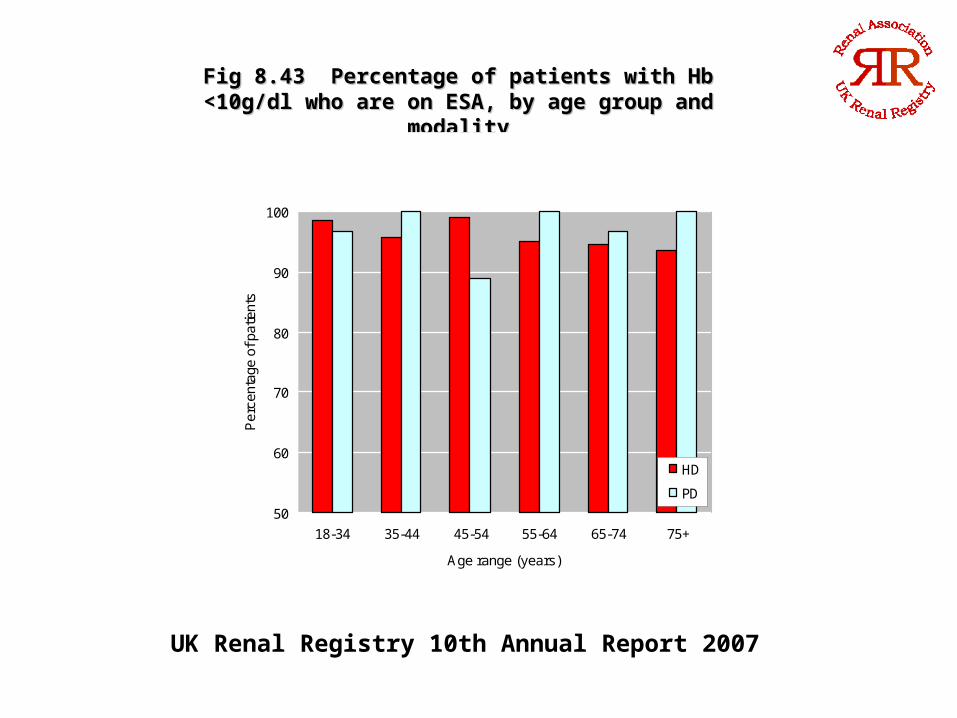
Fig 8.43 Percentage of patients with Hb <10g/dl who Fig 8.43 Percentage of patients with Hb <10g/dl who are on ESA, by age group and modalityare on ESA, by age group and modality
50
60
70
80
90
100
18-34 35-44 45-54 55-64 65-74 75+
Age range (years)
Per
cent
age
of p
atie
nts
HD
PD
UK Renal Registry 10th Annual Report 2007
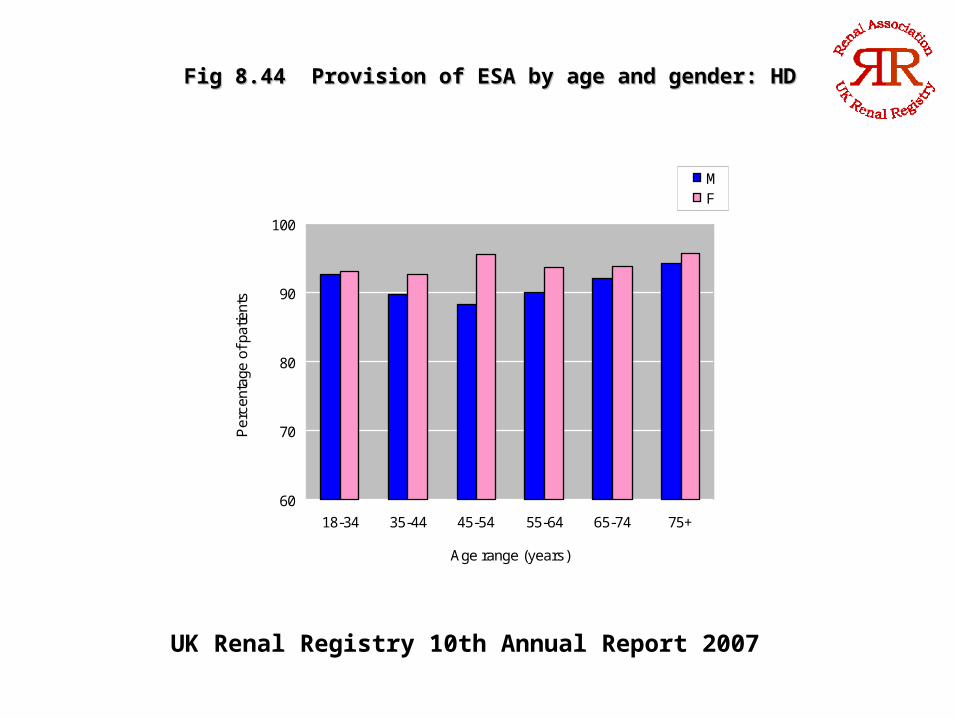
Fig 8.44 Provision of ESA by age and gender: HDFig 8.44 Provision of ESA by age and gender: HD
60
70
80
90
100
18-34 35-44 45-54 55-64 65-74 75+
Age range (years)
Per
cent
age
of p
atie
nts
MF
UK Renal Registry 10th Annual Report 2007
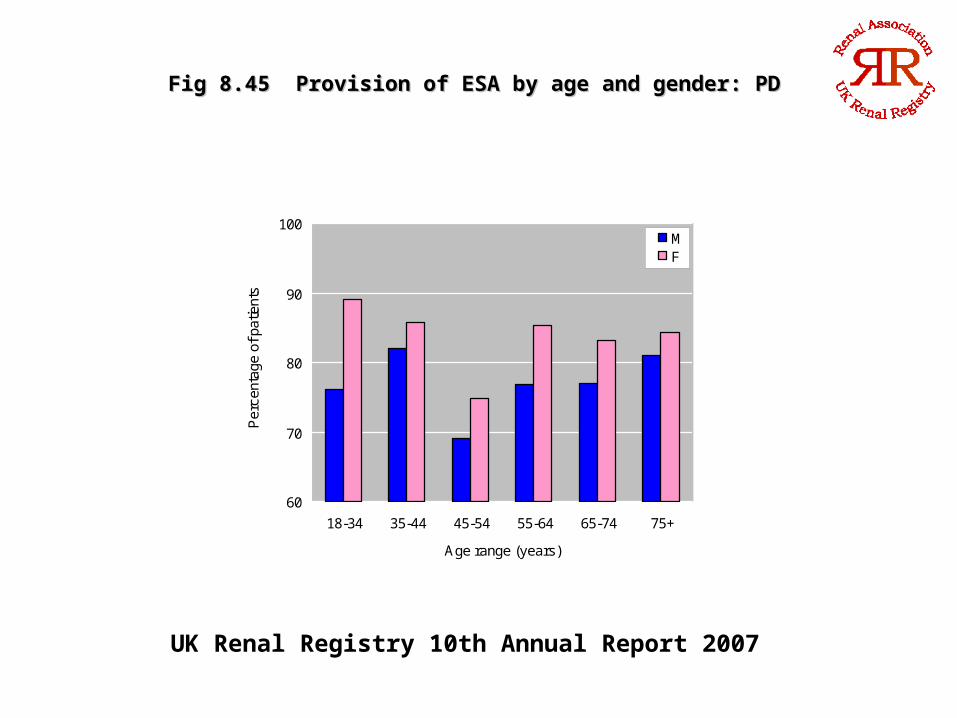
Fig 8.45 Provision of ESA by age and gender: PDFig 8.45 Provision of ESA by age and gender: PD
60
70
80
90
100
18-34 35-44 45-54 55-64 65-74 75+
Age range (years)
Per
cent
age
of p
atie
nts
MF
UK Renal Registry 10th Annual Report 2007
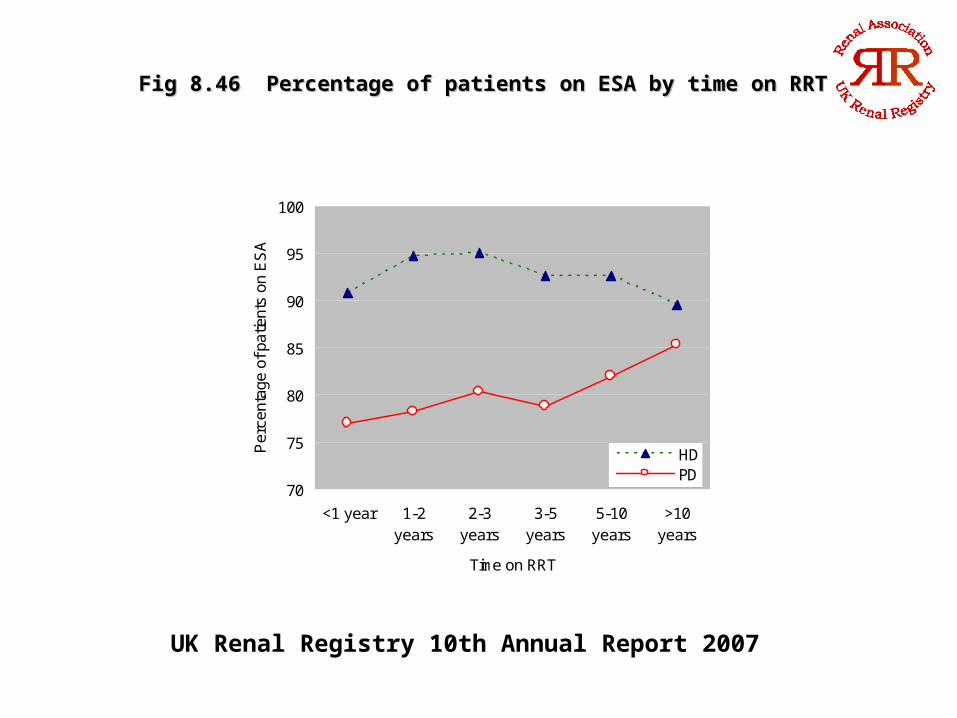
Fig 8.46 Percentage of patients on ESA by time on RRTFig 8.46 Percentage of patients on ESA by time on RRT
70
75
80
85
90
95
100
<1 year 1-2years
2-3years
3-5years
5-10years
>10years
Time on RRT
Per
cent
age
of p
atie
nts
on E
SA
HDPD

UK Renal Registry 10th Annual Report 2007
Fig 8.47 Median haemoglobin versus mean ESA Fig 8.47 Median haemoglobin versus mean ESA dose in haemodialysis patientsdose in haemodialysis patients
10.0
10.5
11.0
11.5
12.0
12.5
13.0
6,000 8,000 10,000 12,000 14,000
Mean ESA dose (IU/w eek)
Med
ian
Hb
g/dl

UK Renal Registry 10th Annual Report 2007
Fig 8.48 Compliance with European Best Practice Guidelines versus Fig 8.48 Compliance with European Best Practice Guidelines versus
mean ESA dose in haemodialysis patientsmean ESA dose in haemodialysis patients
40
50
60
70
80
90
100
6,000 8,000 10,000 12,000 14,000
Mean ESA dose (IU/w eek)
Com
plia
nce
with
Hb
≥11g
/dl