Embed Size (px)
Citation preview

UK public expenditure Patterns of change1948-2002
Maurice Mullard
and Allan Reese
University of Hull

Theory of Public Expenditure 1
Explaining Public Expenditure growth Wilensky (1974) Castles (2001) : Expenditure and
GDP: economic development relates to public expenditure
Klein (1976) : Growth State idea private and public consumption
Contrast with Galbraith or Downs private affluence and public squalor

Theory of Public Expenditure 2
Social Policy argument expenditure demand-led demography : longevity number of children in schools
Expenditure has its own momentum

Politics - the 50s
Emergence from post-war austerity Welfare state: cradle to grave security Redevelopment of infrastructure Defence: cold war and attempted world role End of empire: wind of change

Politics - the 60s and 70s
“Politics does not make a difference” Rose (1984) Mapping out complex political events
– idea of a Butskellite Consensus Governments’ anti-inflation strategy;
influence of trade unions; social contract IMF visit of 1976
– break with Keynesian thinking

Politics - the 80s and 90s
Escapable & inescapable expenditure– current versus capital components
State versus individual responsibilities
Mapping out … the Thatcher years the Major government the Blair government
Data series in this research
Social security Education Health Housing
Defence Law
Roads Trade & industry Environment
Agriculture

Example series: Education (adjusted to billions of pounds @2000 )
Atl Chu Mac Wilson Heath Callaghan Thatcher Major Blair
4800
10000
20000
30000
40000
50500
1948 51 55 59 64 66 70 74 79 84 87 91 97 2002
Quadratic trend line
millions of pounds adjusted to 2000 value
R squared = 0.95 (linear) 0.96 (quadratic)
Education total: (a) adjusted for inflation 1948-2002

Series grouped in Categories
Personal Education Social security Health Housing
Security Defence Law
Infrastructure Roads Trade & industry Environment
( Agriculture )

“Personal” expenditure total(billions of 2000 pounds)
Atl Chu Mac Wilson Heath Callaghan Thatcher Major Blair
5000
50000
100000
200000
300000
1948 51 55 59 64 66 70 74 79 84 87 91 97 2002
Quadratic trend line
millions of pounds adjusted to 2000 value
R squared = 0.97 (linear) 0.99 (quadratic)
Totalled person-related programmes: (a) adjusted for inflation 1948-2002

Programmes prone to change
Environment, Roads, Trade & Industry Issues of subsidies Shifts in industrial policy Via’ing between categories of spending

Character of programmes
Robust programmes difficult to change in the short term:
education, health, social security Relative soft programmes: housing
prior to 1974 used in anti inflation strategy after 1974 no longer a political priority
Defence – the enabling programme

The Research Question
1. public expenditure decisions represent an internal budget process
changes in education expenditure represent a relation to other expenditure programmes: zero sum argument
2. or decisions are externally decided may depend on GDP for current or previous years
3. or decisions are politically driven Politics does makes a difference:
Labour and Conservative demonstrate different policy priorities

Time-series Analysis
• Data have internal correlations
• Annual series covering 50 years
• Already adjusted to “real terms” (at 2000)
• Still show systematic gross changes
• Fit trend line rather than take differences
• Residuals from trends retain “local” autocorrelations - within period of office
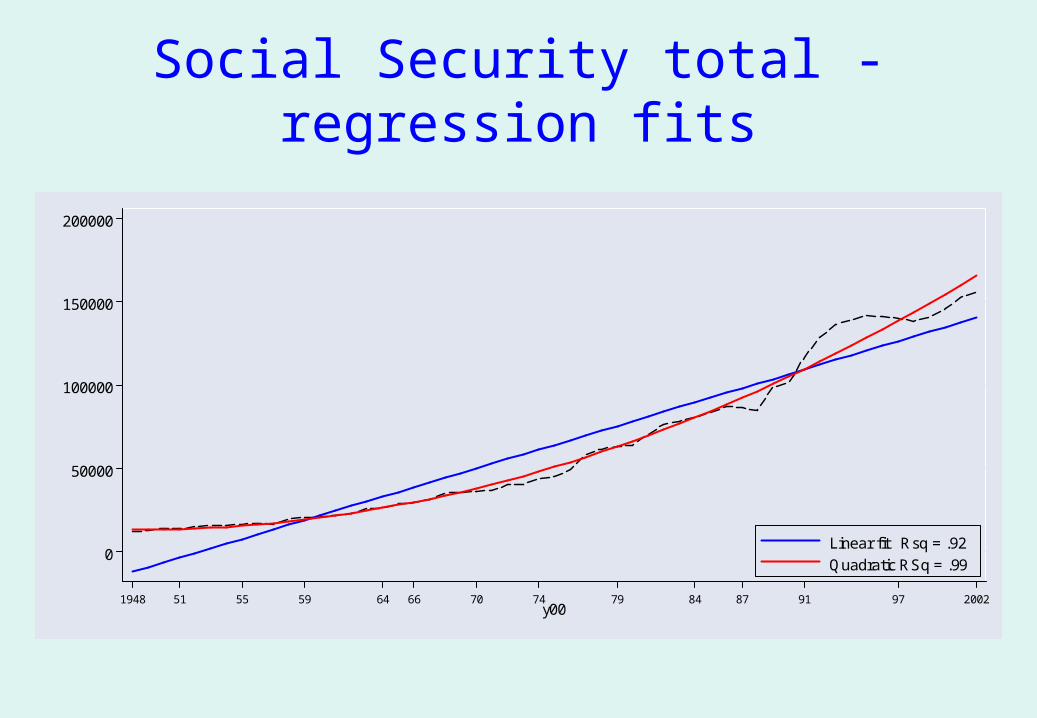
Social Security total - regression fits
0
50000
100000
150000
200000
1948 51 55 59 64 66 70 74 79 84 87 91 97 2002y00
Linear fit Rsq = .92
Quadratic RSq = .99

Social Security Residuals (from quadratic)
-10.0
0.0
10.0
20.0
1948 51 55 59 62 66 70 74 79 84 87 91 97 2002
(c) residuals from de-trended series (£ billions)

Alternative analysis• Trends or year-on-year differences?• Differencing removes all autocorrelation• Local ACs may represent “policy”• Differenced ACs represent “laws of nature”• Education here shows classic autocorrelation of
Box-Jenkins AR(1) model
-1.0
0-0
.50
0.0
00.5
01.0
0
0 5 10 15 20Lag
Bartlett's formula for MA(q) 95% confidence bands
ACF of Education raw data
-1.0
0-0
.50
0.0
00.5
01.0
0
0 5 10 15 20Lag
Bartlett's formula for MA(q) 95% confidence bands
AC of Residuals from linear
-0.5
00.0
00.5
0
0 5 10 15 20Lag
Bartlett's formula for MA(q) 95% confidence bands
AC of differenced

Next stage
• No necessary periodicities– Can we detect business or political cycles?
• De-trended series should be stationary
• Look for cross-correlations
• Do changes relate to GDP?
• Look for internal structures - via’ing

Displaying cross correlationseg, defence & education
-8 -7 -6 -5 -4 -3 -2 -1 0 1 2 3 4 5 6 7 8
Lag Number
-1.0
-0.5
0.0
0.5
1.0
CC
F
Coefficient
Upper Confidence Limit
Lower Confidence Limit
dtdef with dtedu

Correlations between series
• Defence Health -@5 Environment -@3 Trade -@0 Housing -@5
• Law Health +@7 Roads +@0 -@5 Trade +@1 Social +@1
• Education Housing +@0 Social +@0• Health Environment +@0 Housing +@0• Env’ment Law -@5 Roads -@5 Trade +@1 Housing -@6
Social +@1/4 -@6• Roads Defence -@3 Health +@6 Trade +@1• Trade Law -@7 Education +@5/7 Health +@5/7
Roads -@5 Housing +@5 Social +@0 -@6/7• SocialLaw -@5 Health +@7 Roads -@5

Correlation needs investigationEducation & Health ( no lag )
4849
50
99
9897
00
01
02
78
7776
75
70
79
646566
67
6968
74
55
5453
52
51
71
72
73
59585657
6263
6160
9293
9496 9588
87
8689
85
90
91
84
82 83
8180
-2
0
2
4
6
8
Edu
catio
n fo
r sa
me
yea
r
-4 -2 0 2 4 6Health
Detrended residuals in £billion

So what happens with GDP?
GDP may lead (enabling factor):Education, Health, Housing
May in turn be led by (stimulated growth):Environment, Roads
But negative relationship with:Defence, Law
NO simple relationships with Conservative/Labour as a dummy variable

Explaining cross-correlations
Idea of clusters Programmes that move in the same direction
winners and losers Trade-offs Politics does make a difference
In the way the government reacts to events?

Social Security & Trade
50
010099
02
98
97
76
78
75
77
7079 65
64666768
69
74
52515554
53
7271
73
5657
586260636159
95
94
93
96
92
89
88
8485
87
81
82
83
8680
90
91
-10
0
10
20
Soc
ial S
ecu
rity
for
mar
ked
yea
r
-10 -5 0 5 10 15Trade lagged 2
Detrended residuals in £billion
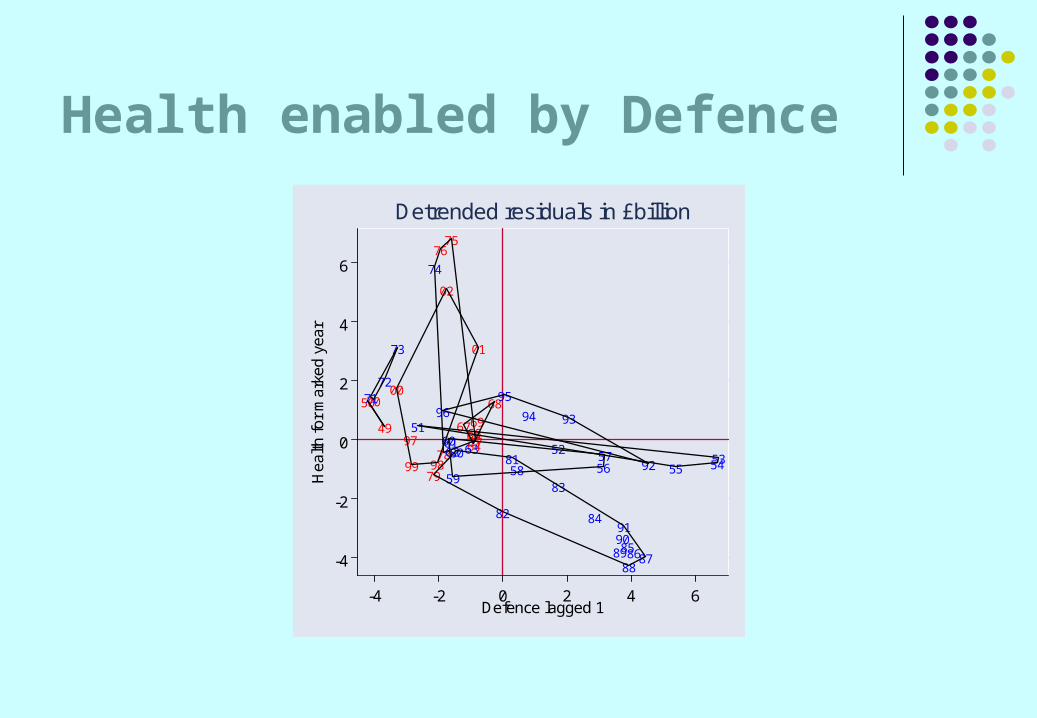
Health enabled by Defence
50
49
00
97
99 98
02
01
76
78
75
77
70
79
6765646669
68
74
51
52
55 5453
7172
73
606162
59
63
58 5657
9695
94 93
9280
82
81
83
84
899091
85
888687-4
-2
0
2
4
6
Hea
lth f
or m
arke
d y
ear
-4 -2 0 2 4 6Defence lagged 1
Detrended residuals in £billion

Housing enabled by Defence
01
02
00 99 9897
7576
77 78
70
79
64
65
66
676968
74
54
53
55
71
73
72
6362
56
6061 5958
57
93
949592
96
83
80
82
84 8186
85
87
88
8990
91
-5
0
5
10
Hou
sin
g fo
r m
ark
ed
yea
r
-4 -2 0 2 4 6Defence lagged 5
Detrended residuals in £billion

Health - accelerating growth
Atl Chu Mac Wilson Heath Callaghan Thatcher Major Blair
5413
68371
1948 51 55 59 64 66 70 74 79 84 87 91 97 2002
Quadratic trend line
millions of pounds adjusted to 2000 value
R squared = 0.93 (linear) 0.98 (quadratic)
Health total: (a) adjusted for inflation 1948-2002

Health as percentage of GDP
IMF
2
3
4
5
6
7
He
alth
as
per
cen
t of G
DP
1948 51 55 59 64 66 70 74 79 84 87 91 97 2002y00
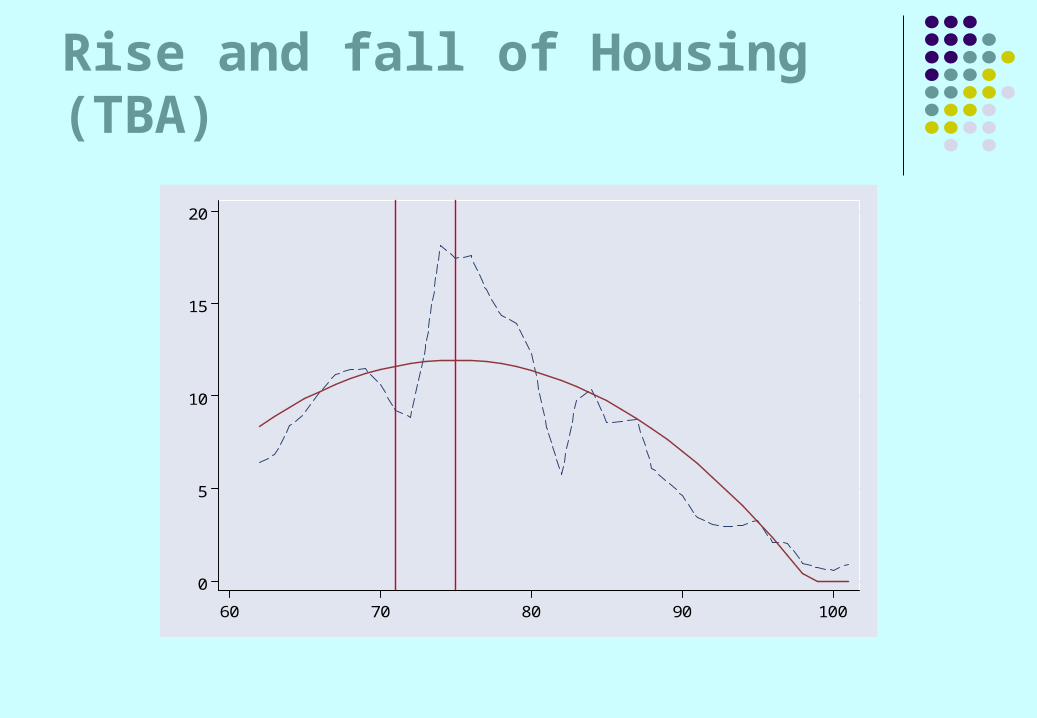
Rise and fall of Housing (TBA)
0
5
10
15
20
60 70 80 90 100

Housing totalas percentage of GDP
Mac Wilson Heath Callaghan Thatcher Major Blair
0
1
2
3
4
1962 66 70 74 79 84 87 91 97 2001

Housing transfers & capitalas percentage of GDP
Mac Wilson Heath Callaghan Thatcher Major Blair
0
1
1
2
2
1962 66 70 74 79 84 87 91 97 2001
Housing transfers
Capital
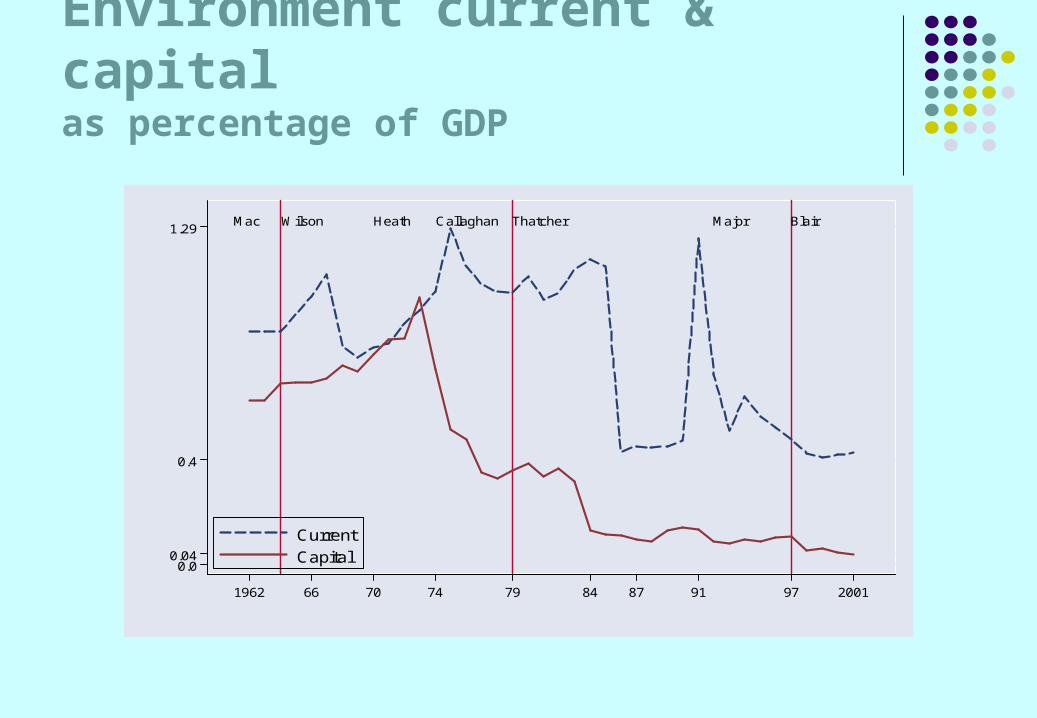
Environment current & capitalas percentage of GDP
Mac Wilson Heath Callaghan Thatcher Major Blair
0.00.04
0.4
1.29
1962 66 70 74 79 84 87 91 97 2001
Current
Capital

Trade transfers & currentas percentage of GDP
Mac Wilson Heath Callaghan Thatcher Major Blair
0.0
0.2
0.5
0.7
1.1
1.6
1962 66 70 74 79 84 87 91 97 2001
Current
Transfers

Graphing three-way split
Three components that add up to 1 (or 100%) contain just two pieces of information
They can be plotted in 2-D on an equilateral triangle
Can look for clusters of points or a pattern of movement (locus) over time
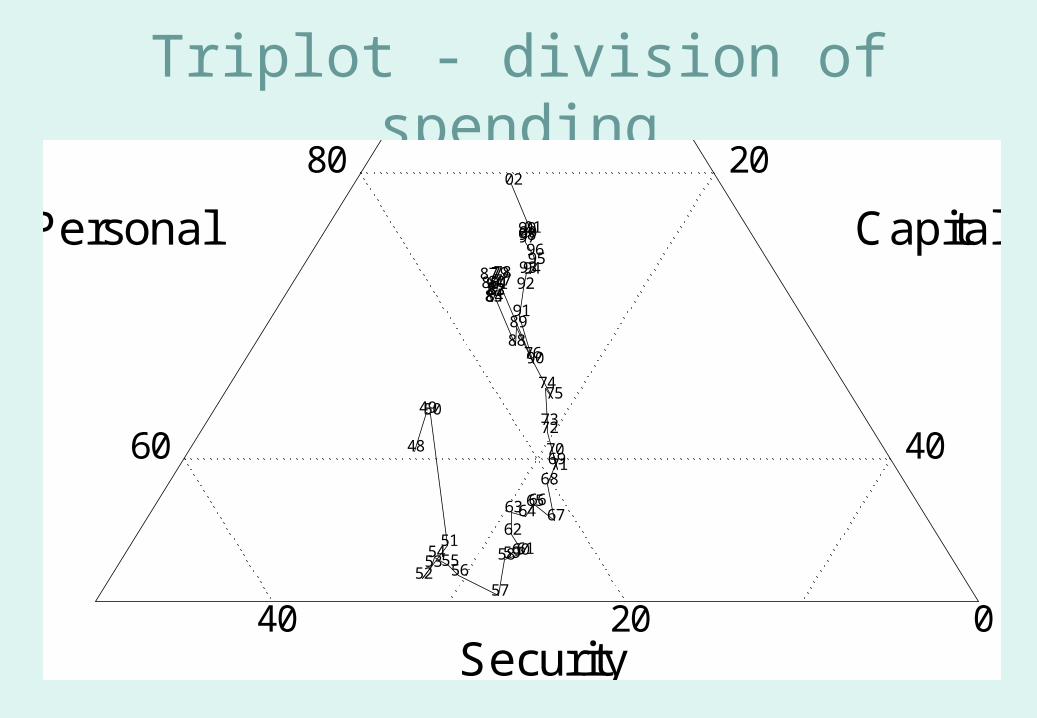
Triplot - division of spending
Personal Capital
Security
0
0
20
20
40
40
60
80
100
48
49 50
51
52 53 54 55
56 57
58 59 60 61 62
63 64 65 66
67
68 69 70 71
72 73
74 75
76
77 78 79 80 81 82 83 84 85 86 87
88 89
90
91
92 93 94 95 96
97 98 99 00 01
02

Capital
Subsidies
Current
Education
.04
.04
.16
.16
.72
.9
62
70
73
75
79 85
92
97
00 01
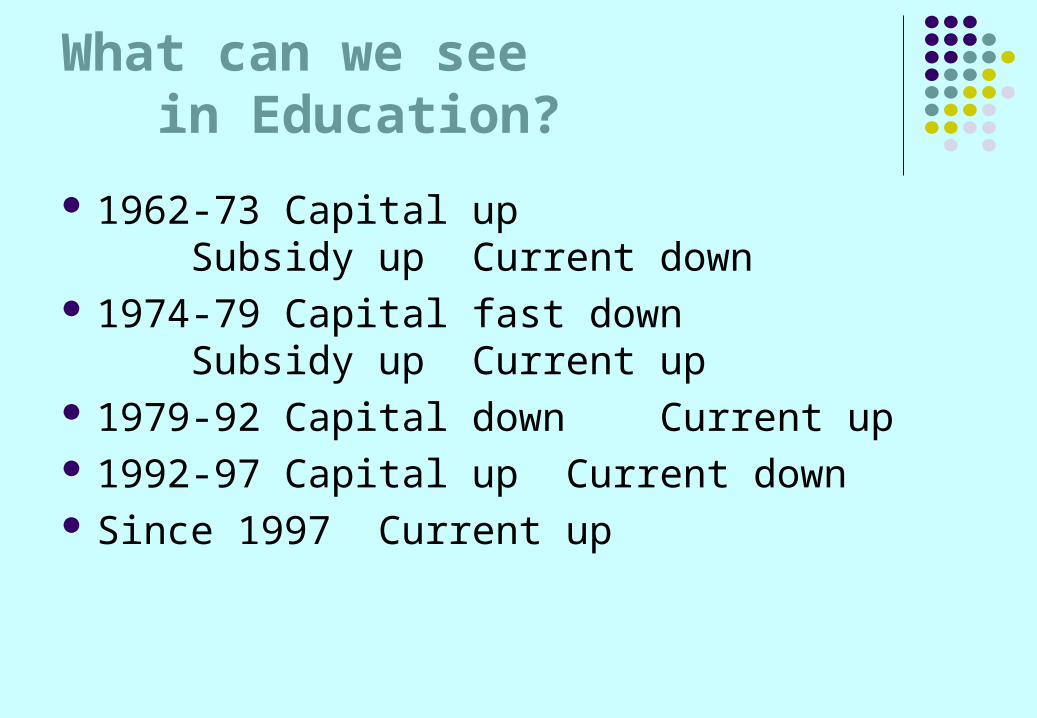
What can we see in Education?
1962-73 Capital up Subsidy up Current down
1974-79 Capital fast down Subsidy up Current up
1979-92 Capital down Current up 1992-97 Capital up Current down Since 1997 Current up

Comments on Stata
• Analysis + graphics• Command-driven
– audit trail– production line use
• Very versatile• Extensible (like Unix)• Widely used and with
good user support
• Note irregular scales and axis labels
• Combinations of points and lines
• Graphs are built up by adding options to basic commands
• Good books + online documentation