Embed Size (px)
Citation preview

Aldermore – Banking as it should be UK Housebuilders Day 21 May 2015
22%
4%
21% 53%
Asset Finance
Invoice Finance
SME CommercialMortgages
Residential Mortgages(including Buy to Let)
Banking as it should be
1
SME focused bank
Track record of accelerating profitability
Deliberately selected large asset-based lending
markets with good risk adjusted returns
Target prime underserved segments
Expert underwriters supported by modern,
legacy-free, scalable systems
Increasing proportion of direct distribution
Dynamic online deposit franchise 77%
23%
Retail
SME
£4.8bn
Customer loans1
Customer deposits1
£4.5bn
(1) As at 31 December 2014
0
1
2
3
4
5
H1 H2 H1 H2 H1 H2
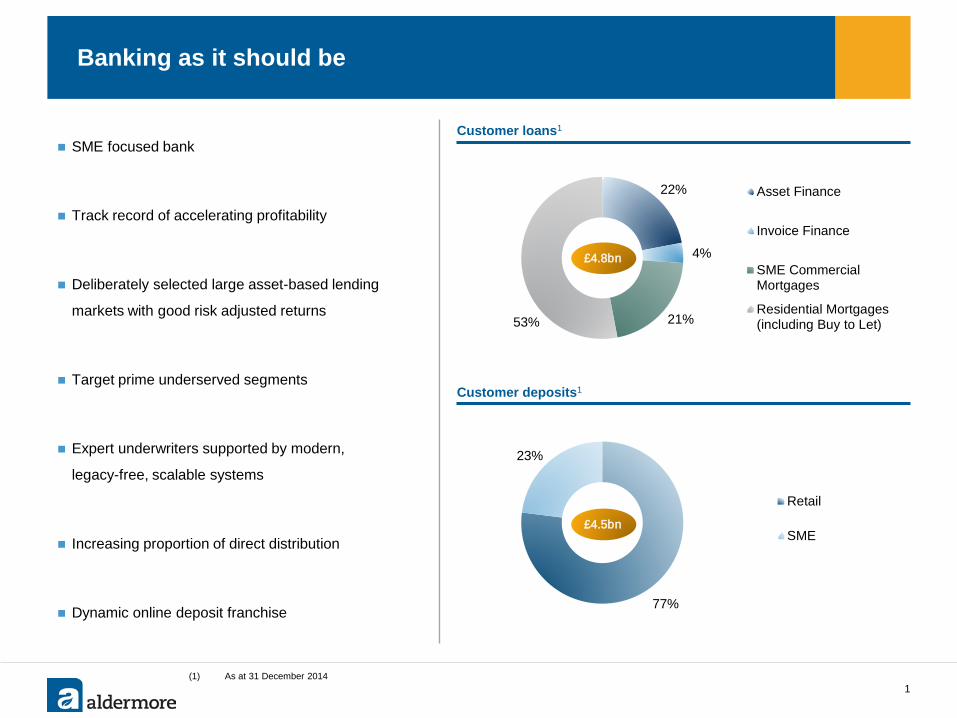
2.1
2012
Record organic origination
…to deliver strong, organic growth(1) Leveraging origination(1) capacity…
(1) Source: IFRS accounts for annual data; UK GAAP management accounts for semi-annual data, except H1 2014 which constitutes an IFRS figure. (2) From 1 January 2012 to 31 December 2014. (3) Compound annual growth rate calculated as year end 2014 vs. year end 2011.
0.0
0.2
0.4
0.6
0.8
1.0
1.2
1.4
H1 H2 H1 H2 H1 H2
1.7 1.2
Period-end net loans(1) (£bn) Annual organic origination(1) (£bn)
2
98% of origination generated organically(2)
2.4
2012 2013 2014
2012 2013 2014
2012 2013 2014
3.4
2013
4.8
2014
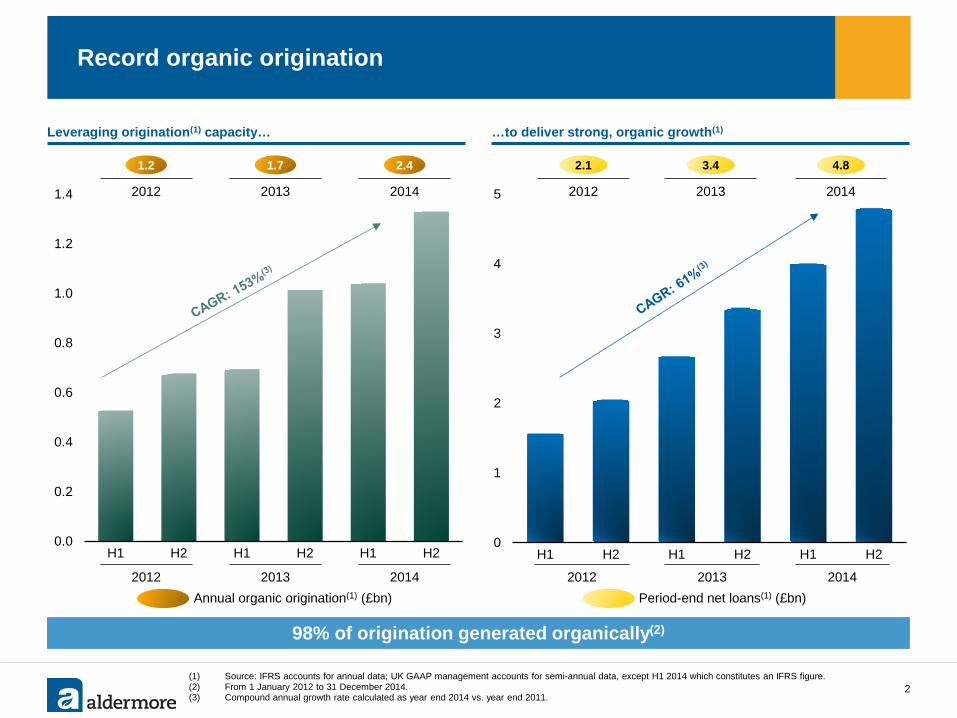
0.7%
11.6%
8.8%
15.1%
18.5%
2012 2013 2013taxed(4)
2014 H2 14
Net loans (£bn) Net Interest Income (£m)
Return on Equity(2)(3) (%) Cost income ratio(1)(2) (%)
Generating strong financial momentum
3
36
81
140
2012 2013 2014
2.1
3.4
4.8
2012 2013 2014
Profit before tax (£m)
90%
66% 60% 57%
2012 2013 2014 H2 14
0 26 50 32
(1) Cost income ratio = (administration expenses + depreciation) / operating income. (2) 2014 excludes one-off costs related to IPO of c. £6.0m pre-tax. (3) Return on equity = profit after tax / average shareholders’ equity. (4) Like for like basis if 2013 taxed at 2014 effective rate.
(4)
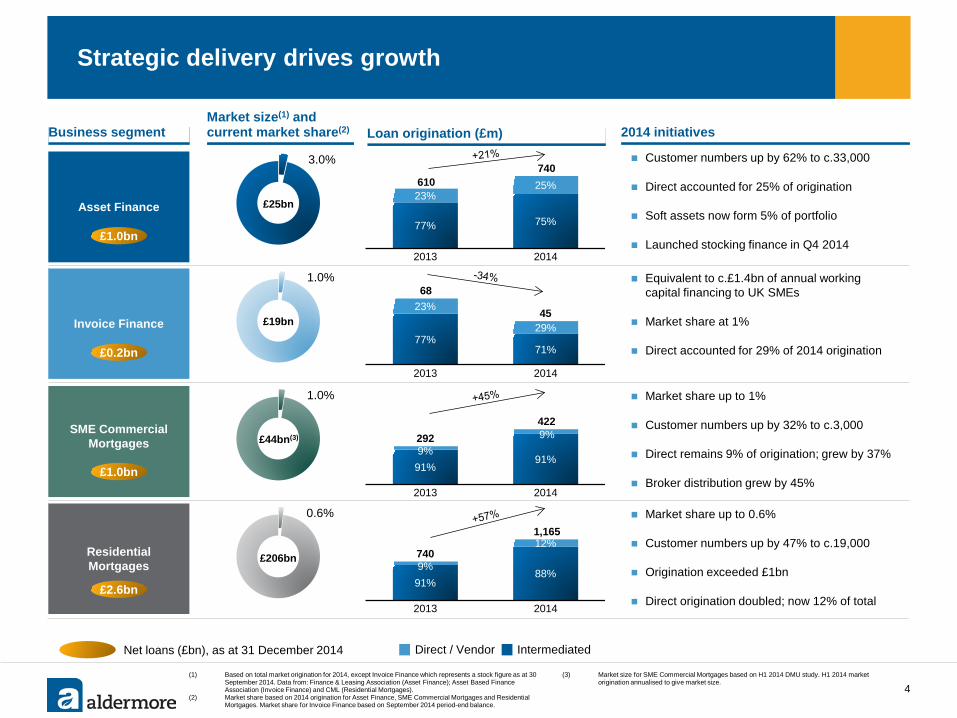
Strategic delivery drives growth
(1) Based on total market origination for 2014, except Invoice Finance which represents a stock figure as at 30 September 2014. Data from: Finance & Leasing Association (Asset Finance); Asset Based Finance Association (Invoice Finance) and CML (Residential Mortgages).
(2) Market share based on 2014 origination for Asset Finance, SME Commercial Mortgages and Residential Mortgages. Market share for Invoice Finance based on September 2014 period-end balance.
(3) Market size for SME Commercial Mortgages based on H1 2014 DMU study. H1 2014 market origination annualised to give market size.
Asset Finance
Residential Mortgages
Invoice Finance
SME Commercial Mortgages
Market share up to 0.6%
Customer numbers up by 47% to c.19,000
Origination exceeded £1bn
Direct origination doubled; now 12% of total
Customer numbers up by 62% to c.33,000
Direct accounted for 25% of origination
Soft assets now form 5% of portfolio
Launched stocking finance in Q4 2014
Equivalent to c.£1.4bn of annual working capital financing to UK SMEs
Market share at 1%
Direct accounted for 29% of 2014 origination
Market share up to 1%
Customer numbers up by 32% to c.3,000
Direct remains 9% of origination; grew by 37%
Broker distribution grew by 45%
£1.0bn
£0.2bn
£1.0bn
£2.6bn
Net loans (£bn), as at 31 December 2014 Intermediated Direct / Vendor
Business segment 2014 initiatives Market size(1) and current market share(2)
3.0%
£25bn
1.0%
£19bn
1.0%
£44bn(3)
0.6%
£206bn
4
Loan origination (£m)
77% 75%
23% 25% 610 740
2013 2014
77% 71%
23%
29%
68
45
2013 2014
91% 91%
9% 9% 292 422
2013 2014
91% 88%
9%
12% 740
1,165
2013 2014
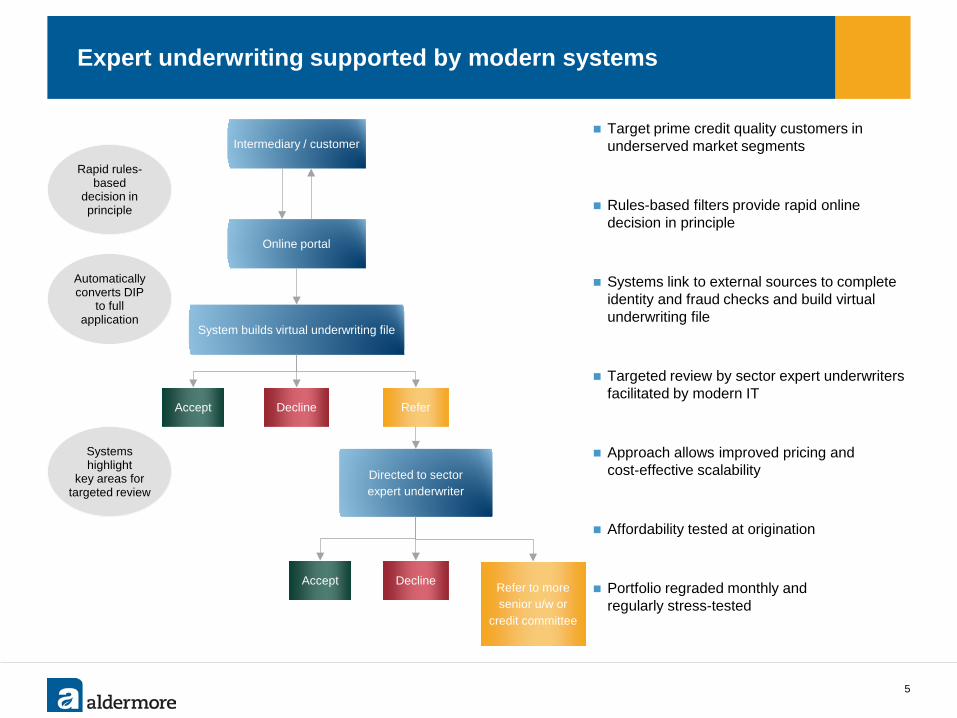
Expert underwriting supported by modern systems
5
Target prime credit quality customers in underserved market segments
Rules-based filters provide rapid online decision in principle
Systems link to external sources to complete identity and fraud checks and build virtual underwriting file
Targeted review by sector expert underwriters facilitated by modern IT
Approach allows improved pricing and cost-effective scalability
Affordability tested at origination
Portfolio regraded monthly and regularly stress-tested
Online portal
System builds virtual underwriting file
Accept Decline Refer
Directed to sector expert underwriter
Accept Decline Refer to more senior u/w or
credit committee
Intermediary / customer
Rapid rules- based
decision in principle
Automatically converts DIP
to full application
Systems highlight
key areas for targeted review
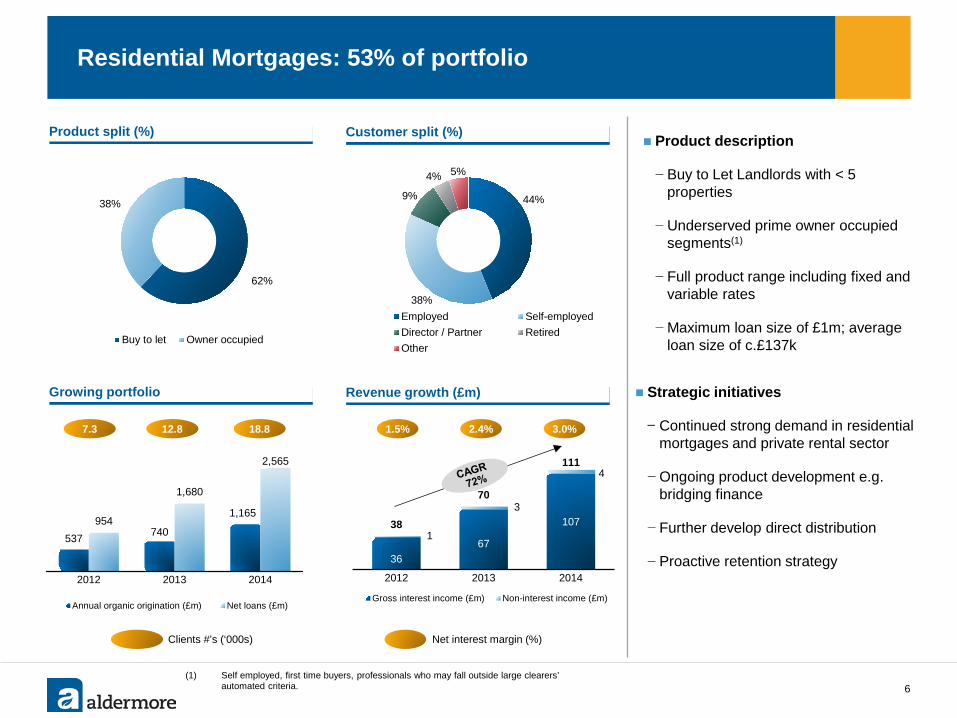
Residential Mortgages: 53% of portfolio
6
1.5% 2.4%
Net interest margin (%)
Strategic initiatives
− Continued strong demand in residential mortgages and private rental sector
− Ongoing product development e.g. bridging finance
− Further develop direct distribution
− Proactive retention strategy
Product split (%) Customer split (%)
3.0%
(1) Self employed, first time buyers, professionals who may fall outside large clearers’ automated criteria.
Product description
− Buy to Let Landlords with < 5 properties
− Underserved prime owner occupied segments(1)
− Full product range including fixed and variable rates
− Maximum loan size of £1m; average loan size of c.£137k
Growing portfolio Revenue growth (£m)
36 67
107 1
3
4
38
70
111
2012 2013 2014
Gross interest income (£m) Non-interest income (£m)
537 740
1,165 954
1,680
2,565
2012 2013 2014
Annual organic origination (£m) Net loans (£m)
62%
38%
Buy to let Owner occupied
44%
38%
9%
4% 5%
Employed Self-employedDirector / Partner RetiredOther
Clients #’s (‘000s)
7.3 12.8 18.8
26 40
56 <1
<1
2
26
40
58
2012 2013 2014
Gross interest income (£m) Non-interest income (£m)
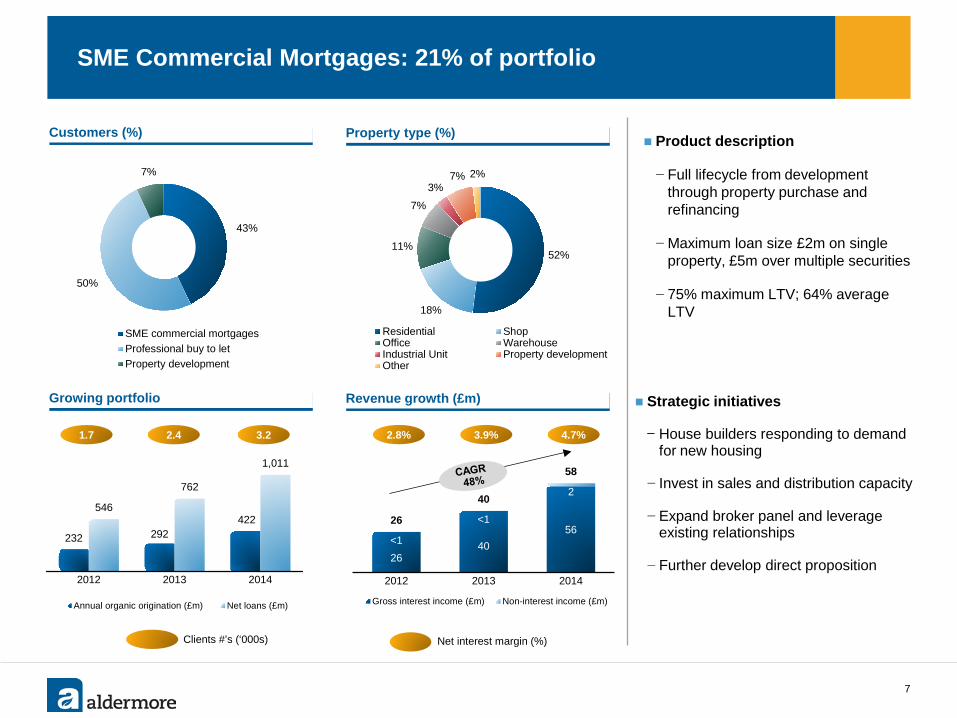
SME Commercial Mortgages: 21% of portfolio
7
2.8% 3.9%
Net interest margin (%)
Strategic initiatives
− House builders responding to demand for new housing
− Invest in sales and distribution capacity
− Expand broker panel and leverage existing relationships
− Further develop direct proposition
Product description
− Full lifecycle from development through property purchase and refinancing
− Maximum loan size £2m on single property, £5m over multiple securities
− 75% maximum LTV; 64% average LTV
4.7%
Growing portfolio Revenue growth (£m)
Customers (%) Property type (%)
232 292 422
546
762
1,011
2012 2013 2014
Annual organic origination (£m) Net loans (£m)
Clients #’s (‘000s)
1.7 2.4 3.2
43%
50%
7%
SME commercial mortgagesProfessional buy to letProperty development
52%
18%
11%
7%
3% 7% 2%
Residential ShopOffice WarehouseIndustrial Unit Property developmentOther
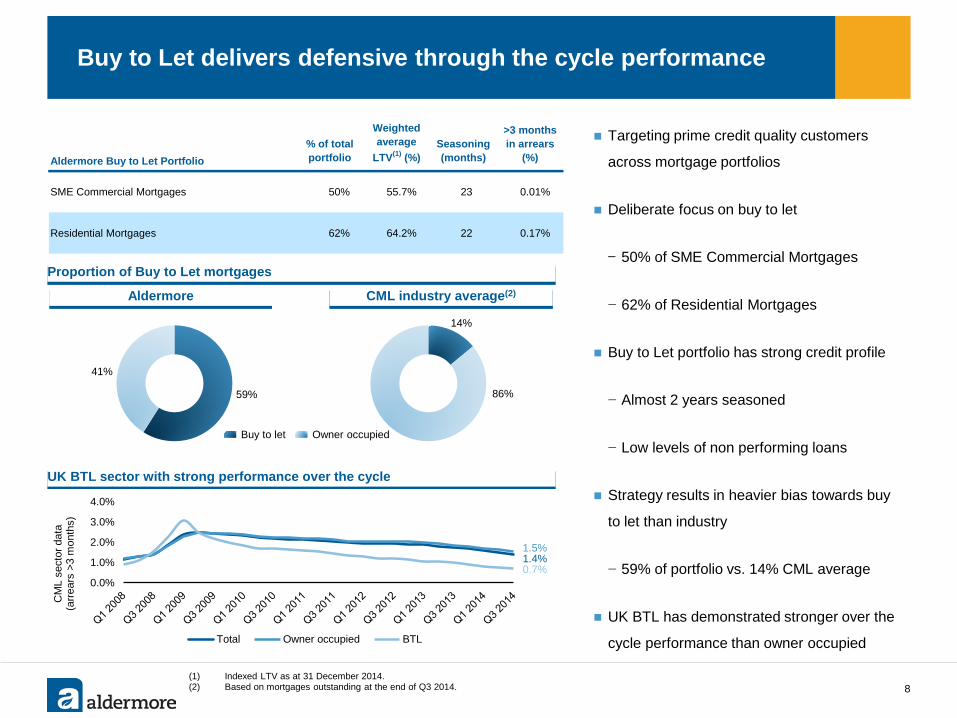
Buy to Let delivers defensive through the cycle performance
Targeting prime credit quality customers
across mortgage portfolios
Deliberate focus on buy to let
− 50% of SME Commercial Mortgages
− 62% of Residential Mortgages
Buy to Let portfolio has strong credit profile
− Almost 2 years seasoned
− Low levels of non performing loans
Strategy results in heavier bias towards buy
to let than industry
− 59% of portfolio vs. 14% CML average
UK BTL has demonstrated stronger over the
cycle performance than owner occupied
(1) Indexed LTV as at 31 December 2014. (2) Based on mortgages outstanding at the end of Q3 2014. 8
UK BTL sector with strong performance over the cycle
Proportion of Buy to Let mortgages
59%
41%
Buy to let
14%
86%
Owner occupied
0.0%
1.0%
2.0%
3.0%
4.0%
CM
L se
ctor
dat
a
(arre
ars
>3 m
onth
s)
Total Owner occupied BTL
1.4% 1.5%
0.7%
Aldermore Buy to Let Portfolio% of total portfolio
Weighted average
LTV(1) (%)Seasoning (months)
>3 months in arrears
(%)
SME Commercial Mortgages 50% 55.7% 23 0.01%
Residential Mortgages 62% 64.2% 22 0.17%
Aldermore CML industry average(2)
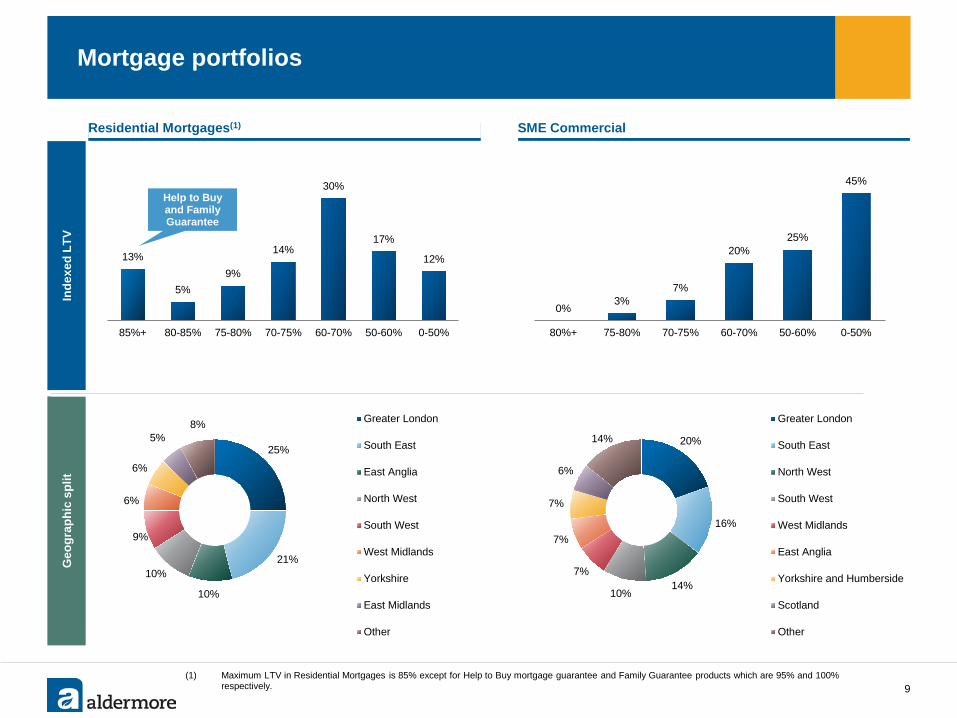
Mortgage portfolios
Residential Mortgages(1) SME Commercial
(1) Maximum LTV in Residential Mortgages is 85% except for Help to Buy mortgage guarantee and Family Guarantee products which are 95% and 100% respectively.
Inde
xed
LTV
Geo
grap
hic
split
25%
21%
10%
10%
9%
6%
6%
5% 8% Greater London
South East
East Anglia
North West
South West
West Midlands
Yorkshire
East Midlands
Other
20%
16%
14% 10%
7%
7%
7%
6%
14%
Greater London
South East
North West
South West
West Midlands
East Anglia
Yorkshire and Humberside
Scotland
Other
9
13%
5% 9%
14%
30%
17%
12%
85%+ 80-85% 75-80% 70-75% 60-70% 50-60% 0-50%
0% 3%
7%
20% 25%
45%
80%+ 75-80% 70-75% 60-70% 50-60% 0-50%
Help to Buy and Family Guarantee
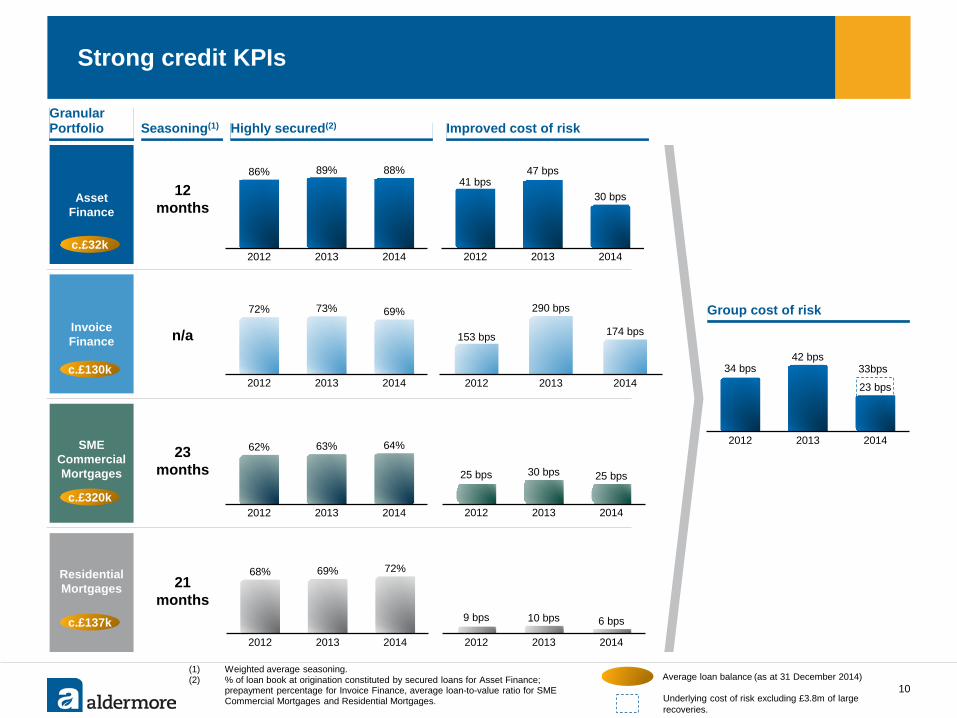
Strong credit KPIs
10 Average loan balance (as at 31 December 2014)
(1) Weighted average seasoning. (2) % of loan book at origination constituted by secured loans for Asset Finance;
prepayment percentage for Invoice Finance, average loan-to-value ratio for SME Commercial Mortgages and Residential Mortgages.
Granular Portfolio Improved cost of risk Highly secured(2)
Asset Finance
Invoice Finance
SME Commercial Mortgages
Residential Mortgages
c.£32k
c.£130k
c.£320k
c.£137k
25 bps 30 bps 25 bps
2012 2013 2014
41 bps 47 bps
30 bps
2012 2013 2014
9 bps 10 bps 6 bps
2012 2013 2014
153 bps
290 bps
174 bps
2012 2013 2014
68% 69% 72%
2012 2013 2014
62% 63% 64%
2012 2013 2014
72% 73% 69%
2012 2013 2014
86% 89% 88%
2012 2013 2014
Group cost of risk
34 bps 42 bps
23 bps
2012 2013 2014
Underlying cost of risk excluding £3.8m of large recoveries.
33bps
Seasoning(1)
12 months
n/a
23 months
21 months
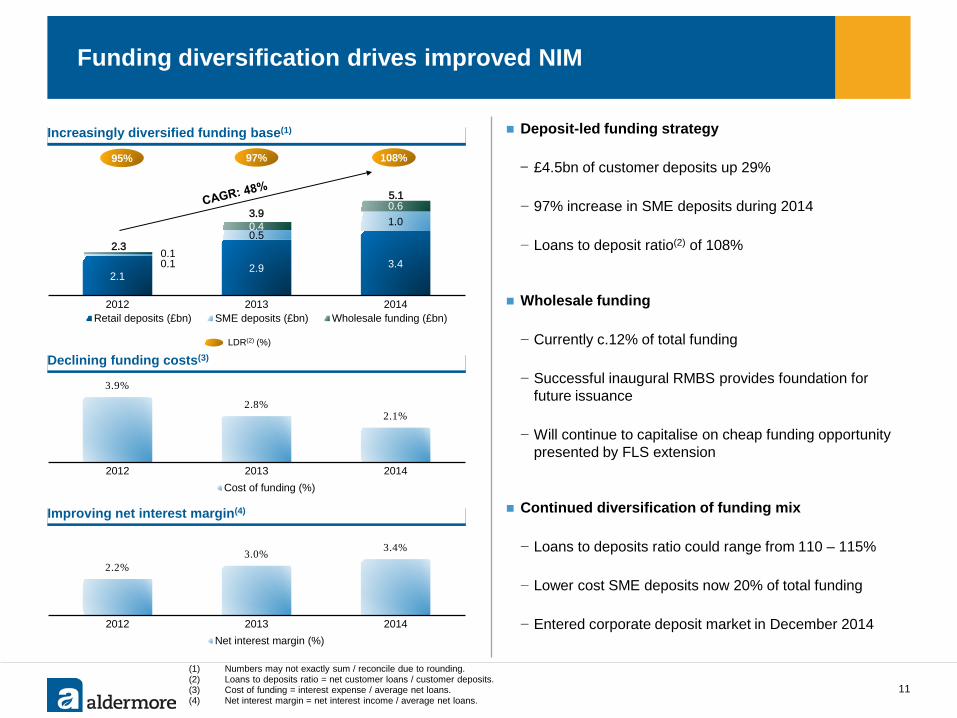
2.1 2.9 3.4 0.1
0.5 1.0
0.1
0.4
0.6
2.3
3.9
2012 2013 2014Retail deposits (£bn) SME deposits (£bn) Wholesale funding (£bn)
5.1
3.9%
2.8% 2.1%
2012 2013 2014Cost of funding (%)
Funding diversification drives improved NIM
97%
LDR(2) (%)
Increasingly diversified funding base(1)
(1) Numbers may not exactly sum / reconcile due to rounding. (2) Loans to deposits ratio = net customer loans / customer deposits. (3) Cost of funding = interest expense / average net loans. (4) Net interest margin = net interest income / average net loans.
11
108%
Deposit-led funding strategy
− £4.5bn of customer deposits up 29%
− 97% increase in SME deposits during 2014
− Loans to deposit ratio(2) of 108%
Wholesale funding
− Currently c.12% of total funding
− Successful inaugural RMBS provides foundation for future issuance
− Will continue to capitalise on cheap funding opportunity presented by FLS extension
Continued diversification of funding mix
− Loans to deposits ratio could range from 110 – 115%
− Lower cost SME deposits now 20% of total funding
− Entered corporate deposit market in December 2014
Declining funding costs(3)
95%
Improving net interest margin(4)
2.2% 3.0% 3.4%
2012 2013 2014Net interest margin (%)
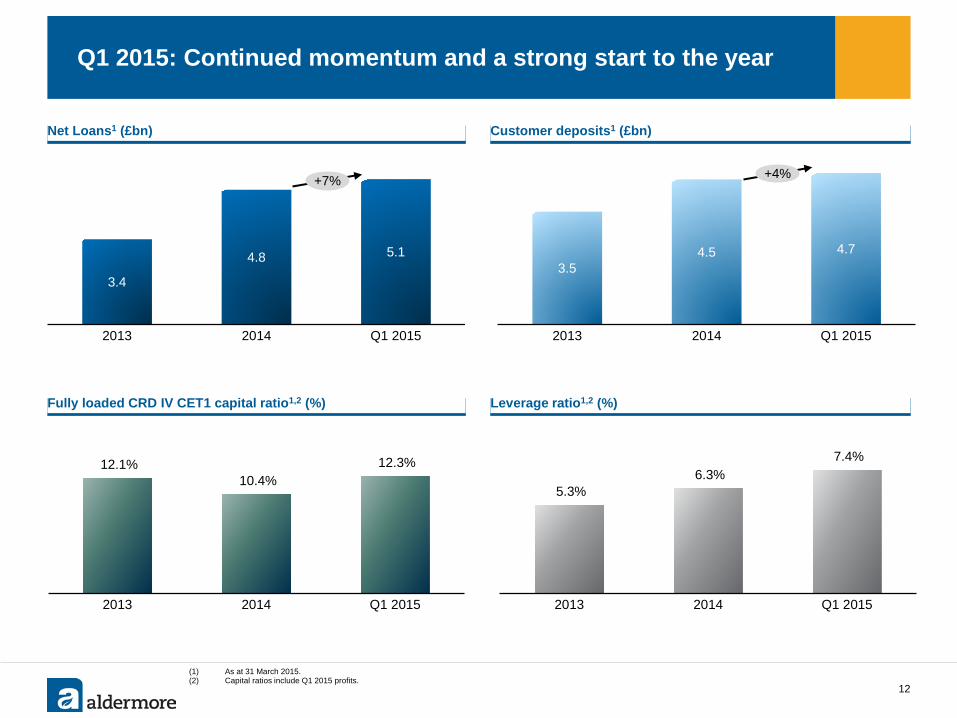
12.1% 10.4%
12.3%
2013 2014 Q1 2015
3.4
4.8 5.1
2013 2014 Q1 2015
Q1 2015: Continued momentum and a strong start to the year
Net Loans1 (£bn)
Fully loaded CRD IV CET1 capital ratio1,2 (%)
(1) As at 31 March 2015. (2) Capital ratios include Q1 2015 profits.
12
Customer deposits1 (£bn)
Leverage ratio1,2 (%)
3.5 4.5 4.7
2013 2014 Q1 2015
5.3% 6.3%
7.4%
2013 2014 Q1 2015
+7% +4%
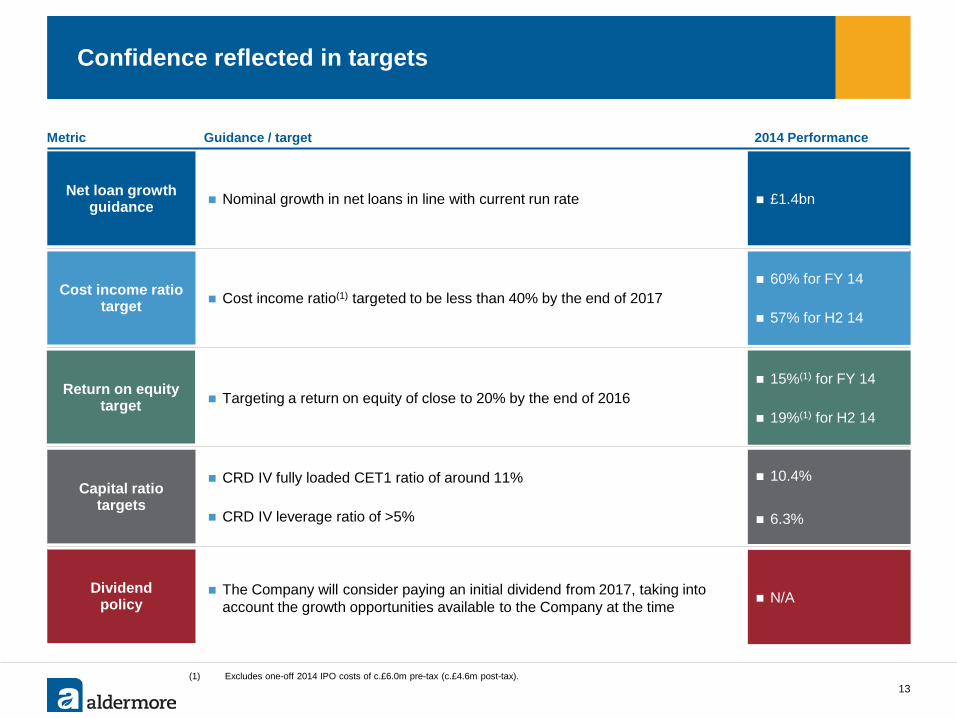
Confidence reflected in targets
(1) Excludes one-off 2014 IPO costs of c.£6.0m pre-tax (c.£4.6m post-tax). 13
Metric
Cost income ratio target Cost income ratio(1) targeted to be less than 40% by the end of 2017
Return on equity target Targeting a return on equity of close to 20% by the end of 2016
Nominal growth in net loans in line with current run rate Net loan growth guidance
Capital ratio targets
CRD IV fully loaded CET1 ratio of around 11%
CRD IV leverage ratio of >5%
Dividend policy
The Company will consider paying an initial dividend from 2017, taking into account the growth opportunities available to the Company at the time
£1.4bn
60% for FY 14
57% for H2 14
15%(1) for FY 14
19%(1) for H2 14
10.4% 6.3%
N/A
Guidance / target 2014 Performance
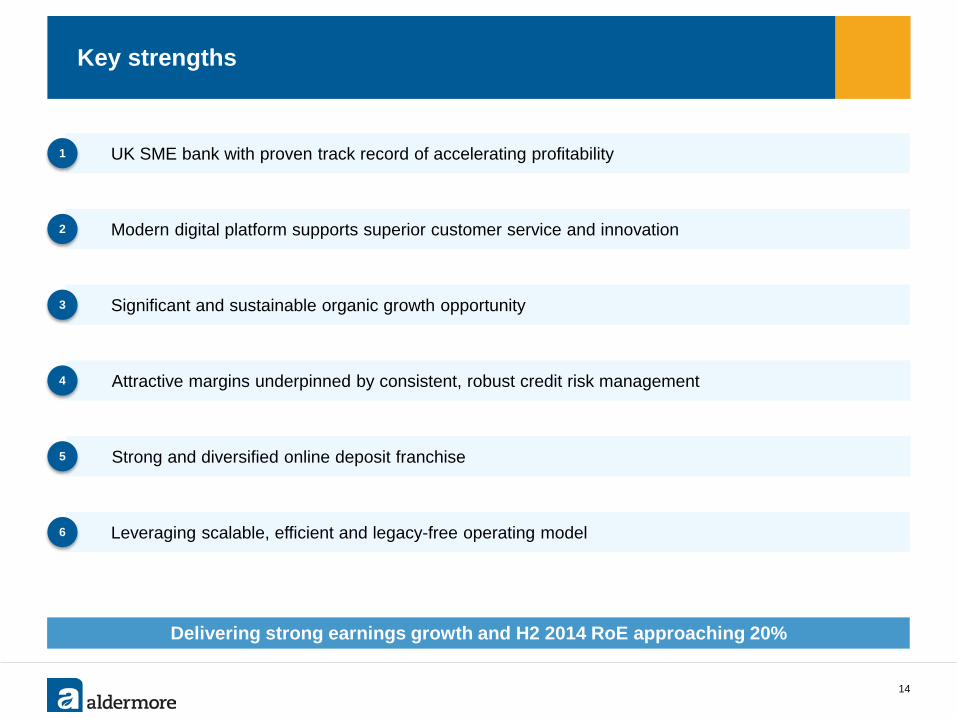
Key strengths
UK SME bank with proven track record of accelerating profitability
Significant and sustainable organic growth opportunity
Strong and diversified online deposit franchise
Leveraging scalable, efficient and legacy-free operating model
Modern digital platform supports superior customer service and innovation
Attractive margins underpinned by consistent, robust credit risk management
1
2
3
4
5
6
Delivering strong earnings growth and H2 2014 RoE approaching 20%
14
15
Disclaimer
The provision of the information in this document (the “Information”) or any part of it does not constitute, and should not be construed as, investment advice or part of any offer or invitation to sell, or any recommendation or invitation to purchase, or any solicitation of any offer to purchase or subscribe for, any securities in any member of the Aldermore Group PLC (the “Company”) or its subsidiaries from time to time (the “Group”) and is not intended to provide the basis of any investment decision, nor does it nor is it intended to form the basis of any contract for acquisition or investment in any member of the Group, financial promotion, or any offer, invitation or recommendation in relation to any acquisition of, or investment in, any member of the Group in any jurisdiction. The Information is not directed to or intended for distribution to, or use by, any person or entity in any jurisdiction where such distribution, publication, availability or use would be contrary to local laws or regulations or require any registration or licensing within such jurisdiction, including without limitation Australia, Canada, Japan or the United States. None of the Company or any of its associates, accepts any liability to any person in relation to the distribution or possession of the Information in or from any such jurisdiction. No representation or warranty, express or implied, is given by or on behalf of the Company or its affiliates, agents, advisers, parent or subsidiary undertakings, shareholders, directors, partners, employees or any other person (“Associates”) as to, and no reliance may be placed for any purposes whatsoever on, the adequacy, accuracy, completeness, fairness or reasonableness of the Information, including any opinions contained within the Information. The Company and its Associates disclaim, to the fullest extent permitted by applicable law and regulation, all and any responsibility or liability whether arising in tort, contract or otherwise, which they might otherwise have in respect of any of the Information. No duty of care is owed or will be deemed to be owed to you or any other person in respect of the Information. Recipients should not construe the Information as legal, tax, regulatory, financial or accounting advice and are urged to consult with their own advisers in relation to such matters. The Information is provided as at the date of this document, is of a preliminary nature and is subject to change, without notice. The Information may change materially. None of the Company or its Associates undertakes or is under any duty to update, complete, revise or keep current the Information or to correct any inaccuracies in the Information which may become apparent, or to provide you with any additional information. Certain industry and market data contained in the Information has come from third party sources. Third party industry publications, studies and surveys generally state that the data contained therein have been obtained from sources believed to be reliable, but that there is no guarantee of the accuracy or completeness of such data. While the Company believes that each of these publications, studies and surveys has been prepared by a reputable source, the Company or its Associates have not independently verified the data contained therein. In addition, certain of the industry and market data contained in the Information comes from the Company's own internal research and estimates based on the knowledge and experience of the Company's management in the market in which the Company operates. While the Company believes that such research and estimates are reasonable and reliable, they, and their underlying methodology and assumptions, have not been verified by any independent source for accuracy or completeness and are subject to change without notice. Accordingly, no reliance should be placed on any of the industry or market data contained in the Information. The Information may contain "forward-looking statements" or "projections“ which include all statements other than statements of historical facts, including, without limitation, those regarding the Company's financial position, business strategy, plans and objectives of management for future operations, or any statements preceded by, followed by or that include the words "targets", "believes", "estimates", "expects", "aims", "intends", "will", "may", "anticipates", "projects", "plans", "forecasts", "would", "could", "should" or similar expressions or negatives thereof. Such forward-looking statements involve known and unknown risks, uncertainties and other important factors beyond the Company’s control that could cause the actual results, performance or achievements of the Company to be materially different from future results, performance or achievements expressed or implied by such forward-looking statements. Such forward looking statements are based on numerous assumptions regarding the Company's present and future business strategies and the environment in which the Company will operate in the future. Forward-looking statements involve numerous risks and uncertainties that could cause actual results to differ materially from expected results. No attempt has been made by the Company to audit or verify the forward-looking statements or any other financial information. No representation or warranty, express or implied, is made that any of these statements, projections or forecasts will come to pass or that any forecasted result will be achieved. As a result, you are cautioned not to place undue reliance on such forward-looking statements. Past performance should not be taken as an indication or guarantee of future results, and no representation or warranty, express or implied, is made regarding future performance. Some of the information is still in draft form and will only be finalised, if legally verifiable, at a later date. Forward-looking statements speak only as of their date and the Company and its Associates expressly disclaim any obligation or undertaking to supplement, amend, update or revise any of the forward-looking statements made herein, except where it would be required to do so under applicable law or regulation.