Embed Size (px)
Citation preview

Sample
Sample
Sample
Sample
Sample
Sample
Sample
Sample
Sample
Sample
Sample
Sample
Sample
Sample
Sample
Sample
Sample
Sample
Sample
Sample
Sample
Sample
Sample
Sample
Sample
Sample
Sample
Sample
Sample
Sample
Sample
Sample
Sample
Sample
Sample
Sample
Sample
Sample
Sample
Sample
Sample
Sample
Sample
Sample
Sample
Sample
Sample
Sample
Sample
Sample
Sample
Sample
Sample
Sample
Sample
Digital Research YearbookUK Higher Education
2016

Digital Research YearbookUK Higher Education 2016
SampleSampleSampleSampleSample
SampleSampleSampleSampleSample
SampleSampleSampleSampleSample
SampleSampleSampleSampleSample
SampleSampleSampleSampleSample
SampleSampleSampleSampleSample
SampleSampleSampleSampleSample
SampleSampleSampleSampleSample
SampleSampleSampleSample
SampleSampleSample
Sample
SampleSampleSampleSample
SampleSampleSample
SampleSample
Sample
© Copyright 2016 Digital Science and Research Solutions Ltd
ISBN 978-0-9929477-7-4
Copyright in this Digital Research Yearbook belongs to Digital Science and Research Solutions Ltd (DSRS). This constitutes proprietary and confidential information of DSRS. DSRS reserves all rights in and to this Digital Research Yearbook. Any copying, adaptation, distribution, transmission or disclosure of this Digital Research Yearbook (or any part of it), in any form, is strictly prohibited without the prior written consent of DSRS. Written permission must also be obtained before any part of this publication is stored in a retrieval mechanism of any kind.
Whilst all reasonable care has been taken to ensure the accuracy of the publication, neither DSRS nor any of its affiliates makes any representation, warranty, or condition of any kind, in connection with this Digital Research Yearbook or owes or accepts any duty to any person. Without prejudice to the generality of the foregoing, DSRS does not warrant or represent that the Digital Research Yearbook is correct, complete, up to date, or fit for any particular purpose. This Digital Research Yearbook is being provided for internal use and information only and any reliance placed on any part of it is done entirely at the risk of any person placing such reliance.
This Digital Research Yearbook has been compiled and produced by
Custom reporting and analysis to help you make better decisions faster.
FOR MORE INFORMATION ABOUT OUR SERVICES AND PRODUCTS
Digital Science and Research Solutions LtdThe Campus, 4 Crinan Street, London N1 9XW, UKEmail: [email protected]: digital-science.com
SampleSampleSampleSampleSample
SampleSampleSampleSampleSample
SampleSampleSampleSampleSample
SampleSampleSampleSampleSample
SampleSampleSampleSampleSample
SampleSampleSampleSampleSample
SampleSampleSampleSampleSample
SampleSampleSampleSampleSample
SampleSampleSampleSample
SampleSampleSample
Sample
SampleSampleSampleSample
SampleSampleSample
SampleSample
Sample

Table of contents
Institutional ProfilesThe substantive content of the Research Yearbook is an alphabetical series of two page Institutional Profiles employing the key data exhibits described in the Introduction.
IntroductionThe Introduction to the Research Yearbook summarises the content, highlights key data exhibits and provides an introductory interpretation to the institutional profiles.
RationaleSector groups and basis of comparisonInstitutional profilesInstitutional detailsResearcher Indicator WheelFunding TransectResearch FingerprintBrainScans of research performance and diversitySector groups and tablesList of profiled institutions
1123468
101215
Page
AppendixThe appendix to the Research Yearbook summarises the principal sources of information and how this has been analysed. The data for each primary research activity indicator in the Institutional Profiles is tabled for each institution that is profiled.
Institution profiles 16-247
How the data are compiledTables of research activity indicators
248-249250-275
SampleSampleSampleSampleSample
SampleSampleSampleSampleSample
SampleSampleSampleSampleSample
SampleSampleSampleSampleSample
SampleSampleSampleSampleSample
SampleSampleSampleSampleSample
SampleSampleSampleSampleSample
SampleSampleSampleSampleSample
SampleSampleSampleSample
SampleSampleSample
Sample
SampleSampleSampleSample
SampleSampleSample
SampleSample
Sample

SampleSampleSampleSampleSample
SampleSampleSampleSampleSample
SampleSampleSampleSampleSample
SampleSampleSampleSampleSample
SampleSampleSampleSampleSample
SampleSampleSampleSampleSample
SampleSampleSampleSampleSample
SampleSampleSampleSampleSample
SampleSampleSampleSample
SampleSampleSample
Sample
SampleSampleSampleSample
SampleSampleSample
SampleSample
Sample

1
Introduction and rationale The Digital Research Yearbook: UK Higher Education 2016 is a comprehensive overview of research activity in a core part of the national research base. Universities and Higher Education Colleges are responsible for a high proportion of basic, innovative research and train most of the highly qualified people who underpin any knowledge-based economy. The Research Yearbook profiles and compares research input, capacity and outcomes for these institutions.
The Digital Research Yearbook covers institutions that receive core funding for research (also called QR) from one of the UK’s regional Higher Education Funding Councils (HEFCs). These are HEFCE for England, DELNI for Northern Ireland, SFC for Scotland and HEFCW for Wales.
To be eligible for inclusion, institutions had to have been awarded at least five research grants from any source recorded by the Dimensions grants database and at least £1 million QR core funding during the REF2014 census period. There are 116 institutions that meet these criteria.
The Digital Research Yearbook includes information at institutional level, across broad subject domains and with the potential to explore down to a finer subject level. The contents are supported by Digital Science’s extensive consultancy experience in working with research data. The Digital Research Yearbook contains three main sections:
Introduction and background informationProfiles of individual institutions with research performance, including the Digital Science BrainScan, benchmarked against each institution’s peer sector groupRanked tables of research performance indicators by institution and by subject area
Sector groups and basis of comparisonThe UK higher education research base has grown and developed over a long period, with some institutions established centuries ago and many recent and extensive changes in funding and structure. This evolution has led to an exceptionally dynamic, flexible and productive educational and research environment. However, differences in age, size and mission mean that direct comparison between institutions is not always very informative.
We have allotted institutions to five sector groups, so as to improve the basis for fair comparison. The groups are broadly based on age, which tends to be linked to size, funding and research capacity. The groups are similar to some of the sector lobby groups, which are also broadly led by history and mission. However, among our sector groups, there are also some significant, data-driven differences.
The table listing the members of the five sector groups, and a brief note on how the groups were selected, immediately precedes the institutional profiles. In broad terms the groups are:
1. Larger, usually civic, universities and colleges, generally established prior to 19452. Other universities, generally established between 1945 and 19923. Universities generally established in 1993 following the Further & Higher Education Act4. Smaller and more recent higher education establishments5. Specialist institutions of various ages
The specialist institutions cannot be compared with one another, as their missions overlap very little. They are instead benchmarked within their portfolio area against sector group 2 (the 1945-92 group) where possible. Some specialist colleges in the visual and performing arts are not profiled here as the nature of their specialisation makes a data-driven analysis inappropriate.
SampleSampleSampleSampleSample
SampleSampleSampleSampleSample
SampleSampleSampleSampleSample
SampleSampleSampleSampleSample
SampleSampleSampleSampleSample
SampleSampleSampleSampleSample
SampleSampleSampleSampleSample
SampleSampleSampleSampleSample
SampleSampleSampleSample
SampleSampleSample
Sample
SampleSampleSampleSample
SampleSampleSample
SampleSample
Sample
2
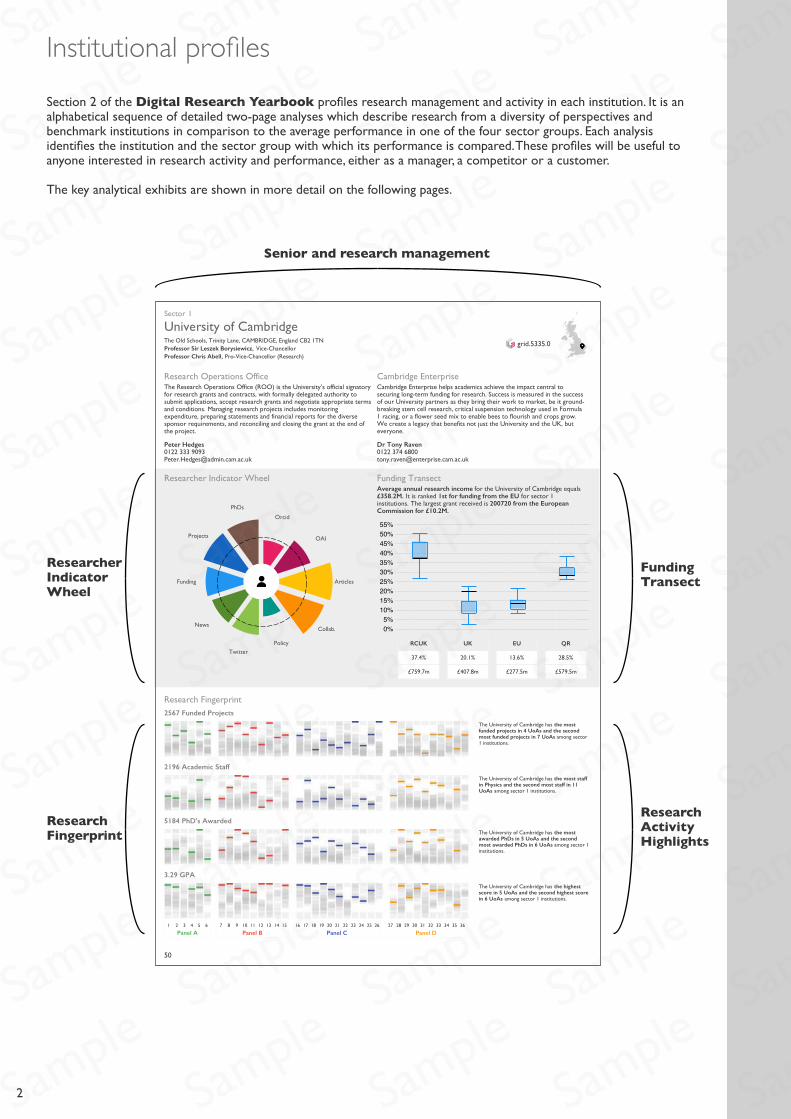
Institutional profilesSection 2 of the Digital Research Yearbook profiles research management and activity in each institution. It is an alphabetical sequence of detailed two-page analyses which describe research from a diversity of perspectives and benchmark institutions in comparison to the average performance in one of the four sector groups. Each analysis identifies the institution and the sector group with which its performance is compared. These profiles will be useful to anyone interested in research activity and performance, either as a manager, a competitor or a customer.
The key analytical exhibits are shown in more detail on the following pages.
Senior and research management
ResearchFingerprint
FundingTransect
ResearchActivityHighlights
ResearcherIndicatorWheel
SampleSampleSampleSampleSample
SampleSampleSampleSampleSample
SampleSampleSampleSampleSample
SampleSampleSampleSampleSample
SampleSampleSampleSampleSample
SampleSampleSampleSampleSample
SampleSampleSampleSampleSample
SampleSampleSampleSampleSample
SampleSampleSampleSample
SampleSampleSample
Sample
SampleSampleSampleSample
SampleSampleSample
SampleSample
Sample

3
Institutional detailsEach left-hand page is headed by core information for the institution. This identifies the institution’s name, its leadership, and the contact details for its research and commercial activity. There is a short descriptor of the relevant office functions, because the title and role of these offices can vary substantially between institutions.
We have contacted every institution about these details, to check that we have identified the offices that are responsible in these areas correctly, and that contact details and descriptions are up to date. Information about research management will be updated annually to reflect changes and to improve Digital Research Yearbook coverage. We anticipate that institutions will recognise the value of such information becoming available in a ready-reference and highly accessible format.
We asked institutions about the key manager with overall research responsibility. This is usually a member of the Senior Management Team and is often, but not always, a Pro-Vice-Chancellor or Deputy Principal. People in these posts are frequently senior academic staff and may occupy the post on a cyclical basis.
The institutional address and central telephone number provide a route to senior managers and research offices. Many institutions have offices dealing specifically with research grants and contracts and with research exploitation and industrial collaboration. Sometimes there are two offices, one of which handles public sector research grants from Research Councils and charities while a second is responsible for industrial liaison, academic consultancy and commercial R&D contracts. We have sought to include information about both wherever possible.
Sector group Principal officers
Key contact details
GRID id and location
Main office supportingresearch commercialisation
Main office supportingacademic research
SampleSampleSampleSampleSample
SampleSampleSampleSampleSample
SampleSampleSampleSampleSample
SampleSampleSampleSampleSample
SampleSampleSampleSampleSample
SampleSampleSampleSampleSample
SampleSampleSampleSampleSample
SampleSampleSampleSampleSample
SampleSampleSampleSample
SampleSampleSample
Sample
SampleSampleSampleSample
SampleSampleSample
SampleSample
Sample
4
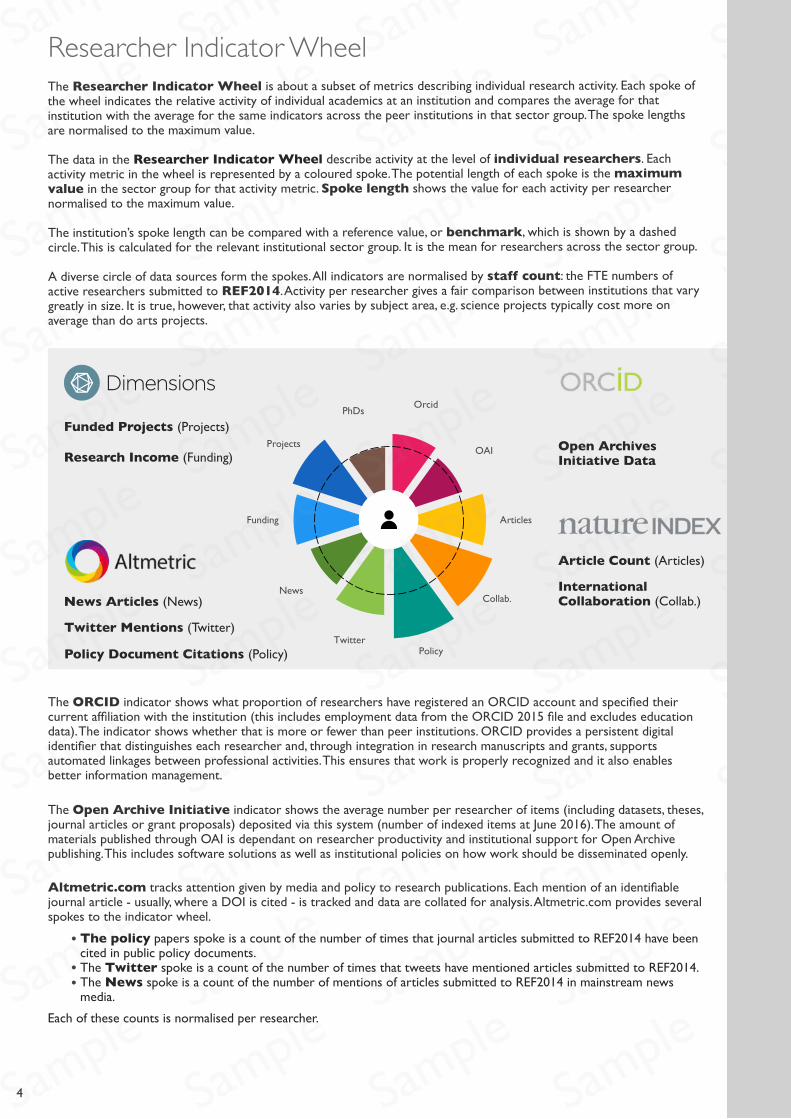
The Researcher Indicator Wheel is about a subset of metrics describing individual research activity. Each spoke of the wheel indicates the relative activity of individual academics at an institution and compares the average for that institution with the average for the same indicators across the peer institutions in that sector group. The spoke lengths are normalised to the maximum value.
The data in the Researcher Indicator Wheel describe activity at the level of individual researchers. Each activity metric in the wheel is represented by a coloured spoke. The potential length of each spoke is the maximum value in the sector group for that activity metric. Spoke length shows the value for each activity per researcher normalised to the maximum value.
The institution’s spoke length can be compared with a reference value, or benchmark, which is shown by a dashed circle. This is calculated for the relevant institutional sector group. It is the mean for researchers across the sector group.
A diverse circle of data sources form the spokes. All indicators are normalised by staff count: the FTE numbers of active researchers submitted to REF2014. Activity per researcher gives a fair comparison between institutions that vary greatly in size. It is true, however, that activity also varies by subject area, e.g. science projects typically cost more on average than do arts projects.
Researcher Indicator Wheel
The ORCID indicator shows what proportion of researchers have registered an ORCID account and specified their current affiliation with the institution (this includes employment data from the ORCID 2015 file and excludes education data). The indicator shows whether that is more or fewer than peer institutions. ORCID provides a persistent digital identifier that distinguishes each researcher and, through integration in research manuscripts and grants, supports automated linkages between professional activities. This ensures that work is properly recognized and it also enables better information management.
The Open Archive Initiative indicator shows the average number per researcher of items (including datasets, theses, journal articles or grant proposals) deposited via this system (number of indexed items at June 2016). The amount of materials published through OAI is dependant on researcher productivity and institutional support for Open Archive publishing. This includes software solutions as well as institutional policies on how work should be disseminated openly.
Altmetric.com tracks attention given by media and policy to research publications. Each mention of an identifiable journal article - usually, where a DOI is cited - is tracked and data are collated for analysis. Altmetric.com provides several spokes to the indicator wheel.
The policy papers spoke is a count of the number of times that journal articles submitted to REF2014 have been cited in public policy documents.The Twitter spoke is a count of the number of times that tweets have mentioned articles submitted to REF2014.The News spoke is a count of the number of mentions of articles submitted to REF2014 in mainstream news media.
Each of these counts is normalised per researcher.
Open ArchivesInitiative Data
Policy Document Citations (Policy)
Twitter Mentions (Twitter)
News Articles (News)
Funded Projects (Projects)
Research Income (Funding)
InternationalCollaboration (Collab.)
Article Count (Articles)
SampleSampleSampleSampleSample
SampleSampleSampleSampleSample
SampleSampleSampleSampleSample
SampleSampleSampleSampleSample
SampleSampleSampleSampleSample
SampleSampleSampleSampleSample
SampleSampleSampleSampleSample
SampleSampleSampleSampleSample
SampleSampleSampleSample
SampleSampleSample
Sample
SampleSampleSampleSample
SampleSampleSample
SampleSample
Sample
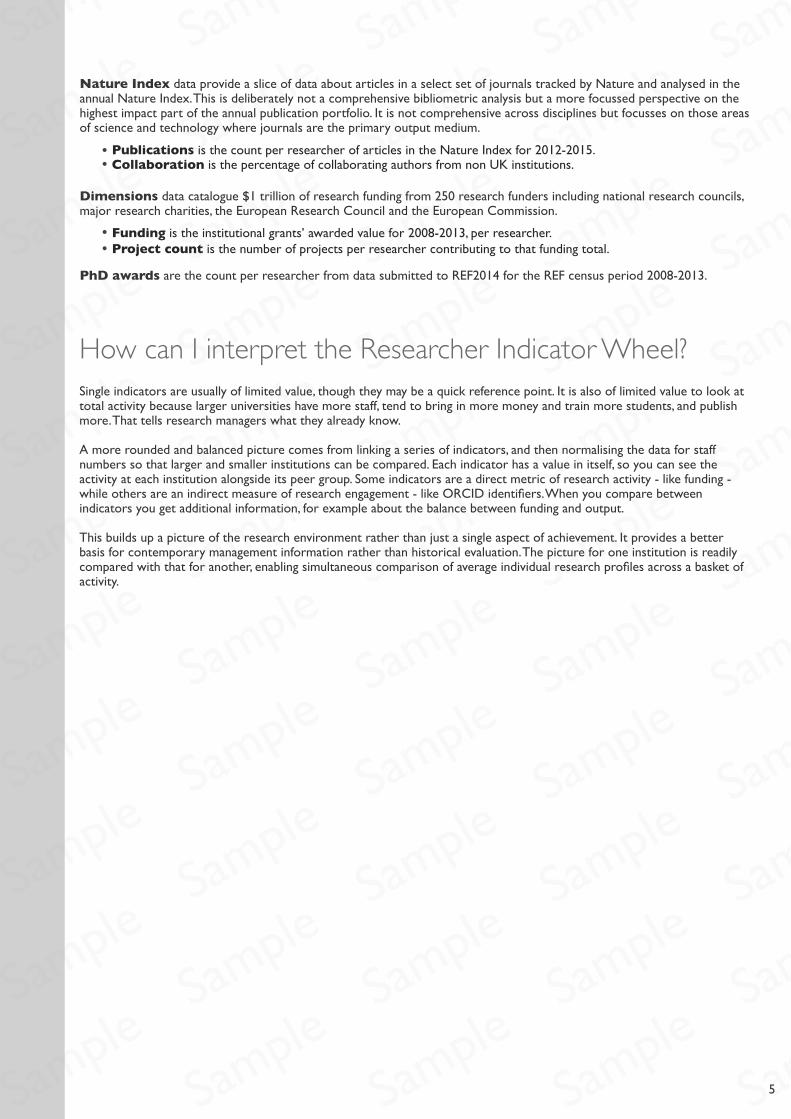
How can I interpret the Researcher Indicator Wheel?Single indicators are usually of limited value, though they may be a quick reference point. It is also of limited value to look at total activity because larger universities have more staff, tend to bring in more money and train more students, and publish more. That tells research managers what they already know.
A more rounded and balanced picture comes from linking a series of indicators, and then normalising the data for staff numbers so that larger and smaller institutions can be compared. Each indicator has a value in itself, so you can see the activity at each institution alongside its peer group. Some indicators are a direct metric of research activity - like funding - while others are an indirect measure of research engagement - like ORCID identifiers. When you compare between indicators you get additional information, for example about the balance between funding and output.
This builds up a picture of the research environment rather than just a single aspect of achievement. It provides a better basis for contemporary management information rather than historical evaluation. The picture for one institution is readily compared with that for another, enabling simultaneous comparison of average individual research profiles across a basket of activity.
Nature Index data provide a slice of data about articles in a select set of journals tracked by Nature and analysed in the annual Nature Index. This is deliberately not a comprehensive bibliometric analysis but a more focussed perspective on the highest impact part of the annual publication portfolio. It is not comprehensive across disciplines but focusses on those areas of science and technology where journals are the primary output medium.
Publications is the count per researcher of articles in the Nature Index for 2012-2015.Collaboration is the percentage of collaborating authors from non UK institutions.
Dimensions data catalogue $1 trillion of research funding from 250 research funders including national research councils, major research charities, the European Research Council and the European Commission.
Funding is the institutional grants’ awarded value for 2008-2013, per researcher.Project count is the number of projects per researcher contributing to that funding total.
PhD awards are the count per researcher from data submitted to REF2014 for the REF census period 2008-2013.
5SampleSampleSampleSampleSample
SampleSampleSampleSampleSample
SampleSampleSampleSampleSample
SampleSampleSampleSampleSample
SampleSampleSampleSampleSample
SampleSampleSampleSampleSample
SampleSampleSampleSampleSample
SampleSampleSampleSampleSample
SampleSampleSampleSample
SampleSampleSample
Sample
SampleSampleSampleSample
SampleSampleSample
SampleSample
Sample
6
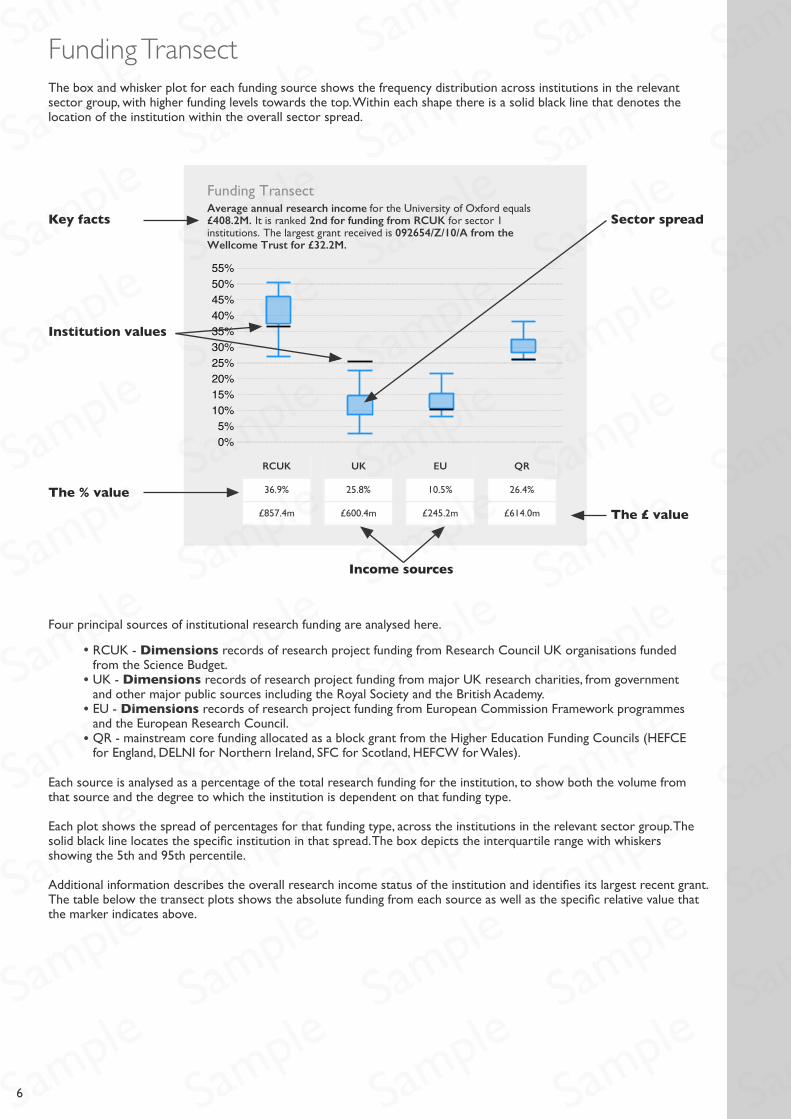
Funding TransectThe box and whisker plot for each funding source shows the frequency distribution across institutions in the relevant sector group, with higher funding levels towards the top. Within each shape there is a solid black line that denotes the location of the institution within the overall sector spread.
Four principal sources of institutional research funding are analysed here.
RCUK - Dimensions records of research project funding from Research Council UK organisations funded from the Science Budget.UK - Dimensions records of research project funding from major UK research charities, from government and other major public sources including the Royal Society and the British Academy.EU - Dimensions records of research project funding from European Commission Framework programmes and the European Research Council.QR - mainstream core funding allocated as a block grant from the Higher Education Funding Councils (HEFCE for England, DELNI for Northern Ireland, SFC for Scotland, HEFCW for Wales).
Each source is analysed as a percentage of the total research funding for the institution, to show both the volume from that source and the degree to which the institution is dependent on that funding type.
Each plot shows the spread of percentages for that funding type, across the institutions in the relevant sector group. The solid black line locates the specific institution in that spread. The box depicts the interquartile range with whiskers showing the 5th and 95th percentile.
Additional information describes the overall research income status of the institution and identifies its largest recent grant. The table below the transect plots shows the absolute funding from each source as well as the specific relative value that the marker indicates above.
Key facts
Institution values
The % valueThe £ value
Income sources
Sector spread
SampleSampleSampleSampleSample
SampleSampleSampleSampleSample
SampleSampleSampleSampleSample
SampleSampleSampleSampleSample
SampleSampleSampleSampleSample
SampleSampleSampleSampleSample
SampleSampleSampleSampleSample
SampleSampleSampleSampleSample
SampleSampleSampleSample
SampleSampleSample
Sample
SampleSampleSampleSample
SampleSampleSample
SampleSample
Sample

How can I interpret the Funding Transect?No institution with a significant research portfolio relies on funding from just one source. Variation in the balance of support across institutions is of interest. This analysis summarises data for four major streams of research income: core QR funding geared to RAE/REF scores; specific Research Council project funding; major UK research charities and public sector R&D funds; and European FP and ERC funds.
The typical balance for each of these funding sources varies from about 10% to 40% of total research income. There are some more extreme values. High dependency on one source, such as QR, naturally means that a lower percentage of income is being brought in by specific research projects. Where research activity is largely funded from specific grants and contracts so the relative share for core QR falls.
It is likely to be beneficial to have a spread of funding sources. Diverse income streams are also likely to be an indicator of research activity that has been of wide interest and value for multiple stakeholders in terms of both relevance (for funders) and promise (for peer reviewers).
7SampleSampleSampleSampleSample
SampleSampleSampleSampleSample
SampleSampleSampleSampleSample
SampleSampleSampleSampleSample
SampleSampleSampleSampleSample
SampleSampleSampleSampleSample
SampleSampleSampleSampleSample
SampleSampleSampleSampleSample
SampleSampleSampleSample
SampleSampleSample
Sample
SampleSampleSampleSample
SampleSampleSample
SampleSample
Sample

Research FingerprintThe Research Fingerprint is a profile of the institution’s research make-up. The data are displayed across the disciplinary Units of Assessment (UOAs) used in REF2014 and grouped by Main Panel. Each UOA column shows the sectoral spread of institutional activity. Within each column there is a coloured bar, among the grey spread, that denotes the location of the specific institution.
The Research Fingerprint brings together four parts of an institutional research profile at a disciplinary level, represented by the RAE/REF Units of Assessment (UOAs).
Each block of graphics identifies a total for the relevant activity and then shows how this is spread across UOAs.The institution’s position is marked by a coloured line in the sector spread.The spread for all the institutions in the sector group is shown by the grey lines, where greater intensity indicates more institutions.The spread is normalised against the maximum within each UOA.
The four components profiled are:Input to the research system, represented by the number of projects indexed in the Dimensions grants database. The institutional project total is given as a reference and the graphic then shows how these are spread across each UOA and highlights recent funding achievements.Capacity of the research system, represented by the FTE numbers of research active staff submitted to REF2014. Output related to that capacity, represented by the numbers of PhD awards during the REF2014 census period.Outcome of research investment, represented by the Grade Point Average (GPA) achieved by that institution’s UOA in REF2014.
8
These analysescover:
FundingInput
StaffCapacity
TrainedOutput
PerformanceOutcome
Institution values The maximum Sector spread
Research highlightsUoA numbersPanel groups
SampleSampleSampleSampleSample
SampleSampleSampleSampleSample
SampleSampleSampleSampleSample
SampleSampleSampleSampleSample
SampleSampleSampleSampleSample
SampleSampleSampleSampleSample
SampleSampleSampleSampleSample
SampleSampleSampleSampleSample
SampleSampleSampleSample
SampleSampleSample
Sample
SampleSampleSampleSample
SampleSampleSample
SampleSample
Sample

How can I interpret the Research Fingerprint?High performance on any one indicator in any one UOA may be good news, but it is the comparisons across different activity areas and within the related UOAs of each main panel that will be more interesting.
Size is a main driver of research activity, and staff capacity will affect both grant income and training output. The comparison between an institution’s position on all three of these within any one UOA will show how successful its staff are being at acquiring resources and at building future knowledge capacity.
Training productivity is a better output measure than, for example, journal articles. Publications vary a great deal in substance and significance. People are a more consistent unit measure and better reflect the capability of the institution to sustain the research base and add to the pool of highly skilled people who can then use their knowledge across the wide economy.
The Grade Point Average (GPA) assigned during the REF assessment process is a synthesised judgment, by peer review, across a portfolio of evidence. It is therefore arguably more balanced and comprehensive than a summary citation analysis.
Comparisons across UOAs within a Main Panel and between Main Panels suggest how diverse or specialist an institution’s research may be. This can be a useful aid to interpreting the Funding Transect, because institutions with a greater science and technology capacity are likely to be bringing in more money for those more costly research areas.
Research HighlightsThe snippets of information about key research achievements both highlight an institution’s successes and remind the user of the wealth of detail that lies beneath the Research Fingerprint summary graphics.
Reading snippets across institutions also provides comparative background on research successes and draws attention to the pervasive spread of achievement among UK research institutions.
9SampleSampleSampleSampleSample
SampleSampleSampleSampleSample
SampleSampleSampleSampleSample
SampleSampleSampleSampleSample
SampleSampleSampleSampleSample
SampleSampleSampleSampleSample
SampleSampleSampleSampleSample
SampleSampleSampleSampleSample
SampleSampleSampleSample
SampleSampleSample
Sample
SampleSampleSampleSample
SampleSampleSample
SampleSample
Sample
10
Education Systems
Curriculum andPedagogy
Specialist Studies In Education
Psychology
Cognitive Sciences
Econometrics
Applied Economics
Economic Theory
Performing Arts and Creative Writing
Visual Arts and Crafts
Film, Television and Digital Media
Journalism and Professional Writing
Art Theory and Criticism
Applied Ethics
History and Philosophy of Specific Fields
Philosophy
Religion and Religious Studies
Banking, Finance and Investment
Business and Management
Accounting, Auditing and AccountabilityTourism
Commercial Services
Marketing
Library and Information Studies
Historical StudiesCuratorial and Related Studies
Archaeology
Urban and Regional Planning
Architecture
Design Practice andManagement Building
Nursing
Public Health and Health Services
Sociology
Law
Anthropology
Demography
Criminology
Policy and Administration
Human Geography
Social Work
Political Science
Cultural Studies
Language Studies
Communication and Media Studies
Linguistics
Literary Studies
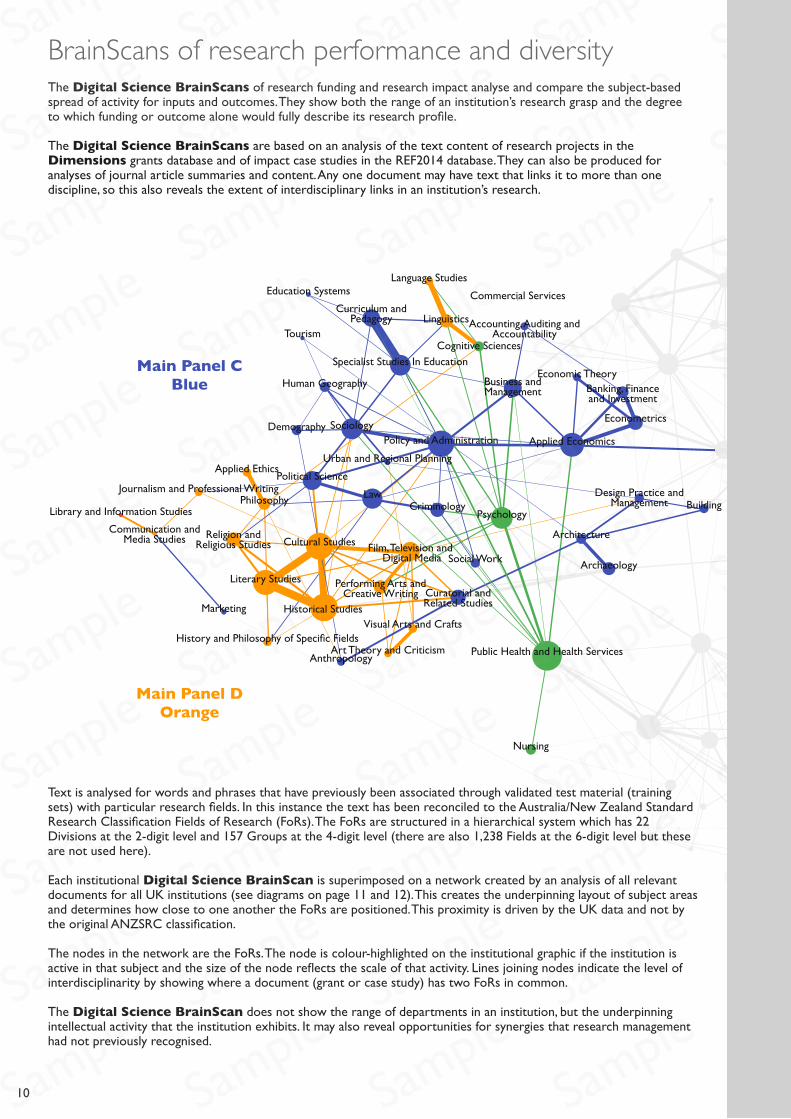
BrainScans of research performance and diversityThe Digital Science BrainScans of research funding and research impact analyse and compare the subject-based spread of activity for inputs and outcomes. They show both the range of an institution’s research grasp and the degree to which funding or outcome alone would fully describe its research profile.
The Digital Science BrainScans are based on an analysis of the text content of research projects in the Dimensions grants database and of impact case studies in the REF2014 database. They can also be produced for analyses of journal article summaries and content. Any one document may have text that links it to more than one discipline, so this also reveals the extent of interdisciplinary links in an institution’s research.
Text is analysed for words and phrases that have previously been associated through validated test material (training sets) with particular research fields. In this instance the text has been reconciled to the Australia/New Zealand Standard Research Classification Fields of Research (FoRs). The FoRs are structured in a hierarchical system which has 22 Divisions at the 2-digit level and 157 Groups at the 4-digit level (there are also 1,238 Fields at the 6-digit level but these are not used here).
Each institutional Digital Science BrainScan is superimposed on a network created by an analysis of all relevant documents for all UK institutions (see diagrams on page 11 and 12). This creates the underpinning layout of subject areas and determines how close to one another the FoRs are positioned. This proximity is driven by the UK data and not by the original ANZSRC classification.
The nodes in the network are the FoRs. The node is colour-highlighted on the institutional graphic if the institution is active in that subject and the size of the node reflects the scale of that activity. Lines joining nodes indicate the level of interdisciplinarity by showing where a document (grant or case study) has two FoRs in common.
The Digital Science BrainScan does not show the range of departments in an institution, but the underpinning intellectual activity that the institution exhibits. It may also reveal opportunities for synergies that research management had not previously recognised.
Main Panel CBlue
Main Panel DOrange
SampleSampleSampleSampleSample
SampleSampleSampleSampleSample
SampleSampleSampleSampleSample
SampleSampleSampleSampleSample
SampleSampleSampleSampleSample
SampleSampleSampleSampleSample
SampleSampleSampleSampleSample
SampleSampleSampleSampleSample
SampleSampleSampleSample
SampleSampleSample
Sample
SampleSampleSampleSample
SampleSampleSample
SampleSample
Sample
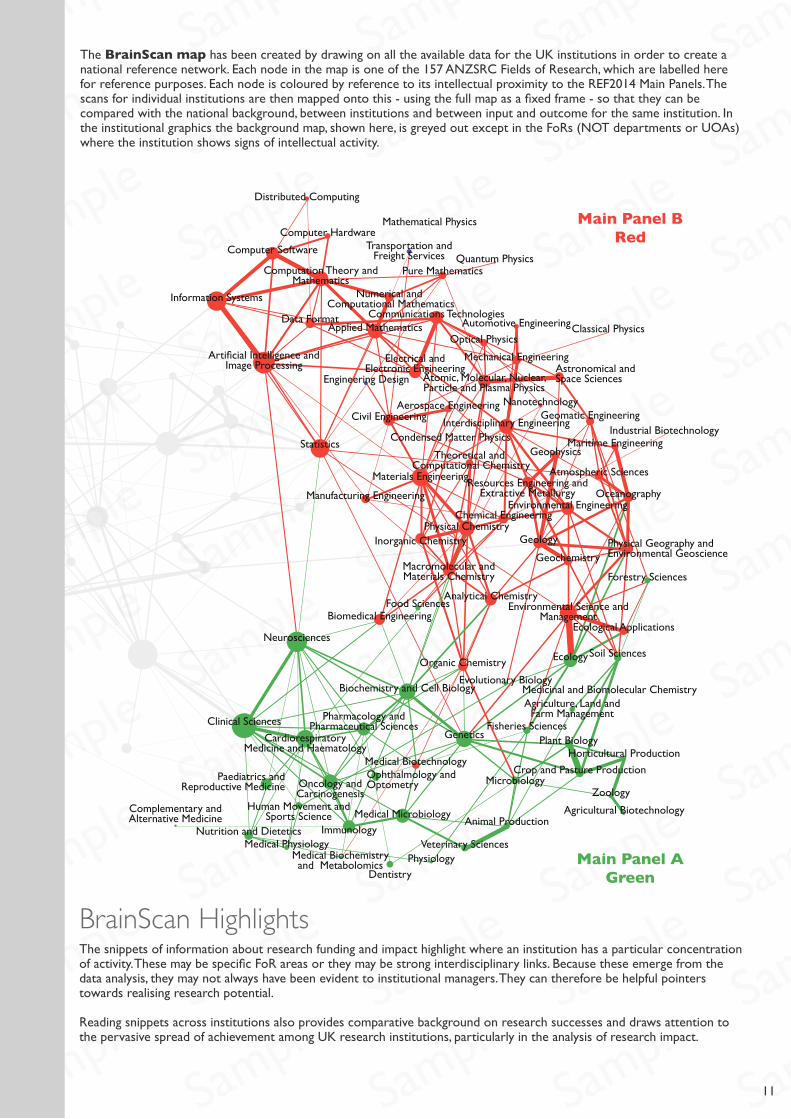
The BrainScan map has been created by drawing on all the available data for the UK institutions in order to create a national reference network. Each node in the map is one of the 157 ANZSRC Fields of Research, which are labelled here for reference purposes. Each node is coloured by reference to its intellectual proximity to the REF2014 Main Panels. The scans for individual institutions are then mapped onto this - using the full map as a fixed frame - so that they can be compared with the national background, between institutions and between input and outcome for the same institution. In the institutional graphics the background map, shown here, is greyed out except in the FoRs (NOT departments or UOAs) where the institution shows signs of intellectual activity.
BrainScan HighlightsThe snippets of information about research funding and impact highlight where an institution has a particular concentration of activity. These may be specific FoR areas or they may be strong interdisciplinary links. Because these emerge from the data analysis, they may not always have been evident to institutional managers. They can therefore be helpful pointers towards realising research potential.
Reading snippets across institutions also provides comparative background on research successes and draws attention to the pervasive spread of achievement among UK research institutions, particularly in the analysis of research impact.
Main Panel BRed
Main Panel AGreen
11
Theoretical and Computational Chemistry
Physical Chemistry
Organic Chemistry
Medicinal and Biomolecular Chemistry
Macromolecular and Materials Chemistry
Inorganic Chemistry
Analytical Chemistry
Ecology
Evolutionary BiologyBiochemistry and Cell Biology
Physiology
Plant BiologyGenetics
MicrobiologyZoology
Materials Engineering
Mechanical Engineering
Manufacturing Engineering
Maritime Engineering
Resources Engineering andExtractive Metallurgy
Interdisciplinary Engineering
Quantum Physics
Condensed Matter Physics
Optical Physics
Atomic, Molecular, Nuclear, Particle and Plasma Physics
Classical Physics
Astronomical and Space Sciences
Mathematical Physics
Statistics
Pure Mathematics
Numerical and Computational Mathematics
Applied Mathematics
Civil Engineering
Chemical EngineeringEnvironmental Engineering
Electrical andElectronic Engineering
Aerospace Engineering
Biomedical Engineering
Automotive Engineering
Geomatic Engineering
Food Sciences
Nanotechnology
Computer Hardware
Communications Technologies
Medical Biotechnology
Industrial Biotechnology
Agricultural Biotechnology
Ecological Applications
Soil Sciences
Environmental Science and Management
Transportation andFreight Services
Data Format
Distributed Computing
Information Systems
Artificial Intelligence and Image Processing
Computation Theory and Mathematics
Computer Software
Human Movement andSports Science
Immunology
Complementary and Alternative Medicine
Dentistry
Cardiorespiratory Medicine and Haematology
Clinical Sciences
Medical Biochemistryand Metabolomics
Medical Microbiology
Neurosciences
Engineering Design
Atmospheric Sciences
Geochemistry
Geology
Geophysics
Oceanography
Physical Geography and Environmental Geoscience
Nutrition and Dietetics
Ophthalmology and OptometryOncology and
Carcinogenesis
Pharmacology and Pharmaceutical Sciences
Paediatrics and Reproductive Medicine
Medical Physiology
Crop and Pasture Production
Animal Production
Agriculture, Land andFarm Management
Veterinary Sciences
Horticultural Production
Forestry Sciences
Fisheries Sciences
SampleSampleSampleSampleSample
SampleSampleSampleSampleSample
SampleSampleSampleSampleSample
SampleSampleSampleSampleSample
SampleSampleSampleSampleSample
SampleSampleSampleSampleSample
SampleSampleSampleSampleSample
SampleSampleSampleSampleSample
SampleSampleSampleSample
SampleSampleSample
Sample
SampleSampleSampleSample
SampleSampleSample
SampleSample
Sample

Sector groupsThe UK higher education institutions included in the Digital Research Yearbook are all funded by one of the HE Funding Councils in England, Northern Ireland, Wales or Scotland. To be eligible for inclusion, institutions had to have been awarded at least five research grants from any source recorded by the Dimensions research awards database and at least £1 million QR core funding during the REF2014 census period.
It is not informative to compare the research profile of large, long established institutions directly with more recent foundations or with specialist institutions. They will obviously be different. The Digital Research Yearbook provides a more informative basis for comparison by using sector groups of institutions with relatively similar history and scale. These groups bear some resemblance to various sector representative groups but also diverge in significant respects and are not intended to mimic those groups.
In the institutional pages, the reference benchmark used for each institution is the average activity or performance for the relevant Sector group, which is identified on each institutional page.
Sector group 1 has 18 member institutions. These are generally universities and colleges founded before 1914, often with strong civic origins.
Queen’s University BelfastUniversity of BirminghamUniversity of BristolUniversity of CambridgeCardiff UniversityUniversity of EdinburghUniversity of GlasgowUniversity of LeedsUniversity of LiverpoolImperial College London
King’s College LondonUniversity College LondonUniversity of ManchesterNewcastle UniversityUniversity of NottinghamUniversity of OxfordUniversity of SheffieldUniversity of Southampton
Sector group 2 has 36 member institutions. These are generally universities and colleges founded after 1945, although some have an older origin as colleges of other universities.
University of AberdeenAberystwyth UniversityAston UniversityUniversity of BathBangor UniversityUniversity of BradfordCranfield UniversityUniversity of DundeeDurham UniversityUniversity of East AngliaUniversity of EssexUniversity of ExeterUniversity of HullHeriot-Watt UniversityKeele UniversityUniversity of KentLancaster UniversityUniversity of LeicesterBirkbeck, University of LondonBrunel University London
City University LondonQueen Mary University of LondonRoyal Holloway University of LondonLoughborough UniversityOpen UniversityUniversity of ReadingUniversity of St AndrewsUniversity of SalfordUniversity of StirlingUniversity of StrathclydeUniversity of SurreyUniversity of SussexSwansea UniversityUniversity of UlsterUniversity of YorkUniversity of Warwick
12SampleSampleSampleSampleSample
SampleSampleSampleSampleSample
SampleSampleSampleSampleSample
SampleSampleSampleSampleSample
SampleSampleSampleSampleSample
SampleSampleSampleSampleSample
SampleSampleSampleSampleSample
SampleSampleSampleSampleSample
SampleSampleSampleSample
SampleSampleSample
Sample
SampleSampleSampleSample
SampleSampleSample
SampleSample
Sample
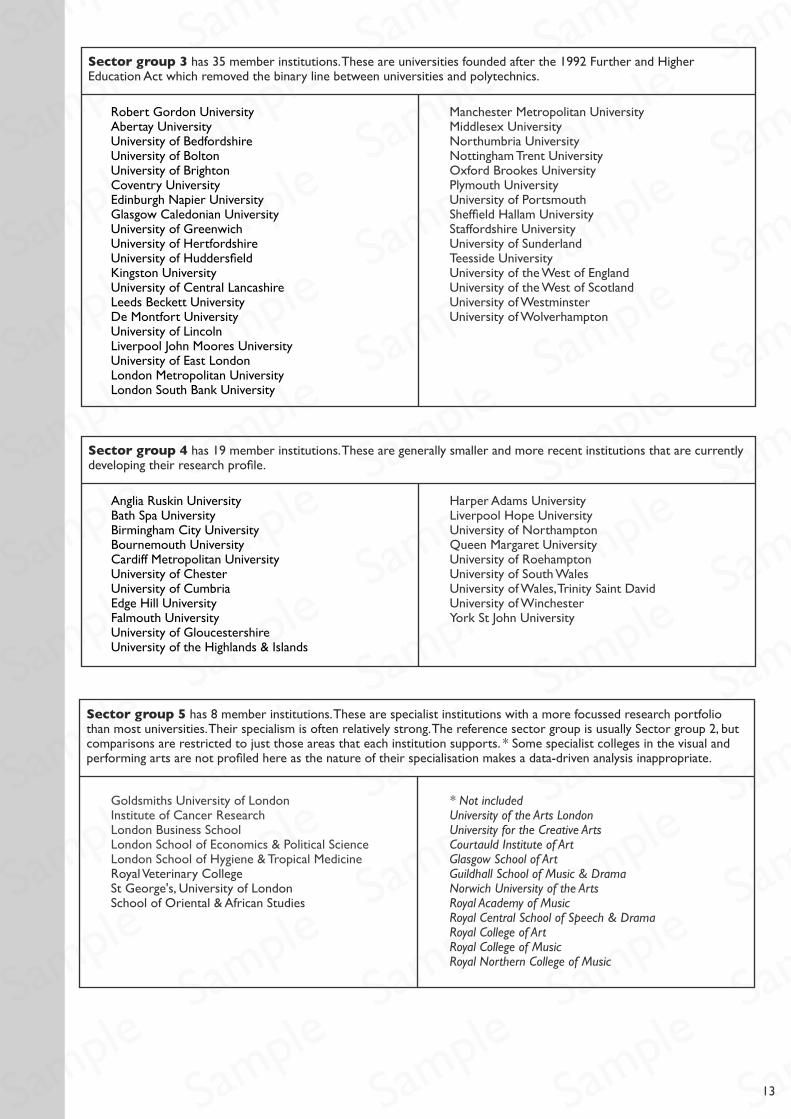
Sector group 3 has 35 member institutions. These are universities founded after the 1992 Further and Higher Education Act which removed the binary line between universities and polytechnics.
Robert Gordon UniversityAbertay UniversityUniversity of BedfordshireUniversity of BoltonUniversity of BrightonCoventry UniversityEdinburgh Napier UniversityGlasgow Caledonian UniversityUniversity of GreenwichUniversity of HertfordshireUniversity of HuddersfieldKingston UniversityUniversity of Central LancashireLeeds Beckett UniversityDe Montfort UniversityUniversity of LincolnLiverpool John Moores UniversityUniversity of East LondonLondon Metropolitan UniversityLondon South Bank University
Manchester Metropolitan UniversityMiddlesex UniversityNorthumbria UniversityNottingham Trent UniversityOxford Brookes UniversityPlymouth UniversityUniversity of PortsmouthSheffield Hallam UniversityStaffordshire UniversityUniversity of SunderlandTeesside UniversityUniversity of the West of EnglandUniversity of the West of ScotlandUniversity of WestminsterUniversity of Wolverhampton
13
Sector group 4 has 19 member institutions. These are generally smaller and more recent institutions that are currently developing their research profile.
Anglia Ruskin UniversityBath Spa UniversityBirmingham City UniversityBournemouth UniversityCardiff Metropolitan UniversityUniversity of ChesterUniversity of CumbriaEdge Hill UniversityFalmouth UniversityUniversity of GloucestershireUniversity of the Highlands & Islands
Harper Adams UniversityLiverpool Hope UniversityUniversity of NorthamptonQueen Margaret UniversityUniversity of RoehamptonUniversity of South WalesUniversity of Wales, Trinity Saint DavidUniversity of WinchesterYork St John University
Sector group 5 has 8 member institutions. These are specialist institutions with a more focussed research portfolio than most universities. Their specialism is often relatively strong. The reference sector group is usually Sector group 2, but comparisons are restricted to just those areas that each institution supports. * Some specialist colleges in the visual and performing arts are not profiled here as the nature of their specialisation makes a data-driven analysis inappropriate.
Goldsmiths University of LondonInstitute of Cancer ResearchLondon Business SchoolLondon School of Economics & Political ScienceLondon School of Hygiene & Tropical MedicineRoyal Veterinary CollegeSt George's, University of LondonSchool of Oriental & African Studies
* Not includedUniversity of the Arts LondonUniversity for the Creative ArtsCourtauld Institute of ArtGlasgow School of ArtGuildhall School of Music & DramaNorwich University of the ArtsRoyal Academy of MusicRoyal Central School of Speech & DramaRoyal College of ArtRoyal College of MusicRoyal Northern College of Music
SampleSampleSampleSampleSample
SampleSampleSampleSampleSample
SampleSampleSampleSampleSample
SampleSampleSampleSampleSample
SampleSampleSampleSampleSample
SampleSampleSampleSampleSample
SampleSampleSampleSampleSample
SampleSampleSampleSampleSample
SampleSampleSampleSample
SampleSampleSample
Sample
SampleSampleSampleSample
SampleSampleSample
SampleSample
Sample

SampleSampleSampleSampleSample
SampleSampleSampleSampleSample
SampleSampleSampleSampleSample
SampleSampleSampleSampleSample
SampleSampleSampleSampleSample
SampleSampleSampleSampleSample
SampleSampleSampleSampleSample
SampleSampleSampleSampleSample
SampleSampleSampleSample
SampleSampleSample
Sample
SampleSampleSampleSample
SampleSampleSample
SampleSample
Sample

15
Institution list
University of AberdeenAbertay UniversityAberystwyth UniversityAnglia Ruskin UniversityAston UniversityBangor UniversityUniversity of BathBath Spa UniversityUniversity of BedfordshireQueen's University BelfastUniversity of BirminghamBirmingham City UniversityUniversity of BoltonBournemouth UniversityUniversity of BradfordUniversity of BrightonUniversity of BristolUniversity of CambridgeCardiff UniversityCardiff Metropolitan UniversityUniversity of Central LancashireUniversity of ChesterCoventry UniversityCranfield UniversityUniversity of CumbriaUniversity of DundeeDurham UniversityUniversity of East AngliaUniversity of East LondonUniversity of EdinburghEdinburgh Napier UniversityQueen Margaret UniversityUniversity of EssexUniversity of ExeterFalmouth UniversityUniversity of GlasgowGlasgow Caledonian UniversityUniversity of GloucestershireUniversity of GreenwichHarper Adams UniversityHeriot-Watt UniversityUniversity of HertfordshireUniversity of the Highlands and IslandsUniversity of HuddersfieldUniversity of HullKeele UniversityUniversity of KentKingston UniversityLancaster UniversityUniversity of LeedsLeeds Beckett UniversityUniversity of LeicesterDe Montfort UniversityUniversity of LincolnUniversity of LiverpoolEdge Hill UniversityLiverpool Hope UniversityLiverpool John Moores University
161820222426283032343638404244464850525456586062646668707274767880828486889092949698
100102104106108110112114116118120122124126128130
Birkbeck, University of LondonBrunel University LondonLondon Business SchoolCity University LondonGoldsmiths University of LondonImperial College LondonInstitute of Cancer ResearchKing's College LondonLondon Metropolitan UniversityQueen Mary University of LondonRoyal Veterinary CollegeRoyal Holloway University of LondonLondon School of Economics and Political ScienceLondon School of Hygiene & Tropical MedicineSchool of Oriental and African StudiesLondon South Bank UniversitySt George's, University of LondonUniversity College LondonLoughborough UniversityUniversity of ManchesterManchester Metropolitan UniversityMiddlesex UniversityNewcastle UniversityUniversity of NorthamptonNorthumbria UniversityUniversity of NottinghamNottingham Trent UniversityOpen UniversityUniversity of OxfordOxford Brookes UniversityPlymouth UniversityUniversity of PortsmouthUniversity of ReadingRobert Gordon UniversityUniversity of RoehamptonUniversity of SalfordUniversity of SheffieldSheffield Hallam UniversityUniversity of South WalesUniversity of SouthamptonUniversity of St AndrewsStaffordshire UniversityUniversity of StirlingUniversity of StrathclydeUniversity of SunderlandUniversity of SurreyUniversity of SussexSwansea UniversityTeesside UniversityUniversity of UlsterUniversity of Wales, Trinity Saint DavidUniversity of WarwickUniversity of the West of EnglandUniversity of the West of ScotlandUniversity of WestminsterUniversity of WinchesterUniversity of WolverhamptonUniversity of York
132134136138140142144146148150152154156158160162164166168170172174176178180182184186188190192194196198200202204206208210212214216218220222224226228230232234236238240242244246
Name Page Name Page
Samples provided in this copy are highlighted
SampleSampleSampleSampleSample
SampleSampleSampleSampleSample
SampleSampleSampleSampleSample
SampleSampleSampleSampleSample
SampleSampleSampleSampleSample
SampleSampleSampleSampleSample
SampleSampleSampleSampleSample
SampleSampleSampleSampleSample
SampleSampleSampleSample
SampleSampleSample
Sample
SampleSampleSampleSample
SampleSampleSample
SampleSample
Sample

grid.7362.0
Sector� 2
Bangor� UniversityBANGOR, Wales LL57 2DG
ProfessorJohnHughes, Vice-Chancellor
ProfessorJoRycroft-Malone, Pro-Vice-Chancellor (Research)
Research� and� Enterprise� OfficeThe support provided by the Research Support Team includes: IdentifyingFunding Opportunities, Managing BU wide funding calls, Pre-Award Supportto Researchers, Researcher Training & Development, Costing and Pricing,Financial Administration of Grants, Contracts & Legal Agreements,Supporting Strategic Initiatives, Delivering Major Programmes (KESS),Research Assessment Exercise, and Supporting Impactful Research.
Research� and� Enterprise� OfficeBangor University is committed to growing entrepreneurial activity amongstits academic community and actively supports such activity by directing itinto the most appropriate domain whether it be the filing, licensing orassignment of a patent; the formation of a Spin-out Company, or theprovision of consultancy services.
DrGarryReid0124 835 1151 Ext:[email protected]
DrGarryReid01248 351151 Ext:[email protected]
Researcher� Indicator� Wheel
Orcid
OAI
Articles
Collab.
PolicyTwitter
News
Funding
Projects
PhDs
Funding� TransectAverageannualresearchincomefor Bangor University equals £15.9M.Itis ranked24thforfundingfromtheEUfor sector 2 institutions. Thelargest grant received isES/G035954/1fromtheESRCfor£3.4M.
RCUK
34.4%
30.13m
UK
8.1%
7.12m
EU
14.3%
12.51m
QR
43.3%
37.94m
0%
10%
20%
30%
40%
50%
60%
70%
80%
Research� Fingerprint175FundedProjects
Bangor University has themostfundedprojectsinModernLanguagesandLinguisticsandaboveaveragefundedprojectsin3UoAsamong sector 2 institutions.
247AcademicStaff
Bangor University has aboveaveragestaffcountin2UoAsamong sector 2 institutions.
486PhD'sAwarded
Bangor University has thesecondmostawardedPhDsin2UoAsandaboveaverageawardedPhDsin3UoAsamong sector 2institutions.
2.94GPA
Bangor University has thesecondhighestscoreinSportandExerciseSciences,LeisureandTourismandaboveaveragescorein6UoAsamong sector 2 institutions.
1 2 3 4 5 6
PanelA
7 8 9 10 11 12 13 14 15
PanelB
16 17 18 19 20 21 22 23 24 25 26
PanelC
27 28 29 30 31 32 33 34 35 36
PanelD
26SampleSampleSampleSampleSample
SampleSampleSampleSampleSample
SampleSampleSampleSampleSample
SampleSampleSampleSampleSample
SampleSampleSampleSampleSample
SampleSampleSampleSampleSample
SampleSampleSampleSampleSample
SampleSampleSampleSampleSample
SampleSampleSampleSample
SampleSampleSample
Sample
SampleSampleSampleSample
SampleSampleSample
SampleSample
Sample

Sector� 2
Bangor� University
Funding� BrainScan
PanelA
PanelBPanelC
PanelD
Bangor University has a concentration of interdisciplinary funding inthe following fields of research:
EnvironmentalScienceandManagement and Ecology
Oceanography and Ecology
Psychology and Linguistics
EnvironmentalScienceandManagement and Genetics
Neurosciences and Psychology
Impact� BrainScan
PanelA
PanelBPanelC
PanelD
Bangor University has a concentration of interdisciplinary impact inthe following fields of research:
Econometrics and Banking,FinanceandInvestment
AppliedEconomics and Banking,FinanceandInvestment
EnvironmentalScienceandManagement and Ecology
PublicHealthandHealthServices and AppliedEconomics
CurriculumandPedagogy and Linguistics
27SampleSampleSampleSampleSample
SampleSampleSampleSampleSample
SampleSampleSampleSampleSample
SampleSampleSampleSampleSample
SampleSampleSampleSampleSample
SampleSampleSampleSampleSample
SampleSampleSampleSampleSample
SampleSampleSampleSampleSample
SampleSampleSampleSample
SampleSampleSample
Sample
SampleSampleSampleSample
SampleSampleSample
SampleSample
Sample

grid.5335.0
Sector� 1
University� of� CambridgeThe Old Schools, Trinity Lane, CAMBRIDGE, England CB2 1TN
ProfessorSirLeszekBorysiewicz, Vice-Chancellor
ProfessorChrisAbell, Pro-Vice-Chancellor (Research)
Research� Operations� OfficeThe Research Operations Office (ROO) is the University’s official signatoryfor research grants and contracts, with formally delegated authority tosubmit applications, accept research grants and negotiate appropriate termsand conditions. Managing research projects includes monitoringexpenditure, preparing statements and financial reports for the diversesponsor requirements, and reconciling and closing the grant at the end ofthe project.
Cambridge� EnterpriseCambridge Enterprise helps academics achieve the impact central tosecuring long-term funding for research. Success is measured in the successof our University partners as they bring their work to market, be it ground-breaking stem cell research, critical suspension technology used in Formula1 racing, or a flower seed mix to enable bees to flourish and crops grow.We create a legacy that benefits not just the University and the UK, buteveryone.
PeterHedges0122 333 [email protected]
DrTonyRaven0122 374 [email protected]
Researcher� Indicator� Wheel
Orcid
OAI
Articles
Collab.
Policy
News
Funding
Projects
PhDs
Funding� TransectAverageannualresearchincomefor the University of Cambridge equals£358.2M.It is ranked1stforfundingfromtheEUfor sector 1institutions. The largest grant received is200720fromtheEuropeanCommissionfor£10.2M.
RCUK
37.4%
759.73m
UK
20.1%
407.83m
EU
13.6%
277.47m
QR
28.5%
579.54m
0%
5%
10%
15%
20%
25%
30%
35%
40%
45%
50%
55%
Research� Fingerprint2567FundedProjects
The University of Cambridge has themostfundedprojectsin4UoAsandthesecondmostfundedprojectsin7UoAsamong sector1 institutions.
2196AcademicStaff
The University of Cambridge has themoststaffinPhysicsandthesecondmoststaffin11UoAsamong sector 1 institutions.
5184PhD'sAwarded
The University of Cambridge has themostawardedPhDsin5UoAsandthesecondmostawardedPhDsin6UoAsamong sector 1institutions.
3.29GPA
The University of Cambridge has thehighestscorein5UoAsandthesecondhighestscorein6UoAsamong sector 1 institutions.
1 2 3 4 5 6
PanelA
7 8 9 10 11 12 13 14 15
PanelB
16 17 18 19 20 21 22 23 24 25 26
PanelC
27 28 29 30 31 32 33 34 35 36
PanelD
50SampleSampleSampleSampleSample
SampleSampleSampleSampleSample
SampleSampleSampleSampleSample
SampleSampleSampleSampleSample
SampleSampleSampleSampleSample
SampleSampleSampleSampleSample
SampleSampleSampleSampleSample
SampleSampleSampleSampleSample
SampleSampleSampleSample
SampleSampleSample
Sample
SampleSampleSampleSample
SampleSampleSample
SampleSample
Sample
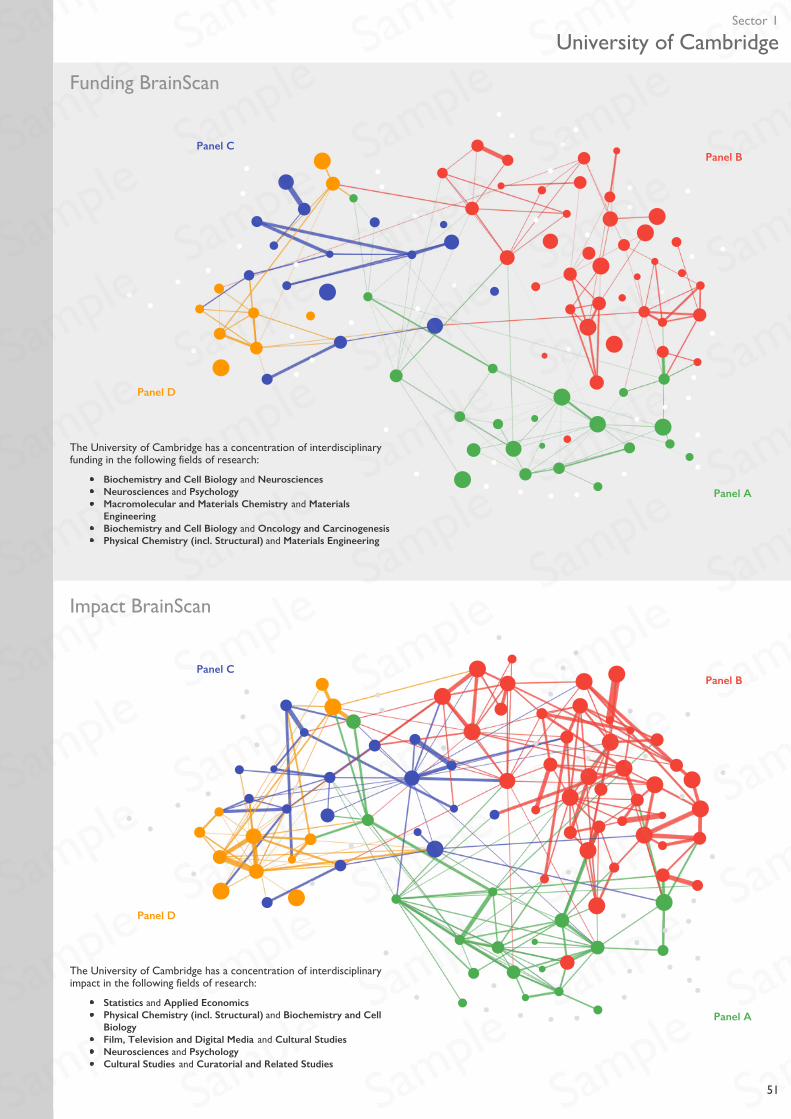
Sector� 1
University� of� Cambridge
Funding� BrainScan
PanelA
PanelBPanelC
PanelD
The University of Cambridge has a concentration of interdisciplinaryfunding in the following fields of research:
BiochemistryandCellBiology and Neurosciences
Neurosciences and Psychology
MacromolecularandMaterialsChemistry and Materials
Engineering
BiochemistryandCellBiology and OncologyandCarcinogenesis
PhysicalChemistry(incl.Structural) and MaterialsEngineering
Impact� BrainScan
PanelA
PanelBPanelC
PanelD
The University of Cambridge has a concentration of interdisciplinaryimpact in the following fields of research:
Statistics and AppliedEconomics
PhysicalChemistry(incl.Structural) and BiochemistryandCell
Biology
Film,TelevisionandDigitalMedia and CulturalStudies
Neurosciences and Psychology
CulturalStudies and CuratorialandRelatedStudies
51SampleSampleSampleSampleSample
SampleSampleSampleSampleSample
SampleSampleSampleSampleSample
SampleSampleSampleSampleSample
SampleSampleSampleSampleSample
SampleSampleSampleSampleSample
SampleSampleSampleSampleSample
SampleSampleSampleSampleSample
SampleSampleSampleSample
SampleSampleSample
Sample
SampleSampleSampleSample
SampleSampleSample
SampleSample
Sample

grid.20409.3f
Sector� 3
Edinburgh� Napier� University219 Colington Road, EDINBURGH, Scotland EH14 1DJ
ProfessorAndreaNolan, Principal and Vice-Chancellor
ProfessorJessieKennedy, Dean (Research and Innovation)
Research� and� InnovationAs an Edinburgh Napier University research student you will have adedicated team of supervisors with research expertise in your field. Yoursupervisors will meet with you on a regular basis to help guide yourresearch project. To complement this supervision you will meet with yoursupervisory panel at least twice a year for a formal review of your progress,to make sure you're on track and give you further support.
Research� and� InnovationWith nearly 1,000 academics working at Edinburgh Napier University, wehave the expertise to understand your requirements and develop solutions,regardless of your field. Just get in touch and we can bring together a teamof experts to work on your problem.
[email protected] [email protected]
Researcher� Indicator� Wheel
Orcid
OAI
Articles
Collab.
Policy
News
Funding
Projects
PhDs
Funding� TransectAverageannualresearchincomefor Edinburgh Napier University equals£4.8M.It is ranked9thforfundingfromtheEUfor sector 3 institutions.The largest grant received is233846fromtheEuropeanCommissionfor£1.3M.
RCUK
9.3%
2.38m
UK
1.7%
433.71k
EU
30.0%
7.69m
QR
59.0%
15.11m
0%
10%
20%
30%
40%
50%
60%
70%
80%
90%
100%
Research� Fingerprint35FundedProjects
Edinburgh Napier University has themostfundedprojectsinCivilandConstructionEngineeringandaboveaveragefundedprojectsin5UoAsamong sector 3 institutions.
108AcademicStaff
Edinburgh Napier University has themoststaffinCivilandConstructionEngineeringandaboveaveragestaffcountin4UoAsamongsector 3 institutions.
168PhD'sAwarded
Edinburgh Napier University has themostawardedPhDsinCivilandConstructionEngineeringandaboveaverageawardedPhDsin7UoAsamong sector 3 institutions.
2.54GPA
Edinburgh Napier University has thehighestscoreinCivilandConstructionEngineeringandaboveaveragescorein10UoAsamongsector 3 institutions.
1 2 3 4 5 6
PanelA
7 8 9 10 11 12 13 14 15
PanelB
16 17 18 19 20 21 22 23 24 25 26
PanelC
27 28 29 30 31 32 33 34 35 36
PanelD
76SampleSampleSampleSampleSample
SampleSampleSampleSampleSample
SampleSampleSampleSampleSample
SampleSampleSampleSampleSample
SampleSampleSampleSampleSample
SampleSampleSampleSampleSample
SampleSampleSampleSampleSample
SampleSampleSampleSampleSample
SampleSampleSampleSample
SampleSampleSample
Sample
SampleSampleSampleSample
SampleSampleSample
SampleSample
Sample

Sector� 3
Edinburgh� Napier� University
Funding� BrainScan
PanelA
PanelBPanelC
PanelD
Edinburgh Napier University has a concentration of interdisciplinaryfunding in the following fields of research:
EnvironmentalScienceandManagement and Ecology
Impact� BrainScan
PanelA
PanelBPanelC
PanelD
Edinburgh Napier University has a concentration of interdisciplinaryimpact in the following fields of research:
EnvironmentalScienceandManagement and Ecology
PublicHealthandHealthServices and Psychology
PolicyandAdministration and LiteraryStudies
Statistics and InformationSystems
CivilEngineering and EngineeringDesign
77SampleSampleSampleSampleSample
SampleSampleSampleSampleSample
SampleSampleSampleSampleSample
SampleSampleSampleSampleSample
SampleSampleSampleSampleSample
SampleSampleSampleSampleSample
SampleSampleSampleSampleSample
SampleSampleSampleSampleSample
SampleSampleSampleSample
SampleSampleSample
Sample
SampleSampleSampleSample
SampleSampleSample
SampleSample
Sample

grid.8391.3
Sector� 2
University� of� ExeterMail Room The Old Library, Prince of Wales Road, EXETER, England EX4 4SB
ProfessorSirSteveSmith, Vice-Chancellor and Chief Executive
ProfessorNicholasJTalbot, Deputy Vice-Chancellor (Research and Impact)
Research� ServicesWe provide professional support for researchers in a number of areasincluding: funding support, bid development, networks and events, andmore. We also manage the University's research strategy - it is our job tohelp you make an impact.
Research� and� Knowledge� TransferResearch & Knowledge Transfer supports IP and Commercialisationinterests across the University. Intellectual Property (IP) is mainly in theform of patents, copyright, and trademarks, and is an important asset forthe University, underpinning the value of many of the University’stransactions with external organisations.
DrAndyRichards0139 272 [email protected]
DrNeilHayes0139 272 [email protected]
Researcher� Indicator� Wheel
Orcid
OAI
Articles
Collab.
PolicyTwitter
News
Funding
Projects
PhDs
Funding� TransectAverageannualresearchincomefor the University of Exeter equals£58.9M.It is ranked2ndforfundingfromtheEUfor sector 2institutions. The largest grant received is603864fromtheEuropeanCommissionfor£6.8M.
RCUK
43.2%
144.94m
UK
11.6%
38.89m
EU
18.6%
62.38m
QR
26.6%
89.18m
0%
10%
20%
30%
40%
50%
60%
70%
80%
Research� Fingerprint745FundedProjects
The University of Exeter has themostfundedprojectsin6UoAsandthesecondmostfundedprojectsin7UoAsamong sector 2institutions.
766AcademicStaff
The University of Exeter has themoststaffin2UoAsandthesecondmoststaffin2UoAsamong sector 2 institutions.
1401PhD'sAwarded
The University of Exeter has themostawardedPhDsin4UoAsandthesecondmostawardedPhDsin2UoAsamong sector 2institutions.
3.08GPA
The University of Exeter has thehighestscoreinAreaStudiesandthesecondhighestscorein2UoAsamong sector 2 institutions.
1 2 3 4 5 6
PanelA
7 8 9 10 11 12 13 14 15
PanelB
16 17 18 19 20 21 22 23 24 25 26
PanelC
27 28 29 30 31 32 33 34 35 36
PanelD
82SampleSampleSampleSampleSample
SampleSampleSampleSampleSample
SampleSampleSampleSampleSample
SampleSampleSampleSampleSample
SampleSampleSampleSampleSample
SampleSampleSampleSampleSample
SampleSampleSampleSampleSample
SampleSampleSampleSampleSample
SampleSampleSampleSample
SampleSampleSample
Sample
SampleSampleSampleSample
SampleSampleSample
SampleSample
Sample
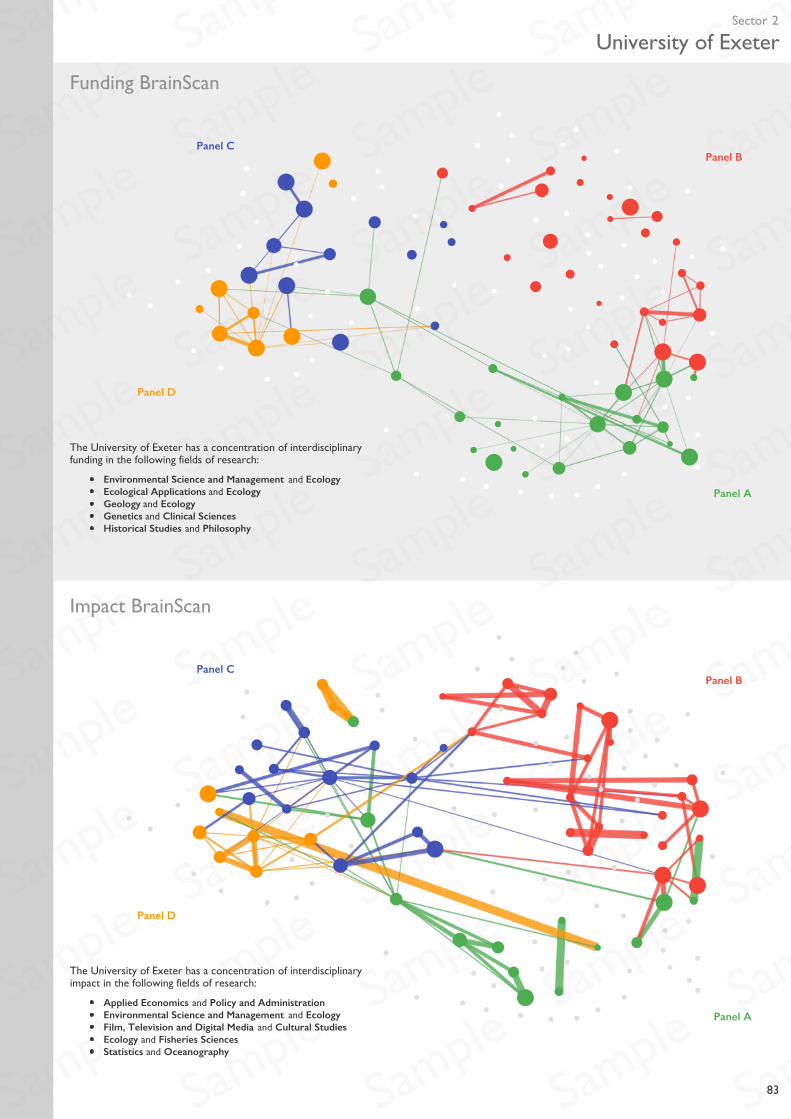
Sector� 2
University� of� Exeter
Funding� BrainScan
PanelA
PanelBPanelC
PanelD
The University of Exeter has a concentration of interdisciplinaryfunding in the following fields of research:
EnvironmentalScienceandManagement and Ecology
EcologicalApplications and Ecology
Geology and Ecology
Genetics and ClinicalSciences
HistoricalStudies and Philosophy
Impact� BrainScan
PanelA
PanelBPanelC
PanelD
The University of Exeter has a concentration of interdisciplinaryimpact in the following fields of research:
AppliedEconomics and PolicyandAdministration
EnvironmentalScienceandManagement and Ecology
Film,TelevisionandDigitalMedia and CulturalStudies
Ecology and FisheriesSciences
Statistics and Oceanography
83SampleSampleSampleSampleSample
SampleSampleSampleSampleSample
SampleSampleSampleSampleSample
SampleSampleSampleSampleSample
SampleSampleSampleSampleSample
SampleSampleSampleSampleSample
SampleSampleSampleSampleSample
SampleSampleSampleSampleSample
SampleSampleSampleSample
SampleSampleSample
Sample
SampleSampleSampleSample
SampleSampleSample
SampleSample
Sample
Sample
Sample
Sample
Sample
Sample
Sample
Sample
Sample
Sample
Sample
Sample
Sample
Sample
Sample
Sample
Sample
Sample
Sample
Sample
Sample
Sample
Sample
Sample
Sample
Sample
Sample
Sample
Sample
Sample
Sample
Sample
Sample
Sample
Sample
Sample
Sample
Sample
Sample
Sample
Sample
Sample
Sample
Sample
Sample
Sample
Sample
Sample
Sample
Sample
Sample
Sample
Sample
Sample
Sample
Sample
Work smart. Discover more.Part of the Digital Science family
To order a copy of the Yearbook, visit www.digital-science.com/yearbook